
Evaluation and Spatial Variability of Cryogenic Soil Properties (Yamal-Nenets Autonomous District, Russia)


1
Department of Applied Ecology, Faculty of Biology, St. Petersburg State University, 199034 Saint Petersburg, Russia
2
Department of Environmental Protection and Prudent Exploitation of Natural Resources, Ufa State Petroleum Technological University, 450064 Ufa, Russia
3
Environmental Protection Sector, Arctic Research Center of the Yamal-Nenets Autonomous District, 629008 Salekhard, Russia
*
Author to whom correspondence should be addressed.
Soil Syst. 2022, 6(3), 65; https://doi.org/10.3390/soilsystems6030065
Submission received: 2 July 2022
/
Revised: 26 July 2022
/
Accepted: 31 July 2022
/
Published: 4 August 2022
(This article belongs to the Special Issue Contemporary Applications of Geostatistics to Soil Studies)
Abstract
:Agricultural development in northern polar areas has potential as a result of global warming. Such expansion requires modern soil surveys and large-scale maps. In this study, the abandoned arable experimental field founded by I.G. Eichfeld one century ago in Salekhard city (Russian Arctic), located in the polar circle, was investigated. Our aims were to assess the nutritional soil properties and their spatial variability. For spatial assessment and mapping, ordinary kriging (OK) and inverse distance-weighted (IDW) methods were employed. We found that due to long-term agriculture use, the soil cover was represented by a unique Plaggic Podzol (Turbic) that is not typical of the region. The soil was characterized by relatively low soil organic carbon (SOC) content, high acidity and a high content of plant-available forms of phosphorus in the humus-accumulative horizon. The results showed that some properties (pH H2O, pH CaCl2) were characterized by large-scale heterogeneity and showed clear spatial dependence. However, some properties (ammonium and nitrate nitrogen, basal respiration) showed a pure-nugget effect, presumably due to experimentation with fertilizer over a long period of time.
1. Introduction
Agriculture is the most sensitive to climate change among all sectors of the economy. Numerous global climate change reports indicate that the rate of warming in Arctic regions is accelerating [1,2,3]. Despite the many negative consequences for agro-ecosystems (diseases, insect pests, carbon emissions, erosion, etc.), warming in the northern regions can have advantages [4]. These benefits include an expansion of arable land and an increase in crop diversity and yields [5]. For example, farming practices have been carried out for centuries in the circumpolar areas of Russia [6,7,8], as well as in other Nordic countries [9].
Nowadays the majority of agricultural soils are in an abandoned, fallow state due to the winding down of agricultural practices in the 1990s. Only small areas of arable soil were cultivated without interruption in the Arctic zone in the post-Soviet period. Numerous experimental fields were founded according to Vavilov’s idea of polar agriculture in the first part of the 20th century [10]. One of them is the experimental field of the Yamal monitoring station (Figure 1). Arable land began to be cultivated in 1932 as an experimental site to study the adaptation of different types of crops to the conditions of the Far North [11]. Here, Soviet scientists were engaged in the development of new frost-resistant varieties of cereals, vegetables and forage crops, and the creation of local agro-technical measures. During the initial development, the adverse effects on yields of factors such as slow soil thawing, high moisture in the spring period, high soil acidity, early frost and the irregular distribution of precipitation during the growing season were noted. In this context, the first plantings were followed by the application of fertilizers: manure, mulch, potassium and phosphate fertilizers, and ash. In the last 100 years, the cultivated area decreased 10-fold [11]. The field of the experimental station worked in this way until the collapse of the USSR (potatoes, cabbage, turnips, beets, peas and other crops were grown) and after it was practically abandoned until 2010. At present, the field has not been cultivated since 2019, although back in 2017 and 2018, potatoes were grown there (yields up to 12 t/ha) [11,12].
In recent years, Russia has implemented many global projects to foster new development of the Arctic territories [13]. The expansion of farming in the Arctic areas may become more necessary in the future due to the increasing population and depleting soil resources in the southern regions. The successful management and use of arable land require the study of soil properties and their spatial distribution [14]. Thus, up-to-date large-scale soil-property maps are also required. The process of creating large-scale soil maps requires field sampling work, while medium- and small-scale maps can be created via cartographic generalization of larger-scale maps.
In the USSR, large-scale soil mapping began to actively develop in the first half of the 20th century. This was necessary to account for and value agricultural land and for the rapid recovery of the economy and agriculture [15]. Almost all agricultural land in the USSR was covered by a network of large-scale soil maps. These cartographic works were completed using the traditional soil-cartography method based on the idea of V.V. Dokuchaev—formed at the turn of the 19th–20th centuries—which stated that under certain conditions of soil formation factors in a particular area, only a certain soil could form [16]. This approach has formed the basis of soil mapping around the world [17]. After the collapse of the Soviet Union, the economy and agriculture deteriorated, and this also affected soil mapping [18]. Nowadays, digital large-scale mapping of the soil properties of arable land in Russia is predominantly carried out at more southern latitudes [19,20,21,22,23,24].
Under climate change, Siberian territories have become the potential food basket of Eurasia. Thus, the soils of many cryolithozone regions will be involved or reinvolved in agriculture. That is why the investigation of the quality of arable soils of the cryolithozone should be intensified in terms of ecosystem services of agricultural ecosystems. The aims of this study are the following: 1. To evaluate the soil agrochemical properties of an arable plot located in Salekhard city (Yamalo-Nenets Autonomous District, Russia), and 2. to estimate the spatial variability of soil properties using geostatistical methods and create digital maps.
2. Materials and Methods
2.1. Study Site Description
The study area is an abandoned arable field of the Yamal Agricultural Experimental Station and is located within the city of Salekhard (Yamal-Nenets Autonomous District) (Figure 1). The district occupies the Arctic, subarctic and temperate climate zones. Salekhard city and the study area are located on the border between subarctic and temperate climates, and are characterized as “cold continental” (Dfc) by the Köppen climate classification [25]. The climate is characterized by short summers and very harsh, long winters with polar nights. The average January temperature is −23.2 °C; the average July temperature is +14.8 °C. The average annual precipitation ranges from 450 to 500 mm, most of which falls in July and August. The number of days with snow cover and persistent frost is up to 200 per year.
The area is characterized by naturally leveled topography with an elevation range of 8–14 m above sea level. No erosion processes have been observed. The parent materials of the region are modern alluvial and lake alluvial Quaternary sediments of loamy and sandy loam composition [26], while that of the study plot is alluvial middle-Holocene sands. Pristine soils in the vicinity of Salekhard city are mainly represented by reference groups of Histic Cryosols, Histic Gleysols and Podzols (without the thick organic horizon) [27,28]. Today, the abandoned field that represents the research object contains motley-grass vegetation cover of Artemisia tilesii Ledeb, Poaceae, Calamagróstis epigéjos, Campanula rotundifolia L., Chamaenérion angustifolium, Crepis nigrescens Pohle, Deschampsia cespitosa, Elytrígia répens, Mathricaria hookeri (Sch. Bip.), Ranunculaceae Juss, Stellāria gramīnea, Taráxacum officinále, Vícia crácca, etc.
2.2. Soil Samples and Analyses
The soil sampling and assessment work were carried out under dry conditions in August 2021. One full soil profile pit was excavated. Soil samples were collected in two replicates from each soil genetic horizon, whereas the Ap horizon was divided into 3 parts and samples were taken every 10 cm. For the geostatistical analyses, the soil sampling work was conducted via a stratified simple random-sampling scheme. Most of the studies on digital soil mapping approaches predict soil property from a single topsoil depth (0–30, or various intervals from 0 to 30 cm) [29]. Considering the surface layer as the most vulnerable to change, we estimated the spatial variability of soil properties for a depth of 0–10 cm. A total of 75 soil samples for the analysis were collected from the surface layer (Figure 1). The exact coordinates of each soil point were identified using a global positioning system (GPS) with an accuracy of ±0.5 m.
All collected samples were air-dried, homogenized and sieved. The chemical analyses were carried out using standard laboratory methods [30,31,32,33]. Values of pH in water and salt suspension were measured using pH −150 m (1:2.5 soil:solution ratio). SOC content was determined via a wet-combustion method (Walkley–Black method). The content of available forms of ammonium (N-NH4) and nitrate nitrogen (N-NO3) were determined using a potassium chloride solution. The content of mobile available phosphorus (P2O5) and potassium (K2O) was determined using the Kirsanov method. Soil basal respiration is defined as the steady rate of respiration in soil, which originates from the mineralization of organic matter. Basal respiration was evaluated by measuring CO2 in a sodium hydroxide 0.1 molar solution. The incubation of CO2 was conducted for 10 days in plastic sealed containers, according to the standard protocol [34,35].
2.3. Spatial Assessment and Digital Mapping
The ordinary kriging (OK) method was used to determine the spatial variability of soil properties on the study plot. The basic OK approach is to predict values in the nonsampled points from a weighted average of the observed points [36]. We selected a spherical variogram to fit the models. The formula for OK is defined as:
where Z(x0) is the predicted value at the nonsampled location x0; Z(xi) is the observed value at location xi; and wi is the weight.
To verify the spatial distribution based on the OK approach, we created maps using the inverse distance-weighting (IDW) method. The IDW is one of the most widely used tools for interpolating various values, including soil properties [37]. The formula for IDW is defined as:
where Z(x0) is the predicted value at the nonsampled location x0; xi is the ith data value; hij is the separation distance between the interpolated values; and β indicates the weighting power.
For the assessment of the spatial correlations between the study properties, we used the nugget/sill ratio (C0/(C0 + C1)). A ratio ≤ 25% indicates that the variable has strong spatial correlation; 25–75% indicates a moderate spatial correlation; and a ratio ≥ 75% indicates a weak spatial correlation [38]. Additionally, we applied a cross-validation procedure for evaluating the performance of the OK approach. The root-mean-square error (RMSE) was used to validate the spatial-prediction accuracy. The RMSE is defined as:
where Oi and Pi are the observed and predicted values of the soil properties, and n is the number of samples.
3. Results and Discussion
The long-term agricultural use of this site has resulted in the formation of a unique soil profile (Figure 2), radically different from the typical soils of the region [41]. Over nearly a century of agro-industrial activities has formed a thick (up to 30 cm), brown, light loamy, root-penetrated humus-accumulative (Ap) horizon. The organomineral horizon is underlain by a massive (45 cm) illuvial-iron, sandy loam, gleyic with placic-horizon layers (Bs). Further, the soil texture changes to sandy and unstructured with placic-horizon layers (BCg and Cg@ (Turbic)) with reductimorphic colors and spots and features of cryoturbation. Based on the morphological description, the soil cover of the plot is represented by Plaggic Podzol (Turbic) according to the IUSS Working Group WRB classification [42]. It should be noted that an active permafrost layer on this plot was already detected at a depth of 160 cm in previous studies [43]. Nevertheless, in our field studies, a permafrost upper boundary was not detected at a depth of 230 cm, even though studies were conducted in the same periods of the year (August).
The vertical distribution of Plaggic Podzol (Turbic) soil properties is shown in Figure 3. The pH values over the soil profile on the field of the Yamal agricultural station are distributed heterogeneously. The lowest acidity values are detected in the humus-accumulative horizon (Ap). Below, in the Bg and BCg horizons and parent material, the pH H2O is close to 7. The distribution of the organic-matter content in the soil profile is quite inhomogeneous. The highest content is in the top 30 cm of the soil profile (horizon Ap), where the quantity of soil organic matter reaches 2%. A reduced concentration occurs in the mineral horizons Bs-Cg@, but it should be noted that the processes of removing organic matter down the profile occurs, as highlighted by the morphological features and by the results of chemical analysis (Figure 3). The main stock of soil organic matter is concentrated in the Ap horizon (6911 g/m2) against 825 g/m2 in the mineral horizons. The percentage distribution of humus stocks is 89% in the 0–30 cm layer and 11% in the 30–200 cm layer.
The content of key nutrients is one of the main factors reflecting the fertility of soils. The concentration of available phosphorus, exchangeable potassium and mineral forms of nitrogen is especially important to know for the humus-accumulative (arable) horizon, as it is the main plant-feeding and root-containing horizon [44,45]. The soil is characterized by high acidity, and at the same time, in the humus-accumulative horizon Ap, we observe an extremely high content (Figure 3) of plant-available forms of phosphorus (>400 mg/kg) according to the classification [46].
The processes of nutrient migration are also related to the particle size distribution of soils [47]. In our study, the humus-accumulative horizon Ap and the underlying mineral horizons are fundamentally different in this parameter (from sandy loam to sand). This reflects in the vertical distribution of potassium, which gradually increases down the Ap horizon; then, its concentration decreases sharply at the transition to the mineral horizons. The study of denitrification–ammonification processes is especially relevant in polar regions in the context of climate change. The maximum content of N–NO3 (the end-product of the nitrification of nitrogen) is in the upper 10 cm of the soil profile, which, during the growing season, is maximally heated and dried out. The maximum content of NNH4 and N–NO3 is in the organomineral humus-accumulative Ap horizon. According to the content of nitrogen at different depths of the Ap horizon, we can conclude that the nitrification processes proceed differently. As shown in Figure 3, the content of N-NH4 is higher at depths below 10 cm, and the reverse is the case for N–NO3; this may be due to both the depth of penetration of the root systems of plants and the features of aeration.
The agriculture development of the Arctic soils leads to a significant transformation of the soil profile. The pristine soil cover of the Yamalo-Nenets Autonomous District is characterized by strong acidity (pH H2O < 5) caused by the course of podzolization processes [28,48]. Previously, it was also found that abandoned agricultural soils are highly acidic, despite the implementation of melioration measures (the application of ash to the soil) to reduce the soil acidity that occurred in the past [43,48].
According to previous studies, the native soils of adjacent areas are characterized by higher SOC values compared to the studied soils [41,43]. Soils under natural vegetation have a surface layer (O) up to 10–15 cm thick, formed by decomposed organic residues, with SOC content up to 15%; this disappeared as a result of plowing, but in the underlying horizons, the SOC content is comparable.
Native northern soils are not high in nutrients [49]. The concentrations of nutrients (P2O5, K2O and N–NH4) in the study plot are higher than in the background soils. It was previously shown that the content of available phosphorus and exchangeable potassium between abandoned agricultural soils and the background soils of the region can be increased up to 10-fold [50]. However, the degradation of soil fertility in polar ecosystems has not been studied enough, although it has long been proven that the content of available phosphorus closely correlates with soil acidity and the types of fertilizers used [47]. The above-described differences between abandoned and virgin soils can be explained by anthropogenic factors, including fertilizer application.
The general statistics of soil properties (mean, minimum, maximum, standard deviation (SD), coefficient of variation (CV) and median) based on 75 samples at a 0–10 cm depth for geostatistical modeling are shown in Table 1. The studied soil samples have low-to-medium SOC content, and according to pH, the H2O values are characterized as moderately- to slightly-acidic reactions. The values of basal respiration range from 14.62 to 30.93 mg CO2/100 g/day. The content of available phosphorus (P2O5) in the soil ranges from 165 to 1268 mg/kg, which also characterizes the plant availability of phosphorus as high-to-very high.
The parameters of the models and their evaluation using the nugget/sill ratio and RMSE values are presented in Table 2. The spherical model was applied for describing the variograms of the studied agrochemical properties. The spatial correlation of the study properties is different. Strong spatial dependence is revealed for pH values and phosphorus, with their nugget/sill ratios varying from 5 to 9%.
The study and spatial modeling of SOC content have received particular attention as key indicators of soil fertility. In our study, the nugget/sill ratio of SOC and K2O is characterized as moderate (61 and 26%, respectively). Despite the moderate spatial correlation of SOC content, it is close to a weak correlation. The SOC model using the OK approach is also characterized by a relatively high RMSE value. Various studies have reported better results for spatial modeling of SOC and humus content in croplands using the kriging approach [24,51,52,53], remote-sensing data [54,55] and morphometric parameters of topography calculated using a digital elevation model [20,23].
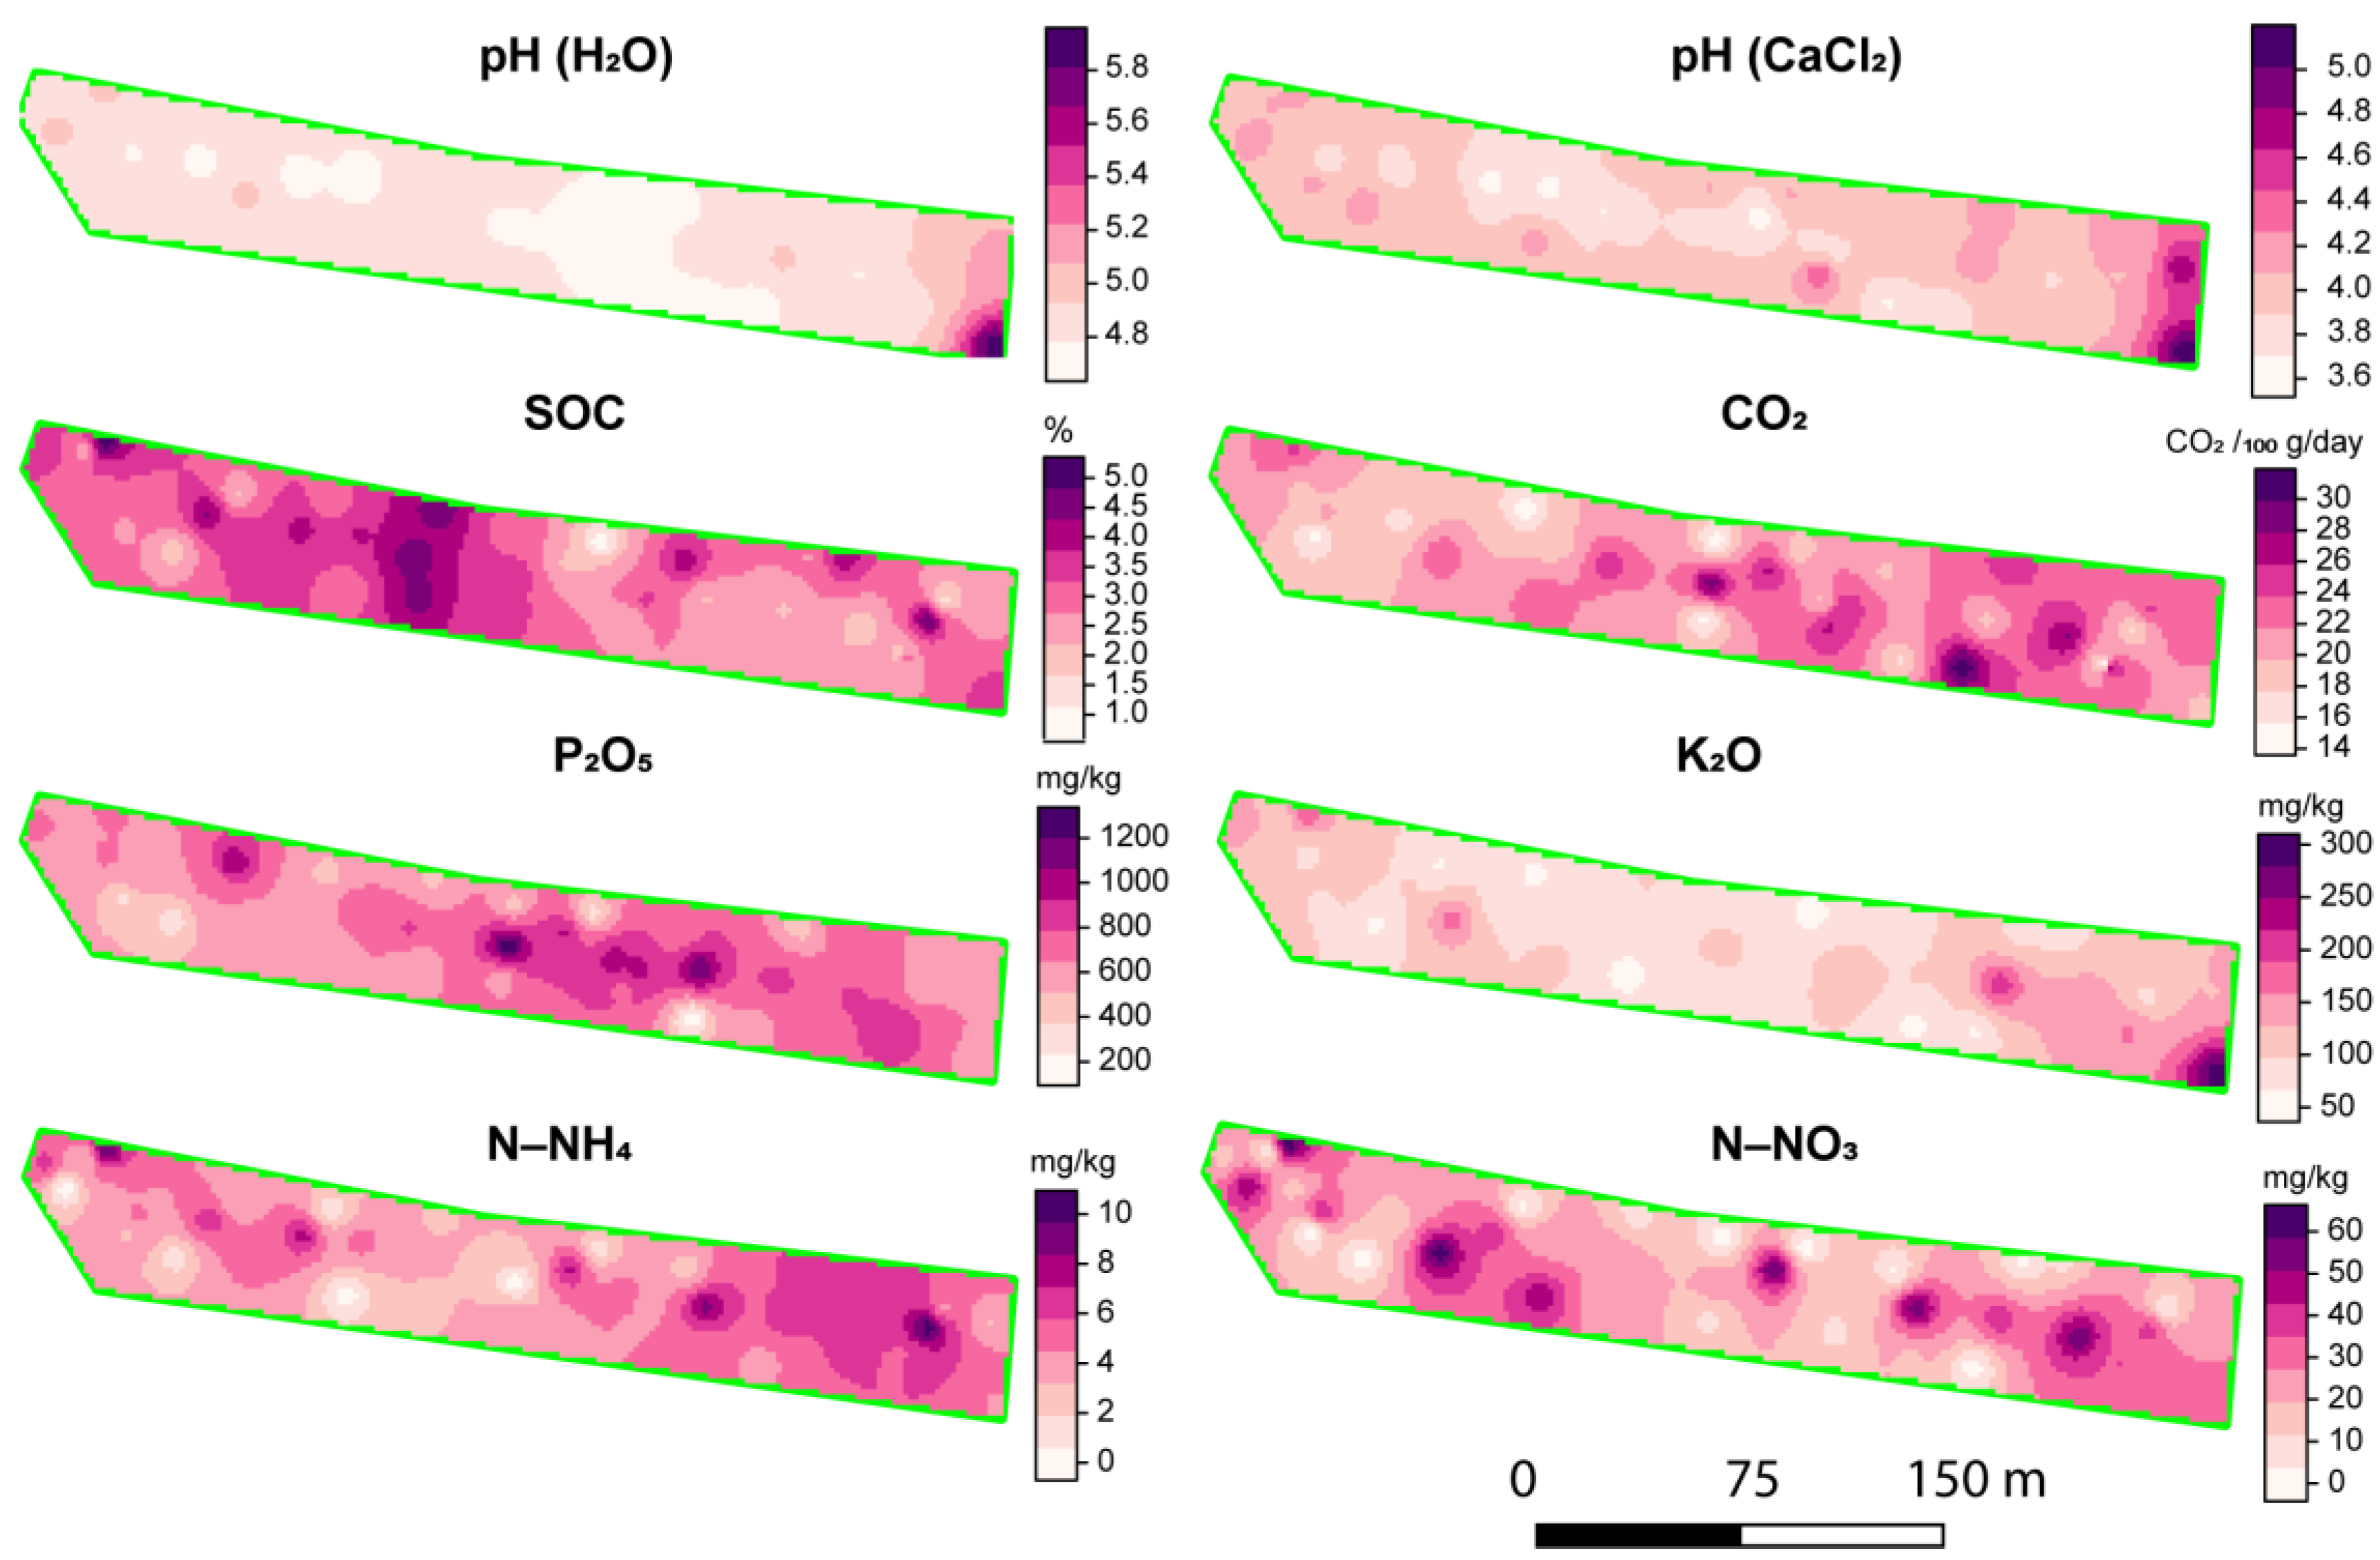
An assessment of the spatial variation in agrochemical soil properties using the OK method is shown in Figure 4. We do not illustrate CO2, N–NO3 and N–NH4 variability maps due to the nugget effect, as they suggest that the variation is not spatially structured, and they are not informative. Maps of the spatial distribution of soil acidity and K2O are characterized by relatively large-scale heterogeneity and clear spatial dependence. Areas showing a particular property value are few and smoothly continuous.
The spatial distribution of properties using the IDW approach is show in Figure 5. We observe a slightly different spatial mapping of some properties in comparison to OK. This is a characteristic of the pure-nugget model when using the kriging method. Although the spatial variability of CO2, N–NO3 and N–NH4 is random, the IDW maps allow for a clearer assessment of very short-scale heterogeneity compared to OK.
The spatial-prediction accuracy according to the RMSE parameter for almost all the properties is slightly higher for OK in comparison to the IDW method, while the prediction results of the pH values are similar (Table 2). Qiao [56] reported similar results for estimating the spatial distribution of arsenic content in Beijing soils. In this work, the results of cross-validation using the OK and IDW methods were almost the same. The authors concluded that the OK method is more subjective and requires more soil samples. Similarly, there were no significant differences in the accuracy of similar models for the spatial prediction of the physical and chemical properties of soils at a site in Iran [57]. However, the accuracy the phosphorus OK model is markedly superior to the IDW model, which necessitates the verification of these approaches for future research and mapping.
Such different features of the spatial distribution of soil elements, especially at a short distance, are important for the implementation of precision-farming systems. The degree of heterogeneity of the mapped soil properties within the same field can be influenced by various factors. Usually, a strong spatial correlation of soil properties may be due to internal factors, while a weak correlation is due to external (anthropogenic) factors [36,38,58]. The variability of properties in arable areas also depends on the factors of soil formation (microtopography), erosion processes, plowing duration, fertilizer and irrigation systems [52,59,60,61]. Since the site is not subject to degradation processes and no irrigation measures have been carried out on it, we exclude these factors as leading to the variability. The inhomogeneity of properties can also be explained by the presence of variability on a smaller scale (smaller than the distance between measurements), measurement error and an incorrect choice of point locations [62].
At our experimental site, we primarily relate the absence of spatial correlation to a large number of different fertilization and crop-cultivation experiments in previous years (Table A1). During this period, the field was divided into separate micro-parts, where fertilizers at different doses were applied annually, crops were grown under different precursors, and harrowing and plowing at different depths were carried out. A recent study [63] also links the history of previous agricultural practices (plot division, nutrient-application rates, crop rotations) to poor predictions of soil properties.
Among the studied properties, the highest coefficients of variation were determined for SOC and nutrients (Table 1), where N–NH4 and N–NO3 have the highest values (54.16 and 82.62%, respectively). Alternating organic- and mineral-fertilizer applications in recent years of experimentation still determine increased nutrient content (Table A1). Previous studies of abandoned lands in this region have also shown that the nutrient content can remain high, even after 20 years [12]. Thus, we assume that the content and spatial distribution of some nutrients is still chaotic due to the fragmented application of different fertilizers. Such features must be taken into account in the further management of arable land and nutrient application. Since northern soils are less involved in agriculture and the warming climate provides an opportunity to expand arable land in this region, more research is needed regarding agricultural practices.
We also emphasize that improving the accuracy of digital maps is possible by using additional explanatory variables (satellite data, digital elevation models and others). However, for small plots, as in this study, the use of free-access covariates is not always appropriate due to their relatively low spatial resolution. In such cases, spatial data should have high and ultra-high resolutions, which leads to additional costs in purchasing them. Therefore, at the preliminary stage, the use of geostatistical methods to assess the variability and mapping of properties is advisable.
4. Conclusions
The expansion of northern farming as a result of a milder climate requires the deeper study of local soils and farming practices, including fertilization application. The present study demonstrated an assessment of the agrochemical properties of an abandoned arable plot with a long and unique history in Salekhard city (Russian Arctic). As a result of the involvement of soils in plowing and long-term use, the site has soil cover that differs from other pristine soils in the region. The soil cover is represented by Plaggic Podzol (Turbic) and is characterized by relatively low SOC content and high acidity caused by podzolization processes. We found that nutrient content can remain high, even after 15 years of abandonment.
We investigated the spatial distribution of the studied properties using ordinary kriging and inverse distance-weighted methods in the upper 0–10 cm layer. Our study showed that, in general, the accuracy of the two mapping approaches is comparable. We were not able to estimate a reliable spatial distribution for all of the properties. Some properties were characterized by spatial dependence, while others had a pure-nugget effect. We consider external factors, such as long-term experiments with fragmented fertilizer and crop rotation, as major influences on the random and short-scale distribution of the study properties. Nevertheless, spatial-prediction techniques such as kriging can be used as an initial method for large-scale mapping on a small plot. For effective land management, there is a need for modern and accurate digital maps to assess the spatial distribution of soils and their properties. Further, the accuracy of digital maps could be improved by adding spatial explanatory variables and increasing the number and density of soil samples.
Author Contributions
Conceptualization: A.S. and E.A.; sampling: A.S. and T.N.; methodology, A.S. and T.N.; formal analysis and investigation: A.S., T.N., E.M. and E.A.; writing—original draft preparation: A.S., T.N., E.M. and E.A.; writing—review and editing: E.A.; funding acquisition E.A.; visualization: A.S. and T.N.; supervision: E.A. All authors have read and agreed to the published version of the manuscript.
Funding
This work was supported by the Ministry of Science and Higher Education of the Russian Federation in accordance with agreement No. 075-15-2022-322 date 22 April 2022 on providing a grant in the form of subsidies from the Federal budget of Russian Federation. The grant was provided for state support for the creation and development of a World-class Scientific Center “Agrotechnologies for the Future”.
Institutional Review Board Statement
Not applicable.
Informed Consent Statement
Not applicable.
Data Availability Statement
Data may be requested from the corresponding author for an appropriate reason.
Acknowledgments
The authors are grateful to Gerard Heuvelink from Wageningen University and ISRIC—World Soil Information for their valuable advice on the geostatistical aspects of the study. We also thank the anonymous reviewers for their careful reading of our manuscript and their many insightful comments and suggestions.
Conflicts of Interest
The authors declare no conflict of interest.
Appendix A

Table A1.
Experiments on the use of fertilizers and crop cultivation in the field of the Yamal agricultural experimental station in the period from 1937 to 2005.
Table A1.
Experiments on the use of fertilizers and crop cultivation in the field of the Yamal agricultural experimental station in the period from 1937 to 2005.
| Year | Quantity of Experiences | Options |
|---|---|---|
| 1937 | Experience for 8 options | I. Manure 100 t/ha plowing to a depth of 18 cm + furnace ash (1 t/ha) under the furrow: (1) Potato (200 m2) (2) Radish (300 m2) (3) Turnip (500 m2) (4) Radish (200 m2) (5) Beet (196 m2) (6) Turnip (3920 m2) II. Sprinkled on top: manure 80 t/ha + superphosphate + potassium salt: (7) Vetch oat mixture (600 m2) (8) Cabbage (1176 m2). |
| 1948–1949 | Experience for 9 options | (1) 60 t/ha manure (2) 120 t/ha manure (3) 120 t/ha manure + N40P60K60 (4) 60 t/ha manure + N40 (5) 60 t/ha manure + N40P60 (6) 60 t/ha manure + N40K60 (7) 60 t/ha manure + P60K60 (8) N40P60K60 (9) N80P120K120. |
| 1962–1964 | Experience for 10 options on the background without manure + 10 options on the background with manure (60 t/ha) | 10 options on the background without manure: (1) K180 (2) P90 (3) N180 (4) N180P90K180 (5) K90 (6) P45 (7) N90 (8) N90P45K90 (9) Without applying any fertilizer (10) 60 t/ha manure 10 options on the background with manure (60 t/ha): (1) K180 (2) P90 (3) N180 (4) N180P90K180 (5) K90 (6) P45 (7) N90 (8) N90P45K90 (9) Without applying any fertilizer (10) 60 t/ha manure. |
| 1974 | Experience for 52 options | Experiments on growing 52 varieties of potatoes |
| 1985–2005 | Experience for 5 options | 1. Without peat 2. Peat 120 t/ha 3. Peat 240 t/ha 4. Peat 480 t/ha 5. Peat 720 t/ha |
| Experience for 4 options | 1. Without applying any fertilizer 2. Manure 120 t/ha 3. Manure 240 t/ha 4. Manure 480 t/ha | |
| Experience for 4 options | 1. Without applying any fertilizer 2. N120P90K120 3. N120P150K180 4. N180P210K240 | |
| Experience for 4 options | 1. Spring rapeseed 2. Rapeseed + oats 3. Rapeseed + annual ryegrass 4. Rapeseed + peas | |
| Experience for 6 options | 1. Without applying any fertilizer 2. N120P90K90 3. Lime 4. Lime 5. Lime 6. Lime | |
| Micro-field experience for 6 options | 1. Without applying any fertilizer 2. 60 t/ha manure + P90K120 3. Ammonium nitrate 4. Ammonium sulfate 5. Urea 6. Ammonia water | |
| Micro-field experience for 4 options | 1. Without fertilizer 2. 60 t/ha manure + N120P90 3. 60 t/ha manure + K60 4. 60 t/ha manure +K120 |
References
- AMAP. Arctic Climate Change Update 2021: Key Trends and Impacts. Summary for Policy-Makers. In Arctic Monitoring and Assessment Programme; AMAP: Tromsø, Norway, 2021. [Google Scholar]
- Ballinger, T.J.; Overland, J.W.; Wang, M.; Bhatt, U.S.; Hanna, E.; Hanssen-Bauer, I.; Kim, S.-J.; Thoman, R.L.; Walsh, J.E. Arctic Report Card 2020. Surf. Air Temp. 2020, 21, 2. [Google Scholar] [CrossRef]
- Katsov, V.; Semenov, S.; Alekseev, G.; Ananicheva, M. Second Roshydromet Assessment Report on Climate Change and Its Consequences in the Russian Federation; Rosgidromet: Moscow, Russia, 2014. [Google Scholar]
- Wiréhn, L. Nordic Agriculture under Climate Change: A Systematic Review of Challenges, Opportunities and Adaptation Strategies for Crop Production. Land Use Policy 2018, 77, 63–74. [Google Scholar] [CrossRef]
- Mela, T.J.N. Northern agriculture: Constraints and responses to global climate change. Agr. Food Sci. 1996, 5, 161–164. [Google Scholar] [CrossRef]
- Khantimer, I.S. Agricultural Development of Tundra Regions; Academy of Sciences of the USSR: Moscow, Russia, 1974. [Google Scholar]
- Purtov, G. Agricultural Development of the Ob North; Russian Academy of Agricultural Sciences, Siberian Branch, NIISKh of the North Urals: Novosibirsk, Russia, 1994. [Google Scholar]
- Vavilov, N. Problem of Northern Agriculture, Materials of the Leningrad Emergency Session of Academy of Sciences of the USSR 25–30 XI1931; Publishing House of Academy of Sciences: Leningrad, Russia, 1931. [Google Scholar]
- Stevenson, K.T.; Alessa, L.; Kliskey, A.D.; Rader, H.B.; Pantoja, A.; Clark, M. Sustainable Agriculture for Alaska and the Circumpolar North: Part I. Development and Status of Northern Agriculture and Food Security. Arct. Inst. N. Am. 2014, 76, 271–295. [Google Scholar] [CrossRef] [Green Version]
- Eichfeld, I.G. Struggle for the Far North: Brief Results of the Work of the Polar Division of VIR, 1923–1933; VIR: San Francisco, CA, USA, 1933. [Google Scholar]
- Morgun, E.; Abakumov, E. Agricultural Research and Crop Yields in the Yamal-Nenets Autonomous District: Retrospective Analysis (1932–2019). Sci. Bull. Yamal-Nenets Auton. Dist. 2019, 3, 4–9. [Google Scholar]
- Abakumov, E.; Morgun, E.; Pechkin, A.; Polyakov, V. Abandoned agricultural soils from the central part of the Yamal region of Russia: Morphology, diversity, and chemical properties. Open Agr. 2020, 5, 94–106. [Google Scholar] [CrossRef]
- Abakumov, E.; Suleymanov, A.; Guzov, Y.; Titov, V.; Vashuk, A.; Shestakova, E.; Fedorova, I. Ecosystem Services of the Cryogenic Environments: Identification, Evaluation and Monetisation—A Review. J. Water Land Dev. 2022, 52, 1–8. [Google Scholar] [CrossRef]
- Shit, P.K.; Bhunia, G.S.; Maiti, R. Spatial Analysis of Soil Properties Using GIS Based Geostatistics Models. Model. Earth Syst. Environ. 2016, 2, 107. [Google Scholar] [CrossRef] [Green Version]
- Kozlov, D.N.; Sorokina, N.P. Tradition and Innovation in Large-Scale Soil Mapping. Digital Soil Mapping. Theor. Exp. Res. 2012, 1, 35–57. [Google Scholar]
- Dokuchaev, V. Works; Academy of Sciences of USSR: Moscow, Russia, 1950; Volume 4, Part 1. [Google Scholar]
- McBratney, A.B.; Mendonça Santos, M.L.; Minasny, B. On Digital Soil Mapping. Geoderma 2003, 117, 3–52. [Google Scholar] [CrossRef]
- Savin, I. Usage of satellite data for soil mapping: Modern tendencies and problems. Sovrem. Probl. Distantsionnogo Zondirovaniya Zemli Iz Kosm. 2016, 13, 29–39. [Google Scholar] [CrossRef]
- Gopp, N.V.; Nechaeva, T.V.; Savenkov, O.A.; Smirnova, N.V.; Smirnov, V. Indicative Capacity of NDVI in Predictive Mapping of the Properties of Plow Horizons of Soils on Slopes in the South of Western Siberia. Eurasian Soil Sci. 2017, 50, 1332–1343. [Google Scholar] [CrossRef]
- Gopp, N.V.; Nechaeva, T.V.; Savenkov, O.A.; Smirnova, N.V.; Smirnov, V. The Methods of Geomorphometry and Digital Soil Mapping for Assessing Spatial Variability in the Properties of Agrogray Soils on a Slope. Eurasian Soil Sci. 2017, 50, 20–29. [Google Scholar] [CrossRef]
- Prudnikova, E.; Savin, I. Some Peculiarities of Arable Soil Organic Matter Detection Using Optical Remote Sensing Data. Remote Sens. 2021, 13, 2313. [Google Scholar] [CrossRef]
- Prudnikova, E.Y.; Savin, I.Y. Satellite assessment of dehumification of arable soils in Saratov region. Eurasian Soil Sci. 2015, 48, 533–539. [Google Scholar] [CrossRef]
- Suleymanov, A.; Abakumov, E.; Suleymanov, R.; Gabbasova, I.; Komissarov, M. The Soil Nutrient Digital Mapping for Precision Agriculture Cases in the Trans-Ural Steppe Zone of Russia Using Topographic Attributes. ISPRS Int. J. Geo-Inf. 2021, 10, 243. [Google Scholar] [CrossRef]
- Sahabiev, I.A.; Ryazanov, S.S.; Kolcova, T.G.; Grigoryan, B.R. Selection of a Geostatistical Method to Interpolate Soil Properties of the State Crop Testing Fields Using Attributes of a Digital Terrain Model. Eurasian Soil Sci. 2018, 51, 255–267. [Google Scholar] [CrossRef]
- Beck, H.E.; Zimmermann, N.E.; McVicar, T.R.; Vergopolan, N.; Berg, A.; Wood, E.F. Present and future Köppen-Geiger climate classification maps at 1-km resolution. Sci. Data 2018, 5, 180214. [Google Scholar] [CrossRef] [Green Version]
- Arkhipov, S.; Isayeva, L.; Bespaly, V.; Glushkova, O. Glaciation of Siberia and north-east USSR. Quat. Sci. Rev. 1986, 5, 463–474. [Google Scholar] [CrossRef]
- Abakumov, E.; Zverev, A.; Morgun, E.; Alekseev, I. Microbiome of Abandoned Agricultural and Mature Tundra Soils in Southern Yamal Region. Russian Arctic. Open Agr. 2020, 5, 335–344. [Google Scholar] [CrossRef]
- Alekseev, I.; Abakumov, E. Permafrost-Affected Former Agricultural Soils of the Salekhard City (Central Part of Yamal Region). Czech Polar Rep. 2018, 8, 119–131. [Google Scholar] [CrossRef]
- Wadoux, A.M.J.-C.; Minasny, B.; McBratney, A.B. Machine Learning for Digital Soil Mapping: Applications, Challenges and Suggested Solutions. Earth Sci. Rev. 2020, 210, 103359. [Google Scholar] [CrossRef]
- Carter, M.R.; Gregorich, E.G. Soil Sampling and Methods of Analysis, 2nd ed.; Carter, M.R., Gregorich, E.G., Eds.; CRC Press: Boca Raton, FL, USA, 2008. [Google Scholar]
- Pansu, M.; Gautheyrou, J. Handbook of Soil Analysis: Mineralogical, Organic and Inorganic Methods; Springer: Berlin, Germany, 2006. [Google Scholar]
- Jones, J.B. Soil Analysis Handbook of Reference Methods, 1st ed.; CRC Press: Boca Raton, FL, USA, 1999. [Google Scholar]
- Mulvaney, R.; Sparks, D. Methods of soil analysis, Part 3. Chemical methods. In Soil Science Society of America Book Series 1123; John Wiley & Sons: Hoboken, NJ, USA, 1996. [Google Scholar]
- Jenkinson, D.S.; Powlson, D.S. The Effects of Biocidal Treatments on Metabolism in Soil—V: A Method for Measuring Soil Biomass. Soil Biol. Biochem. 1976, 8, 209–213. [Google Scholar] [CrossRef]
- Lal, R.; Kimble, J.M.; Follet, R.F.; Stewart, B.A. Assessment Methods for Soil Carbon; Lewis Publishers: Boca Raton, FL, USA, 2001. [Google Scholar]
- Webster, R.; Oliver, M.A. Geostatistics for Environmental Scientists, 2nd ed.; John Wiley & Sons: Chichester, UK, 2007. [Google Scholar]
- Bhunia, G.S.; Shit, P.K.; Maiti, R. Comparison of GIS-Based Interpolation Methods for Spatial Distribution of Soil Organic Carbon (SOC). J. Saudi Soc. Agric. Sci. 2018, 17, 114–126. [Google Scholar] [CrossRef] [Green Version]
- Cambardella, C.A.; Moorman, T.B.; Novak, J.M.; Parkin, T.B.; Karlen, D.L.; Turco, R.F.; Konopka, A.E. Field-Scale Variability of Soil Properties in Central Iowa Soils. Soil Sci. Soc. Am. J. 1994, 58, 1501–1511. [Google Scholar] [CrossRef]
- R Development Core Team. R: A Language and Environment for Statistical Computing; R Foundation for Statistical Computing: Vienna, Austria, 2015. [Google Scholar]
- RStudio Team. Integrated Development Environment for R; RStudio Team: Boston, MA, USA, 2015. [Google Scholar]
- Alekseev, I.; Abakumov, E. Soil Organic Carbon Stocks and Stability of Organic Matter in Permafrost-Affected Soils of Yamal Region, Russian Arctic. Geoderma Reg. 2022, 28, e00454. [Google Scholar] [CrossRef]
- IUSS Working Group WRB. World Reference Base for Soil Resources 2014, Update 2015. In International Soil Classification System for Naming Soils and Creating Legends for Soil Maps; World Soil Resources Reports No. 106; FAO: Rome, Italy, 2015. [Google Scholar]
- Nizamutdinov, T.; Abakumov, E.; Morgun, E. Morphological Features, Productivity and Pollution State of Abandoned Agricultural Soils in the Russian Arctic (Yamal Region). One Ecosyst. 2021, 6, e68408. [Google Scholar] [CrossRef]
- Maeder, P.; Fliessbach, A.; Dubois, D.; Gunst, L.; Fried, P.; Niggli, U. Soil Fertility and Biodiversity in Organic Farming. Science 2002, 296, 1694–1697. [Google Scholar] [CrossRef] [Green Version]
- Foth, H.D.; Ellis, B.G. Soil Fertility; CRC Press: Boca Raton, FL, USA, 2018. [Google Scholar]
- Mineev, V.G. (Ed.) Practical Manual on Agrochemistry; Moscow State University: Moscow, Russia, 2001. [Google Scholar]
- Kiryushin, V. Agronomic Soil Science; Kolos-s: Moscow, Russia, 2010. [Google Scholar]
- Lodygin, E.D.; Beznosikov, V.A.; Vasilevich, R.S. Molecular Composition of Humic Substances in Tundra Soils (13C-NMR Spectroscopic Study. Eurasian Soil Sci. 2014, 47, 400–406. [Google Scholar] [CrossRef]
- Moskovchenko, D.V. Biogeochemistry of Permafrost Landscapes in West Siberia: Implications for Ecology and Sustainability. Kriosf. Zemli 2011, 15, 25–28. [Google Scholar]
- Nizamutdinov, T.; Abakumov, E.; Morgun, E.; Loktev, R.; Kolesnikov, R. Agrochemical and Pollution Status of Urbanized Agricultural Soils in the Central Part of Yamal Region. Energies 2021, 14, 4080. [Google Scholar] [CrossRef]
- Sidorova, V.; Fyodorov, F. Effect of Beavers on Variability of Soil Properties in Southern Karelia. In Soil Geography and Geostatistics; Dictus Publishing: Luxembourg, 2008; pp. 68–84. [Google Scholar]
- Bhunia, G.S.; Shit, P.K.; Chattopadhyay, R. Assessment of Spatial Variability of Soil Properties Using Geostatistical Approach of Lateritic Soil (West Bengal, India). Ann. Agrar. Sci. 2018, 16, 436–443. [Google Scholar] [CrossRef]
- Saifuzzaman, M.; Adamchuk, V.; Biswas, A.; Rabe, N. High-Density Proximal Soil Sensing Data and Topographic Derivatives to Characterise Field Variability. Biosyst. Eng. 2021, 211, 19–34. [Google Scholar] [CrossRef]
- Castaldi, F.; Hueni, A.; Chabrillat, S.; Ward, K.; Buttafuoco, G.; Bomans, B.; Vreys, K.; Brell, M.; Wesemael, B. Evaluating the Capability of the Sentinel 2 Data for Soil Organic Carbon Prediction in Croplands. ISPRS J. Photogramm. Remote Sens. 2019, 147, 267–282. [Google Scholar] [CrossRef]
- Suleymanov, A.; Gabbasova, I.; Suleymanov, R.; Abakumov, E.; Polyakov, V.; Liebelt, P. Mapping soil organic carbon under erosion processes using remote sensing. Hung. Geogr. Bull. 2021, 70, 49–64. [Google Scholar] [CrossRef]
- Qiao, P.; Lei, M.; Yang, S.; Yang, J.; Guo, G.; Zhou, X. Comparing Ordinary Kriging and Inverse Distance Weighting for Soil as Pollution in Beijing. Environ. Sci. Pollut. Res. 2018, 25, 15597–15608. [Google Scholar] [CrossRef]
- Mousavi, S.R.; Sarmadian, F.; Dehghani, S.; Sadi̇khani, M.R.; Taati, A. Evaluating inverse distance weighting and kriging methods in estimation of some physical and chemical properties of soil in Qazvin Plain. Eurasian J. Soil Sci. 2017, 6, 327–336. [Google Scholar] [CrossRef] [Green Version]
- Yang, P.; Mao, R.; Shao, H.; Gao, Y. The Spatial Variability of Heavy Metal Distribution in the Suburban Farmland of Taihang Piedmont Plain, China. C. R. Biol. 2009, 332, 558–566. [Google Scholar] [CrossRef]
- López-Granados, F.; Jurado-Expósito, M.; Atenciano, S.; García-Ferrer, A.; Sánchez de la Orden, M.; García-Torres, L. Spatial Variability of Agricultural Soil Parameters in Southern Spain. Plant Soil 2002, 246, 97–105. [Google Scholar] [CrossRef]
- Meirvenne, M.V. Is the Soil Variability within the Small Fields of Flanders Structured Enough to Allow Precision Agriculture? Precis. Agric. 2003, 4, 193–201. [Google Scholar] [CrossRef]
- Sidorova, V.A.; Zhukovskii, E.E.; Lekomtsev, P.V.; Yakushev, V. Geostatistical Analysis of the Soil and Crop Parameters in a Field Experiment on Precision Agriculture. Eurasian Soil Sci. 2012, 45, 783–792. [Google Scholar] [CrossRef]
- Chambers, R.L.; Yarus, J.M.; Hird, K.B. Petroleum Geostatistics for Nongeostatisticians. Part 1. Lead. Edge 2000, 19, 474–479. [Google Scholar] [CrossRef]
- Rahmani, S.R.; Ackerson, J.P.; Schulze, D.; Adhikari, K.; Libohova, Z. Digital Mapping of Soil Organic Matter and Cation Exchange Capacity in a Low Relief Landscape Using LiDAR Data. Agronomy 2022, 12, 1338. [Google Scholar] [CrossRef]
Figure 1.
Maps showing the location of the Yamal-Nenets Autonomous District (YANAO) in Russia (a); the studied arable plot location (red square) in Salekhard (b); the plot (c) and the sampling locations (yellow dots). Sources: Esri, USGS, NOAA, Google maps.
Figure 1.
Maps showing the location of the Yamal-Nenets Autonomous District (YANAO) in Russia (a); the studied arable plot location (red square) in Salekhard (b); the plot (c) and the sampling locations (yellow dots). Sources: Esri, USGS, NOAA, Google maps.

Figure 2.
Morphological features of studied soil.

Figure 3.
Vertical distribution of chemical properties of Plaggic Podzol (Turbic) soil: Soil organic carbon (SOC) content (a); SOC stock (b); basal respiration (c); pH (d); and basic nutrients content (e).
Figure 3.
Vertical distribution of chemical properties of Plaggic Podzol (Turbic) soil: Soil organic carbon (SOC) content (a); SOC stock (b); basal respiration (c); pH (d); and basic nutrients content (e).

Figure 4.
Spatial distribution of soil agrochemical properties using the OK method.

Figure 5.
Spatial distribution of soil agrochemical properties using the IDW method.

Table 1.
General statistics of soil properties at a 0–10 cm depth.
| Parameter | pH H2O | pH CaCl2 | SOC, % | Basal Respiration mg CO2/100 g/Day | Available | N–NH4 | N–NO3 | |
|---|---|---|---|---|---|---|---|---|
| P2O5 | K2O | |||||||
| mg/kg | ||||||||
| n = 75 | ||||||||
| Min | 4.71 | 3.62 | 0.89 | 14.62 | 165.06 | 53.08 | 0 | 0 |
| Max | 5.88 | 5.11 | 5.12 | 30.93 | 1268.05 | 294.05 | 10.26 | 62.83 |
| Mean | 5.02 | 3.81 | 3.06 | 21.28 | 665.65 | 106.82 | 4.45 | 23.53 |
| SD | 0.22 | 0.24 | 0.99 | 4.14 | 232.62 | 47.28 | 2.41 | 19.44 |
| CV (%) | 4.38 | 6.29 | 32.5 | 19.45 | 35.48 | 44.26 | 54.16 | 82.62 |
| Median | 5.04 | 3.76 | 2.8 | 20.67 | 630.02 | 98.03 | 4.38 | 19.35 |
Table 2.
Parameters used in the OK adopted models and RMSE values for OK and IDW models.
| Properties | Type of Model | Nugget (C0) | PSill (C1) | Sill (C0 + C1) | Range, m | C0/(C0 + C1), % | Spatial Dependence | RMSE | |
|---|---|---|---|---|---|---|---|---|---|
| OK | IDW | ||||||||
| pH (H2O) | Sph | 0.03 | 0.54 | 0.57 | >350 | 5 | Strong | 0.2 | 0.2 |
| pH (CaCl2) | Sph | 0.01 | 0.1 | 0.11 | >350 | 9 | Strong | 0.2 | 0.2 |
| SOC | Sph | 0.61 | 0.39 | 1 | 41 | 61 | Moderate | 1 | 1.1 |
| CO2 | Pure nugget | 26 | 0 | 26 | - | 100 | No | 4.2 | 5.6 |
| P2O5 | Sph | 0 | 5125 | 5635 | 29 | 9 | Strong | 255.7 | 305.9 |
| K2O | Sph | 527 | 1470 | 1997 | 51 | 26 | Moderate | 49.1 | 51.4 |
| N–NH4 | Pure nugget | 0 | 0 | 0 | - | 100 | No | 3.1 | 2.9 |
| N–NO3 | Pure nugget | 0 | 0 | 0 | - | 100 | No | 23.6 | 24.8 |
Publisher’s Note: MDPI stays neutral with regard to jurisdictional claims in published maps and institutional affiliations. |
© 2022 by the authors. Licensee MDPI, Basel, Switzerland. This article is an open access article distributed under the terms and conditions of the Creative Commons Attribution (CC BY) license (https://creativecommons.org/licenses/by/4.0/).
Share and Cite
MDPI and ACS Style
Suleymanov, A.; Nizamutdinov, T.; Morgun, E.; Abakumov, E. Evaluation and Spatial Variability of Cryogenic Soil Properties (Yamal-Nenets Autonomous District, Russia). Soil Syst. 2022, 6, 65. https://doi.org/10.3390/soilsystems6030065
AMA Style
Suleymanov A, Nizamutdinov T, Morgun E, Abakumov E. Evaluation and Spatial Variability of Cryogenic Soil Properties (Yamal-Nenets Autonomous District, Russia). Soil Systems. 2022; 6(3):65. https://doi.org/10.3390/soilsystems6030065
Chicago/Turabian StyleSuleymanov, Azamat, Timur Nizamutdinov, Evgeniya Morgun, and Evgeny Abakumov. 2022. "Evaluation and Spatial Variability of Cryogenic Soil Properties (Yamal-Nenets Autonomous District, Russia)" Soil Systems 6, no. 3: 65. https://doi.org/10.3390/soilsystems6030065