Article

In Search of a Binding Agent: Nano-Scale Evidence of Preferential Carbon Associations with Poorly-Crystalline Mineral Phases in Physically-Stable, Clay-Sized Aggregates

1
Faculty of Life and Environmental Sciences, University of Tsukuba, 1-1-1 Tennodai, Tsukuba, Ibaraki 305-8572, Japan
2
Institute for Agro-Environmental Science, National Agriculture and Food Research Organization, 3-1-3 Tsukuba, Ibaraki 305-8604, Japan
3
Institute of Materials Structure Science, High-Energy Accelerator Research Organization, 1-1 Oho, Tsukuba, Ibaraki 305-0801, Japan
4
Department of Earth and Planetary Systems Science, Graduate School of Science, Hiroshima University, 1-3-2 Kagamiyama, Higashi-Hiroshima, Hiroshima 739-8526, Japan
5
Natural Science Center for Basic Research and Development, Hiroshima University, 1-3-2 Kagamiyama, Higashi-Hiroshima, Hiroshima 739–8526, Japan
6
Department of Earth and Planetary Science, Graduate School of Science, The University of Tokyo, Bunkyo-Ku, Tokyo 113-0033, Japan
*
Authors to whom correspondence should be addressed.
These authors contributed equally to this work.
Soil Syst. 2018, 2(2), 32; https://doi.org/10.3390/soilsystems2020032
Submission received: 2 December 2017 / Revised: 16 May 2018 / Accepted: 17 May 2018 / Published: 29 May 2018
(This article belongs to the Special Issue Soil Organic Matter Dynamics)

Abstract

:
Mechanisms of protecting soil carbon (C) are still poorly understood despite growing needs to predict and manage the changes in soil C or organic matter (OM) under anticipated climate change. A fundamental question is how the submicron-scale interaction between OM and soil minerals, especially poorly-crystalline phases, affects soil physical aggregation and C stabilization. Nano-sized composites rich in OM and poorly-crystalline mineral phases were presumed to account for high aggregate stability in the Andisol we previously studied. Here we searched for these nanocomposites within a sonication-resistant aggregate using scanning transmission X-ray microscopy (STXM) and near-edge X-ray absorption fine structure (NEXAFS) as well as electron microscopy (SEM, TEM). Specifically, we hypothesized that nanometer-scale spatial distribution of OM is controlled by poorly-crystalline minerals as both co-exist as physically-stable nanocomposites. After maximum dispersion of the cultivated Andisol A-horizon sample in water, one aggregate (a few µm in diameter) was isolated from 0.2–2 µm size fraction which accounted for 44–47% of total C and N and 50% of poorly-crystalline minerals in bulk soil. This fraction as well as <0.2 µm fraction had much higher extractable Al and Fe contents and showed greater increase in specific surface area (N2-BET) upon OM oxidation compared to bulk and >2 µm size fractions, implying high abundance of the nanocomposites in the smaller fractions. The isolated aggregate showed a mosaic of two distinctive regions. Smooth surface regions showed low adsorption intensity of carbon K-edge photon energy (284–290 eV) with well-crystalline mineralogy, whereas rough surface regions had features indicative of the nanocomposites: aggregated nanostructure, high C intensity, X-ray amorphous mineral phase, and the dominance of Si, O, Al, and Fe based on SEM/EDX and TEM/EDX. Carbon functional group chemistry assessed by NEXAFS showed the dominance of amide and carboxyl C over aromatic and aliphatic C with some variation among the four rough surface regions. Together with C and N isotopic patterns among the size fractions (relatively low C:N ratio, high 15N natural abundance, and more positive Δ14C of the <2 μm fractions), our results provided the direct evidence of preferential binding of microbially-altered, potentially-labile C with poorly-crystalline mineral phases at submicron scale. The role of the nanocomposite inferred from this study may help to bridge the knowledge gap between physical aggregation process and biogeochemical reactions taking place within the soil physical structure.

1. Introduction

Decomposition and transformation of organic matter (OM) in soil, driven by microbial heterotrophic activity, are tightly linked to various biogeochemical processes in terrestrial ecosystems. Soil OM (SOM), representing the largest C pool on land, consists of a variety of organic compounds having different degrees of resistance against microbial degradation. Improving our understanding of SOM stability under climate change is critical to improve the predictive model of global carbon cycle [1,2,3]. While OM entering soil as plant litter is decomposed via microbial catabolism, microbially-reworked OM interacts with soil minerals and contributes to long-term SOM storage (decadal and longer) as shown by a growing number of studies using physical fractionation, isotope tracer, and/or non-destructive imaging approaches [4,5,6,7,8,9].
One of the fundamental approaches to study mineral protection of OM is the characterization of the mineral surfaces that interact with OM in soil. The C concentration in soils and sediments tends to show positive correlation with specific surface area (SSA) in a similar manner to the well-known correlation between C and clay contents [10,11]. The soil mineral surfaces are not fully covered by OM but rather show patchy organic coverage unless soils are holding very high amounts of OM [12,13,14]. The limited organic coverage on mineral surface is consistent with the preferential sorption of dissolved OM onto reactive surface zones characterized by high surface roughness and microporosity that largely results from Fe and Al (hydr)oxides of lower crystallinity, short-range-order (SRO) minerals [11,15,16,17], and phyllosilicate minerals [18]. Sorptive stabilization onto these reactive surfaces clearly contriubtes to long-term C stabilization, especially in subsurface horizons [19,20].
Mineral surface properties and surface-mediated chemical reactions (e.g., sorption and precipitation) cannot fully explain SOM stability because physical constraints of decomposition are also present in soil. At micron to millimeter space scales, OM present in aggregates is protected from microbial attack due to the limited accessibility of microbes, their enzymes, and/or diffusion constraints of water and oxygen [21,22]. Even at submicron scales, the importace of physical protection mechanisms has been pointed out by gas sorption, bioassay, and spectroscopic approaches [10,12,15,23,24]. Three-dimensional interaction of OM with soil minerals at micron and submicron scales (i.e., microaggregate formation and destruction) may be the most complex aspect of organo-mineral interaction in soil [7,25] due to the immense diversity in organic and mineral compositions and the spatial heterogeneity down to submicron spatial scales [26]. This aspect is, however, crucial to understand how soil minerals (surface or matrix) protect OM.
One useful concept in this context is the aggregate hierarchy theory [27], which emphasizes the role of binding agents for aggregation at different space scales [28]. Major binding agents considered to work at micron to submicron scales are poorly-crystalline minerals, redox-sensitive minerals and microbial products (detritus and metabolites) [27]. The poorly-crystalline minerals mainly consist of short-range-order (SRO) mineral phases such as allophane, imogolite, and ferrihydrite [17,29,30], proto-imogolite [31,32], and nano-goethite [33]. These minerals have high cation and anion exchange capacity as well as extensive, variable-charged surfaces [34] and are likely to contribute to the formation of micron- and submicron-sized aggregate of high physical stability [28,32].
Volcanic-ash soil is an ideal soil type to examine the micron- to submicron-scale aggregate structure because this soil type holds characteristically high amounts of the binding agents (OM and poorly-crystalline minerals) that are considered to function at the smaller spatial scales. In addition, monomeric Fe and especially Al cations are abundant in volcanic soils by forming complexes with organic functional groups (e.g., carboxylic groups in dissolved OM) [35]. The content of these organo-metallic complexes, often estimated by pyrophosphate extraction, shows strong controls on SOM storage and C mean residence time in Andisols and other soils [36,37,38,39,40,41]. These metals and poorly-crystalline phases that strongly bind with OM are collectively termed reactive inorganic phase (RI phase) in this study. The contents of pyrophosphate and acid-oxalate extractable metals can be used as a surrogate of RI phase with a caveat that they don’t exactly correspond to specific RI phases [31,33].
Using an Ap horizon sample of an allophanic Andisol, we previously studied particle size fractions isolated after a series of aggregate disruption tests. The treatment ranged from mechanical shaking to maximum dispersion (sodium saturation followed by sonication at 5 kJ mL−1), above which no more clay-sized particles were released by physical means. The following five unique features of aggregate hierarchy were identified [42,43]. First, hierarchical structure was present at much smaller spatial scale (<53 µm) than previously shown for other soil types [44]. Second, SEM confirmed that the <2 µm fractions isolated even after the maximum dispersion were dominated by submicron-sized aggregates. Third, the 0.2–2 µm size fraction isolated after the maximum dispersion accounted for major portions of soil OM (44–47%) and poorly-crystalline minerals (50–51%) in the bulk soil, and the OM in this fraction were characterized by lower C:N ratio, higher natural abundance of 15N, and greater abundance of O-alkyl C (by solid-state 13C NMR) compared to the bulk fraction. Fourth, selective dissolution and XRD confirmed that the <2 µm fractions after the maximum dispersion consisted of a mixture of primary and secondary crystalline minerals as well as RI phase. Fifth, the ratio between OM properties (C content, C:N ratio) and the content of RI phase (pyrophosphate- and oxalate-extractable Fe + Al) was, to our surprise, roughly constant among all particle-size fractions isolated after three contrasting levels of dispersion.
We reasoned that the constant ratio between OM and RI phase is possible only if we assume that (i) the particles in the size fractions after the maximum dispersion can consist of presumed building blocks, (ii) one of the presumed building blocks is organo-metal/mineral nanocomposite (OMN) which is highly enriched in both N-rich OM and RI phase, and (iii) OMN is physically stable against the maximum dispersion. Then, the constant ratio observed can be explained by the variation in OMN distribution caused by the dispersion levels. For instance, the 0.2–2 µm fraction after the maximum dispersion likely contained much more OMN than the 2–53 µm fraction isolated after weaker dispersion levels. While OMN appeared to control aggregation behavior in our Andisol, we were unable to explicitly incorporate it in the conceptual model of Andisol aggregate hierarchy [42] as we had no direct evidence of its presence.
In this study, we thus attempted to identify OMN which was presumed to be more abundant in sonication-resistant, finer-sized fractions. We hypothesized that the spatial distribution of organic C matches with that of RI phase within a particle from the 0.2–2 µm size fraction of the Andisol we previously examined [42,43]. A potential pitfall is the possible re-aggregation of subunits, which can occur at unknown degrees during the fractionation and preparation steps for microscopic observation. The current approach, nevertheless, has some advantages to gain new insights on the physicochemical nature of OMN because (i) nano-scale mapping of C and mineral-derived elements allows the detection of OMN regardless of the re-aggregation due to the size and physical stability of OMN and (ii) isolation of OMN-rich fraction is necessary for the application of high-resolution microscopy techniques as it is technically difficult to search for such small particles from bulk soil or undisturbed aggregates. At first, we assessed selected features of OMN in the whole 0.2–2 µm fraction in comparison to the other size fractions (<0.2, 2–53, >53 µm) by characterizing bulk chemistry and SSA of these fractions. We also measured radiocarbon content of each size fraction to infer the residence time or stability of C. Then one particle isolated from the 0.2–2 µm size fraction after the maximum dispersion was examined by soft X-ray scanning transmission microscopy (STXM) coupled with near edge X-ray adsorption fine structure (NEXAFS) followed by a detailed microscopic assessment of specific regions of the aggregate using a field emission scanning electron microscopy (FE-SEM) and transmission electron microscopy (TEM). STXM-NEXAFS was an ideal technique because it allowed us to characterize the spatial distribution of light elements originating from both OM and minerals as well as identifying major C forms [26,45,46,47,48,49,50,51]. We identified OMN-rich regions within the isolated particle and discussed their possible roles in the development of hierarchical aggregate structure from a pedological perspective with a new conceptual model.

2. Materials and Methods

2.1. Soil Samples

The soil sample was collected from the experimental field of National Institute for Agro-Environmental Sciences in Tsukuba, Honshu Island of Japan (36°01′ N, 140°07′ E, 21 m a.s.l). The soil was developed on volcanic-ash deposits, classified as a Silandic Hydric Andosol in WRB [52]. The soil mineralogy is characterized by short-range-order minerals with minor amounts of gibbsite, kaolinite, chrolite, aluminum interlayered-vermiculite (Al-HIV), mica, cristobalite, quartz, and feldspar. We used a subset of the composite sample (n = 6) from 0–20 cm Ap horizon under conventional tillage used in our previous research [42], which examined the nature of aggregate hierarchy. More detailed soil/site information is shown elsewhere [42].

2.2. Procedure to Isolate Size Fractions

We isolated particle-size fractions after the previously-determined maximum dispersion level, which was achieved by sodium saturation pretreatment followed by strong sonication treatment [42]. Briefly, the sodium-saturated sample was prepared by mixing field moist sample with 1 M NaCl for more than 12 h at room temperature followed by repeated rinsing with ultra-pure water (UPW) until the electric conductivity of supernatant reached <20 µS cm−1. For the sonication treatment, the NaCl-saturated sample (2 g dry-equivalent) was mixed with 50 mL UPW and dispersed by ultrasound (Sonifier II250, Branson, Danbury, CT, USA) using the probe (1/2″ tapped horn). The total sonication energy applied was 5 kJ mL−1 at 100 W [42], corresponding to the maximum dispersion intensity based on the dispersibility of clay-size particles previously conducted. We used a custom-made horn tip (full-flat type) to avoid horn deterioration by the extremely high energy applied. The output sonication energy was calibrated by calorimetric approach [53]. The soil suspension was kept at a low temperature (<26 °C) during sonication with the use of stainless-steel chamber in ice bath.
After the sonication treatment, the soil suspensions were diluted with UPW (soil:water ratio of 1 g:10 mL) and we isolated fine clay (<0.2 µm) and clay (0.2–2 µm) fractions by centrifugation assuming the particle density of 2.5 g cm−3. We first isolated the <0.2 µm fraction by repeatedly collecting the centrifuged suspension using siphon (more than 4 times, until the suspension became almost completely transparent) followed by the collection of 0.2–2 µm fraction in the same way. The remaining soil material was wet-sieved to separate into 2–53 µm and 53–4000 µm fractions. To minimize the flocculation and re-aggregation of dispersed particles, the entire fractionation procedure was conducted within one day. An aliquot of the suspension isolated for the 0.2–2 µm fraction was used for microscopic analyses. The rest of the isolated fractions were freeze-dried for surface area and other chemical analyses.
Strong sonication treatment leaves the possibility of re-adsorption of sonication-induced fragments of plant or microbial debris on to the soil particles. However, the studied soil contained only small amounts of plant detritus (i.e., 4.1% of total C was in <1.6 g cm−3 density fraction, [54]) and most of them was removed by flotation in water. In addition, we previously confirmed that there was no significant difference in the correlation slope of C/N ratio or C content against the contents of RI phases among the three dispersion intensity levels from mechanical shaking to the maximum dispersion [42]. Higher dispersion level enhances the fragmentation of organic debris. If these fragments were re-adsorbed on finer soil particles, then the correlation slope should have been different for a given size fraction among the dispersion levels. We thus assumed that the re-adsorption of plant or microbial debris by the maximum dispersion did not significantly affect our results.

2.3. Characterization of Each Size Fraction

Selected physicochemical properties of all four size fractions isolated were assessed. Besides basic chemical characteristics described previously (Table 1) [42], we measured specific surface area (SSA) and radiocarbon content of each fraction. SSA was measured by N2 gas sorption approach. Estimating the SSA for the soils containing large amounts of RI phase is inherently challenging because (i) water molecules that can interfere the N2 gas sorption are integral part of naturally-occurring RI phase and (ii) any methods of removing the OM bound to RI phase are likely to alter the original structure of RI phase. Thus the SSA values we measured contain some uncertainty and should be interpreted with care. We first tested the drying temperature effect on SSA using four density fractions isolated from the same soil and found negligible difference (−1 to +5%) between 40 °C and 105 °C (unpublished data). Thus the freeze-dried, size-fraction samples were dried in vacuum oven at 105 °C (more than 16 h) followed by further outgassing under vacuum at 105 °C [55]. The outgassing and SSA analysis were conducted using A-1 Autosorb (Quantachrome Corp., Boynton Beach, FL, USA). SSA values were calculated based on 11-point Brunauer-Emmett Teller (BET) approach at the partial pressure <0.3. After gas sorption analysis, samples were carefully transferred to glass beakers and oxidized with H2O2 under heat (up to 80 °C) to remove most of the OM. While some alteration in poorly-crystalline mineral phases by this oxidation method is inevitable [16], allophane (the dominant mineral phase) is stable against the H2O2 treatment [56]. We did not use sodium hypochlorite oxidation as it results in less complete OM oxidation and thus SSA underestimation [55,57]. After freeze-drying, samples were analyzed in the same way as the non-oxidized samples.
We calculated an index of organic coverage of mineral surfaces as the fraction of the total mineral surface area that was inaccessible to N2 gas in the untreated sample, due to organic occlusion or coverage of the mineral surface, by following calculation [11]:
Org. Coverage (%) = [(SSAoxidized − SSAuntreated)/SSAoxidized] × 100
where SSAuntreated and SSAoxidized refer to the specific surface area of untreated and oxidized soil, respectively.
The SSA of bulk sample can be partitioned to each fraction, assuming that the size fractionation steps did not change the surface area accessible to N2 gas molecule. Thus the distribution of the total SSA of bulk sample across the particle size fractions was calculated by following calculation:
%SSAdistribution = (SSAoxidized × mass percentage)/
(sum of SSAoxidized × mass percentage of each fraction) × 100
Radiocarbon ratio of each particle-size fraction was measured using freeze-dried and ground subsample by an accelerator mass spectrometry (Beta Analytic Inc., Miami, FL, USA). The 14C/12C ratio was normalized by δ13C and calculated as Δ14C value [58].

2.4. Scanning Transmission X-ray Microscopy (STXM) and Near-Edge X-ray Absorption Fine Structure (NEXAFS)

We selected the 0.2–2 µm fraction, which accounted for major portions of total C (47% of total C) for scanning transmission X-ray microscopy (STXM) and near-edge X-ray absorption fine structure (NEXAFS) analysis (Table 1). The suspension of 0.2–2 µm sized particles, freshly isolated from bulk soil following the above procedure, was diluted by ultra-pure water and dropped onto Si3N4 window (50 nm thick, window size 500 µm). Surprisingly, most of the dispersed particles in the 0.2–2 µm fraction deposited on Si3N4 window showed aggregated feature (Figure S1) while the particles in the 0.2–2 µm fraction had the diameter range of 0.2–3 µm (arithmetical mean particle size was 1.7 µm by laser diffraction particle size analysis). The observed aggregation can result not only from pedogenesis but also re-aggregation during drying on the Si3N4 window. Based on our multiple deposition trials (data not shown), the deposition of the suspension with weak dilution and rapid drying tended to create densely-packed aggregates along the plane of the Si3N4 window. While such obvious re-aggregation was avoided by sample dilution and slow drying at room temperature, we cannot rule out the possibility of re-aggregation during the sample preparation.
We selected a 2.5 by 2.5 µm region from the deposited particles based on two criteria. The region had (i) ca 3 µm diameter which was a suitable thickness for STXM-NEXFS and (ii) no clear difference in the morphological feature and elemental composition (Si, Al, Fe, and O observed by FE-SEM) compared to other regions. Carbon and iron NEXAFS were recorded by compact STXM at BL-13A beamline at Photon Factory of the High Energy Accelerator Research Organization (KEK) [59]. The intensity at the focal point of the toroidal mirror on the beamline is ~1011 photons/s, with a typical energy resolution of EE ~5000 [59]. The theoretical spatial resolution of the STXM were less than 50 nm [59]. For STXM-NEXAFS, we collected images in the X-ray energy region of 280 to 300 eV for C K-edge absorption, and 703 to 711.5 for Fe L3-edge absorption [51]. The collected images and spectra were processed by the software package aXis2000 [60]. For C NEXAFS, stack images were collected every 0.3 eV for the energy range from 280 to 283.9 eV, 0.1 eV from 283.9 to 291 eV, and 0.5 eV from 291 to 300 eV. The absorption images were aligned and then converted to optical density (OD = log(I0/I)) using transmitted photon flux thorough the sample (I), and the background photon flux transmitted thorough empty regions within same Si3N4 window. First, we checked optical density (OD), because OD > 2 were too thick to obtain C map [51], and thick materials can cause dipping in spectra near 284.5 eV [49]. Then, the C and Fe distribution maps were obtained by subtracting post-edge OD image from pre-edge OD image, respectively. The carbon functional group map was obtained after splitting the spectra into three energy ranges, 284–286 eV (aromatic C), 286–287 eV (phenol and aliphatic C), and 287–289 eV (amide and carboxyl C).

2.5. SEM and TEM Observation and Elemental Analysis

Micro-morphology, elemental composition, and X-ray diffraction of the aggregate subjected to STXM-NEXAFS were carried out using scanning electron microscopy (SEM) and transmission electron microscopy (TEM). After STXM-NEXAFS, the same aggregate was coated with osmium and examined by SEM (SU1510, Hitachi High-Tech, Tokyo, Japan). Subsequently, more detailed surface morphology and elemental maps were obtained using a field emission scanning electron microscopy (FE-SEM) (S-5200, Hitachi High-Tech, Tokyo, Japan) with an energy diffraction X-ray spectrometer (EDX) system (Genesis XM2, AMETEK Inc., Berwyn, PA, USA). Further micro-morphological observation, spot chemical analysis, and electron diffraction analysis were carried out by a TEM (JEM-2010, JEOL, Tokyo, Japan) coupled with an EDX system (JEOL, JED-2300T, Tokyo, Japan) at Hiroshima University. Surface features (rough vs. smooth surface) and the presence of particle overlaps were delineated by visual observation of the images from FE-SEM and TEM, respectively.

3. Results

3.1. Soil Surface Area before and after OM Removal

The SSA increased with decreasing particle size, from 9 m2 g−1 in the 53–4000 µm to 99 m2 g−1 in the <0.2 µm for SSAuntreated and from 11 m2 g−1 in the 53–4000 µm to 267 m2 g−1 in the <0.2 µm for SSAoxidized (Table 2). The organic coverage progressively increased with decreasing particle size from 14% in the 53–4000 µm to 63% in the <0.2 µm (Table 2). %SSAdistribution in the 0.2–2 µm fraction accounted for about 63% of total SSAoxidated and 31% of total SSAuntreated (Table 2). These results are consistent with the concentration patterns of RI phase (SRO mineral) estimated from selective extraction [42]. Among the particle size fractions, the 0.2–2 µm fraction contained 50% of the SRO minerals in bulk soil [42]. The difference in SSA and organic coverage between the <2 µm fractions and the >2 µm fractions is likely to be large enough to overcome the analytical uncertainty associated with the SSA measurement of soils rich in RI phase (see Material and Methods).
All size fractions and the bulk sample showed negative Δ14C values. Δ14C became more negative with the increase in the particle size from −94.8 ± 3.4‰ to −201.7 ± 3.0‰ (Table 2). The 53–4000 µm fraction was not analyzed but the C in this fraction generally represents plant litter. The 0.2–2 µm fraction showed the average Δ14C of −114.8‰. While this fraction was not the oldest C pool assuming steady-state input of bomb C into the soil, it represented the major portion of stable C pool in the studied soil because it accounted for 54% of total C, whereas the 2–53 µm fraction accounted for 27% of total C (Table 1).

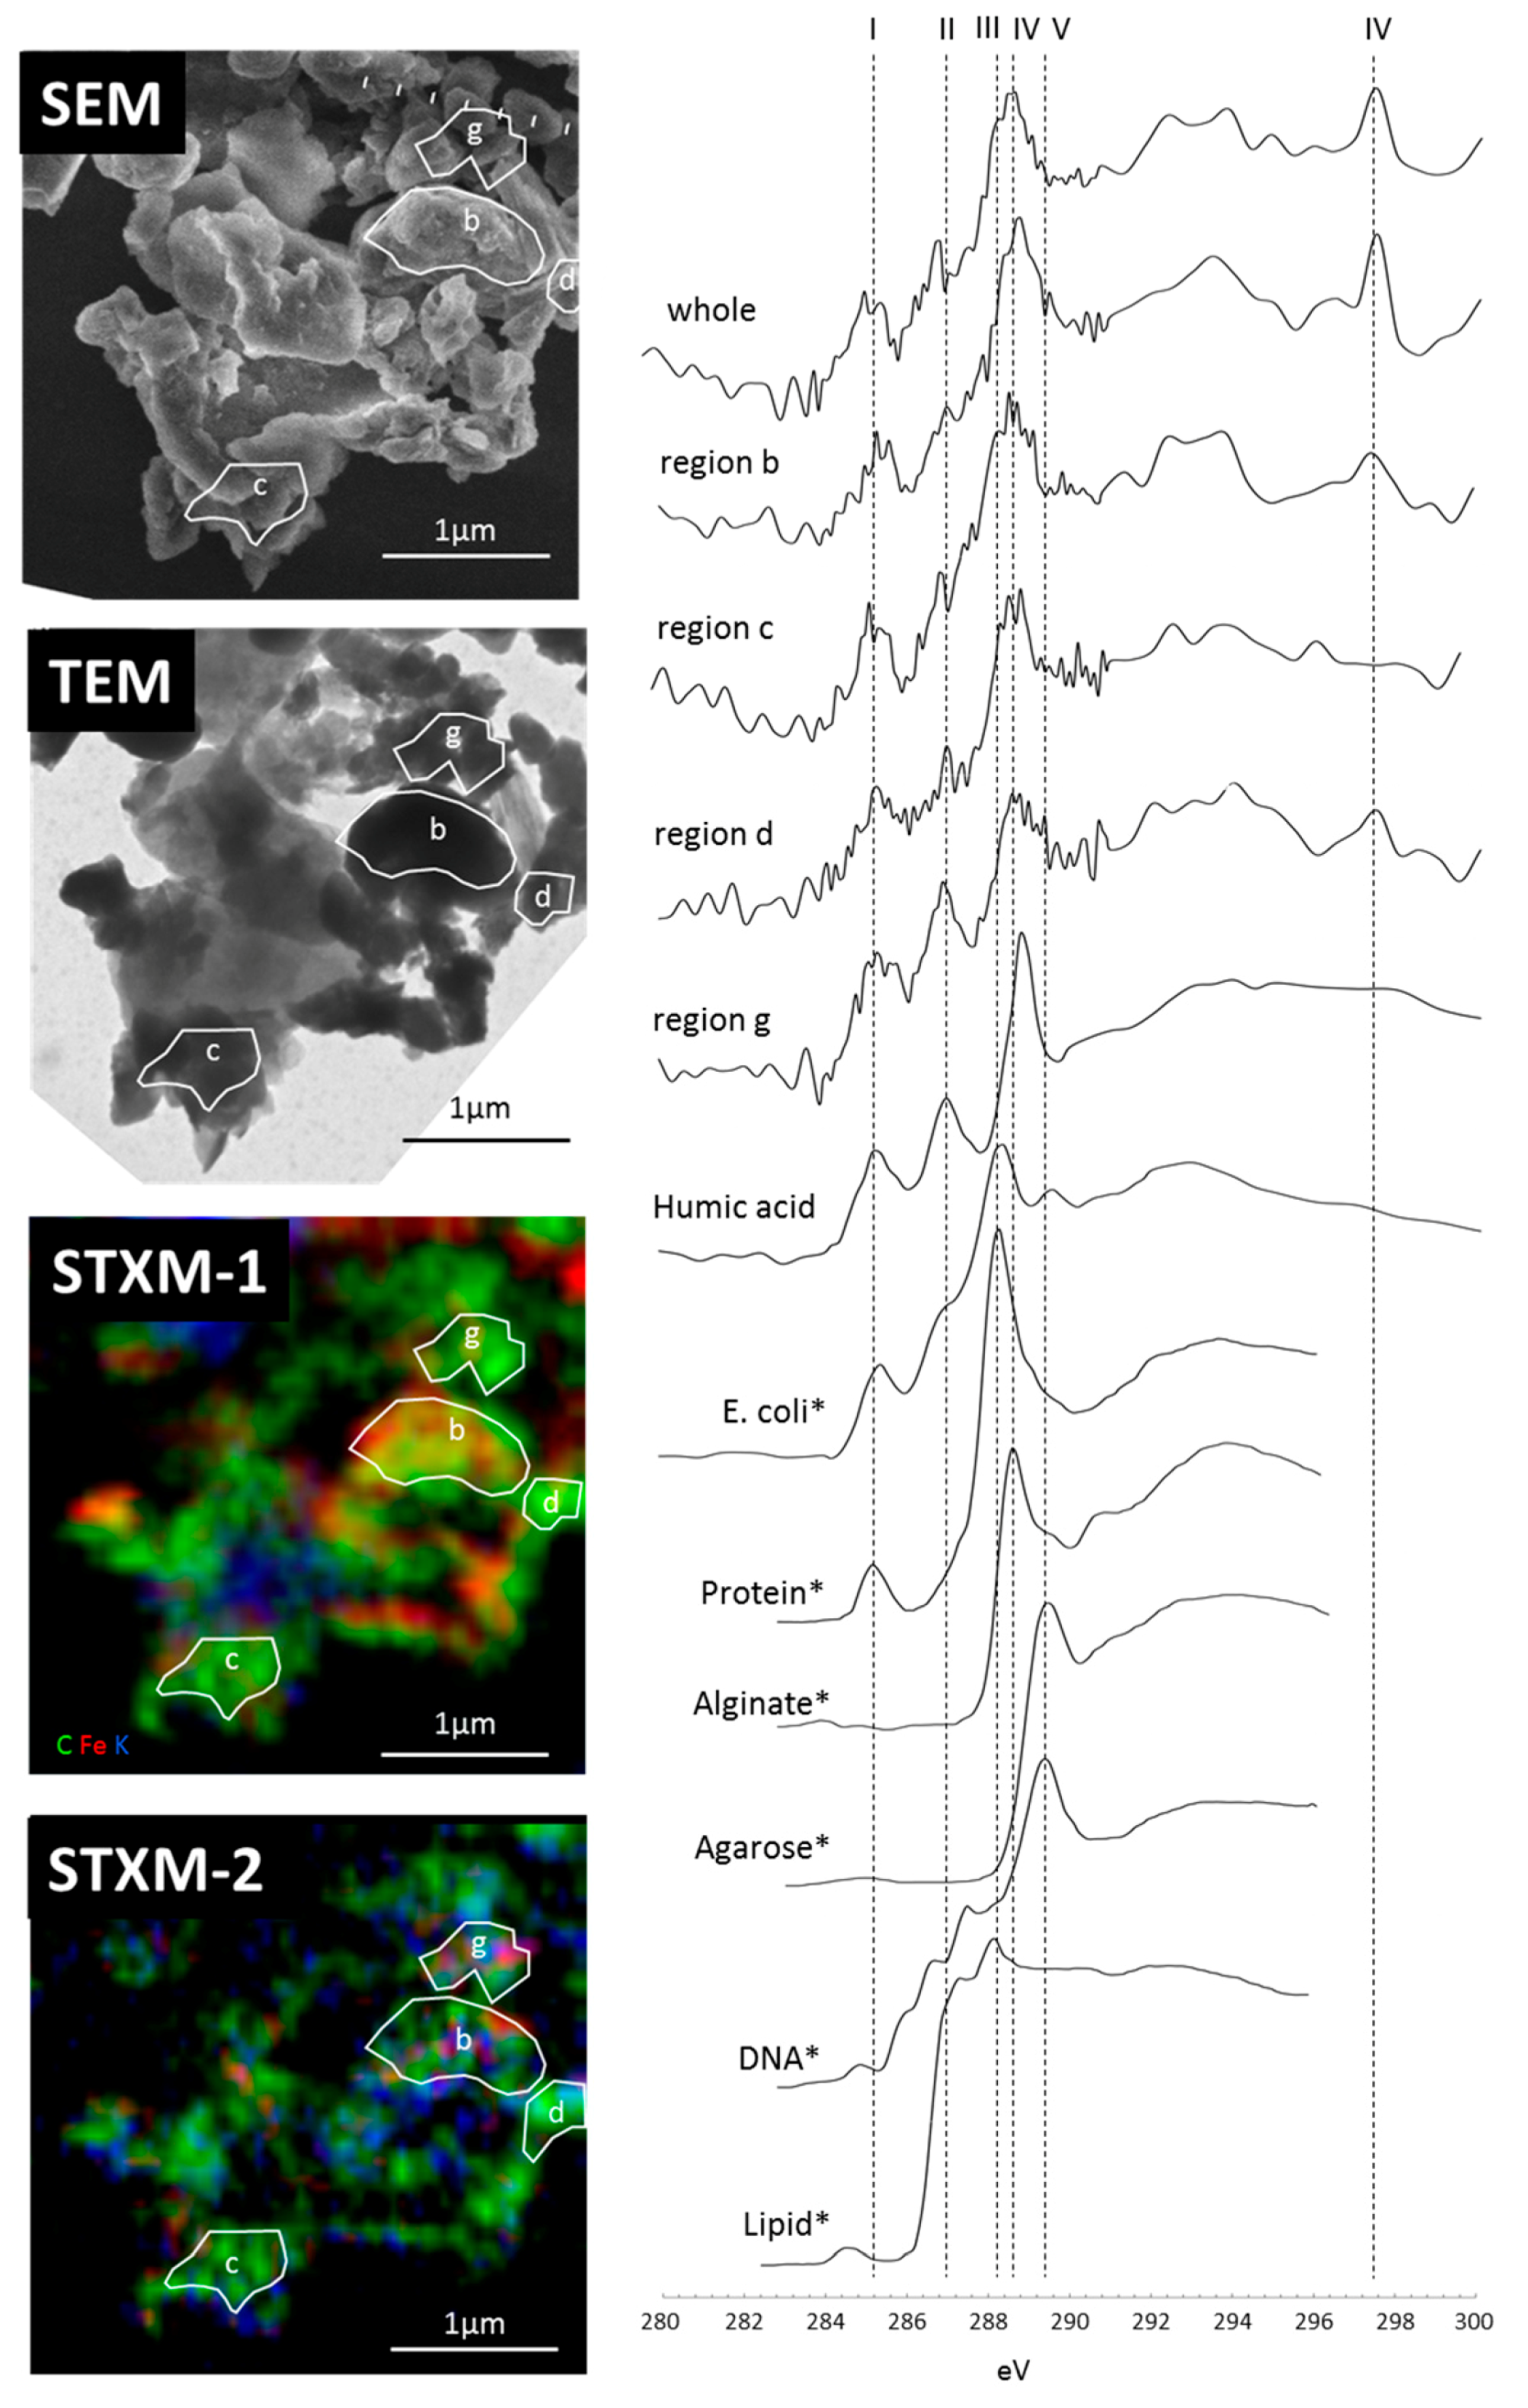
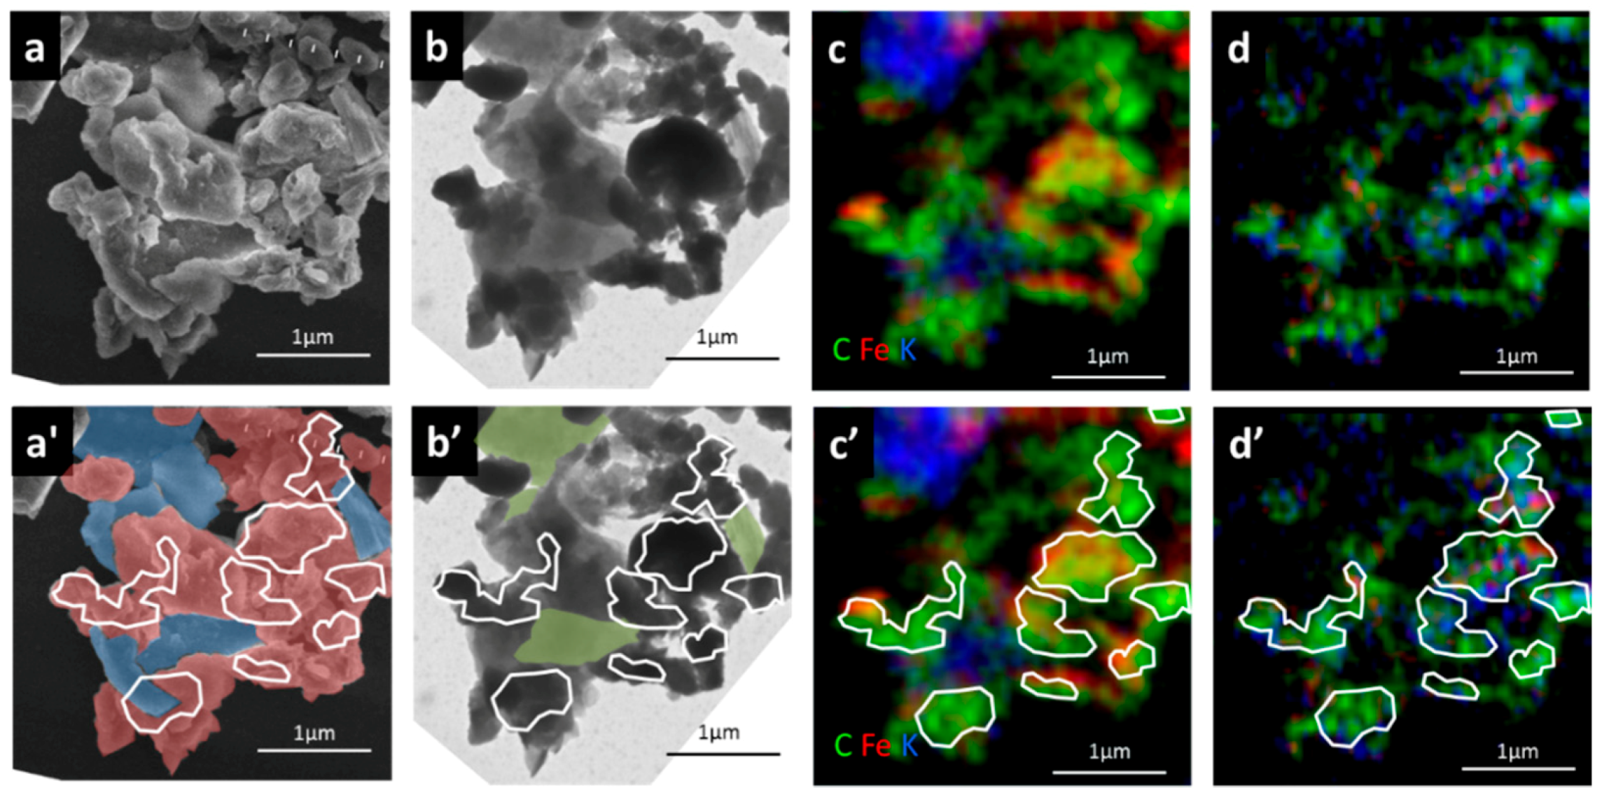
3.2. Carbon Distribution and Chemical Composition within the Selected Organo-Mineralaggregate

The selected area, a few micron-sized aggregate (Figure S1) isolated from the 0.2–2 µm fraction was examined for physical features (Figure 1a,b), elemental distribution (Figure 1c), and C composition at nanometer scales. The STXM-NEXAFS image showed heterogeneous spatial variations of organic C and Fe within the selected aggregate (Figure 1c). FE-SEM/EDX showed the dominance of Al, Si, and O. Their spatial distribution was almost identical, whereas that of Fe was slightly different from the other elements on the aggregate surface (Figure S2). The carbon was distributed throughout the entire region except for potassium-rich domain (upper left region in Figure 1c). The regions showing greater surface roughness and coagulation by SEM and TEM (Figure 1a,b) had relatively high adsorption intensity of carbon K-edge photon energy (284–290 eV) (Figure 1a’–c’). The whole sample showed peaks at near 285.4 (aromatic C), 286.9 (phenolic and ketonic), 288.7 (calboxylic/carbonyl-C amide carbonyl C) (Figure 2). The spectrum obtained from the whole sample showed a relatively broad peak compared to standard materials (Figure 2). Though aliphatic C was not clear, the whole region’s spectral shape showed slight resemblance to E. coli for amide peak at 288.2 eV and to humic acid for the three peaks at 285.2, 287.3, and 288.8 eV. To show the C chemical composition map, we split the C K-edge spectra three energy regions, 284–286 eV (aromatic C), 286–287 eV (phenol and aliphatic C), and 287–289 eV (amide and carboxyl C) (Figure 1d).

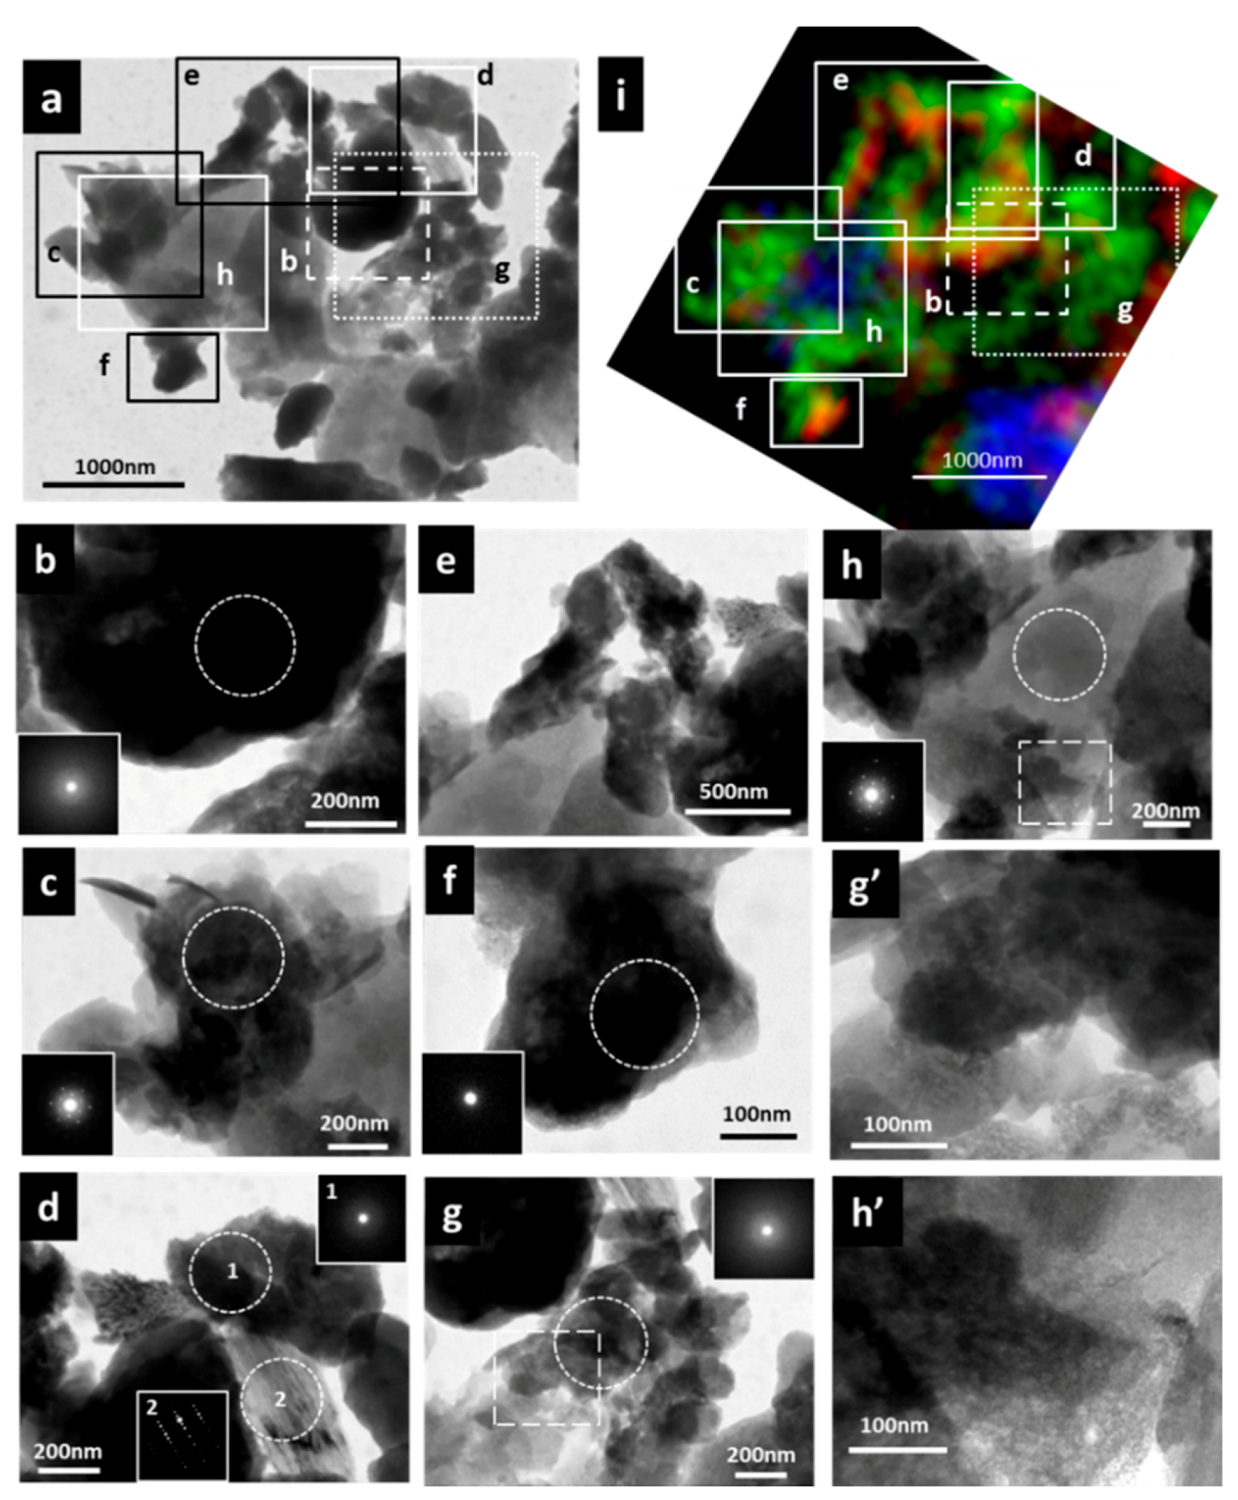
3.3. Micro-Morphological Observation and Electron Diffraction Analysis by TEM and NEXAFS Spectrum within Specific Area

High-resolution images obtained by FE-SEM (Figure 1a) and TEM (Figure 1b) showed high spatial complexity within the selected aggregate. The aggregate had both smooth and rough surface regions (Figure 1a’). The rough surface regions were characterized by aggregation of smaller particles of diverse shapes (Figure 1a’ with red), whereas smooth surface regions showed little aggregated features (Figure 1a’ in blue) and no overlap or stacking of mineral particles (Figure 1b’ with green). Most of the smooth surface regions observed by SEM (Figure 1a’ in blue) corresponded to the regions of no overlapping particles (Figure 1b’ in green). However, a few regions of smooth surface showed particle overlaps and such regions (e.g., bottom polygon in Figure 1a’,b’). All regions of high C intensity corresponded to the rough surface or particle-overlapped regions (Figure 1a’,c’).
We further examined microstructure, diffraction pattern, and elemental composition of specific regions within the aggregate by TEM-EDX to assess potential factors controlling the observed physicochemical complexity (Figure 3). The studied aggregate showed various morphological features with a diffused diffraction pattern. A few crystalline minerals were also present. We chose seven regions based on the variation in physical feature and C intensity (Figure 3a–i) to cover most of the whole aggregate. The regions having strong C adsorption intensity by STXM-NEXAFS (Figure 3b,d-1,f,g) showed diffused diffraction pattern except for region c. Region c is categorized as the region of smooth surface (Figure 1a’ with blue) with overlapping particles (Figure 1b’ with green), possibly indicating aggregates of nano-sized crystalline minerals. Nano-sized repeating patterns, indicative of amorphous or poorly-crystalline mineral structure, were observed in two regions (Figure 3g’,h’). In contrast, the regions having almost no C intensity showed crystalline diffraction pattern (Figure 3d,h). TEM-EDX analysis showed the presence of Al and Si in the C-rich regions with diffused diffraction pattern (Figure S3).
The C K-edge spectra among the selected regions (Figure 3b–d,g) were slightly different among the four selected areas (Figure 2, region b,c,d, and g). Even when focusing on narrow regions, the spectrum showed broader peaks compared to standard materials (Figure 2). Especially, the spectral shape from 288.2 eV to 289.4 eV was broader and stronger. Amide and carboxylic C peaks were clear in all four regions (Figure 2). Only the region g showed clear peak of aliphatic C and the spectrum shape was relatively similar to humic acid in this region (Figure 2).

4. Discussion

4.1. Reactive Inorganic (RI) Phase Control on OM Distribution within Particle

The bulk fraction characterization suggested that organo-metal/mineral nanocomposite (OMN) was more abundant in the 0.2–2 µm fraction (not just in the single aggregate analyzed) compared to bulk soil for two reasons. First, high content and distribution of reactive inorganic (RI) phase in the 0.2–2 µm fraction shown previously [42] initially led us to predict the abundance of OMN. Specifically, the 0.2–2 µm fraction accounted for 50%, 51%, and 50% of total oxalate-extractable Al (Alo) and Si (Sio) and Fe (Feo) in the bulk soil, respectively (Table 1). This fraction also showed higher concentrations of pyrophosphate-extractable Al (Alp) and Fe (Fep) compared to bulk soil, representing 50–60% of total Alp and Fep (Table 1) [42]. Second, we also considered that high SSA of RI phase and the strong reduction in SSA by organic coverage may be used as indices of OMN abundance. Relatively high SSAoxidized of the 0.2–2 µm fraction (172 m2 g−1, Table 2) suggested the presence of RI phase, particularly SRO minerals, in addition to crystalline minerals because SSA of allophane is reported to be 581 m2 g−1 by N2 [62], 731 m2 g−1 by H2O [63] and 700–1100 m2 g−1 by ethylene glycol monomethyl ether [64], and that of crystalline minerals is much lower, typically <50 m2 g−1 [65,66], respectively. In addition, the degree of SSA liberated by OM oxidation was quite high in the 0.2–2 µm fraction (Table 2). Similar patterns were found for the <0.2 µm fraction as well. These results suggest that OMN is more concentrated in the <2 µm fractions. The 0.2–2 µm fraction is likely to hold the largest mass of OMN in this soil as it accounted for highest proportions of mass, OM, and RI phase among the fractions (Table 2).
We identified two distinctive regions within the observed aggregate (Figure 1a,b). The rough surface regions were characterized by the aggregation of smaller particles of diverse shapes (Figure 1a’ with red, Figure 3b–g). The smooth surface regions showed crystalline mineralogy with little aggregated features (Figure 1a’ in blue, Figure 1b’ in green, and Figure 3d,h). We can interpret the rough surface regions as the spots rich in RI phase because of amorphous mineralogy based on diffused electron diffraction patterns by TEM (Figure 3b,d,f,g) and clear EDS peaks of Al and Si (to a lesser extent, Fe) (Figures S2 and S3). Previous studies have shown high surface roughness and microporosity [15,32,67] as well as much smaller sizes of RI phase compared to crystalline mineral phases [17,30]. The location of the rough surface regions on the observed aggregate was largely overlapped with C-rich regions identified by STXM-NEXAFS (Figure 1c’ and Figure 2d’). In contrast, the smooth surface regions largely corresponded to single crystalline mineral without apparent stacking or aggregation (Figure 1b’) and showed little C (Figure 1c’ and Figure 2d’). These results suggest that C spatial distribution more strongly co-varied with RI phase than with crystalline minerals within the sonication-resistant aggregate, in support of our hypothesis. The small size and other physicochemical characteristics of the rough surface regions further suggest that these regions correspond to OMN which was suggested to be present in relatively high quantity in the 0.2–2 µm fraction based on the bulk fraction characterization [42].
We need careful interpretation of these results due to the possible re-aggregation which might have occurred after the particle-size fractionation. Although it is difficult to distinguish in-situ aggregation in field from the laboratory artifact, OMN is the presumed building block having high physical stability even against the maximum dispersion level [42]. Thus the presence and characteristics of OMN shown in the current study is unlikely to be affected by the anticipated re-aggregation. However, the spatial distribution of OMN (rough vs. smooth surface region) can be strongly influenced by the re-aggregation. This aspect should be more carefully examined in future studies.

4.2.Carbon Forms of the Organo-Mineral/Metal Nanocomposit

The STXM-NEXAFS analyses clearly showed heterogeneous distribution of organic C within the studied aggregate (Figure 1c,d). The whole observed region and four C-rich regions selected showed the dominance of amide and carboxylic C, suggesting that potentially-labile C was the main C form in the observed regions and thus presumably in OMN. These compounds appeared to be microbially-derived because the 0.2–2 µm fraction had lower C:N ratio and greater enrichment of 13C and 15N than 2–53 µm fraction and bulk soil [43].
Carbon functional group chemistry assessed by NEXAFS was slightly different among the four regions (Figure 3). The NEXAFS spectrum of whole aggregate, region b, c, and d showed weak peak of aliphatic C (287.3 eV) and had a limited resemblance to standard materials of humic acid, E. coli, and protein (Figure 2). On the other hand, the spectrum from region g showed more clear peaks especially in aliphatic C (287.3 eV), indicating higher similarity to the humic acid standard compared to the whole aggregate and the three other focused regions (Figure 2). Selective enrichment of aliphatic C on mineral surface during microbial transformation was reported in micro regions of fungal hypha in association with soil bacteria and iron oxides [50]. Thus the OM in the region g may be more microbially-reworked than the other regions. Preferential accumulation of microbially-derived compounds in smaller particle-size fractions has been documented from other soil types [13,49].
Aromatic C has been reported to be a major form stabilized C in some Andisols via preservation of pyrogenic C [68] and/or sorption of high C:N plant derived organic matter onto RI phase [69]. In our study, however, the solid-state 13C-NMR showed lower aromatic C in the 0.2–2 µm fraction compared to the 2–53 µm fraction and bulk soil sample [43]. C-NEXAFS could distinguish the source of aromatic C between char and non-pyrogenic compounds. Our spectra showed weak signal of fresh char peaks at 284.9 eV (protonated/alkylated aromatic C) and 286.2 eV (unsaturated/carbonyl substituted aromatic-C) and resembled more the aromatic C peaks from humic acid and bacteria at 285.5 eV (protonated/alkylated aromatic C) [70,71]. These results imply greater microbial contribution to OM accumulation in the studied aggregate compared to pyrogenic C. However, the presence of highly-altered, old char [72,73] or phenolic compounds cannot be ruled out for the studied Andisol due to our focus on the single aggregate from the 0.2–2 µm fraction and relatively negative Δ14C in this fraction, −114.8‰ (Table 2). The dominance of amide and carboxylic C groups with old radiocarbon age has been shown for shaking-resistant aggregates of intermediate-density range from other soil types [74].
These results suggest that the observed C-rich regions (and thus OMN) contain mixed organic compounds varying in the degrees of microbial alteration. Solomon et al. (2012) showed high complexity of the organic C functionalities and coexistence of various inorganic compounds in the thin sections from an undisturbed microaggregate of tropical Ultisol using STXM-NEXAFS [26]. They suggested that C stabilization in micro- and nano-scale regions occurred from cumulative results of physical protection and multiple chemical-binding mechanisms on external and internal surface of clay minerals [26,47]. Our results further showed the variation in C functionalities even within the single sonication-resistant aggregate isolated from the size-sorted fraction for the studied Andisol.

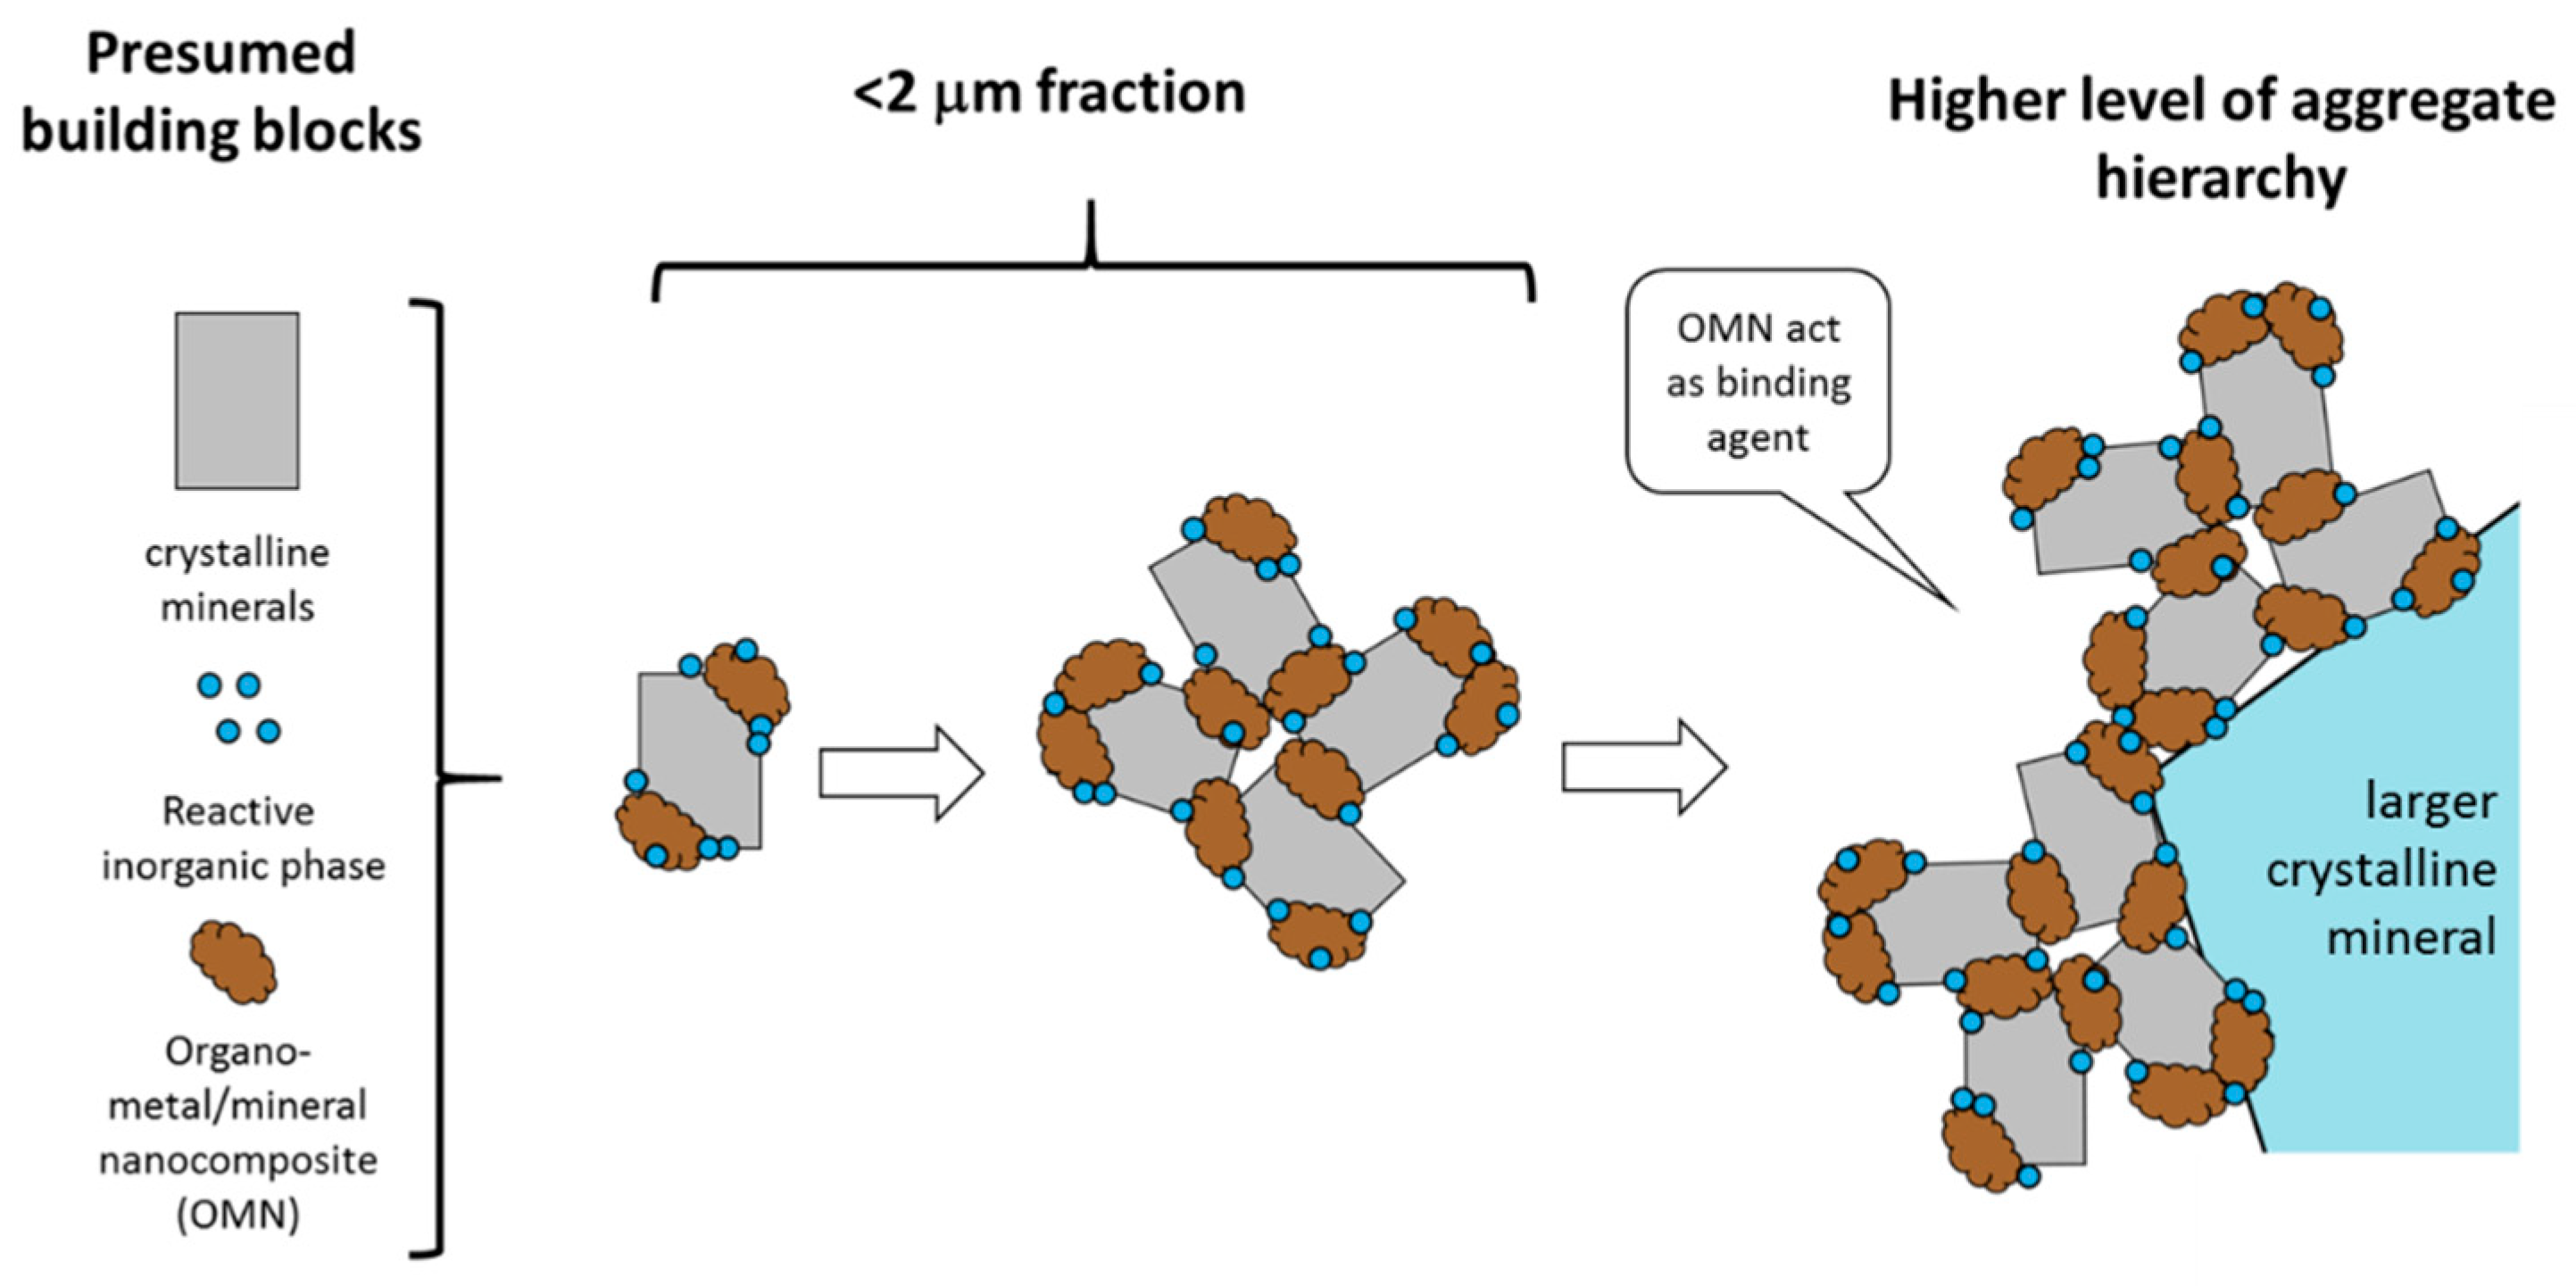
4.3. Organo Mineral/Metal Nanocomposite Act as Binding Agents

One of the least understood aspects of organo-mineral interaction in soil is the nature of binding agents that lead to microaggregate formation [21,25,42]. Based on the C, N, and selectively-extractable Fe and Al contents of the size fractions isolated after different aggregate dispersion levels, we previously suggested that the <2 µm fractions released after the maximum dispersion acted as major binding agents to form the robust hierarchical structure in the studied Andisol. By focusing on one aggregate from the 0.2–2 µm fraction, we attempted to identify the particles or regions within the aggregate that could serve as binding agents. In the few-µm-sized aggregate (Figure 1), we identified the rough surface regions that show the features corresponding to OMN. In addition, the C composition of the OMN-rich regions showed some variation, implying that the organic compounds were under various degradation stages. The bulk 0.2–2 µm fraction showed less negative Δ14C value compared to the 2–53 µm fraction (Table 2), indicating the presence of more modern C.
From these results, we hypothesize that OMN acts as a main binding agent in Andisol aggregate formation at submicron to micron scales (Figure 4). We consider two important roles of OMN in the 0.2–2 µm fraction: (i) formation of the rough surface and binding with crystalline minerals to form the aggregates of 0.2–2 µm size range as observed in Figure S1 (depicted in Figure 4 middle), and (ii) development of hierarchical structure via binding between the 0.2–2-µm-sized aggregates and their adhesion to larger mineral particles that have low surface reactivity (e.g., quartz, Figure 4 right). The latter role may be linked to the presence of OMN on outer surfaces of the 0.2–2-µm-sized aggregates. While the OMN in the 0.2–2 µm fraction appeared to be located on N2 gas accessible surfaces (Table 2), this aspect needs further assessment by other techniques due to the potential effect of unwanted re-aggregation and the inherent difficulty of estimating the SSA of RI phase.
From a pedogenesis perspective, the hypothesized roles of OMN are achieved by the association of RI phase, formed via mineral weathering, with microbially-altered compounds (i.e., the new formation of OMN). Formation of highly reactive secondary minerals (RI phase) from the weathering of volcanic parent material is a major pedogenic process in Andisols [29,32], which leads to a relatively rapid formation of organo-metal or organo-mineral associations [31,75,76]. These associations may form in decadal time scale according to the recent study comparing the same soil used in the current study with an adjacent soil under no-tillage with litter compost addition over the last 28 years [77]. Appreciable levels of radiocarbon tracer derived from the compost were detected in the shaking-resistant aggregates of an intermediate-density range (2.0–2.5 g cm−3) where major portions of C and N (58–81%), oxalate- and pyrophosphate-extractable Al and Fe (79–86%), and thus presumably OMN were present [77,78]. The formation of the nanocomposites rich in OM with less-crystalline Al phase from gibbsite during microbial litter decomposition was observed in less than half a year [79], implying similar or faster rates of OMN formation in Andisol surface horizon where both labile OM and weatherable minerals are abundant. The overall importance of nano-scale interaction at mineral weathering front on soil OM stabilization has recently been pointed out [67]. We further propose that these nano-scale interactions may lead to the formation of OMN, which acts as a persistent binding agent for the development of hierarchical aggregate structure, thereby exerting further physical constraints for microbial access to and degradation of OM in soil. These results, together with growing evidence of preferential stabilization of microbially-processed compounds in soil [12,80,81,82,83], suggest that these nanocomposites may play a major role in SOM stabilization and aggregation in a wider range of soil types. Further research using intact microaggregates is needed to establish the functional relationship between OMN accumulation and aggregation-induced physical protection of soil OM.

4.4. Concluding Remarks

We examined the spatial complexity present at submicron scale by conducting a detailed observation and analyses of a single, physically-fractionated aggregate. While further efforts to examine other aggregates, fractions, and soil types are warranted, our results provide the first evidence of the linkage among SOM (concentration and carbon chemistry), micromorphology, and soil mineralogy at nanoscales. This was achieved by a coupling of STXM-NEXAFS with electron microscopy (SEM, and TEM/XRD/EDX). High spatial heterogeneity within the single aggregate isolated from the 0.2–2-µm size fraction even after the maximum level of dispersion (Figure 1 and Figure 3) corroborates the previous work [84] which showed the absence of homogenous “primary particle” proposed earlier as the basic building block [85]. By the maximum dispersion, we reached the lowest level of aggregate hierarchy operationally possible and were able to characterize the organo-mineral associations occurring at the fundamental level. The spatial overlap of organic matter, RI phase, and surface roughness identified here has an important implication across spatial scales. Strong association of organic matter with RI phase has been demonstrated by C-metal correlations among a wide range of field soils including Andisols [36,39,40], by Δ14C-metal correlations in chronosequence soils [86,87], and among soil physical fractions [37,77]. Our observation at micron to submicron scale may provide a mechanistic reason for these correlations. SOM stability may be enhanced by the OM binding with RI phase (formation of organo-metal/mineral nanocomposite) via structural development of aggregate (physical entrapment of OM). The roles of the nanocomposite proposed here (Figure 4) may help to bridge the knowledge gap between physical aggregation process and biogeochemical reactions taking place within soil physical structure.

Supplementary Materials

The following are available online at https://www.mdpi.com/2571-8789/2/2/32/s1. Figure S1: SEM images of 0.2–2 μm size fraction dispersed on Si3N4 window. (a) White square showed tested aggregate; (b–d) Magnified images of other aggregates. Scale bar is equal to 10 µm in (a); 2 µm in (b–d). Figure S2: Elemental maps by SEM-EDX. Figure S3: TEM-EDX spectrum obtained from same area in Figure 2b–d.

Author Contributions

M.A., N.Y., and R.W. conceived and designed the experiments; M.A., N.Y., Y.T., H.S., Y.T., and R.W. performed STXM analysis; M.M. performed TEM/EDX analysis; M.A. and R.W. performed the other analyses; all contributed to the discussion of the results; M.A. and R.W. wrote the paper.

Funding

This research was supported by Japan Society for the Promotion of Science NEXT Program (GR091), Grant-in-Aid for Scientific Research (B) JP15H02810, and JP15K18659. This work was performed under the approval of the Photon Factory Program Advisory Committee (Proposal No. 2013S2-003 and 2016S2-002).

Acknowledgments

We thank S. Wakabayashi, and Y. Yaegaki for laboratory assistance, S. Hiradate for valuable discussion, and Y. Shirato, M. Kajiura and C. Hayakawa for their supports throughout the project. Valuable comments by three anonymous reviewers are gratefully acknowledged.

Conflicts of Interest

The authors declare no conflict of interest. The founding sponsors had no role in the design of the study; in the collection, analyses, or interpretation of data; in the writing of the manuscript, and in the decision to publish the results.

References

  1. Schmidt, M.W.I.; Torn, M.S.; Abiven, S.; Dittmar, T.; Guggenberger, G.; Janssens, I.A.; Kleber, M.; Kogel-Knabner, I.; Lehmann, J.; Manning, D.A.C.; et al. Persistence of soil organic matter as an ecosystem property. Nature 2011, 478, 49–56. [Google Scholar] [CrossRef] [PubMed]
  2. Wieder, W.R.; Boehnert, J.; Bonan, G.B. Evaluating soil biogeochemistry parameterizations in earth system models with observations. Glob. Biogeochem. Cycle 2014, 28, 211–222. [Google Scholar] [CrossRef]
  3. Luo, Y.Q.; Keenan, T.F.; Smith, M. Predictability of the terrestrial carbon cycle. Glob. Chang. Biol. 2015, 21, 1737–1751. [Google Scholar] [CrossRef] [PubMed]
  4. Satoh, T.; Yamane, I. Studies on the separation of naturally occurring organo-mineral complexes. 2. Studies by means of densimetric fractionation. J. Sci. Soil Manure 1972, 43, 63–65. [Google Scholar]
  5. Turchenek, L.W.; Oades, J.M. Fractionation of organomineral complexes by sedimentation and density techniques. Geoderma 1979, 21, 311–343. [Google Scholar] [CrossRef]
  6. Sollins, P.; Homann, P.; Caldwell, B.A. Stabilization and destabilization of soil organic matter: Mechanisms and controls. Geoderma 1996, 74, 65–105. [Google Scholar] [CrossRef]
  7. Baldock, J.A.; Skjemstad, J.O. Role of the soil matrix and minerals in protecting natural organic materials against biological attack. Org. Geochem. 2000, 31, 697–710. [Google Scholar] [CrossRef]
  8. Lutzow, M.V.; Kogel-Knabner, I.; Ekschmitt, K.; Matzner, E.; Guggenberger, G.; Marschner, B.; Flessa, H. Stabilization of organic matter in temperate soils: Mechanisms and their relevance under different soil conditions—A review. Eur. J. Soil Sci. 2006, 57, 426–445. [Google Scholar] [CrossRef]
  9. Lehmann, J.; Kleber, M. The contentious nature of soil organic matter. Nature 2015, 528, 60–68. [Google Scholar] [CrossRef] [PubMed]
  10. Mayer, L.M. Relationships between mineral surfaces and organic-carbon concentrations in soils and sediments. Chem. Geol. 1994, 114, 347–363. [Google Scholar] [CrossRef]
  11. Mayer, L.M.; Xing, B.S. Organic matter-surface area relationships in acid soils. Soil Sci. Soc. Am. J. 2001, 65, 250–258. [Google Scholar] [CrossRef]
  12. Vogel, C.; Mueller, C.W.; Hoschen, C.; Buegger, F.; Heister, K.; Schulz, S.; Schloter, M.; Kogel-Knabner, I. Submicron structures provide preferential spots for carbon and nitrogen sequestration in soils. Nat. Commun. 2014, 5, 2947. [Google Scholar] [CrossRef] [PubMed]
  13. Lehmann, J.; Kinyangi, J.; Solomon, D. Organic matter stabilization in soil microaggregates: Implications from spatial heterogeneity of organic carbon contents and carbon forms. Biogeochemistry 2007, 85, 45–57. [Google Scholar] [CrossRef]
  14. Kögel-Knabner, I.; Guggenberger, G.; Kleber, M.; Kandeler, E.; Kalbitz, K.; Scheu, S.; Eusterhues, K.; Leinweber, P. Organo-mineral associations in temperate soils: Integrating biology, mineralogy, and organic matter chemistry. J. Plant Nutr. Soil Sci. 2008, 171, 61–82. [Google Scholar] [CrossRef]
  15. Filimonova, S.; Kaufhold, S.; Wagner, F.E.; Häusler, W.; Kögel-Knabner, I. The role of allophane nano-structure and fe oxide speciation for hosting soil organic matter in an allophanic andosol. Geochim. Cosmochim. Acta 2016, 180, 284–302. [Google Scholar] [CrossRef]
  16. Kaiser, K.; Guggenberger, G. Mineral surfaces and soil organic matter. Eur. J. Soil Sci. 2003, 54, 219–236. [Google Scholar] [CrossRef]
  17. Calabi-Floody, M.; Bendall, J.S.; Jara, A.A.; Welland, M.E.; Theng, B.K.G.; Rumpel, C.; Mora, M.d.l.L. Nanoclays from an andisol: Extraction, properties and carbon stabilization. Geoderma 2011, 161, 159–167. [Google Scholar] [CrossRef]
  18. Barré, P.; Fernandez-Ugalde, O.; Virto, I.; Velde, B.; Chenu, C. Impact of phyllosilicate mineralogy on organic carbon stabilization in soils: Incomplete knowledge and exciting prospects. Geoderma 2014, 235–236, 382–395. [Google Scholar] [CrossRef]
  19. Eusterhues, K.; Rumpel, C.; Kogel-Knabner, I. Organo-mineral associations in sandy acid forest soils: Importance of specific surface area, iron oxides and micropores. Eur. J. Soil Sci. 2005, 56, 753–763. [Google Scholar] [CrossRef]
  20. Mikutta, R.; Kaiser, K.; Dörr, N.; Vollmer, A.; Chadwick, O.A.; Chorover, J.; Kramer, M.G.; Guggenberger, G. Mineralogical impact on organic nitrogen across a long-term soil chronosequence (0.3–4100kyr). Geochim. Cosmochim. Acta 2010, 74, 2142–2164. [Google Scholar] [CrossRef]
  21. Six, J.; Bossuyt, H.; Degryze, S.; Denef, K. A history of research on the link between (micro)aggregates, soil biota, and soil organic matter dynamics. Soil Tillage Res. 2004, 79, 7–31. [Google Scholar] [CrossRef]
  22. Fukumasu, J.; Shaw, L.J. The role of macro-aggregation in regulating enzymatic depolymerization of soil organic nitrogen. Soil Biol. Biochem. 2017, 115, 100–108. [Google Scholar] [CrossRef]
  23. Zimmerman, A.R.; Goyne, K.W.; Chorover, J.; Komarneni, S.; Brantley, S.L. Mineral mesopore effects on nitrogenous organic matter adsorption. Org. Geochem. 2004, 35, 355–375. [Google Scholar] [CrossRef]
  24. McCarthy, J.F.; Ilavsky, J.; Jastrow, J.D.; Mayer, L.M.; Perfect, E.; Zhuang, J. Protection of organic carbon in soil microaggregates via restructuring of aggregate porosity and filling of pores with accumulating organic matter. Geochim. Cosmochim. Acta 2008, 72, 4725–4744. [Google Scholar] [CrossRef]
  25. Totsche, K.U.; Amelung, W.; Gerzabek, M.H.; Guggenberger, G.; Klumpp, E.; Knief, C.; Lehndorff, E.; Mikutta, R.; Peth, S.; Prechtel, A.; et al. Microaggregates in soils. J. Plant Nutr. Soil Sci. 2017, 18, 64–73. [Google Scholar] [CrossRef]
  26. Solomon, D.; Lehmann, J.; Harden, J.; Wang, J.; Kinyangi, J.; Heymann, K.; Karunakaran, C.; Lu, Y.; Wirick, S.; Jacobsen, C. Micro- and nano-environments of carbon sequestration: Multi-element stxm–nexafs spectromicroscopy assessment of microbial carbon and mineral associations. Chem. Geol. 2012, 329, 53–73. [Google Scholar] [CrossRef]
  27. Oades, J.M.; Waters, A.G. Aggregate hierarchy in soils. Soil Res. 1991, 29, 815–828. [Google Scholar] [CrossRef]
  28. Tisdall, J.M.; Oades, J.M. Organic-matter and water-stable aggregates in soils. J. Soil Sci. 1982, 33, 141–163. [Google Scholar] [CrossRef]
  29. Dahlgren, R.A.; Saigusa, M.; Ugolini, F.C. The nature, properties and management of volcanic soils. Adv. Agron. 2004, 82, 113–182. [Google Scholar]
  30. Kitagawa, Y. Unit particle of Allophane. Am. Miner 1971, 56, 465–475. [Google Scholar]
  31. Basile-Doelsch, I.; Amundson, R.; Stone, W.E.E.; Borschneck, D.; Bottero, J.Y.; Moustier, S.; Masin, F.; Colin, F. Mineral control of carbon pools in a volcanic soil horizon. Geoderma 2007, 137, 477–489. [Google Scholar] [CrossRef]
  32. Levard, C.; Doelsch, E.; Basile-Doelsch, I.; Abidin, Z.; Miche, H.; Masion, A.; Rose, J.; Borschneck, D.; Bottero, J.Y. Structure and distribution of allophanes, imogolite and proto-imogolite in volcanic soils. Geoderma 2012, 183–184, 100–108. [Google Scholar] [CrossRef]
  33. Thompson, A.; Rancourt, D.G.; Chadwick, O.A.; Chorover, J. Iron solid-phase differentiation along a redox gradient in basaltic soils. Geochim. Cosmochim. Acta 2011, 75, 119–133. [Google Scholar] [CrossRef]
  34. Nanzyo, M.; Dahlgren, R.; Shoji, S. Chemical characteristics of volcanic ash soils. In Volcanic Ash Soils. Development in Soil Sciences; Shoji, S., Nanzyo, M., Dahlgren, R., Eds.; Elsevier Science Publishers: Amsterdam, The Netherlands, 1993; pp. 145–187. [Google Scholar]
  35. Takahashi, T.; Dahlgren, R.A. Nature, properties and function of aluminum–humus complexes in volcanic soils. Geoderma 2016, 263, 110–121. [Google Scholar] [CrossRef]
  36. Wada, K.; Higashi, T. Categories of aluminum-humus and iron-humus complexes in ando soils determined by selective dissolution. J. Soil Sci. 1976, 27, 357–368. [Google Scholar] [CrossRef]
  37. Shang, C.; Tiessen, H. Organic matter stabilization in two semiarid tropical soils: Size, density, and magnetic separations. Soil Sci. Soc. Am. J. 1998, 62, 1247–1257. [Google Scholar] [CrossRef]
  38. Parfitt, R.L.; Childs, C.W. Estimation of forms of fe and al—A review, and analysis of contrasting soils by dissolution and mossbauer methods. Aust. J. Soil Res. 1988, 26, 121–144. [Google Scholar] [CrossRef]
  39. Garrido, E.; Matus, F. Are organo-mineral complexes and allophane content determinant factors for the carbon level in chilean volcanic soils? Catena 2012, 92, 106–112. [Google Scholar] [CrossRef]
  40. Percival, H.J.; Parfitt, R.L.; Scott, N.A. Factors controlling soil carbon levels in New Zealand grasslands: Is clay content important? Soil Sci. Soc. Am. J. 2000, 64, 1623–1630. [Google Scholar] [CrossRef]
  41. Matus, F.; Garrido, E.; Sepúlveda, N.; Cárcamo, I.; Panichini, M.; Zagal, E. Relationship between extractable al and organic c in volcanic soils of chile. Geoderma 2008, 148, 180–188. [Google Scholar] [CrossRef]
  42. Asano, M.; Wagai, R. Evidence of aggregate hierarchy at micro- to submicron scales in an allophanic andisol. Geoderma 2014, 216, 62–74. [Google Scholar] [CrossRef]
  43. Asano, M.; Wagai, R. Distinctive organic matter pools among particle-size fractions detected by solid-state13C-NMR, δ13C and δ15N analyses only after strong dispersion in an allophanic andisol. Soil Sci. Plant Nutr. 2014, 61, 242–248. [Google Scholar] [CrossRef]
  44. Baldock, J.A.; Oades, J.M.; Waters, A.G.; Peng, X.; Vassallo, A.M.; Wilson, M.A. Aspects of the chemical-structure of soil organic materials as revealed by solid-state c-13 nmr-spectroscopy. Biogeochemistry 1992, 16, 1–42. [Google Scholar] [CrossRef]
  45. Schumacher, M.; Christl, I.; Scheinost, A.C.; Jacobsen, C.; Kretzschmar, R. Chemical heterogeneity of organic soil colloids investigated by scanning transmission X-ray microscopy and c-1s nexafs microspectroscopy. Environ. Sci. Technol. 2005, 39, 9094–9100. [Google Scholar] [CrossRef] [PubMed]
  46. Kinyangi, J.; Solomon, D.; Liang, B.; Lerotic, M.; Wirick, S.; Lehmann, J. Nanoscale biogeocomplexity of the organomineral assemblage in soil. Soil Sci. Soc. Am. J. 2006, 70, 1708–1718. [Google Scholar] [CrossRef]
  47. Xiao, J.; He, X.; Hao, J.; Zhou, Y.; Zheng, L.; Ran, W.; Shen, Q.; Yu, G. New strategies for submicron characterization the carbon binding of reactive minerals in long-term contrasting fertilized soils: Implications for soil carbon storage. Biogeosciences 2016, 13, 3607–3618. [Google Scholar] [CrossRef]
  48. Stuckey, J.W.; Yang, J.; Wang, J.; Sparks, D.L. Advances in scanning transmission X-ray microscopy for elucidating soil biogeochemical processes at the submicron scale. J. Environ. Q. 2017, 46, 1166–1174. [Google Scholar] [CrossRef] [PubMed]
  49. Chen, C.; Dynes, J.J.; Wang, J.; Karunakaran, C.; Sparks, D.L. Soft X-ray spectromicroscopy study of mineral-organic matter associations in pasture soil clay fractions. Environ. Sci. Technol. 2014, 48, 6678–6686. [Google Scholar] [CrossRef] [PubMed]
  50. Keiluweit, M.; Bougoure, J.J.; Zeglin, L.H.; Myrold, D.D.; Weber, P.K.; Pett-Ridge, J.; Kleber, M.; Nico, P.S. Nano-scale investigation of the association of microbial nitrogen residues with iron (hydr)oxides in a forest soil o-horizon. Geochim. Cosmochim. Acta 2012, 95, 213–226. [Google Scholar] [CrossRef]
  51. Wan, J.; Tyliszczak, T.; Tokunaga, T.K. Organic carbon distribution, speciation, and elemental correlations within soil microaggregates: Applications of stxm and nexafs spectroscopy. Geochim. Cosmochim. Acta 2007, 71, 5439–5449. [Google Scholar] [CrossRef]
  52. IUSS Working Group WRB. World Reference Base for Soil Resources 2006; World Soil Resources Reports No. 103; FAO: Rome, Italy, 2006. [Google Scholar]
  53. North, P.F. Toward an absolute measurement of soil structural stability using ultrasound. Eur. J. Soil Sci. 1976, 27, 451–459. [Google Scholar] [CrossRef]
  54. Wagai, R.; Kishimoto-Mo, A.W.; Yonemura, S.; Shirato, Y.; Hiradate, S.; Yagasaki, Y. Linking temperature sensitivity of soil organic matter decomposition to its molecular structure, accessibility, and microbial physiology. Glob. Chang. Biol. 2013, 19, 1114–1125. [Google Scholar] [CrossRef] [PubMed]
  55. Wagai, R.; Mayer, L.M.; Kitayama, K. Extent and nature of organic coverage of soil mineral surfaces assessed by a gas sorption approach. Geoderma 2009, 149, 152–160. [Google Scholar] [CrossRef]
  56. Hiradate, S. Structural changes of allophane during purification procedures as determined by solid-state al-27 and si-29 nmr. Clays Clay Miner. 2005, 53, 653–658. [Google Scholar] [CrossRef]
  57. Tashiro, Y.; Nakao, A.; Wagai, R.; Yanai, J.; Kosaki, T. Inhibition of radiocesium adsorption on 2:1 clay minerals under acidic soil environment: Effect of organic matter vs. Hydroxy aluminum polymer. Geoderma 2018, 319, 52–60. [Google Scholar] [CrossRef]
  58. Stuiver, M.; Polach, H.A. Reporting of c-14 data—Discussion. Radiocarbon 1977, 19, 355–363. [Google Scholar] [CrossRef]
  59. Takeichi, Y.; Inami, N.; Suga, H.; Miyamoto, C.; Ueno, T.; Mase, K.; Takahashi, Y.; Ono, K. Design and performance of a compact scanning transmission x-ray microscope at the photon factory. Rev. Sci. Instrum. 2016, 87, 013704. [Google Scholar] [CrossRef] [PubMed]
  60. Hitchcock, A.P. Hitchcock Group aXis 2000. Available online: http://unicorn.mcmaster.ca/axis/aXis2000-windows-pre-IDL8.3.html (accessed on 21 May 2018).
  61. Mitsunobu, S.; Zhu, M.; Takeichi, Y.; Ohigashi, T.; Suga, H.; Makita, H.; Sakata, M.; Ono, K.; Mase, K.; Takahashi, Y. Nanoscale identification of extracellular organic substances at the microbe–mineral interface by scanning transmission x-ray microscopy. Chem. Lett. 2015, 44, 91–93. [Google Scholar] [CrossRef]
  62. Hall, P.; Churchman, G.J.; Theng, B.K.G. Size distribution of allophane unit particles in aqueous suspension. Clays Clay Miner. 1985, 33, 345–349. [Google Scholar] [CrossRef]
  63. Karube, J. Water retention, adsorption, and microstructure of allophane and imogolite. J. Jpn. Soc. Soil Phys. 2004, 96, 27–33. [Google Scholar]
  64. Egashira, K.; Aomine, S. Effects of drying and and heating on the surface area of allophane and imogolite. Clay Sci. 1974, 4, 231–242. [Google Scholar]
  65. Mayer, L.M. Extent of coverage of mineral surfaces by organic matter in marine sediments. Geochim. Cosmochim. Acta 1999, 63, 207–215. [Google Scholar] [CrossRef]
  66. Kaiser, K.; Guggenberger, G. Sorptive stabilization of organic matter by microporous goethite: Sorption into small pores vs. Surface complexation. Eur. J. Soil Sci. 2007, 58, 45–59. [Google Scholar] [CrossRef]
  67. Basile-Doelsch, I.; Balesdent, J.; Rose, J. Are interactions between organic compounds and nanoscale weathering minerals the key drivers of carbon storage in soils? Environ. Sci. Technol. 2015, 49, 3997–3998. [Google Scholar] [CrossRef] [PubMed]
  68. Shindo, H.; Higashi, T.; Matsui, Y. Comparison of humic acids from charred residues of susuki (eulalia, miscanthus sinensisa.) and from the a horizons of volcanic ash soils. Soil Sci. Plant Nutr. 1986, 32, 579–586. [Google Scholar] [CrossRef]
  69. Kramer, M.G.; Sanderman, J.; Chadwick, O.A.; Chorover, J.; Vitousek, P.M. Long-term carbon storage through retention of dissolved aromatic acids by reactive particles in soil. Glob. Chang. Biol. 2012, 18, 2594–2605. [Google Scholar] [CrossRef]
  70. Lehmann, J.; Liang, B.Q.; Solomon, D.; Lerotic, M.; Luizao, F.; Kinyangi, J.; Schafer, T.; Wirick, S.; Jacobsen, C. Near-edge X-ray absorption fine structure (nexafs) spectroscopy for mapping nano-scale distribution of organic carbon forms in soil: Application to black carbon particles. Glob. Biogeochem. Cycles 2005, 19. [Google Scholar] [CrossRef]
  71. Liang, B.; Lehmann, J.; Solomon, D.; Kinyangi, J.; Grossman, J.; O’Neill, B.; Skjemstad, J.O.; Thies, J.; Luizão, F.J.; Petersen, J.; et al. Black carbon increases cation exchange capacity in soils. Soil Sci. Soc. Am. J. 2006, 70, 1719–1730. [Google Scholar] [CrossRef]
  72. Abe, T.; Watanabe, A. X-ray photoelectron spectroscopy of nitrogen functional groups in soil humic acids. Soil Sci. 2004, 169, 35–43. [Google Scholar] [CrossRef]
  73. Ikeya, K.; Hikage, T.; Arai, S.; Watanabe, A. Size distribution of condensed aromatic rings in various soil humic acids. Org. Geochem. 2011, 42, 55–61. [Google Scholar] [CrossRef]
  74. Kleber, M.; Nico, P.S.; Plante, A.; Filley, T.; Kramer, M.; Swanston, C.; Sollins, P. Old and stable soil organic matter is not necessarily chemically recalcitrant: Implications for modeling concepts and temperature sensitivity. Glob. Chang. Biol. 2011, 17, 1097–1107. [Google Scholar] [CrossRef]
  75. Mikutta, R.; Schaumann, G.E.; Gildemeister, D.; Bonneville, S.; Kramer, M.G.; Chorover, J.; Chadwick, O.A.; Guggenberger, G. Biogeochemistry of mineral-organic associations across a long-term mineralogical soil gradient (0.3-4100 kyr), hawaiian islands. Geochim. Cosmochim. Acta 2009, 73, 2034–2060. [Google Scholar] [CrossRef]
  76. Dahlgren, R.A.; Dragoo, J.P.; Ugolini, F.C. Weathering of mt. St. Helens tephra under a cryic-udic climatic regime. Soil Sci. Soc. Am. J. 1997, 61, 1519–1525. [Google Scholar] [CrossRef]
  77. Wagai, R.; Kajiura, M.; Uchida, M.; Asano, M. Distinctive roles of two aggregate binding agents in allophanic Andisols: Young carbon and poorly-crystalline metal phases with old carbon. Soil Syst. 2018, 2, 29. [Google Scholar] [CrossRef]
  78. Wagai, R.; Kajiura, M.; Asano, M.; Hiradate, S. Nature of soil organo-mineral assemblage examined by sequential density fractionation with and without sonication: Is allophanic soil different? Geoderma 2015, 241–242, 295–305. [Google Scholar] [CrossRef]
  79. Heckman, K.; Grandy, A.S.; Gao, X.; Keiluweit, M.; Wickings, K.; Carpenter, K.; Chorover, J.; Rasmussen, C. Sorptive fractionation of organic matter and formation of organo-hydroxy-aluminum complexes during litter biodegradation in the presence of gibbsite. Geochim. Cosmochim. Acta 2013, 121, 667–683. [Google Scholar] [CrossRef]
  80. Baisden, W.T.; Amundson, R.; Cook, A.C.; Brenner, D.L. Turnover and storage of c and n in five density fractions from california annual grassland surface soils. Glob. Biogeochem. Cycles 2002, 16. [Google Scholar] [CrossRef]
  81. Hatton, P.J.; Bode, S.; Angeli, N.; Boeckx, P.; Zeller, B.; Boiry, S.; Gelhaye, L.; Derrien, D. Assimilation and accumulation of c by fungi and bacteria attached to soil density fractions. Soil Biol. Biochem. 2014, 79, 132–139. [Google Scholar] [CrossRef]
  82. Sollins, P.; Kramer, M.G.; Swanston, C.; Lajtha, K.; Filley, T.; Aufdenkampe, A.K.; Wagai, R.; Bowden, R.D. Sequential density fractionation across soils of contrasting mineralogy: Evidence for both microbial- and mineral-controlled soil organic matter stabilization. Biogeochemistry 2009, 96, 209–231. [Google Scholar] [CrossRef]
  83. Cotrufo, M.F.; Soong, J.L.; Horton, A.J.; Campbell, E.E.; Haddix, M.L.; Wall, D.H.; Parton, A.J. Formation of soil organic matter via biochemical and physical pathways of litter mass loss. Nat. Geosci. 2015, 8, 2520. [Google Scholar] [CrossRef]
  84. Chenu, C.; Plante, A.F. Clay-sized organo-mineral complexes in a cultivation chronosequence: Revisiting the concept of the ‘primary organo-mineral complex’. Eur. J. Soil Sci. 2006, 57, 596–607. [Google Scholar] [CrossRef]
  85. Christensen, B.T. Physical fractionationof soil and organic matter in primary particle size and density separates. Adv. Soil Sci. 1992, 20, 1–89. [Google Scholar]
  86. Lawrence, C.R.; Harden, J.W.; Xu, X.; Schulz, M.S.; Trumbore, S.E. Long-term controls on soil organic carbon with depth and time: A case study from the cowlitz river chronosequence, wa USA. Geoderma 2015, 247–248, 73–87. [Google Scholar] [CrossRef]
  87. Torn, M.S.; Trumbore, S.E.; Chadwick, O.A.; Vitousek, P.M.; Hendricks, D.M. Mineral control of soil organic carbon storage and turnover. Nature 1997, 389, 170–173. [Google Scholar] [CrossRef]
Figure 1. Microscopic images, carbon, iron, potassium distribution and carbon chemical functional map of the studied aggregate isolated from 0.2–2 µm fraction. (a) FE-SEM image; (b) TEM image; (c) carbon (green area), iron (red area), potassium (blue area) distribution using STXM-NEXAFS; (d) Carbon functional group map. The C K-edge spectra was split into three energy regions, red: 284–286 eV (aromatic C), blue: 286–287 eV (phenol and aliphatic C), and green: 287–289 eV (amide and carboxyl C). (a’d’) The regions of high C intensity indicated from STXM-NEXAFS image are shown as polygons in white line in all bottom panels. In addition, (a’) shows rough surface (red area) and smooth surface regions (blue area) based on the FE-SEM image, and (b’) shows the regions of no overlapped particles (green area). The FE-SEM and TEM images were flipped upside down and rotated 40° to match the position with STXM image.
Soilsystems 02 00032 g001
Figure 2. STXM-based C 1s NEXAFS of selected regions within the studied aggregate and that of model compounds. The C 1s NEXAFS spectra were selected from the regions delineated based on micromorphology from the SEM and TEM images (b–d, g in left images). Note the alphabet of selected regions correspond to the TEM image in Figure 3. Each region was indicated in the same images of Figure 1, FE-SEM, TEM, carbon (green area), iron (red area), potassium (blue area) distribution using STXM-NEXAFS, and chemical functional map of carbon. Spectra features identified by the vertical dashed lines correspond to (I) aromatic C (285.5 eV), (II) aliphatic C (287.3 eV), (III) amide C (288.2 eV), (IV) carboxylic C (288.6 eV), and (V) O-alkyl C (289.4 eV). The peak from L3 edge of K+ was correspond to (IV) at 297.5 eV. * Data from Mitsunobu et al. (2015) [61].
Soilsystems 02 00032 g002
Figure 3. TEM images of the studied aggregate and its sub-regions. (a) whole aggregate; (b–g) high C intensity regions with rough surfaces; (h) low C region with smooth surface. Electron diffraction patterns were obtained from dotted-circle areas. Diffused electron diffraction pattern was found in (b,c,d-1,f,g). Crystalline diffraction pattern was in shown in (d-2,h,g’,h’) Short-range-order structural pattern was observed in dotted-square areas of (g,h) as shown in higher magnification (g’,h’). STXM-NEXAFS image from Figure 1c was oriented to match with the TEM image (i).
Soilsystems 02 00032 g003
Figure 4. Conceptual model linking presumed building block (left), sonication-resistant 0.2–2-µm-sized aggregates comparable to the studied aggregate in Figure 1 (middle), and their binding to larger mineral particles (right). The model depicts our new hypothesis that organo-metal/mineral nanocomposite (OMN) acts as major binding agent in the studied Andisol. Reactive inorganic (RI) phase may be present in both interior and outer surface of OMN.
Soilsystems 02 00032 g004
Table 1. Mass recovery, total C, and N contents, and concentrations of metals extracted by the sequential selective dissolution in the bulk soil sample and particle size fractions.
MassTOC aTN aTOC DistributionPP bOX b
AlFeAlFeSi
%mg g−1%mg g−1
bulk soil 53.2(0.1)4.5(0.0)-3.471.3537.2517.1416.86
Size fractions
<0.211.8871.4(3.2)7.5(0.4)167.432.8371.135.033.6
0.2–236.4968.0(1.6)5.4(0.1)476.251.8650.723.423.4
2–5337.6532.5(3.4)1.8(0.3)232.260.5212.99.665.58
53–40006.612.07-tr-0.30.260.400.9321.50.70
Standard error with lab replicates (n = 3) in parentheses. tr: trace level; a TOC and TN refer to total organic carbon and total nitrogen, respectively; b PP and OX refer to pyrophosphate and acid-oxalate, respectively. Data from Asano and Wagai (2014) [42].
Table 2. Specific surface area before and after organic matter removal by H2O2 treatment and radiocarbon isotope ratio across the particle-size fractions after the maximum dispersion (n = 1).
SSA UntreatedSSA OxidizedOrganic CoverageTotal Surface Area Distribution Δ14CRadiocarbon Lab. Code No.
m2 g−1%
bulk soil85NA--−145.5-TERRA-112210d21
Size fractions (µm)
<0.2992676328−94.8(3.4)Beta-311744
0.2–2841725155−114.8(3.3)Beta-311745
2–5330493916−201.7(3.0)Beta-311746
53–4000911141NA--
Analytical error in parentheses.

