Is There Anybody Out There? Substrate Availability Controls Microbial Activity outside of Hotspots in Subsoils

Institute of Geography, Chair for Soil Science and Soil Ecology, Ruhr-Universität Bochum, Universitätsstraße 150, 44801 Bochum, Germany
*
Author to whom correspondence should be addressed.
Soil Syst. 2018, 2(2), 35; https://doi.org/10.3390/soilsystems2020035
Submission received: 22 March 2018
/
Revised: 1 June 2018
/
Accepted: 4 June 2018
/
Published: 6 June 2018
(This article belongs to the Special Issue Soil Organic Matter Dynamics)
Abstract
:Soil organic carbon (SOC) turnover in subsoils is assumed to be limited to spatially restricted microsites where fresh substrate inputs occur. Vice versa, the growth and activity of microorganisms outside of such hotspots may be limited by easily available substrates. The apparent long-term stability of subsoil organic carbon could thus be a result of microbial inactivity in these vast “cold regions” outside of hotspots. The aim of this study was to obtain realistic data about the in situ distribution of microbial hotspots in deep soil using soil zymography for three extracellular enzymes on undisturbed soil slices sampled from 0 to 161 cm depth. The results showed that most enzyme-driven turnover processes were concentrated to small portions of <1 to 10% of the subsoil volume, while enzymes in the major part of subsoils were barely active. In a second step, soil slices were homogenously sprayed with 14C glucose, incubated for 2 weeks and again analyzed with soil zymography. After glucose application, enzyme activities greatly increased in non-hotspot areas, thus confirming that substrate availability limits microbial activity in most of the subsoil volume. This implies that substrate limitation is a controlling factor for SOC stability in subsoils, suggesting that SOC in non-hotspots is persisting over long time periods until substrate becomes available and increases microbial activity.
1. Introduction
Mechanisms for C stabilization in topsoils have been intensively investigated in the recent years to understand soil organic carbon (SOC) dynamics and their relevance in the global C cycle [1], but subsoils have been widely neglected. More than half of SOC stocks are found in subsoils [2], characterized by apparent radiocarbon ages of up to 10,000 years [3]. However, the understanding of subsoil C turnover and underlying mechanisms controlling C storage in deep soil is still full of gaps [3,4].
Input of substrate to subsoils is assumed to be heterogeneously distributed in microsites because of its relation to preferential flow paths, roots, fungal hyphae and animal burrows [4,5,6,7]. Therefore, it is assumed that C-cycling in subsoils is limited to these restricted microsites [8,9]—i.e., hotspots—where fresh substrate inputs are found, supplying energy to microorganisms for growth and maintaining their metabolism. Hotspots in subsoils are characterized by higher enzyme activities, higher microbial respiration and biomass, as shown in different studies [5,6,10,11,12], in which various hotspots, such as biopores or the rhizosphere, were analyzed. However, in situ data from the spatial distribution of hotspots in subsoils and their actual microbial activity are very scarce.
Easily degradable substrates, such as glucose, can be quickly taken up by soil microorganisms as a rapid energy source for growth and enzyme production [13]. It can be expected that the growth and activity of microorganisms existing outside of such hotspots is mainly limited by easily available substrates. However, microorganisms can persist at strongly reduced metabolic states under conditions that are not favorable for growth [13]. Therefore, SOC in such “cold spots” may persist over long time periods and may explain the high apparent 14C-ages found in subsoils [3]. Many microorganisms can quickly return to activity as soon as environmental conditions improve (e.g., substrate availability) which will enable them to mineralize SOC [14,15]. Consequently, inactive microorganisms in subsoil cold spots may play an important role for SOC stabilization [15]. Priming studies (i.e., soil incubation with addition of labile substrates) with disturbed soil samples suggest that subsoil C turnover is substrate limited [16,17]. However, soil disturbance will provide microorganisms access to SOC, which would never be available to them in the undisturbed environment, as revealed by comparing SOC mineralization of disturbed and undisturbed subsoils [18]. Thus, classical priming studies give information about mechanistic understanding but fail to reflect the “real world” in subsoils.
Therefore, Heitkötter et al. [19] introduced a new conceptual approach that allows investigating the activity and distribution of enzymes in undisturbed soil slices under different substrate availabilities. For this purpose, undisturbed soil slices were obtained by using the method of Krueger and Bachmann [20], and mapping of enzymes was performed by applying soil zymography [21]. Enzyme activity is a suitable proxy for microbial activity and C turnover, since microbial C and nutrient acquisition is largely determined by extracellular enzymes, which are actively excreted to catalyze the degradation of SOC [22]. In this study, we investigated the effect of 14C-labeled glucose on the activity and distribution of β-glucosidase, chitinase and acid phosphatase on the surfaces of undisturbed soil samples taken from different depths. The enzyme β-glucosidase is involved in the decomposition of cellulose, chitinase decomposes chitin, and phosphatase mineralizes P from nucleic acids, phospholipids and other ester phosphates [22,23].
We hypothesized that:
- (i)
- Active microorganisms occupy small soil volumes, forming hotspots in subsoils.
- (ii)
- However, microorganisms also exist outside of subsoil hotspots, but are inactive due to energy limitations.
- (iii)
- Therefore, the strongest effect of glucose additions on enzyme activities will be induced outside of hotspots.
2. Materials and Methods
2.1. Study Site and Soil Sampling
The study site is located in the Grinderwald (52°34′22″ N, 9°18′51″ E), Lower Saxony, Germany. The predominant soil type is a Dystric Cambisol [24], developed on glaciofluviatile sandy deposits from the Saale glaciation [25], where a beech (Fagus sylvatica L.) forest stand was established in 1916. Subsoils are characterized by increasing spatial variability of SOC down to 185 cm depth and are largely explained by a complex interaction between soil texture and mineralogy with root growth [26]. The 14C age of bulk SOC increases with increasing depth, showing recent SOC in the topsoil, while deeper soil layers (35–85 cm) show ages varying between 2650 and 3860 years [27].
In this study, the sampling technique developed by Krueger and Bachmann [20] was applied to obtain undisturbed samples from 0–11, 15–26, 60–71, 80–91 and 150–161 cm depth, with sizes of 120 mm height, 70 mm length and 5 mm width. The main idea of this sampling technique is to sample an undisturbed soil block, which is then sliced into subsamples [20]. With one sampling, four soil slices (subsamples) were obtained.
2.2. Zymography
Soil zymography was performed similar to Spohn and Kuzyakov [21] for localizing enzymatic hotspots and analyzing enzyme activities before and after incubation. In this study, the activity of acid phosphatase (Pho), β-glucosidase (β-glu) and chitinase (Chiti) were determined using fluorescent methylumberrliferyl (MUF)-substrates. 4-MUF-ß-d-glucoside (β-glu), 4-MUF phosphate disodium salt (Pho) and 4-MUF-N-acetyl-ß-d-glucosaminide (Chiti) were dissolved to the desired concentration of 12 mM. Polyamide membranes (Sartorius Stedim, Göttingen, Germany) were soaked in respective solutions and were carefully put on 1 mm thick agarose gels (1% agarose) attached to the flow cells. For each enzyme, the samples were incubated for 1 h at 20 °C in the dark. After incubation, the membranes were photographed in a gel documentation system (Biostep GmbH, Burkhardtsdorf, Germany) equipped with epi-UV illumination at 365 nm and a Canon EOS-700D equipped with a fixed focal length lens (50 mm F/1.8) and a 420 nm filter. A control was set for determining the autofluorescence of each substrate by placing a substrate-soaked membrane on an agarose plate, which was then incubated under the same conditions as described above.
2.3. Incubation
A laboratory incubation study was performed for 14 days at 20 °C as described in Heitkötter et al. [19], in which glucose was used as a model substrate. Glucose additions were chosen to correspond to a 10-day dose of the annual C input from roots into the soil in respective depths at the Grinderwald, as investigated by Tückmantel et al. [28]. For samples from 0 to 26 cm depth, glucose additions of 140 µg C cm−2 were added, while 40 µg C cm−2 was added to samples from 60 to 91 cm. For samples from 150 cm depth, 3 µg C cm−2 was applied. The uniformly 14C-labeled glucose (Perkin Elmer, Waltham, MA, USA) was mixed with respective unlabeled glucose to obtain the required concentrations and a target radioactivity of 100 Bq µL−1. The experiment was conducted with three experimental replicates (using three subsamples) for each depth and one additional subsample receiving water instead of glucose, serving as control. Either 1 µL cm−2 substrate (100 Bq cm−2) or water was sprayed on the sample surface using an iMatrix Spray instrument (Tardo GmbH, Subingen, Switzerland). For the incubation, the sample was placed in an 18 × 12 × 6.5 cm airtight container with 8 mL of 0.6 M KOH placed inside the container to trap and analyze the evolved 14CO2 after 3, 24, 48, 72, 96, 168, 240 and 336 h. The amount of glucose-derived 14CO2 was determined with a Tri-Carb 2800TR scintillation counter (Perkin Elmer, Waltham, MA, USA) after mixing 1 mL of KOH with 6 mL scintillation cocktail (Ultima Gold, Perkin Elmer, Waltham, MA, USA).
2.4. Image Processing
Georeferencing of the zymographs and the photographs, i.e., spatial overlay of zymographs and soil samples, was conducted using Quantum GIS version 2.14.11 Essen [29]. Photographs of the soil slices with the attached membranes were referenced to photographs of the flow cells alone. Finally, the zymographs were referenced to the photographs of the flow cells attached with the membrane. This procedure ensured that zymographs before and after incubation were precisely overlapped.
Image processing was conducted using Fiji software [30]. First, autofluorescence was subtracted from respective zymographs and image noise was reduced using the Gaussian blur algorithm. Based on a calibration line, as described in Spohn and Kuzyakov [21], gray values were converted to enzyme activities and summed up to calculate the total activity of each enzyme on the flow cell using R version 3.1.2 [31]. By dividing this value by the flow cells area, the average enzyme activity was calculated. In this study, hotspots were defined as regions where the activity was 50% higher in comparison to the average activity. These regions were localized by thresholding the zymographs, i.e., selection of gray values 50% of the mean gray value. Hotspots (referred to as initial hot spots) and non-hotspots (referred to as initial non-hotspots) were extracted as regions of interests (roi) to calculate enzyme activities in these regions. Hotspot distribution was analyzed calculating the nearest neighbor index [32]. To compare the overall pattern similarity between enzymes, a pixel intensity spatial correlation analysis was conducted using Fiji [30]. To evaluate the effect of glucose on enzyme activities in initial hotspots and non-hotspots, the activities in the initial roi of the zymographs imaged after the incubation were calculated.
2.5. Statistics
Data processing and statistical analyses were performed using R version 3.1.2 [31]. To identify significant changes of enzyme activities induced by glucose or water in initial hotspots and non-hotspots of the subsoils, paired t-tests (p 0.05) were performed. For glucose, averaged values of area-normalized enzyme activities (nM h−1 cm−2) of the three subsamples before and after incubation of each depth was considered for the paired t-test. All three subsamples of the same depth showed the same effect-trend in respective compartments, i.e., increased or decreased activity, after incubation with glucose (Table S1). Since the differences in enzyme activities after and before incubation were not normally distributed (Shapiro–Wilk test, p 0.05), data were log10-transformed for achieving normal distribution.
3. Results and Discussion
3.1. Distribution and Activity of Enzymes
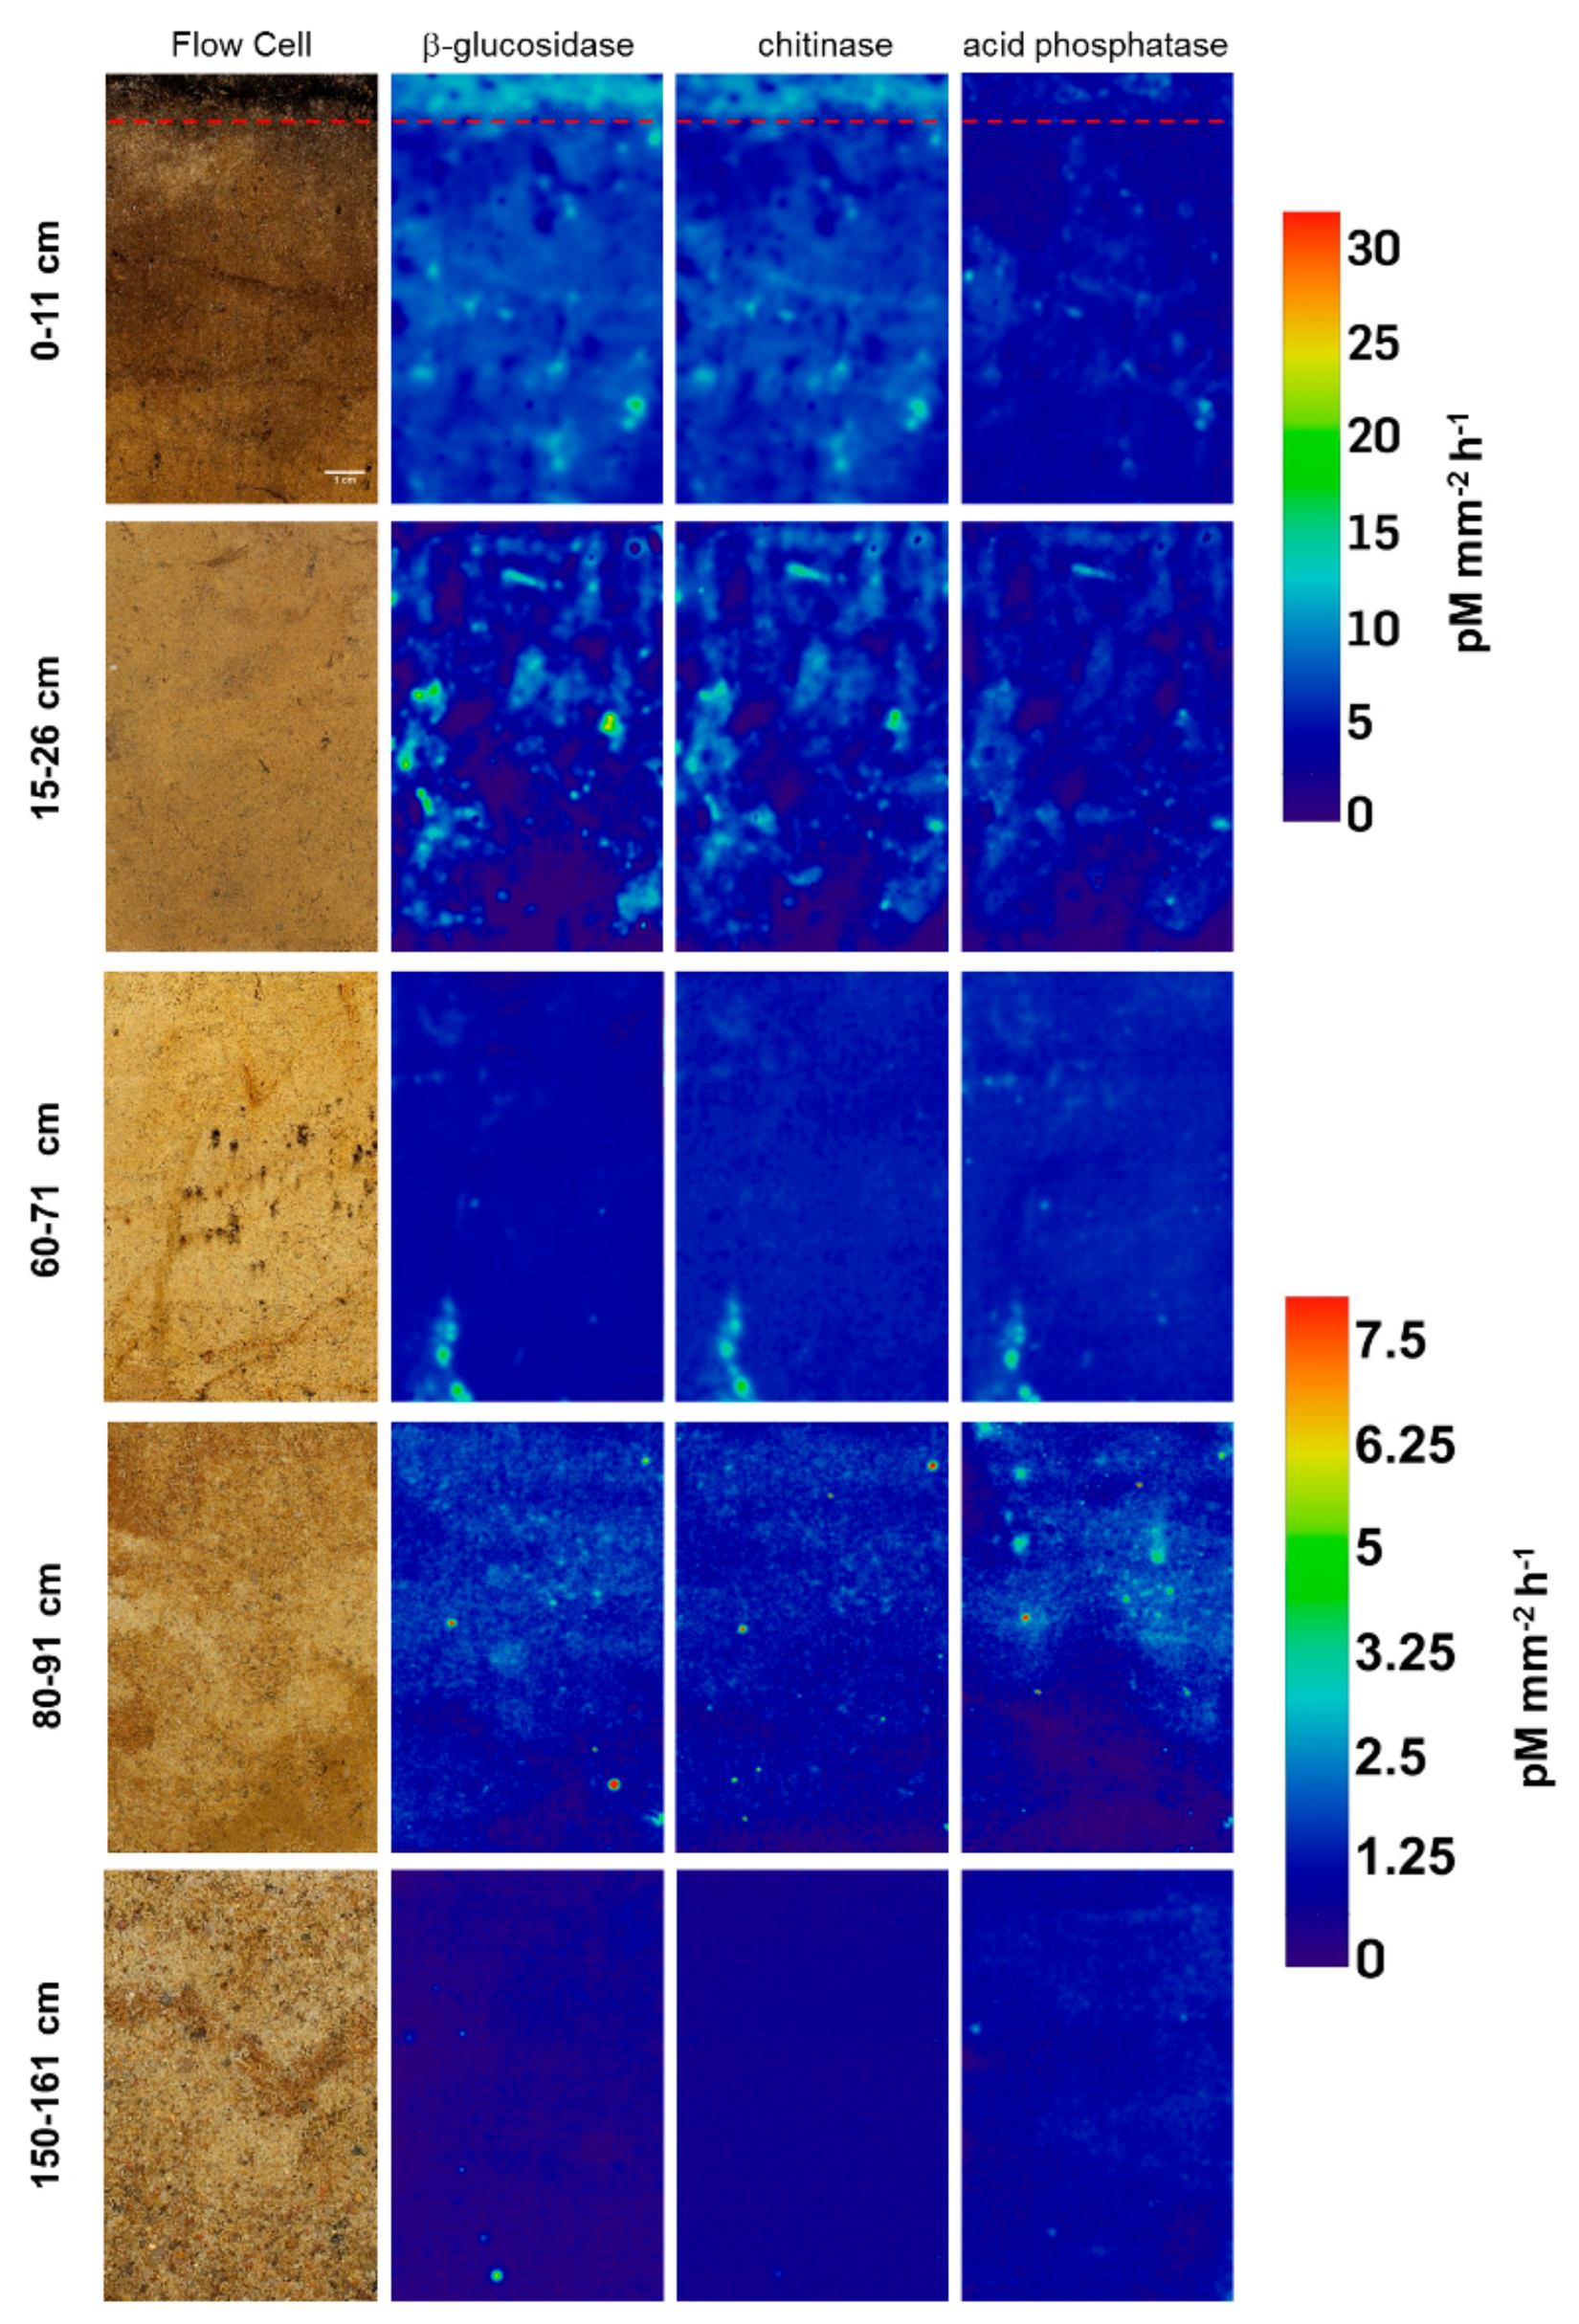
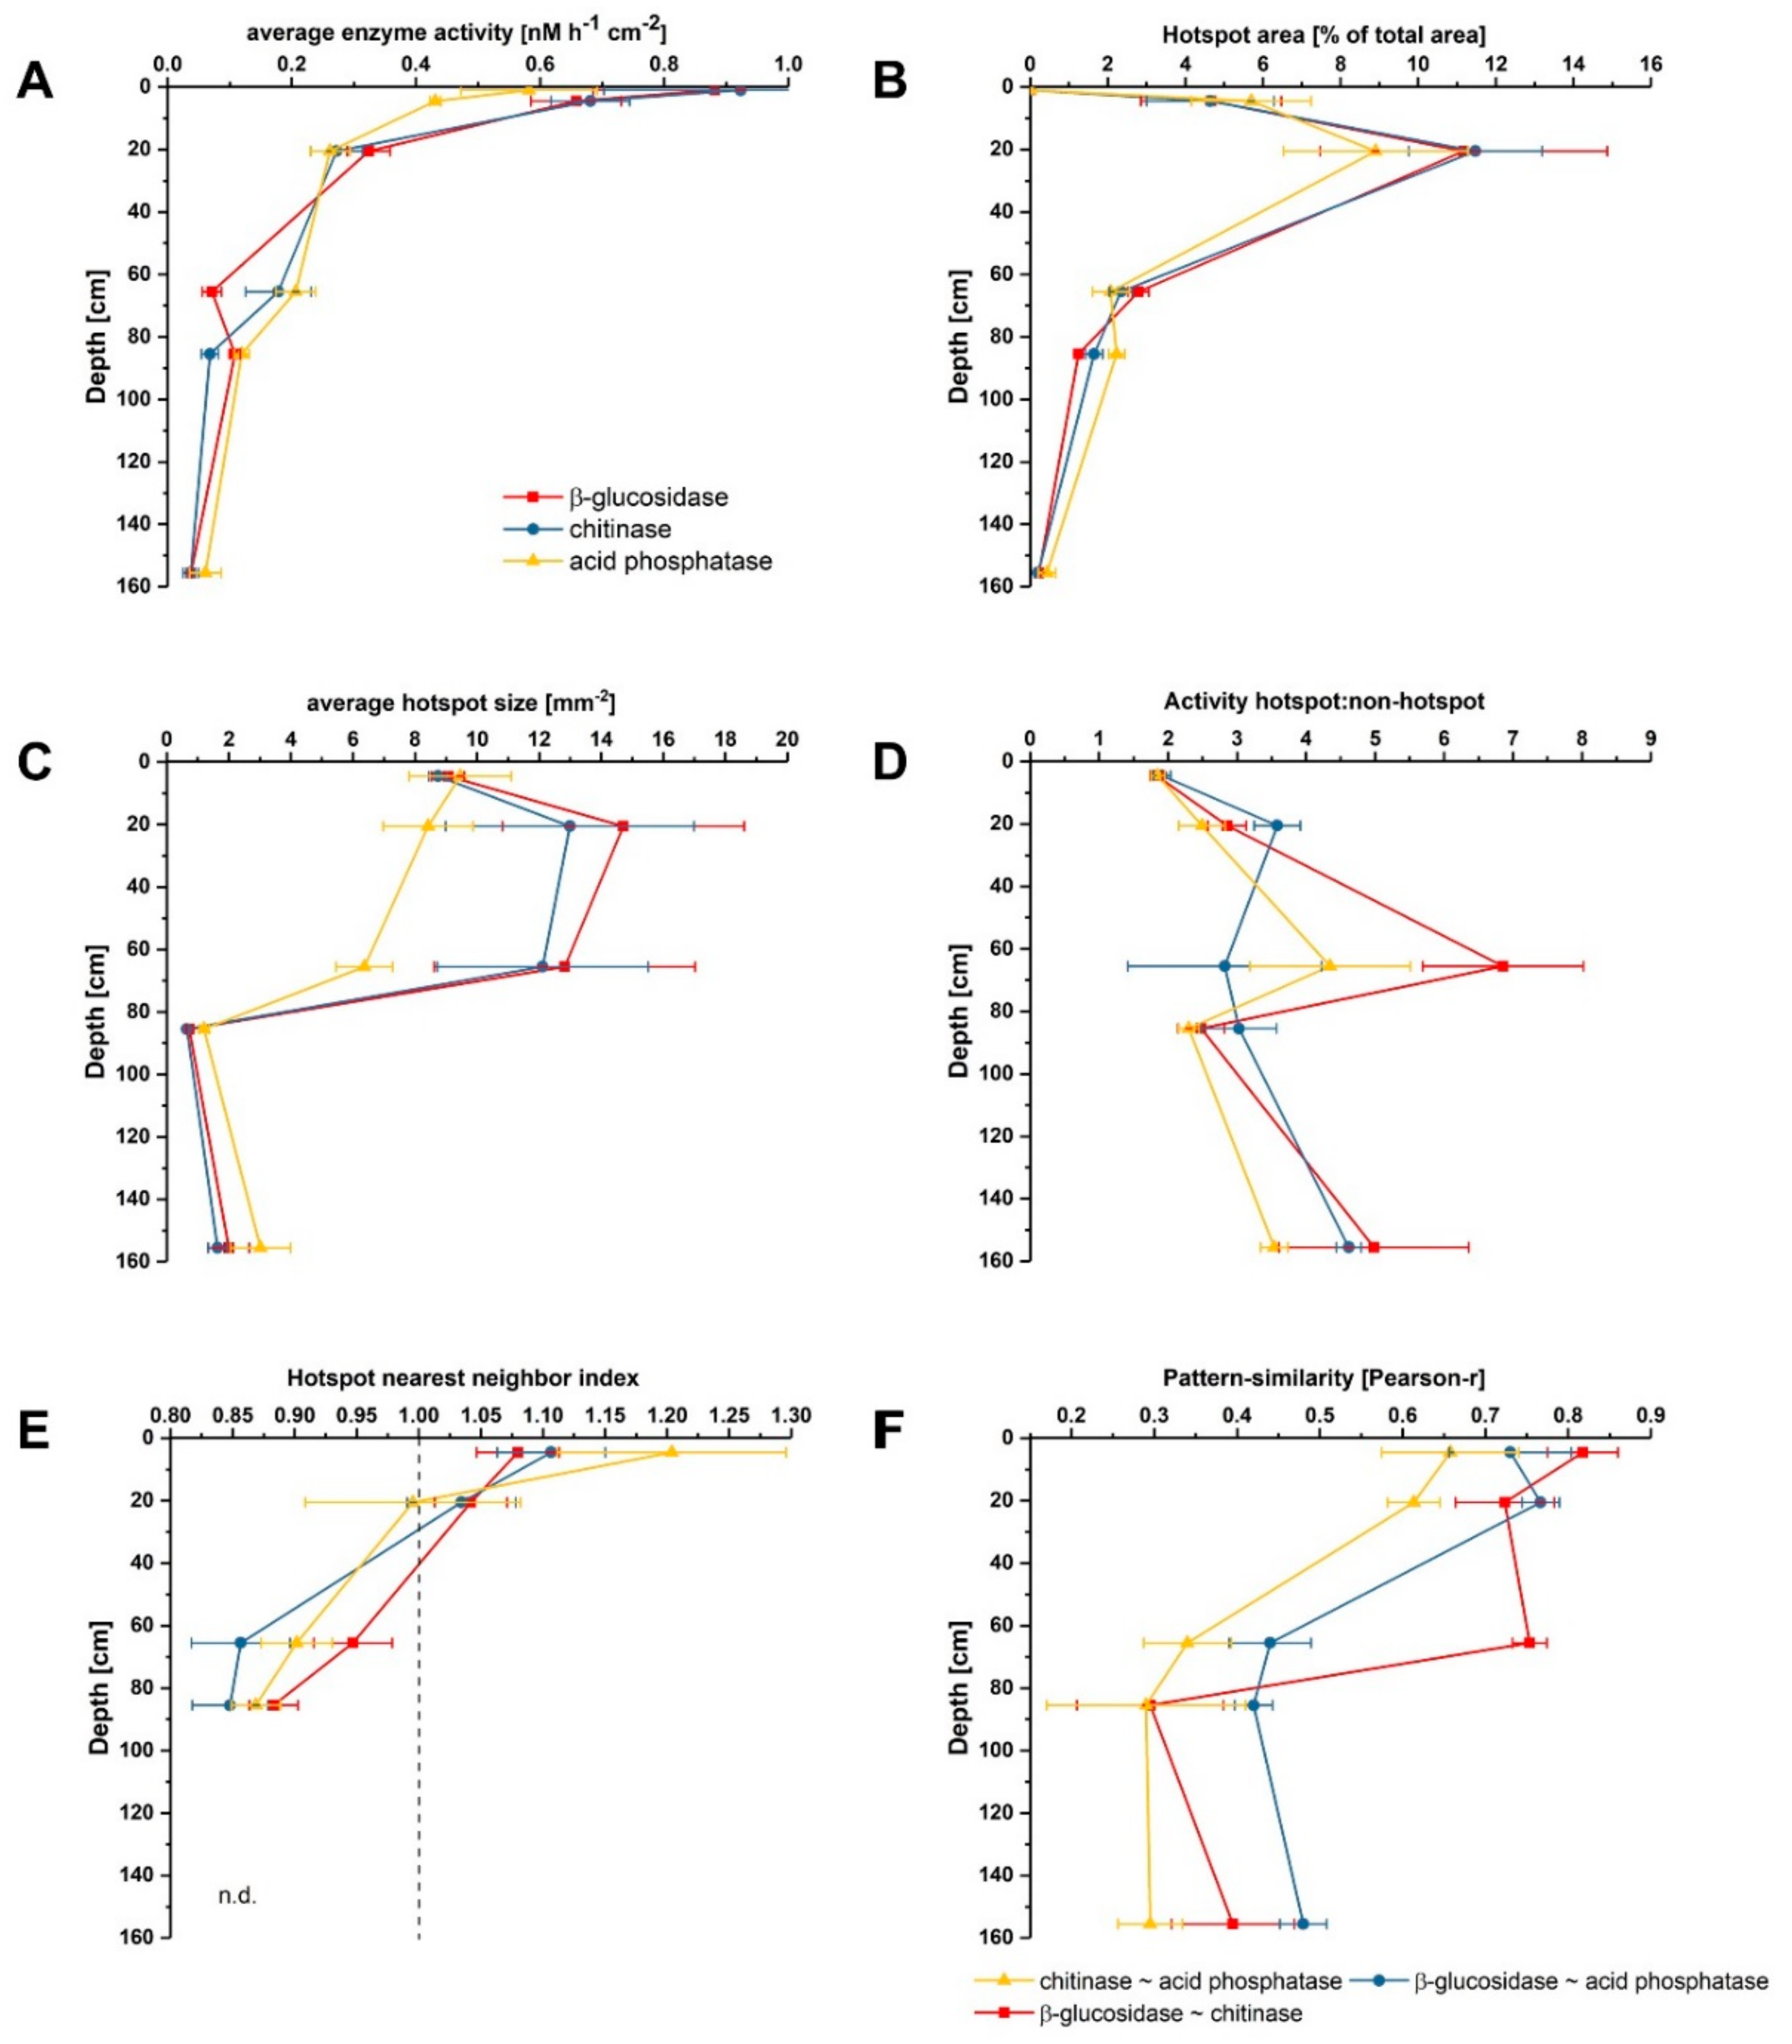
Zymographs of β-glucosidase, chitinase and acid phosphatase revealed patchy activity patterns on the undisturbed soil slices (Figure 1). Activities generally decreased with increasing soil depth for all investigated enzymes, showing 18-fold higher activities for β-glucosidase and chitinase and around 12-fold higher activities for phosphatase in the topsoil compared to the deepest layer (Figure 2A). This is in line with results obtained from bulk analysis of enzyme activities in forest and arable soils, as explained by decreasing availability of C and nutrients with increasing depth accompanied with declining occupied soil volumes in subsoils [11,16,33,34]. In the very shallow topsoil horizon of 0–1 cm of the uppermost sample, no enzymatic hotspots were detected (Figure 2B). In contrast, hotspots represented around 5% and 10% of the total area for each enzyme in 1–11 and 15–26 cm, respectively (Figure 2B). Below 30 cm, the proportion of hotspot areas decreased with increasing depth to a minimum of 0.3% in 150–161 cm, indicating a lower share of hotspots in comparison to the samples from the upper subsoils in 1–11 cm and 15–26 cm (Figure 2B). The average hotspot size was around 9 mm−2 in 1–11 cm depth and increased to 12–15 mm−2 for β-glucosidase and chitinase in 15–26 cm and in 60–71 cm, while the hotspot sizes for acid phosphatase declined continuously (Figure 2C). Below 80 cm depth, the hotspot sizes were around 3-fold smaller for phosphatase and 10-fold smaller for β-glucosidase and chitinase compared to the subsoil sampled at 60 cm depth. The ratio between enzyme activities in hotspots and non-hotspots tended to be higher in greater depths, but showed no depth-specific trend (Figure 2D). The nearest neighbor index of enzyme hotspots continuously decreased from 1.06–1.20 in 1–11 cm to 0.86 on average in 80–91 cm depth (Figure 2E), indicating a less random distribution but increasing clustering of hotspots with increasing depth [32].
These in situ data confirm that microorganisms in subsoils are not uniformly distributed but occupy a nonrandom, patchy distribution in microsites [35]. According to Kuzyakov and Blagodatskaya [9], hotspots of microbial activity and C turnover are mainly found in the rhizosphere, detritussphere, biopores and aggregate surfaces, where the input of labile C boosts the activity of microorganisms and C turnover in soil. As shown by Uksa et al. [11], the rhizosphere in subsoils was a significant hotspot of hydrolase activities and increased microbial biomass resulting from higher substrate availability in these compartments. Tückmantel et al. [28] and Heinze et al. [26] showed that root biomass and necromass strongly decreased with increasing depth in the Grinderwald. Further, they reported that roots were abundant in the whole profile (10–185 cm), but the distribution was patchier in deep soil layers, as indicated by a higher coefficient of variation, which was also shown for root necromass distribution [26]. Accompanied with decreasing root biomass, root exudation considerably declines with depth, which is accompanied by decreasing soil microbial biomass, extractable organic C, N and P availability [28]. In our study, the highest concentration of hotspots was found in 15–26 cm depth, which could be related to the fact that this zone is strongly affected by fresh inputs of both root- and shoot-derived SOC, indicating fast-cycling C [27].
Apart from roots, preferential flow paths can further form hotspots in subsoils. Leinemann et al. [7] concluded a strong contribution of dissolved organic carbon (DOC) for small-scale spatial variability of SOC distribution in subsoils at the Grinderwald site. By using novel segmented suction plates, they analyzed the small-scale spatial and temporal variability of DOC transport at different subsoil depths, up to 150 cm, and suggested that small-scale spatial variability of DOC fluxes may play an important role for the formation of microbial hotspots in subsoil [7]. Furthermore, microbial hotspots were found in association with secondary minerals, where large quantities of labile carbon are processed [36]. Chabbi et al. [8] found hotspots as vertical tongues in agricultural soils with a width of a few centimeters and length more than a meter. These visually detectable zones were related to preferential flow paths and/or roots and were characterized by higher carbon contents and younger radiocarbon ages compared to the adjacent soil matrix, which was 4300–5800 years old [8]. As no biopores were identified in the samples investigated here, we conclude that preferential flow paths and roots are the main drivers for the formation of hotspots in this study.
Our results clearly show that soil organic matter (SOM) turnover is concentrated to small soil volumes (i.e., hotspots) in subsoils, which were most likely formed due to root presence or preferential flow paths. Interestingly, the similarity of activity patterns between the investigated enzymes showed decreasing correlations with increasing depth (Figure 2E). For β-glucosidase ~ chitinase, good correlations (0.72–0.82) were found down to 60–71 cm depth but decreased considerably to 0.30 in 80–91 cm depth. The pattern similarity between activities of β-glucosidase and acid phosphatase also showed good correlations down to 15–21 cm depth but declined to around 0.45 in deeper layers. Lowest correlations were found for chitinase ~ acid phosphatase decreasing from 0.66 in 1–11 cm to 0.30 in 150–161 cm depth. Generally, it is accepted that microbial communities change with soil depth [37,38,39]. Eilers et al. [38] could show that microbial communities separated by 10–20 cm in depth were as distinct as microbial communities from a wide range of biomes separated by thousands of kilometers. Further, He et al. (2017) found more dissimilar microbial communities with increasing depth. Therefore, decreasing correlation with increasing depth may be related to a higher microbial diversity in subsoils, which are equipped with unique sets of enzymatic tools, meaning that enzyme activities in distinct hotspots reflect communities with diverging lifestyles, as suggested by Uksa et al. [11].
3.2. Effect of Glucose on Enzyme Activities in Hotspots and Non-Hotspots
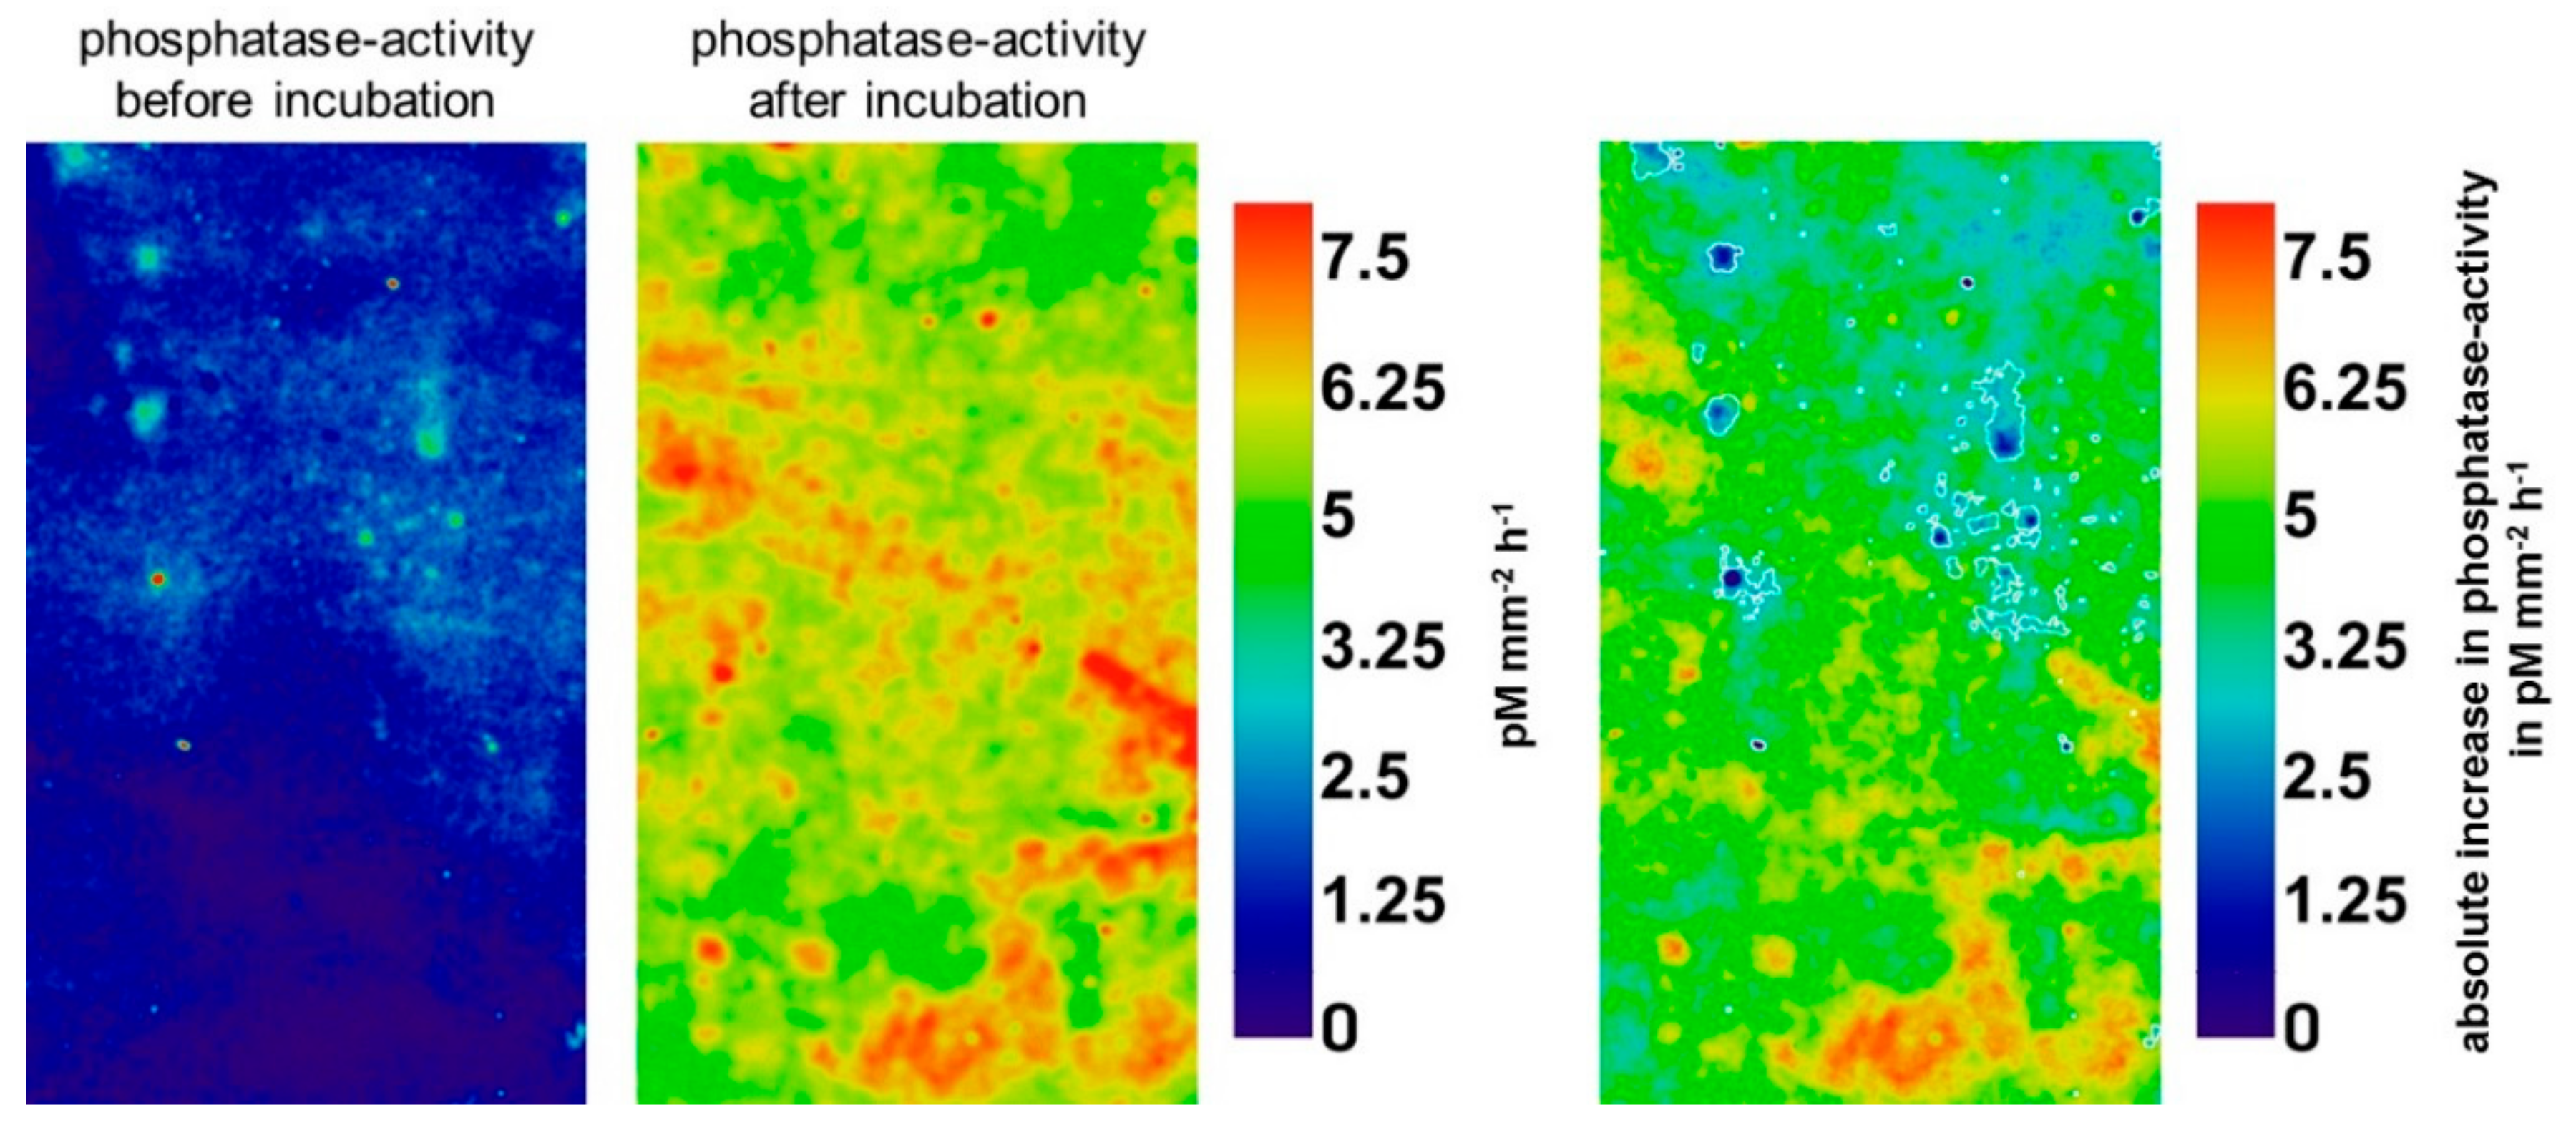
Glucose had no significant effect on enzyme activities in initial hotspots (p = 0.34–0.96), but significantly increased activities in initial non-hotspots (Table 1). In contrast, pure water additions had no significant effect on enzyme activities in any location (Table S2). Figure 3 illustrates the boosting effect of glucose on phosphatase activity in 80–91 cm depth, highlighting that the highest increases mainly occurred in initial non-hotspot areas (white boundaries). Over all depths, the mean activity of β-glucosidase increased by 307% in initial non-hotspots, while the mean activity of chitinase and acid phosphatase increased by 189 and 185%, respectively (Table 1).
This confirms that microorganisms outside of hotspots are substrate limited. Soil microorganisms require sufficient C and nutrients for maintaining microbial functioning and physiological processes, such as enzyme production [40]. Microbial C and nutrient acquisition is largely determined by hydrolytic enzymes that are actively excreted to catalyze the degradation of SOM [22]. As shown here, microbes produce enzymes when substrate input increases. Easily available substrates, such as sugars, can be rapidly incorporated and used by microorganisms for growth and enzyme production, thus also inducing co-metabolic decomposition of SOM [41]. As long as substrate availability is limited, microorganisms can rest in metabolically inactive states to avoid starvation [13]. However, they apparently can maintain a so-called “alert state”, which allows them to switch to activity as soon as environmental conditions (e.g., increased substrate availability) improve [14,15]. Therefore, inactive microorganisms in subsoil “cold spots” may play an important role for turnover of SOC, which is not physically protected, once organic substrates become available, since then they are able to increase the production of C-cycling enzymes that are involved in catalyzing the breakdown of SOM [14,15]. Heitkötter et al. [16] showed that substrate additions to subsoils from the same site (Grinderwald) induced positive priming effects, i.e., elevated SOC mineralization and enzyme activities, indicating that SOC turnover was limited by substrate availability. As reviewed by Blagodatskaya and Kuzyakov [41], increased enzyme activities during positive priming are hypothesized to either activate the microbial synthesis of intracellular and extracellular enzymes, or the new introduced substrate can serve as an energy source for the production of extracellular enzymes. On the other hand, the lack of significant changes in enzyme activities in initial hotspots shows that microbial activity was not substrate limited in these restricted microsites. These areas are most likely hotspots of substrate inputs derived by roots or preferential flow paths.
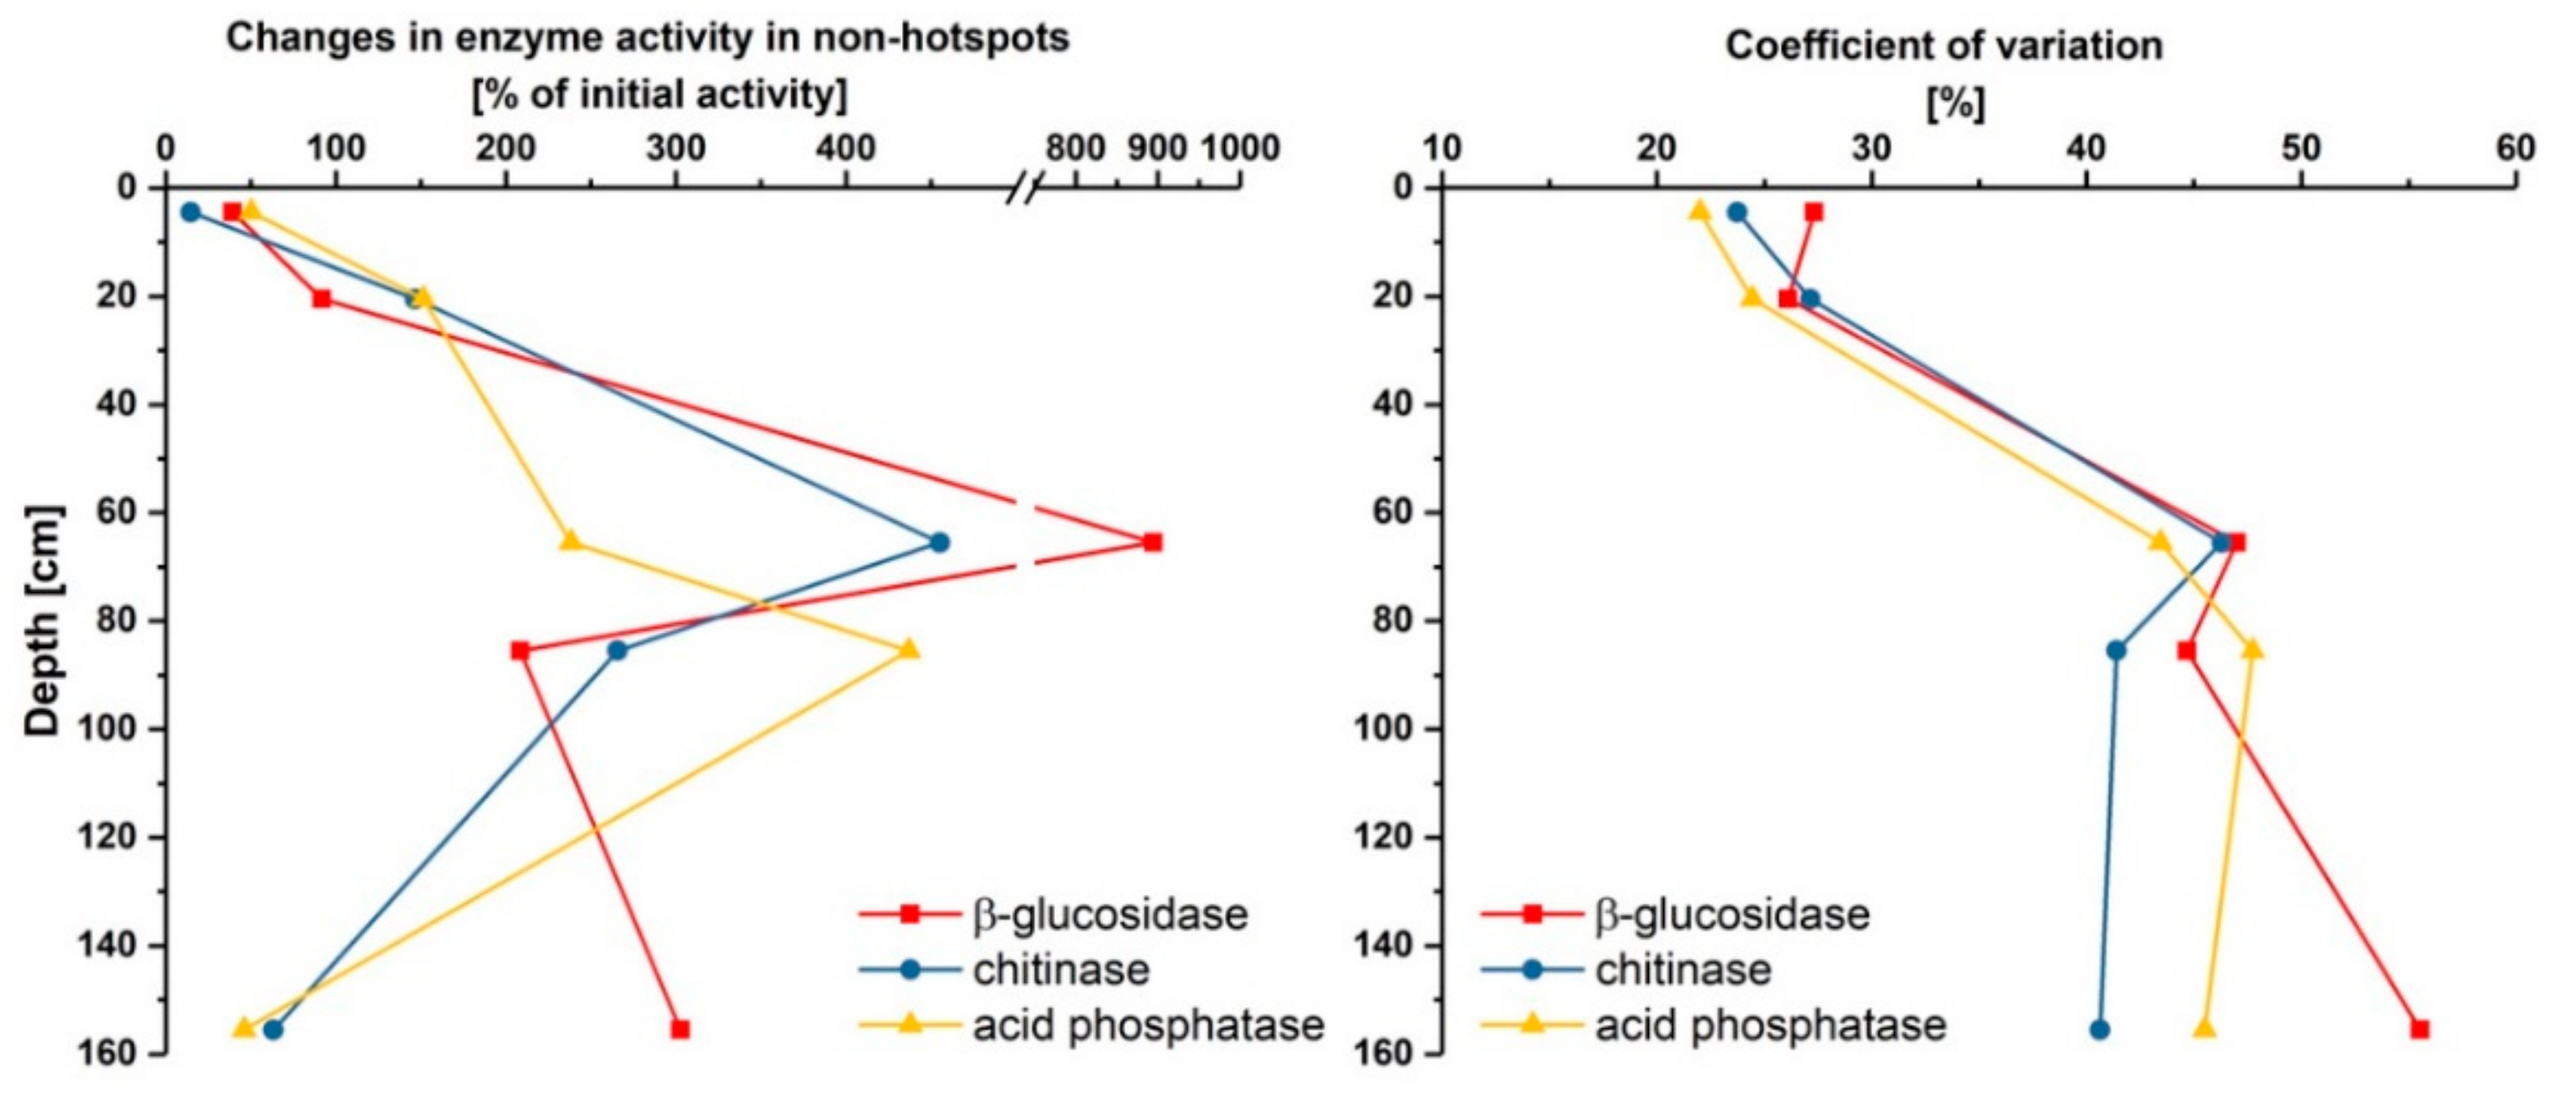
As shown in Figure 4, and also indicated by the high standard errors in Table 1, the glucose-induced mean changes of enzyme activities in initial non-hotspots were highly variable and depth dependent. The spatial variability of the mean change, presented as coefficient of variation, was about 2-fold higher in the lower subsoils (60–151 cm) in comparison to both upper subsoils (1–26 cm) (Figure 4, right). This indicates that the effect of glucose additions on enzyme activities in non-hotspots is far more heterogenous in deeper soils. For β-glucosidase, higher increases occurred in deep soil layers, i.e., 60–161 cm, ranging between 208% and 894%, whereas changes tend to be lower in the upper subsoil (Figure 4, left). The same trend was observed for chitinase and phosphatase activity, except that the deepest soil samples (150–161 cm) showed smaller glucose-induced increases. Glucose application had the weakest effect on enzyme activities in 1–11 cm depth, inducing increases from 15% to 50% in initial non-hotspots. Conventional priming studies conducted by Karhu et al. [42], Heitkötter et al. [43] and Hoang et al. [6] showed increasing positive priming effects with depth, indicating that microbial substrate limitation is higher in deep soil layers, which is also reflected by our results, except for 150 cm. Fierer et al. [37] also observed that microbial communities occupying deep soils are more resource limited than communities in upper soil layers. Thus, the observed stronger effects of glucose on enzyme activities in deep soil layers can be explained by more pronounced substrate limitations. In contrast to β-glucosidase, phosphatase activity in non-hotspot areas in 150–161 cm showed only small changes after glucose addition, indicating that even with substrate addition, microorganisms were less P limited than in both other deep soil layers. Changes in chitinase activity were also far lower in 150 cm depth, which either shows that chitooligosaccharides are not or barely present in this depth, and thus chitinase is not needed for degradation, or that only some microbes in the community were able to produce chitinase.
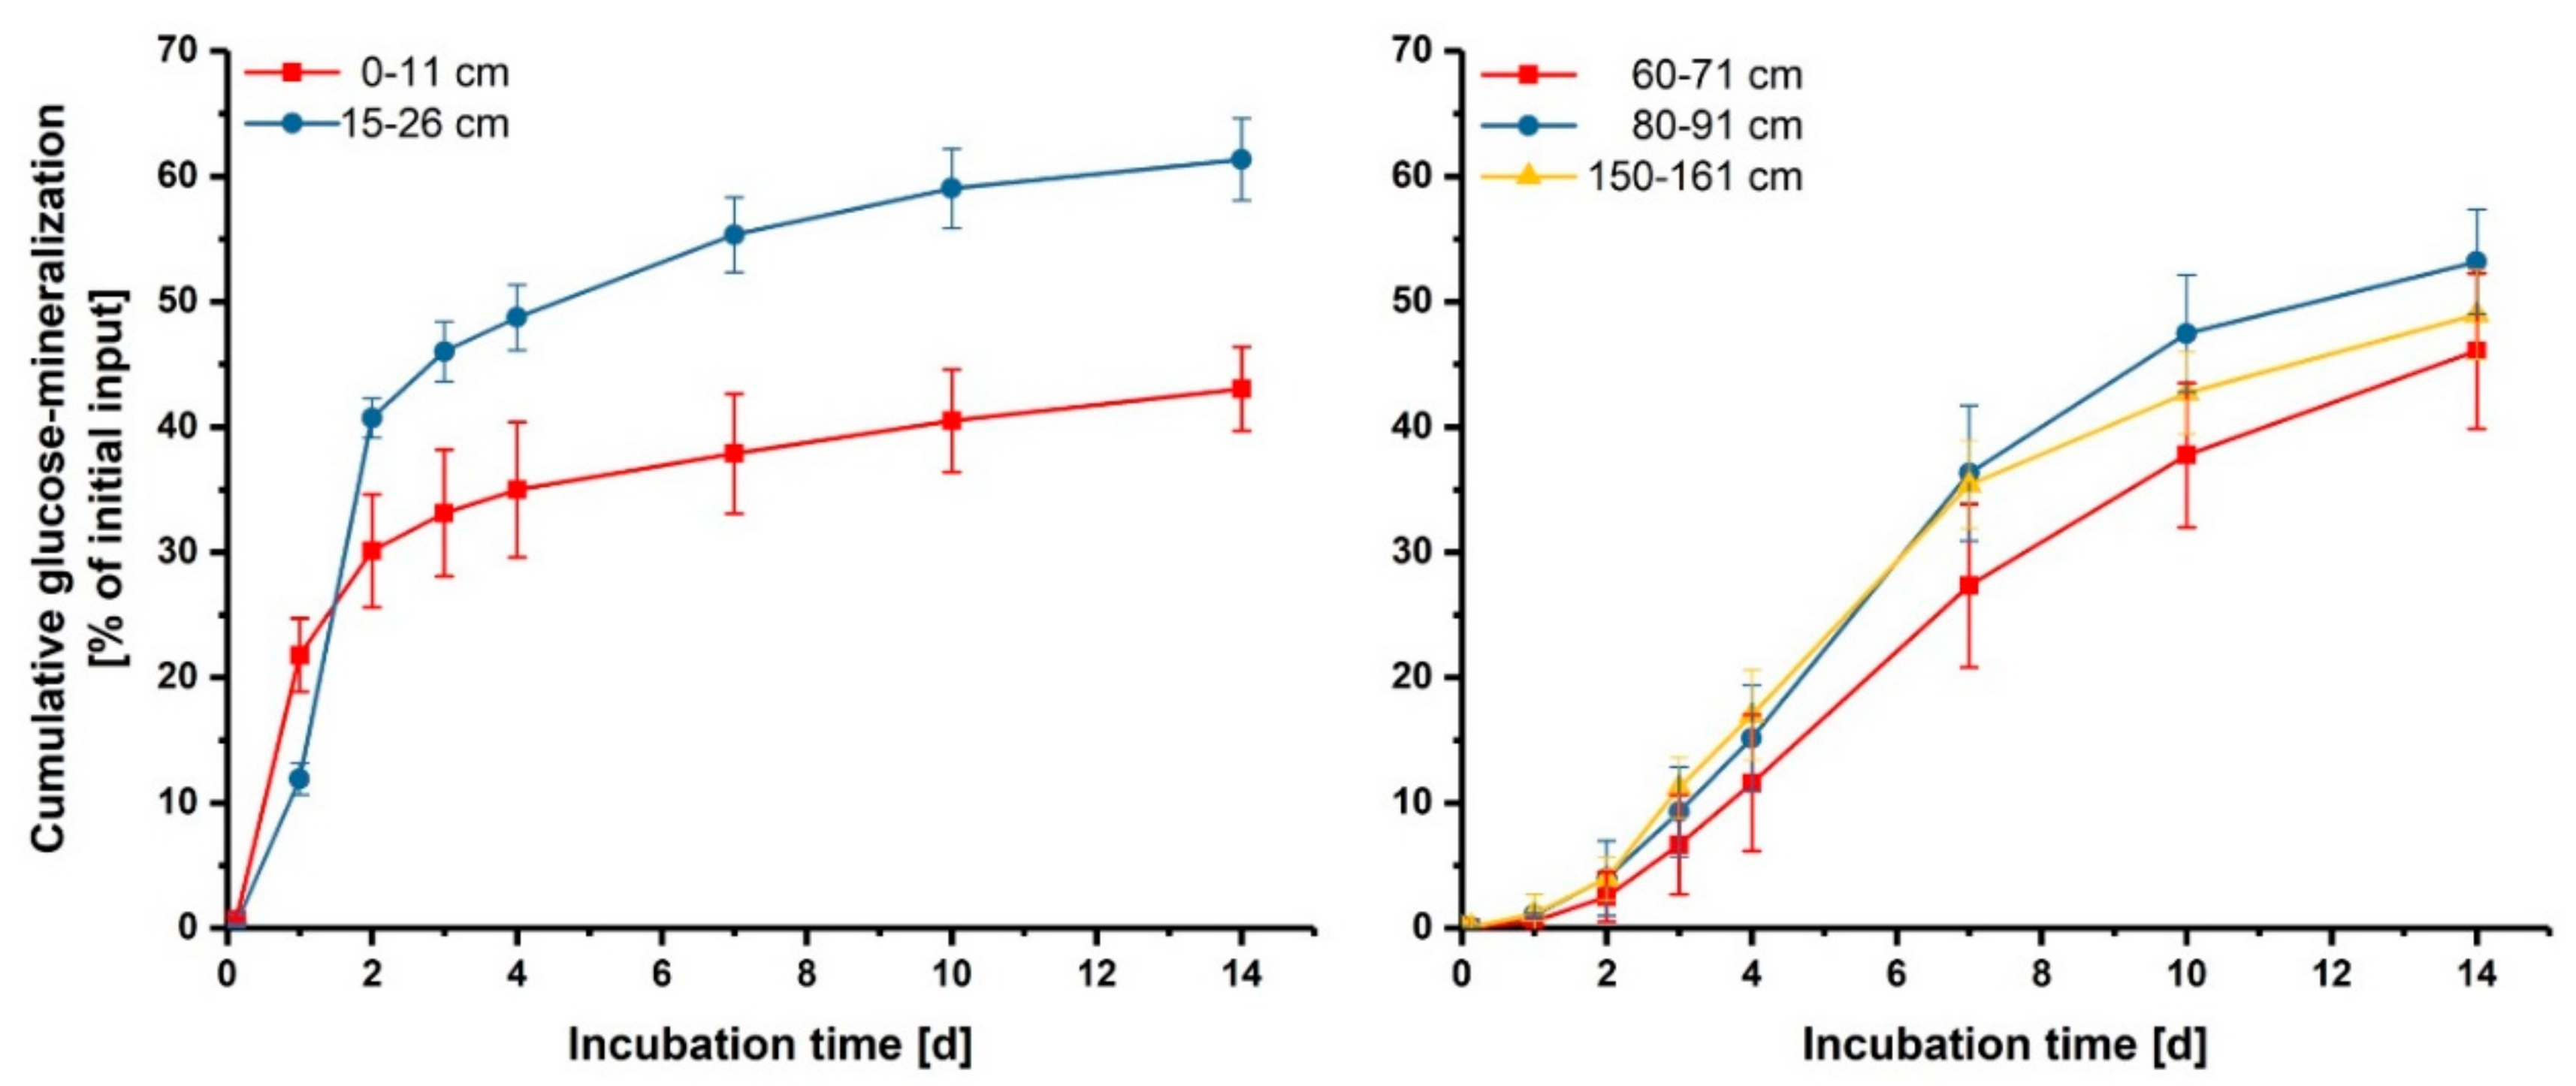
Distinct results between upper (1–26 cm) and deep subsoils (60–161 cm) were further observed for glucose mineralization patterns. During 14 days of incubation, 43% and 61% of initial glucose input was mineralized in 0–11 cm and 15–26 cm depth, respectively (Figure 5). The mineralization was characterized by an initial flush during the first 2 days, which then flattened off with progressing incubation. In the deeper soils, around 45% of total added glucose was mineralized during 14 days. Here, mineralization was characterized by an initial lag phase of 24 h and showed highest mineralization rates between day 3 and 7. This lag time suggests that dormant microorganisms had to be activated before they were able to utilize the newly arrived substrate, while the initial mineralization of glucose observed in the upper layers indicates that microorganisms rapidly switch from the inactive state to activity, i.e., potentially active microorganisms [14]. This result suggests that microorganisms temporarily receive substrates in the upper subsoil layers and are thus able to react faster to substrate inputs in comparison to microorganisms in deeper soil, which are near to starvation due to poorer substrate availability.
4. Conclusions
This study suggests that enzymatic-driven biogeochemical cycling is concentrated in small soil volumes in subsoil, while the major part of subsoils is barely active. The distribution of such hotspots is most likely related to areas of sufficient substrate inputs, such as the rhizosphere or preferential flow paths. Outside of these hotspots, microbial activity is strongly limited by substrate availability, especially in the investigated deep soil layers (60–161 cm). This implies that substrate limitation is a controlling factor for SOC turnover in subsoils, suggesting that SOC in cold spots is persisting over long time periods in soil until easily degradable substrate becomes available. Consequently, increased substrate input in non-hotspots would result in SOC losses from subsoils.
Supplementary Materials
The following are available online at https://www.mdpi.com/2571-8789/2/2/35/s1. Table S1: Mean relative change in enzyme activity given as % of initial activity and coefficient of variation in % of β-glucosidase, chitinase and acid phosphatase induced by glucose additions in hotspots (Hot) and non-hotspots (nHot). Table S2: Mean relative change of enzyme activities induced by water in initial hotspots and initial non-hotspots of subsoils from five different depths given as % (n = 5). Changes were evaluated as significant when p 0.05 as tested by paired t-test.
Author Contributions
B.M. and J.H. conceived and designed the experiments; J.H. performed the experiments; J.H. analyzed the data; J.H. wrote the paper with edits from B.M.
Acknowledgments
We would like to thank Henrik Redweik for soil sampling. This study was financially supported by the Deutsche Forschungsgemeinschaft (MA1830/13-1) and is part of the research unit FOR1806 “The Forgotten Part of Carbon Cycling: Organic Matter Storage and Turnover in Subsoils (SUBSOM)”. We want to thank the RUBION at the Ruhr-Universität Bochum for providing us laboratories and equipment for working with radiochemicals. Finally, we want to thank three anonymous reviewers for their helpful comments, which helped us to improve the manuscript.
Conflicts of Interest
The authors declare no conflict of interest. The founding sponsors had no role in the design of the study; in the collection, analyses, or interpretation of data; in the writing of the manuscript, and in the decision to publish the results.
References
- Lützow, M.V.; Kögel-Knabner, I.; Ekschmitt, K.; Matzner, E.; Guggenberger, G.; Marschner, B.; Flessa, H. Stabilization of organic matter in temperate soils: Mechanisms and their relevance under different soil conditions—A review. Eur. J. Soil Sci. 2006, 57, 426–445. [Google Scholar] [CrossRef]
- Jobbágy, E.G.; Jackson, R.B. The vertical distribution of soil organic carbon and its relation to climated and vegetation. Ecol. Appl. 2000, 10, 423–436. [Google Scholar] [CrossRef]
- Schmidt, M.W.; Torn, M.S.; Abiven, S.; Dittmar, T.; Guggenberger, G.; Janssens, I.A.; Kleber, M.; Kögel-Knabner, I.; Lehmann, J.; Manning, D.A.; et al. Persistence of soil organic matter as an ecosystem property. Nature 2011, 478, 49–56. [Google Scholar] [CrossRef] [PubMed] [Green Version]
- Rumpel, C.; Kögel-Knabner, I. Deep soil organic matter—A key but poorly understood component of terrestrial C cycle. Plant Soil 2011, 338, 143–158. [Google Scholar] [CrossRef]
- Banfield, C.C.; Dippold, M.A.; Pausch, J.; Hoang, D.T.T.; Kuzyakov, Y. Biopore history determines the microbial community composition in subsoil hotspots. Biol. Fert. Soils 2017, 53, 573–588. [Google Scholar] [CrossRef]
- Hoang, D.T.; Bauke, S.L.; Kuzyakov, Y.; Pausch, J. Rolling in the deep: Priming effects in earthworm biopores in topsoil and subsoil. Soil Biol. Biochem. 2017, 114, 59–71. [Google Scholar] [CrossRef]
- Leinemann, T.; Mikutta, R.; Kalbitz, K.; Schaarschmidt, F.; Guggenberger, G. Small scale variability of vertical water and dissolved organic matter fluxes in sandy Cambisol subsoils as revealed by segmented suction plates. Biogeochemistry 2016, 131, 1–15. [Google Scholar] [CrossRef]
- Chabbi, A.; Kögel-Knabner, I.; Rumpel, C. Stabilised carbon in subsoil horizons is located in spatially distinct parts of the soil profile. Soil Biol. Biochem. 2009, 41, 256–261. [Google Scholar] [CrossRef]
- Kuzyakov, Y.; Blagodatskaya, E. Microbial hotspots and hot moments in soil: Concept review. Soil Biol. Biochem. 2015, 83, 184–199. [Google Scholar]
- Athmann, M.; Kautz, T.; Banfield, C.; Bauke, S.; Hoang, D.T.; Lüsebrink, M.; Pausch, J.; Amelung, W.; Kuzyakov, Y.; Köpke, U. Six months of L. terrestris L. activity in root-formed biopores increases nutrient availability, microbial biomass and enzyme activity. Appl. Soil Ecol. 2017, 120, 135–142. [Google Scholar] [CrossRef]
- Uksa, M.; Schloter, M.; Kautz, T.; Athmann, M.; Köpke, U.; Fischer, D. Spatial variability of hydrolytic and oxidative potential enzyme activities in different subsoil compartments. Biol. Fert. Soils 2015, 51, 517–521. [Google Scholar] [CrossRef]
- Hoang, D.T.; Razavi, B.S.; Kuzyakov, Y.; Blagodatskaya, E. Earthworm burrows: Kinetics and spatial distribution of enzymes of C-, N- and P- cycles. Soil Biol. Biochem. 2016, 99, 94–103. [Google Scholar] [CrossRef]
- Dworkin, J.; Shah, I.M. Exit from dormancy in microbial organisms. Nature reviews. Microbiology 2010, 8, 890–896. [Google Scholar] [PubMed]
- Blagodatskaya, E.; Kuzyakov, Y. Active microorganisms in soil: Critical review of estimation criteria and approaches. Soil Biol. Biochem. 2013, 67, 192–211. [Google Scholar] [CrossRef]
- Joergensen, R.G.; Wichern, F. Alive and kicking: Why dormant soil microorganisms matter. Soil Biol. Biochem. 2018, 116, 419–430. [Google Scholar] [CrossRef]
- Heitkötter, J.; Heinze, S.; Marschner, B. Relevance of substrate quality and nutrients for microbial C-turnover in top- and subsoil of a Dystric Cambisol. Geoderma 2017, 302, 89–99. [Google Scholar] [CrossRef]
- Fontaine, S.; Barot, S.; Barré, P.; Bdioui, N.; Mary, B.; Rumpel, C. Stability of organic carbon in deep soil layers controlled by fresh carbon supply. Nature 2007, 450, 277–280. [Google Scholar] [CrossRef] [PubMed]
- Wordell-Dietrich, P.; Don, A.; Helfrich, M. Controlling factors for the stability of subsoil carbon in a Dystric Cambisol. Geoderma 2016, 40–48. [Google Scholar] [CrossRef]
- Heitkötter, J.; Marschner, B. Soil zymography as a powerful tool for exploring hotspots and substrate limitation in undisturbed subsoil. Soil Biol. Biochem. 2018, (in press). [Google Scholar]
- Krueger, J.; Bachmann, J. New Field Sampling Method to Analyze Spatial Distribution of Small-Scale Soil Particle Surface Properties and Processes in Intact Soil. Vadose Zone J. 2017, 16. [Google Scholar] [CrossRef]
- Spohn, M.; Kuzyakov, Y. Spatial and temporal dynamics of hotspots of enzyme activity in soil as affected by living and dead roots—A soil zymography analysis. Plant Soil 2014, 379, 67–77. [Google Scholar] [CrossRef]
- Burns, R.G.; DeForest, J.L.; Marxsen, J.; Sinsabaugh, R.L.; Stromberger, M.E.; Wallenstein, M.D.; Weintraub, M.N.; Zoppini, A. Soil enzymes in a changing environment: Current knowledge and future directions. Soil Biol. Biochem. 2013, 58, 216–234. [Google Scholar] [CrossRef]
- Olander, L.P.; Vitousek, P.M. Regulation of soil phosphatase and chitinase activityby N and P availability. Biogeochemistry 2000, 49, 175–191. [Google Scholar] [CrossRef]
- IUSS Working Group WRB. World Reference Base for Soil Resources 2014: International Soil Classification System for Naming Soils and Creating Legends for Soil Maps; FAO: Rome, Italy, 2014. [Google Scholar]
- Bundesanstalt für Bodenforschung. Geologische Übersichtskarte 1:200,000; Bundesanstalt für Bodenforschung: Hannover, Germany, 1973. [Google Scholar]
- Heinze, S.; Ludwig, B.; Piepho, H.P.; Mikutta, R.; Don, A.; Wordell-Dietrich, P.; Helfrich, M.; Hertel, D.; Leuschner, C.; Kirfel, K.; et al. Factors controlling the variability of organic matter in the top- and subsoil of a sandy Dystric Cambisol under beech forest. Geoderma 2018, 311, 37–44. [Google Scholar] [CrossRef]
- Angst, G.; John, S.; Mueller, C.W.; Kogel-Knabner, I.; Rethemeyer, J. Tracing the sources and spatial distribution of organic carbon in subsoils using a multi-biomarker approach. Sci. Rep. 2016, 6, 29478. [Google Scholar] [CrossRef] [PubMed]
- Tückmantel, T.; Leuschner, C.; Preusser, S.; Kandeler, E.; Angst, G.; Mueller, C.W.; Meier, I.C. Root exudation patterns in a beech forest: Dependence on soil depth, root morphology, and environment. Soil Biol. Biochem. 2017, 107, 188–197. [Google Scholar] [CrossRef]
- Quantum GIS Development Team. Quantum GIS Geographic Information System; Open Source Geospatial Foundation Project; 2017; Available online: https://qgis.org/en/site/about/index.html (accessed on 28 June 2017).
- Schindelin, J.; Arganda-Carreras, I.; Frise, E.; Kaynig, V.; Longair, M.; Pietzsch, T.; Preibisch, S.; Rueden, C.; Saalfeld, S.; Schmid, B.; et al. Fiji: An open-source platform for biological-image analysis. Nat. Methods 2012, 9, 676–682. [Google Scholar] [CrossRef] [PubMed]
- R Development Core Team. R: A Language and Environment for Statistical Computing; R Development Core Team: Vienna, Austria, 2015. [Google Scholar]
- Köhl, M.; Magnussen, S.; Marchetti, M. Sampling Methods, Remote Sensing and GIS Multiresource Forest Inventory; Springer: Berlin/Heidelberg, Germany, 2006. [Google Scholar]
- Loeppmann, S.; Blagodatskaya, E.; Pausch, J.; Kuzyakov, Y. Enzyme properties down the soil profile—A matter of substrate quality in rhizosphere and detritusphere. Soil Biol. Biochem. 2016, 103, 274–283. [Google Scholar] [CrossRef]
- Nunan, N.; Wu, K.; Young, I.M.; Crawford, J.W.; Ritz, K. Spatial distribution of bacterial communities and their relationships with the micro-architecture of soil. FEMS Microbiol. Ecol. 2003, 44, 203–215. [Google Scholar] [CrossRef] [Green Version]
- Tecon, R.; Or, D. Biophysical processes supporting the diversity of microbial life in soil. FEMS Microbiol. Rev. 2017, 41, 599–623. [Google Scholar] [CrossRef] [PubMed] [Green Version]
- Leinemann, T.; Preusser, S.; Mikutta, R.; Kalbitz, K.; Cerli, C.; Höschen, C.; Mueller, C.W.; Kandeler, E.; Guggenberger, G. Multiple exchange processes on mineral surfaces control the transport of dissolved organic matter through soil profiles. Soil Biol. Biochem. 2018, 118, 79–90. [Google Scholar] [CrossRef]
- Fierer, N.; Schimel, J.P.; Holden, P.A. Variations in microbial community composition through two soil depth profiles. Soil Biol. Biochem. 2003, 35, 167–176. [Google Scholar] [CrossRef] [Green Version]
- Eilers, K.G.; Debenport, S.; Anderson, S.; Fierer, N. Digging deeper to find unique microbial communities: The strong effect of depth on the structure of bacterial and archaeal communities in soil. Soil Biol. Biochem. 2012, 50, 58–65. [Google Scholar] [CrossRef]
- He, S.; Guo, L.; Niu, M.; Miao, F.; Jiao, S.; Hu, T.; Long, M. Ecological diversity and co-occurrence patterns of bacterial community through soil profile in response to long-term switchgrass cultivation. Sci. Rep. 2017, 7, 3608. [Google Scholar] [CrossRef] [PubMed]
- Billings, S.A.; Ballantyne, F. How interactions between microbial resource demands, soil organic matter stoichiometry, and substrate reactivity determine the direction and magnitude of soil respiratory responses to warming. Glob. Chang. Biol. 2013, 19, 90–102. [Google Scholar] [CrossRef] [PubMed]
- Blagodatskaya, E.; Kuzyakov, Y. Mechanisms of real and apparent priming effects and their dependence on soil microbial biomass and community structure: Critical review. Biol. Fert. Soils 2008, 45, 115–131. [Google Scholar]
- Karhu, K.; Hilasvuori, E.; Fritze, H.; Biasi, C.; Nykänen, H.; Liski, J.; Vanhala, P.; Heinonsalo, J.; Pumpanen, J. Priming effect increases with depth in a boreal forest soil. Soil Biol. Biochem. 2016, 99, 104–107. [Google Scholar] [CrossRef]
- Heitkötter, J.; Niebuhr, J.; Heinze, S.; Marschner, B. Patterns of nitrogen and citric acid induced changes in C-turnover and enzyme activities are different in topsoil and subsoils of a sandy Cambisol. Geoderma 2017, 292, 111–117. [Google Scholar] [CrossRef]
Figure 1.
Activity of β-glucosidase, chitinase and acid phosphatase in pM mm−2 h−1 determined on the flow cells sampled at different depths. Red dotted line separates top- from subsoil.
Figure 1.
Activity of β-glucosidase, chitinase and acid phosphatase in pM mm−2 h−1 determined on the flow cells sampled at different depths. Red dotted line separates top- from subsoil.
Figure 2.
Characterization of enzyme activities, hotspots and hotspot distribution in different depths. (A) Average enzyme activity; (B) hotspot area; (C) hotspot size; (D) ratio between activity in hotpots to non-hotspots; (E) hotspot nearest neighbor index and (F) pattern similarity between enzyme activities. n.d. = not determined, since the number of hotspots was too small for calculating the nearest neighbor index. Shown are means and standard errors of four subsamples.
Figure 3.
Phosphatase activity before and after incubation in pM mm−2 h−1 in 80–91 cm depth (left). Glucose-induced increases in phosphatase activity are shown (right). Black color indicates decreased phosphatase activity. White boundaries show initial hotspots.
Figure 3.
Phosphatase activity before and after incubation in pM mm−2 h−1 in 80–91 cm depth (left). Glucose-induced increases in phosphatase activity are shown (right). Black color indicates decreased phosphatase activity. White boundaries show initial hotspots.
Figure 4.
Mean changes of enzyme activities of β-glucosidase, chitinase and acid phosphatase in non-hotspots given as % of initial activity (left). Coefficient of variation of the mean change in non-hotspots of β-glucosidase, chitinase and acid phosphatase (right).
Figure 4.
Mean changes of enzyme activities of β-glucosidase, chitinase and acid phosphatase in non-hotspots given as % of initial activity (left). Coefficient of variation of the mean change in non-hotspots of β-glucosidase, chitinase and acid phosphatase (right).

Figure 5.
Glucose mineralization during 14 days of incubation in % of initial glucose input in different depths. Shown are means and standard errors of three subsamples.
Figure 5.
Glucose mineralization during 14 days of incubation in % of initial glucose input in different depths. Shown are means and standard errors of three subsamples.


Table 1.
Mean relative change of enzyme activities induced by glucose in initial hotspots and initial non-hotspots of subsoils from five different depths, given as % (n = 5). Changes were evaluated as significant when p 0.05, as tested by paired t-test.
Table 1.
Mean relative change of enzyme activities induced by glucose in initial hotspots and initial non-hotspots of subsoils from five different depths, given as % (n = 5). Changes were evaluated as significant when p 0.05, as tested by paired t-test.
| Location | Parameter | β-Glucosidase | Chitinase | Acid Phosphatase |
|---|---|---|---|---|
| Initial hotspot | Mean | 2.0 | 6.4 | 39.9 |
| Std. Error | 13.7 | 35.0 | 34.7 | |
| p-value | 0.96 | 0.69 | 0.34 | |
| Initial non-hotspot | Mean | 307.2 | 189.1 | 184.6 |
| Std. Error | 198.4 | 101.9 | 93.6 | |
| p-value | 0.027 * | 0.032 * | 0.020 * |
* Significant changes.
© 2018 by the authors. Licensee MDPI, Basel, Switzerland. This article is an open access article distributed under the terms and conditions of the Creative Commons Attribution (CC BY) license (http://creativecommons.org/licenses/by/4.0/).
Share and Cite
MDPI and ACS Style
Heitkötter, J.; Marschner, B. Is There Anybody Out There? Substrate Availability Controls Microbial Activity outside of Hotspots in Subsoils. Soil Syst. 2018, 2, 35. https://doi.org/10.3390/soilsystems2020035
AMA Style
Heitkötter J, Marschner B. Is There Anybody Out There? Substrate Availability Controls Microbial Activity outside of Hotspots in Subsoils. Soil Systems. 2018; 2(2):35. https://doi.org/10.3390/soilsystems2020035
Chicago/Turabian StyleHeitkötter, Julian, and Bernd Marschner. 2018. "Is There Anybody Out There? Substrate Availability Controls Microbial Activity outside of Hotspots in Subsoils" Soil Systems 2, no. 2: 35. https://doi.org/10.3390/soilsystems2020035