Article

Distinctive Roles of Two Aggregate Binding Agents in Allophanic Andisols: Young Carbon and Poorly-Crystalline Metal Phases with Old Carbon

1
National Agriculture and Food Research Organization, Institute for Agro-Environmental Sciences, 3-1-3 Kan-Nondai, Tsukuba 305-8604, Ibaraki, Japan
2
National Institute for Environmental Studies, 16-2 Onogawa, Tsukuba 305-8506, Ibaraki, Japan
3
Faculty of Life and Environmental Sciences, University of Tsukuba, 1-1-1 Tennodai, Tsukuba 305-8572, Ibaraki, Japan
*
Author to whom correspondence should be addressed.
Soil Syst. 2018, 2(2), 29; https://doi.org/10.3390/soilsystems2020029
Submission received: 3 December 2017 / Revised: 20 April 2018 / Accepted: 27 April 2018 / Published: 7 May 2018
(This article belongs to the Special Issue Soil Organic Matter Dynamics)

Abstract

:
Interaction of organic matter (OM) with soil mineral components plays a critical role in biophysical organization (aggregate structure) as well as in biogeochemical cycling of major elements. Of the mineral components, poorly-crystalline phases rich in iron (Fe) and aluminum (Al) are highly reactive and thus contribute to both OM stabilization and aggregation. However, the functional relationship among the reactive metal phases, C stability, and aggregation remains elusive. We hypothesized that relatively young C acts as a binding agent to form the aggregates of weak physical stability, whereas the reactive metal phases and older C bound to them contribute to stronger aggregation. Using four surface horizons of Andisols having a gradient of soil C concentration due to decadal OM management, we conducted sequential density fractionation to isolate six fractions (from <1.6 to >2.5 g cm−3) with mechanical shaking, followed by selective dissolution and radiocarbon analysis. After 28 years of no-till with litter compost addition, not only C and N but inorganic materials including the reactive metal phases (pyrophosphate-, oxalate-, and dithionite-extractable metals) showed clear shifts in their concentrations towards lower-density fractions (especially <2.0 g cm−3) on a ground-area basis. This result was explained by the binding of compost-derived OM with soil particles. Major portions of the reactive metal phases in bulk samples were distributed in mid-density fractions (2.0–2.5 g cm−3) largely as sonication-resistant aggregates. Theoretical density calculations, together with depletion in radiocarbon (Δ14C: −82 to −170‰) and lower C:N ratio, implied that the sorptive capacity of the reactive metal phases in these fractions were roughly saturated with pre-existing OM. However, the influx of the compost-derived, modern C into the mid-density fractions detected by the paired-plot comparison suggests decadal C sink in association with the reactive metal phase. Our results supported the concept of aggregate hierarchy and further provided the following new insights. At the high hierarchy level where shaking-resistant aggregates form, soil organo-mineral particles appeared to be under a dynamic equilibrium and the changes in OM input regime controlled (dis)aggregation behavior due to the binding effect of relatively young C. At a lower hierarchy level, the reactive metal phases were bound to N-rich, 14C-depleted OM and together functioned as persistent binding agent. Our study suggests that the recognition of binding agents and aggregate hierarchy level would help to untangle the complex organo-mineral interactions and to better understand soil C stability.

Graphical Abstract

1. Introduction

Organic matter (OM) plays a critical role in both physical structuring and biogeochemical functioning of soil [1,2]. Aggregates, subsets of soil structure, are naturally-occurring clusters of organic and mineral particles commonly found in surface soils where OM input is high. Binding of OM with soil minerals is considered as a fundamental process controlling both aggregate formation and OM stability [3,4,5]. However, the mechanistic relationship between the two remains unclear.
Soil aggregates have hierarchical structure and are considered to be maintained by multiple types of binding agents (e.g., glue vs. cement) that operate at different hierarchy levels [6]. OM acts as a primary binding agent at a high hierarchy level, responsible for the formation of macroaggregate (water-stable aggregates of >250 μm diameter) [7,8]. These aggregates tend to be disrupted by weak energy such as tillage in the field and mechanical shaking in laboratory. In a wide range of soils, an in-situ formation of macroaggregates can occur in a few weeks after OM addition as plant residues and organic amendment [7,8,9]. Enmeshment by fine roots and fungal hyphae as well as gluing via microbial metabolites (e.g., extracellular polysaccharide) are considered as major binding mechanisms [3]. These living and dead OM are often called “ephemeral or transient” binding agents due to their high biodegradability [6,7].
Binding agents responsible for stronger aggregation occurring at lower hierarchy levels (e.g., microaggregates resistant to shaking or sonication) are much less understood [5]. Some amorphous or colloidal materials persistent in soil against losses (e.g., microbial degradation, chemical dissolution, and erosion) are considered to play greater roles at these levels [5,6]. Fully inorganic ones, sometimes called “cementing” agents, tend to undergo frequent dissolution/precipitation cycle through pH/eh fluctuation. The examples are iron oxides commonly present in highly weathered soils [10,11] and carbonates in soils under drier climate [12,13]. Organic binding agents regarded to be important at lower hierarchy levels are microbial metabolites and necromass [6,14]. These potentially-labile organic compounds are, in turn, protected by the association with reactive soil minerals from microbial degradation [15,16,17]. Thus, such organo-mineral materials are likely to be quite effective binding agents at the lower hierarchy levels even though this aspect of organo-mineral interaction has not received much attention until recently [5,18].
The aggregate hierarchy concept was initially developed in soils of crystalline clay mineralogy (e.g., Alfisols and Mollisols) where organic binding agents play a more dominant role than inorganic ones [9]. Hierarchical structure in more strongly aggregated soils such as Vertisols and Oxisols was later recognized by the examination of finer spatial scales using higher disruption energy [19,20]. Volcanic soils, taxonomically Andisols or Andosols, are characterized by high contents of reactive metal phases that largely consist of poorly-crystalline materials such as allophane and imogolite-type minerals as well as aluminum (Al) and iron (Fe) monomers complexed with organic ligands [21]. These metal phases show high OM affinity [22,23,24] and appear to act as highly effective binding agents [18], which explains the high aggregate stability in Andisols [25,26].
These reactive metal phases, forming via chemical weathering of Fe- or Al-containing parent materials, are not restricted to Andisols and tend to be abundant in soils under relatively high supplies of OM (e.g., high primary production), rapid weathering (e.g., abundant weatherable minerals), and/or high acidity and rainfall. Significant positive correlation between soil OM and the reactive metal contents have been reported among a wide range of soil types (e.g., Table 4 in [27], also see [28]). More recently, significant metal control on OM storage was shown at a global scale [29]. Three-way positive relationship may be present among the reactive metal content, aggregate stability, and OM storage [18,26]. However, it remains challenging to distinguish among organic, inorganic, and organo-mineral binding agents and to identify dominant binders at different levels of aggregate hierarchy.
The degree of aggregation is not fully accounted for in physical fractionation studies. Isolation technique for decaying plant litter is well-established in both size- and density-based fractionations (POM and LF) [30,31]. When attempting to distinguish multiple types of mineral-associated OM by density, some use mechanical shaking [32,33,34,35,36] and others use stronger forces such as glass-bead shaking and sonication [22,37,38,39,40]. However, the effect of aggregate disruption level on the outcome of density fractionation has rarely been tested [41,42,43]. It thus remains unclear to what extent we can compare the results of the same density fraction (e.g., 2.0–2.5 g cm−3) from different soils that have different mixture of binding agents or that are isolated by different disruption techniques. One of the basic information lacking is how the degree of aggregation affects the distribution of OM and the inorganic phases such as the reactive metal phases among density fractions.
Density-based fractionation approach may have an advantage of detecting OM-induced aggregation process even though aggregate–OM relationship has largely been studied based on the size of aggregates and particles [4,8,31]. The fundamental process controlling the density of soil particles and aggregates is OM adhesion to mineral particle because: (i) the density of OM in soil (ca. 1.4 g cm−3 [16,44]) is much lower than that of mineral particles (typically 2.2–2.8 g cm−3 for the primary and secondary minerals commonly found in soil except for hydrous Fe oxides that have >3.5 g cm−3 [45]); and (ii) multiple chemical forces allow OM–mineral interaction in soil such as cation exchange, proton transfer, hydrogen bonding, van der Waals interactions, bridging complexation, and ligand exchange [46]. One potential advantage of density-based approach over size-based approach is its ability to isolate the aggregation induced by low-density, organic binder because the size change can result from both organic and inorganic binding agents. For instance, OM binding to a silt-size particle can be detected by fractionation at small density interval steps (e.g., <1.6, 1.6–1.8, 1.8–2.0, 2.0–2.2 g cm−3) even when the OM-bound particle remains in silt-size range. Lowering of particle density upon OM binding to reactive Al and Fe phases has been shown in laboratory sorption and co-precipitation experiments [43]. OM–mineral interaction in the field is, however, much more complex. Wide variations in both OM and mineral compositions, physical manner by which OM is mixed in soil (tillage and bioturbation), climate regime (e.g., diurnal, seasonal, and wet/dry cycle) and biological processes (microbial and soil faunal activities) can affect the degree of aggregation.
The first objective of current study was to test the basic assumption behind density fractionation that OM binding controls the density distribution of soil particles in field soils. Specifically, if: (i) newly-added OM (e.g., compost) randomly adheres to soil particles of various sizes and densities during its decay; and (ii) the adhesion force exceeds the dispersion energy applied during fractionation procedure, then the net effect is the shift in density distribution of soil particles towards lower density. The second objective was to test whether the reactive metal phases contribute to the aggregation at the high hierarchy level where organic binding agents operate (e.g., formation of shaking-resistant aggregate) or at a lower level (e.g., that of sonication-resistant aggregate). If the reactive metal phases preferentially bind to the newly-added OM, then more of these metals are isolated in lower-density fractions compared to other mineral phases. Alternatively, if the reactive metal phases are fully bound with pre-existing OM (i.e., protective capacity is saturated), then the metal distribution is unaffected by the OM addition and the metal phases are recovered in mid-density fractions because the dominant metal phases bound to OM should have the net density of 2.2–2.4 g cm−3 assuming the maximum OM sorption on allophane and imogolite type mineral phases [42].
We tested these ideas by conducting sequential density fractionation for five surface horizon samples of allophanic Andisol along a clear soil OM concentration gradient resulted from decadal OM management (no-till plus compost addition, conventional tillage, and bare fallow). Six density fractions isolated after mechanical shaking were characterized by C, N, and extractable metal concentrations as well as radiocarbon content. We examined how the OM input regime affected the concentration and standing stocks of OM and the reactive metal phases among the density fractions. Our results suggested that OM and the reactive metal phases acted as binding agents in soil particles of different density ranges and at different hierarchy levels. We proposed a conceptual model of organo-mineral aggregate continuum along particle density gradient as an attempt to link the observed aggregation behavior with the characteristics of OM and binding agents.

Terminology

Soil particle is used in a broad sense to include purely organic primary particles (e.g., plant litter), primary and secondary mineral particles (e.g., quartz grain and kaolinite crystallite), and aggregated particles. We use the term aggregate to refer to any cluster of particles of all sizes from macro- and micro-aggregates down to submicron composites because even clay- and fine-clay-sized particles are largely clusters of particles [5,14,18]. Aggregate hierarchy level refers to the degree of aggregation according to the original concept [6,9] and is recognized by the resistance of particles to different levels of aggregate disruption energy. Thus, aggregates present at a low hierarchy level represent physically-stable aggregates that survived stronger disruptive energy and thus tend to be smaller (more fragmented) compared to those at higher hierarchy level. Reactive metals in this study refer to the metals, mainly Fe and Al, extractable from soil by selective dissolution techniques (pyrophosphate, acid oxalate, or dithionite). The reactive metal phases extracted include monomeric metal cations (mostly Al and, to a less extent, Fe) complexed with organic ligands (often called organo-metal complexes), short-range-order (SRO) minerals such as allophane- and imogolite-type minerals including proto-imogolite, amorphous gibbisite, ferrihydrite, and nanocrystalline goethite, as well as minor fractions of more crystalline Fe and Mn oxides, hydroxides, and oxyhydroxides (e.g., [47,48,49]). Silicon (Si) extracted by the oxalate and dithionite reagents is also reported together as it is a major component of allophane and imogolite-type minerals. We also report manganese (Mn) as a part of the reactive metals because of its co-occurrence with Fe, potential reactivity with OM, and linkage to trance metal dynamics (e.g., [50,51,52]) in volcanic soils.

2. Materials and Methods

2.1. Study Site and Soil Properties

Our study site was the experimental agricultural field at National Institute of Agro-Environmental Science in Ibaraki, Japan (36°01′ N, 140°07′ E, 21 m a.s.l). The soils at the site is classified as Hydric Hapludand (Soil Taxonomy) and Hydric-Silic Andosol (IUSS, WRB). Parent material is mainly rhyolitic and/or basaltic volcanic ash deposits from Mt. Asama, Mt. Fuji, and Mt. Hakone. These tephras were deposited directly on the site and/or transported afterward. Dominant clay-sized mineral in the studied soils are short-range-order (SRO) minerals that largely consist of allophane/imogolite-type mineral and, to a less extent, hydrous iron oxides such as ferrihydrite. The soil also contains minor amounts of gibbsite, kaolinite, chlorite, hydroxyl-interlayered vermiculite, mica, quartz, and feldspar. Mean annual air temperature is 13.7 °C and rainfall is 1300 mm year−1. Mean annual soil temperature at 0–50 cm is 15.2 °C (monthly mean ranged 1.3–29.2 °C).
We selected four plots under contrasting OM management practices, to have a gradient in soil total organic C (TC) concentration among the soil samples (Table 1). Surface soil samples (0–20 cm) examined here are the subsets of the samples used in our previous study [53]. Briefly, no-tillage plot (NT) has been under no-till management with leaf litter compost addition (up to 7 ton C ha−1 year−1) for the last 28 years. The previously plowed horizon (ca. 0–20 cm) showed clear horizonation—more developed granular structure (abundant macroaggregates) at upper layer and reddish color with more massive structure at lower layer (Figure S1). We thus sampled the soil from NT plot at two depths: top 0–5 cm layer (NT-a) and 5–20 cm layer (NT-b). Adjacent plot to NT plot is conventional tillage plot where entire plow layer (0–20 cm) was sampled (Till-1). Both plots were under soybean/winter-wheat rotation since 1983. All crop residues were chopped and returned to the field at NT but removed at Till-1 plot. The third plot (Till-2) is located 320 m southeast from NT/Till-1 plots and had similar management to Till-1 except that root stumps were also removed each year. Annual input of chemical fertilizer was 30 kg N, 100 kg P, and 100 kg K for Till-1 and 96 kg N, 158 kg P, and 158 kg K for Till-2. The fourth plot, adjacent to Till-2, has been kept bare since 2004 with occasional tillage to remove weeds (Bare). In November 2011, six core samples were taken from each plot and composited followed by 2-mm sieving for further analyses.

2.2. Density Fractionation

Physical fractionation requires some degrees of soil dispersion in liquid. We choose to disrupt aggregates by mechanical shaking and the clustered particles isolated were operationally defined as shaking-resistant aggregates that are formed at an intermediate hierarchy level. We did not focus on a higher hierarchy level which can be achieved by weaker disruption energy (e.g., wet sieving approach more commonly used for the studies on OM–aggregate relationship) based on our initial test to isolate water-stable aggregates. Due to the strong aggregate stability of Andisols, C and N concentrations as well as C:N ratio of the soil from NT plot were consistently higher by 2.1–3.1 folds compared to Till-1 soil for all aggregate-size fractions (Table S1). We also avoided stronger disruption by sonication to reach a lower hierarchy level because OM-induced binding forces may be weaker than the sonication energy.
Sequential density fractionation was conducted for the five soil samples (field moist condition) using sodium polytungstate solution (SPT-0 grade, Sometsu, Germany) with mechanical shaking as a mean to disrupt less-stable aggregates. We sequentially isolated six density fractions (F1: <1.6; F2: 1.6–1.8; F3: 1.8–2.0; F4: 2.0–2.25; F5: 2.25–2.5; and F6: >2.5 g cm−3). Detail procedure of the density fractionation is described elsewhere [42]. All fractions were rinsed with deionized water until salt concentration reached <50 μS cm−1. F1 was oven-dried at 80 °C and the other fractions were freeze-dried. All fractions except for F1 were further dry-sieved (250 μm) to isolate coarse sand fraction. Its mass proportion per fraction (mean ± SD) was zero in F2, 1.0 ± 0.1% in F3-F4, 1.5 ± 2.0% in F5, and 2.7 ± 1.1% in F6 among the soil samples. The coarse sand fraction largely consisted of primary mineral particles based on light microscopy in accord with previous studies of volcanic ash soils [54]. We thus assumed negligible OM and reactive metal contents in this fraction and removed it prior to further chemical characterization.

2.3. Characterization of Isolated Density Fractions

Total organic C and total N concentrations in the isolated fractions were analyzed by an elemental analyzer (Flash2000 Thermo Fisher Scientific Inc., Waltham, MA, USA). No carbonate is present in these moderately acidic, tephra derived soils. Thus, total C equals to total organic C and was expressed as TC in this study. The major elements consisting reactive metal phases (Al, Si, Fe, and Mn) in each fraction were quantified by a series of selective extractions: pyrophosphate (PP) followed by acid oxalate (OX) and then dithionite-citrate (DC). First, PP extraction was done at the soil:solution ratio of 100 mg:10 mL with 0.1 M sodium pyrophosphate (pH = 10), shaken at 120 rpm for 16 h. After high-speed centrifugation (29,000 g, 45 min), supernatant was diluted and vacuum-filtered through 0.025 µm membrane filter (mixed cellulose ester, Millipore, Billerica, MA, USA) before dissolved C, N, and metal analyses. Second, the residue after discarding the remaining supernatant was extracted with 10 mL of 0.2 M acidified sodium oxalate solution (pH = 3.0), shaken at 120 rpm for 4 h in the dark. Sodium oxalate instead of conventional ammonium oxalate was used to quantify the amount of N co-dissolved [55]. Third, 0.1 g of sodium dithionite was added to the remaining residue and mixed with 10 mL of 22% (by wt) sodium citrate for 16 h. All extractions were done at room temperature (20–22 °C) and centrifugation condition was the same for all extractions. No filtration was done for the supernatants after OX and DC extractions based on previous pilot test [55]. Co-dissolved C and N by PP and OX extractions will be reported elsewhere. Metal concentrations were determined by inductivity coupled plasma-optical emission spectroscopy (Varian Inc., Vista-Pro, Mulgrave, Australia). The metal analyses were done for all fractions except for F1 from Bare soil due to limited mass recovery. We used the sum of Al and a half of Fe concentrations (Al + 0.5Fe) as an index of “reactive metal” content in soil fractions to roughly normalize the atomic mass difference between Al and Fe. We also estimated the content of allophane/imogolite-type mineral and ferrihydrite based on OX-extractable Si and Fe, respectively [56].
The radiocarbon contents of the bulk sample and the density fractions were measured by accelerated mass spectrometry at the National Institute for Environmental Study (NIES-TERRA), Japan [57,58]. Finely ground samples were combusted in sealed quartz tubes (with CuO) to CO2 which was purified and graphitized by reduction under H2 in the presence of Fe power [59].

2.4. Standing Stocks of C and Extractable Metals

We compared the distributions of mass and measured elements (C, N, and reactive metals) across the density fractions on a ground area basis by calculating standing stocks as follows. Due to the difference in bulk density, soil mass in top 0–20 cm varied from 117 to 157 kg m−2 among the four soils. We thus normalized it based on the 0–20 cm soil mass of NT plot which had the lowest mass. In other words, 0–20 cm of NT was compared with top 15.0–16.1 cm of Till-1, Till-2, and Bare soils to have the same soil mass per unit ground area. The normalized soil mass was multiplied by the elemental concentrations of whole soil to calculate the mass-equivalent total standing stock. The standing stock was partitioned into each density fraction based on the measured concentration and distribution of each element. For this purpose, the distribution was calculated assuming 100% recovery of each measured element from the six density fractions.

2.5. Statistical Analysis

We designed this study to examine the two objectives above using a series of soils developed on the same parent material, climate, topography, and time but differed only in the OM input regime due to the decadal OM management. Because we did not have field replication of the OM management (e.g., NT, Till, and Bare), we used one composite sample per management and thus no statistical inference can be made on the management effect. Instead, we focused on the changes in the elemental concentrations and distributions both among the four soils and across the six density fractions along the management-induced soil OM concentration gradient.
Analytical errors associated with the density fractionation were reasonably low in our previous study which used the same Till-1 soil sample. Specifically, the recovery of mass, C, and N were 100 ± 2%, 86 ± 6%, and 90 ± 10% (mean ± SD) and the coefficient of variation for the elemental concentration in each fraction was 12 ± 11% for C, 10 ± 3% for N, 6 ± 3% for AlPP, 10 ± 6% for FePP, 7 ± 11% for AlOX, 3 ± 3% for FeOX, and 5 ± 6% for SiOX (mean ± SD) for three analytical replicates of Till-1 sample from a field-moist condition [42], which gave us some confidence to compare the five soil samples without replication for current study. Correlation analyses of Δ14C against C:N ratio and the aromaticity index from previous study (based on solid-state 13C-NMR [53]) were conducted using JMP8 (SAS Institute).

3. Results

3.1. Carbon and Nitrogen

3.1.1. Recovery, Concentration and Distribution
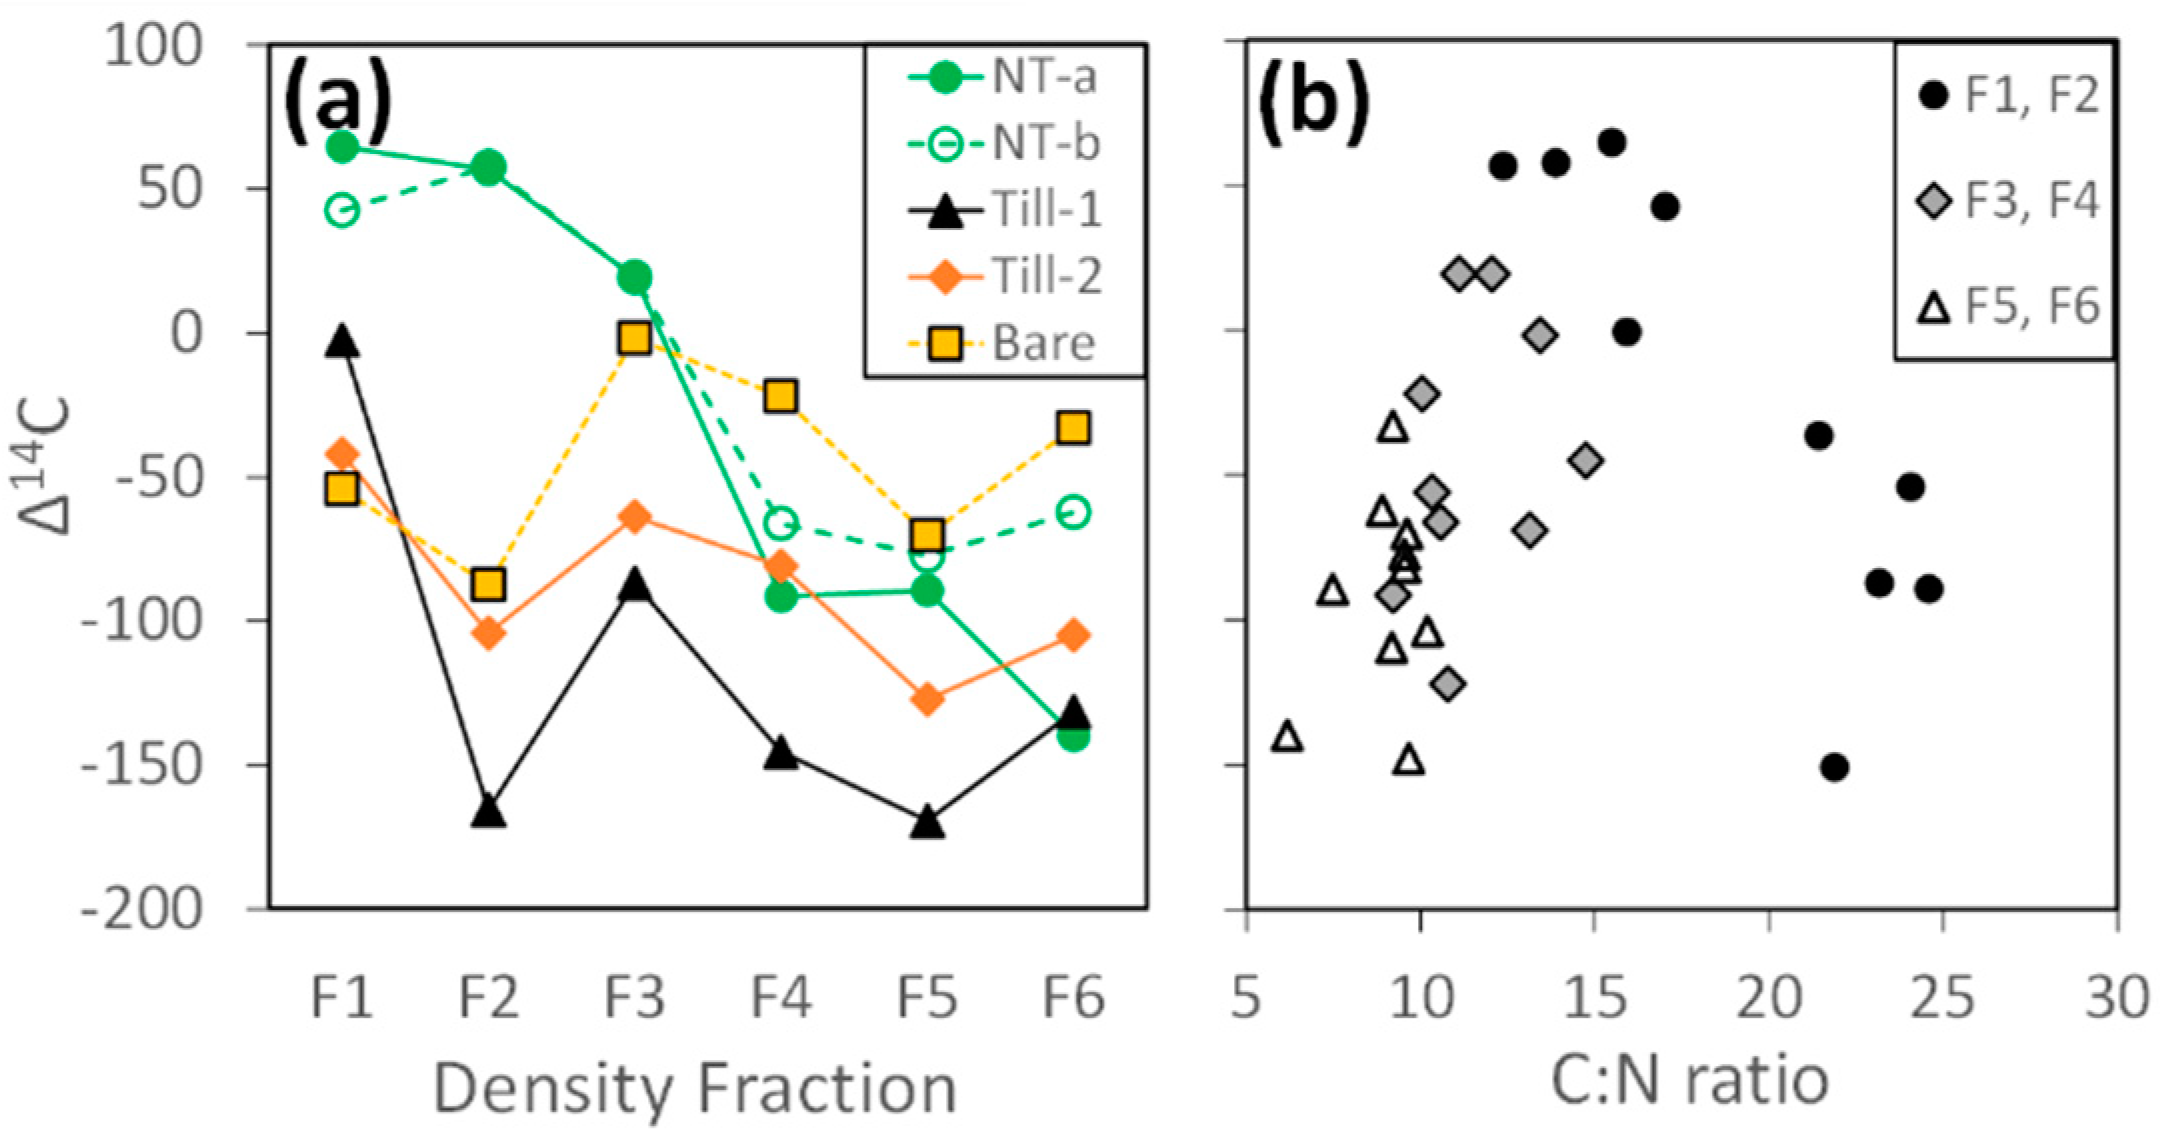
TC concentration ranged from 37 to 149 mg g−1, reflecting the difference in the decadal management (Table 1). Total N also showed progressive decline along the TC gradient while soil pH showed no trend but remained slightly acidic to neutral. The recovery of mass, C and N after the density fractionation was 102.2 ± 2.2%, 93.1 ± 6.0%, and 99.4 ± 3.0% (mean ± SD), respectively, among the five soil samples (Figure 1a–c). The degree of C loss was similar or less than the previous studies that fractionated Andisols by SPT solution [41,60]. The lower C recovery relative to N suggests preferential loss of C-rich compounds especially from high TC samples possibly as non-centrifugeable colloids or SPT-induced C dissolution (NT-a, b).
The concentration of C progressively declined with increasing particle density from F1 (261–339 mg g−1) to F6 (5.7–7.1 mg g−1) in all five samples (Table 2, Figure S2). Nitrogen followed the same pattern. Reflecting the variation in the decadal OM management, C and N concentrations in F1 decreased along the TC concentration gradient from NT-a sample towards Bare sample. This trend was extended to F23 for N. The management-induced differences shown in lower-density fractions diminished towards higher-density fractions. In general, C:N ratio showed progressive decline with increasing particle density except that F2 showed 2–5 unit higher ratios than F1 in all soils except for NT-a, b samples (Table 2 and Figure S2). Across all the fractions down to F6, C:N ratio was consistently lower in NT-a, the sample receiving the largest amounts of litter compost (Figure S2). The lowest two density fractions (F1–F2) were clearly more dominated by plant-derived, large organic particles compared to the higher-density fractions (F3–F6) based on higher C concentration (>150 mg g−1) and higher C:N ratio (>12.4) as well as visual observation.
The distribution of total C and N among the density fractions (Figure 1b,c) was calculated based on the mass recovery and the concentration of C and N. Along the TC gradient from NT-a towards Bare sample, the proportion of TC in F1 and F2 fractions progressively declined from 84–87% to ca. 10%, whereas those in the higher-density fractions (especially F4–F5) increased. The distribution pattern for N was comparable to C (data not shown).

3.1.2. Radiocarbon

Radiocarbon content (Δ14C) showed a decreasing trend with increasing particle density for NT-a, b samples (Figure 2a and Table 2). The Δ14C in F1 declined from NT-a to Bare sample following the TC concentration gradient. The patterns of Δ14C in F2–F6 did not follow the TC gradient presumably due to small differences in the land history between NT/Till-1 and Till-2/Bare zones of the experimental field (see Appendix B). In F2, NT-a and NT-b showed modern values, whereas the other samples having less OM input had highly negative Δ14C values. The Δ14C in higher-density fractions (F3–F6) was around zero to negative values with consistent decreasing trends from F3 to F5 for all five samples.
The relationship of Δ14C against C:N ratio showed some clustering patterns (Figure 2b). The two highest-density fractions (F5–F6) were characterized by low C:N and strongly negative Δ14C while mid-density fractions (F3–F4) tended to have slightly higher C:N ratio and less negative Δ14C. The two lowest-density fractions (F1–F2) showed much wider variation in both axes with an apparent negative linear correlation (r2 = 0.74, p < 0.001). Samples with lower C:N with positive Δ14C values corresponded to the F1 and F2 from the soil under the highest OM input as compost (NT-a and NT-b), whereas those from lower OM input soils (Till-1, Till-2, and Bare) showed higher C:N and much more depletion in Δ14C.

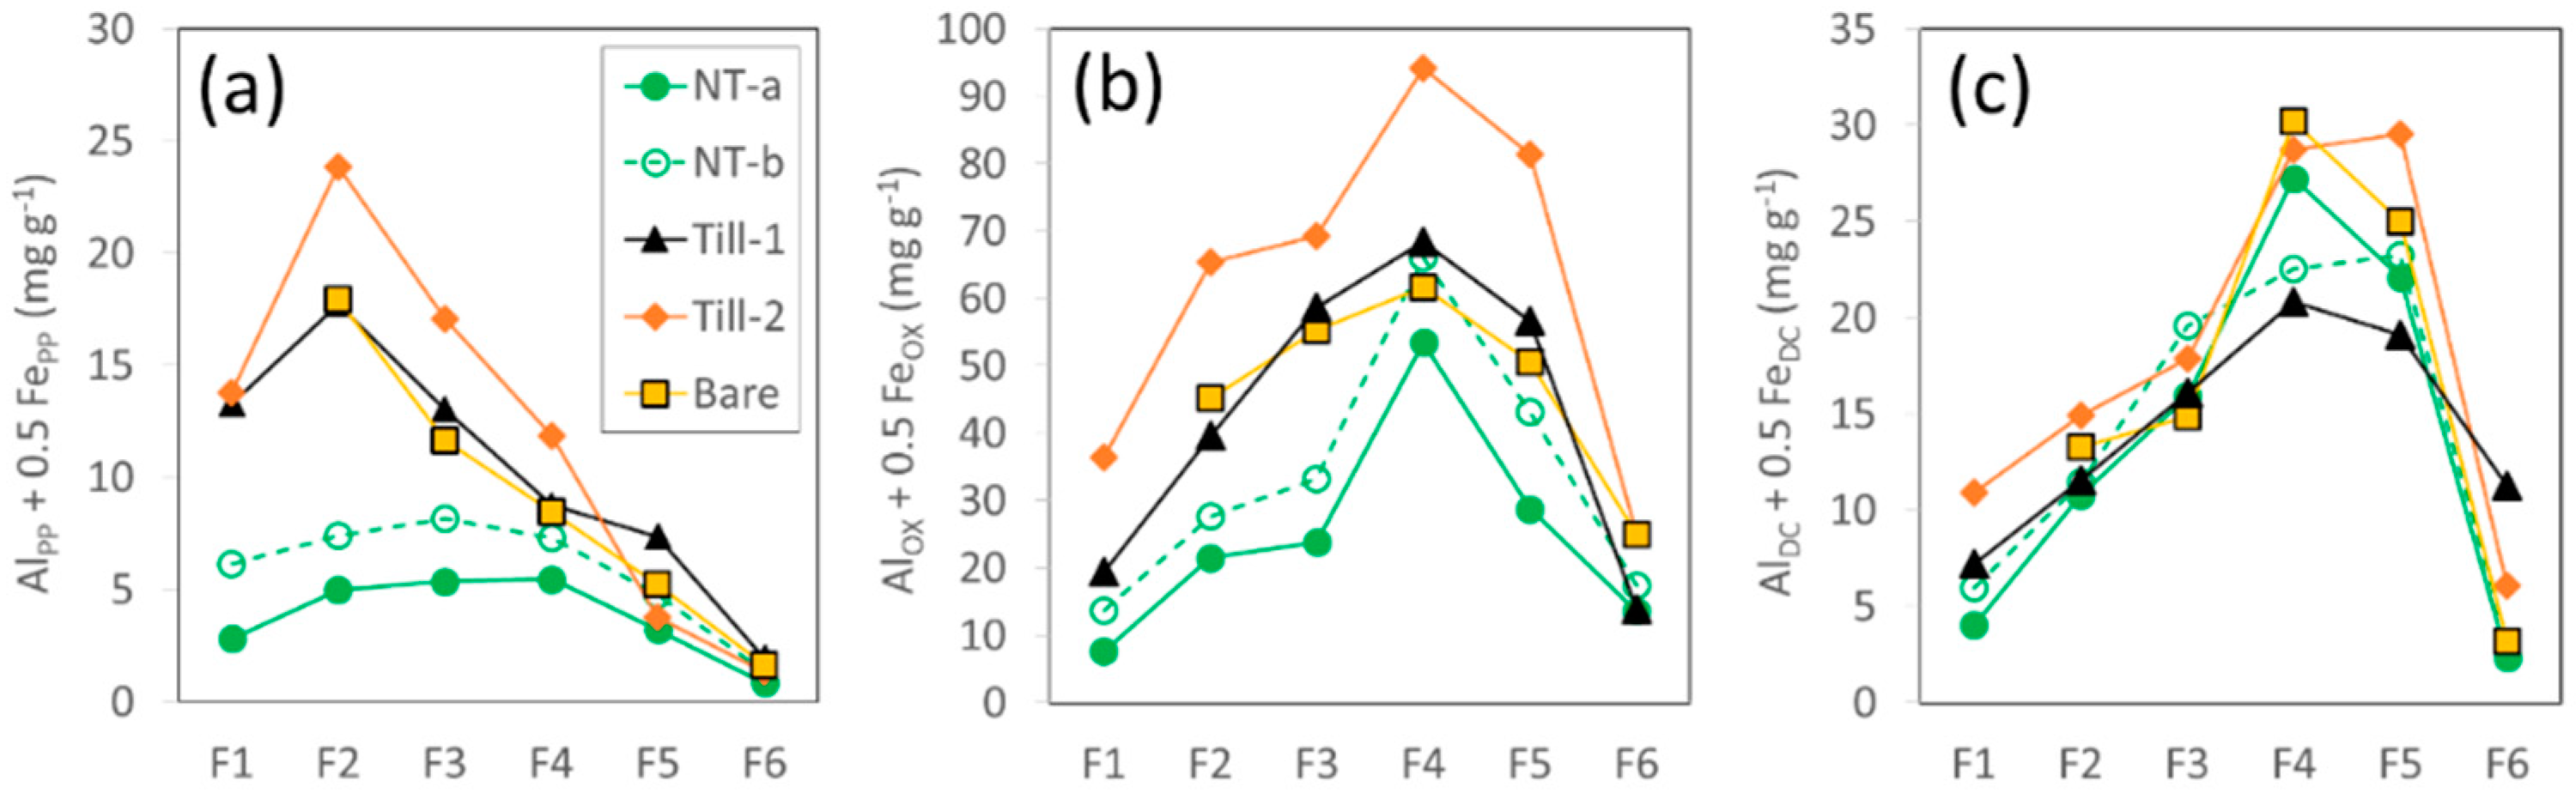
3.2. Extractable Iron, Aluminum, Silica, and Manganese

3.2.1. Mineral Composition and Metal Concentration

Short-range-order mineral phases accounted for 16% (9–22%) of bulk soil mass (Table 3). When assessing each density fraction, these phases accounted for as low as 6–7% in F1 and F6, and as high as 25% (22–29%) in F4. Among SRO mineral phases, allophane- and imogolite-type minerals were dominant: their content was 3.3–5.7 folds and 3.3–7.7 folds greater than ferrihydrite content in bulk and in the density fractions (except for F6), respectively (Table 3), as typically found in allophanic Andisols [56].
The extractable metal concentrations were generally higher in mid-density range with some variations among the three extractants and thus the crystallinity of the reactive metal phases. The density fractions having the highest concentration of the reactive metals (Al + 0.5Fe) were F2–F3 for the initial PP extraction, F4 for the subsequent OX extraction, and F4–F5 for the final DC extraction (Figure 3a–c). Similar patterns were shown for extractable Si and Mn as well (Table S2).
Pyrophosphate-extractable metals (AlPP + 0.5FePP) showed a sharp maximum in F2 for Till-1, Till-2 and Bare samples while less clear maxima in F3–F4 were shown for NT-a and NT-b (Figure 3a). This pattern was mainly controlled by AlPP which was on average 9.2-fold higher (range: 1.7–24.3 on molar basis) than FePP. In fact, FePP alone showed its concentration maxima in F1–F3 depending on soil samples (Table S2). On the other hand, SiPP and MnPP concentrations generally showed decline with increasing particle density (Table S2).
The subsequent oxalate extraction released more metals than the initial PP extraction did in all fractions by up to nine folds for Al, 86 folds for Fe, 45 folds for Si, and 18 folds for Mn (Table S2). The OX-extractable metals were more concentrated in higher density range compared to PP-extractable metals (Figure 3b). The atomic ratio, AlOX:SiOX, in bulk soils ranged between 1.8 and 2.4, indicating the dominance of Al-rich or proto-imogolite allophane [54]. The ratio was also relatively constant across all fractions (range: 1.7–2.2) except that F6 from NT-a and NT-b had lower ratio (1.3–1.6) and that the fraction from Till-2 had slightly higher ratios (2.1–2.6). AlOX and SiOX showed their sharp maxima in F4, whereas FeOX and MnOX had their maxima in F4–F5 (Table S2). The high FeOX in F6 is attributable to the dissolution of magnetite, a common primary mineral in volcanic tephra in accord with previous study [36]. The atomic ratio of AlOX:FeOX was 4.8 (range: 3.1–6.4) for F15 and 1.0 (0.4–2.3) for F6.
In both PP and OX extractions, the metal concentrations tended to be lower in the soils having higher OM input (Figure 3a,b). Dilution by OM would lower the metal concentrations only up to 10% and thus cannot fully account for this pattern. Similar to OX, dithionite-citrate extractable metals showed the highest concentrations in F4–F5 (Figure 3c) with the atomic Al:Fe ratio of 0.5 (range: 0.2–0.7).

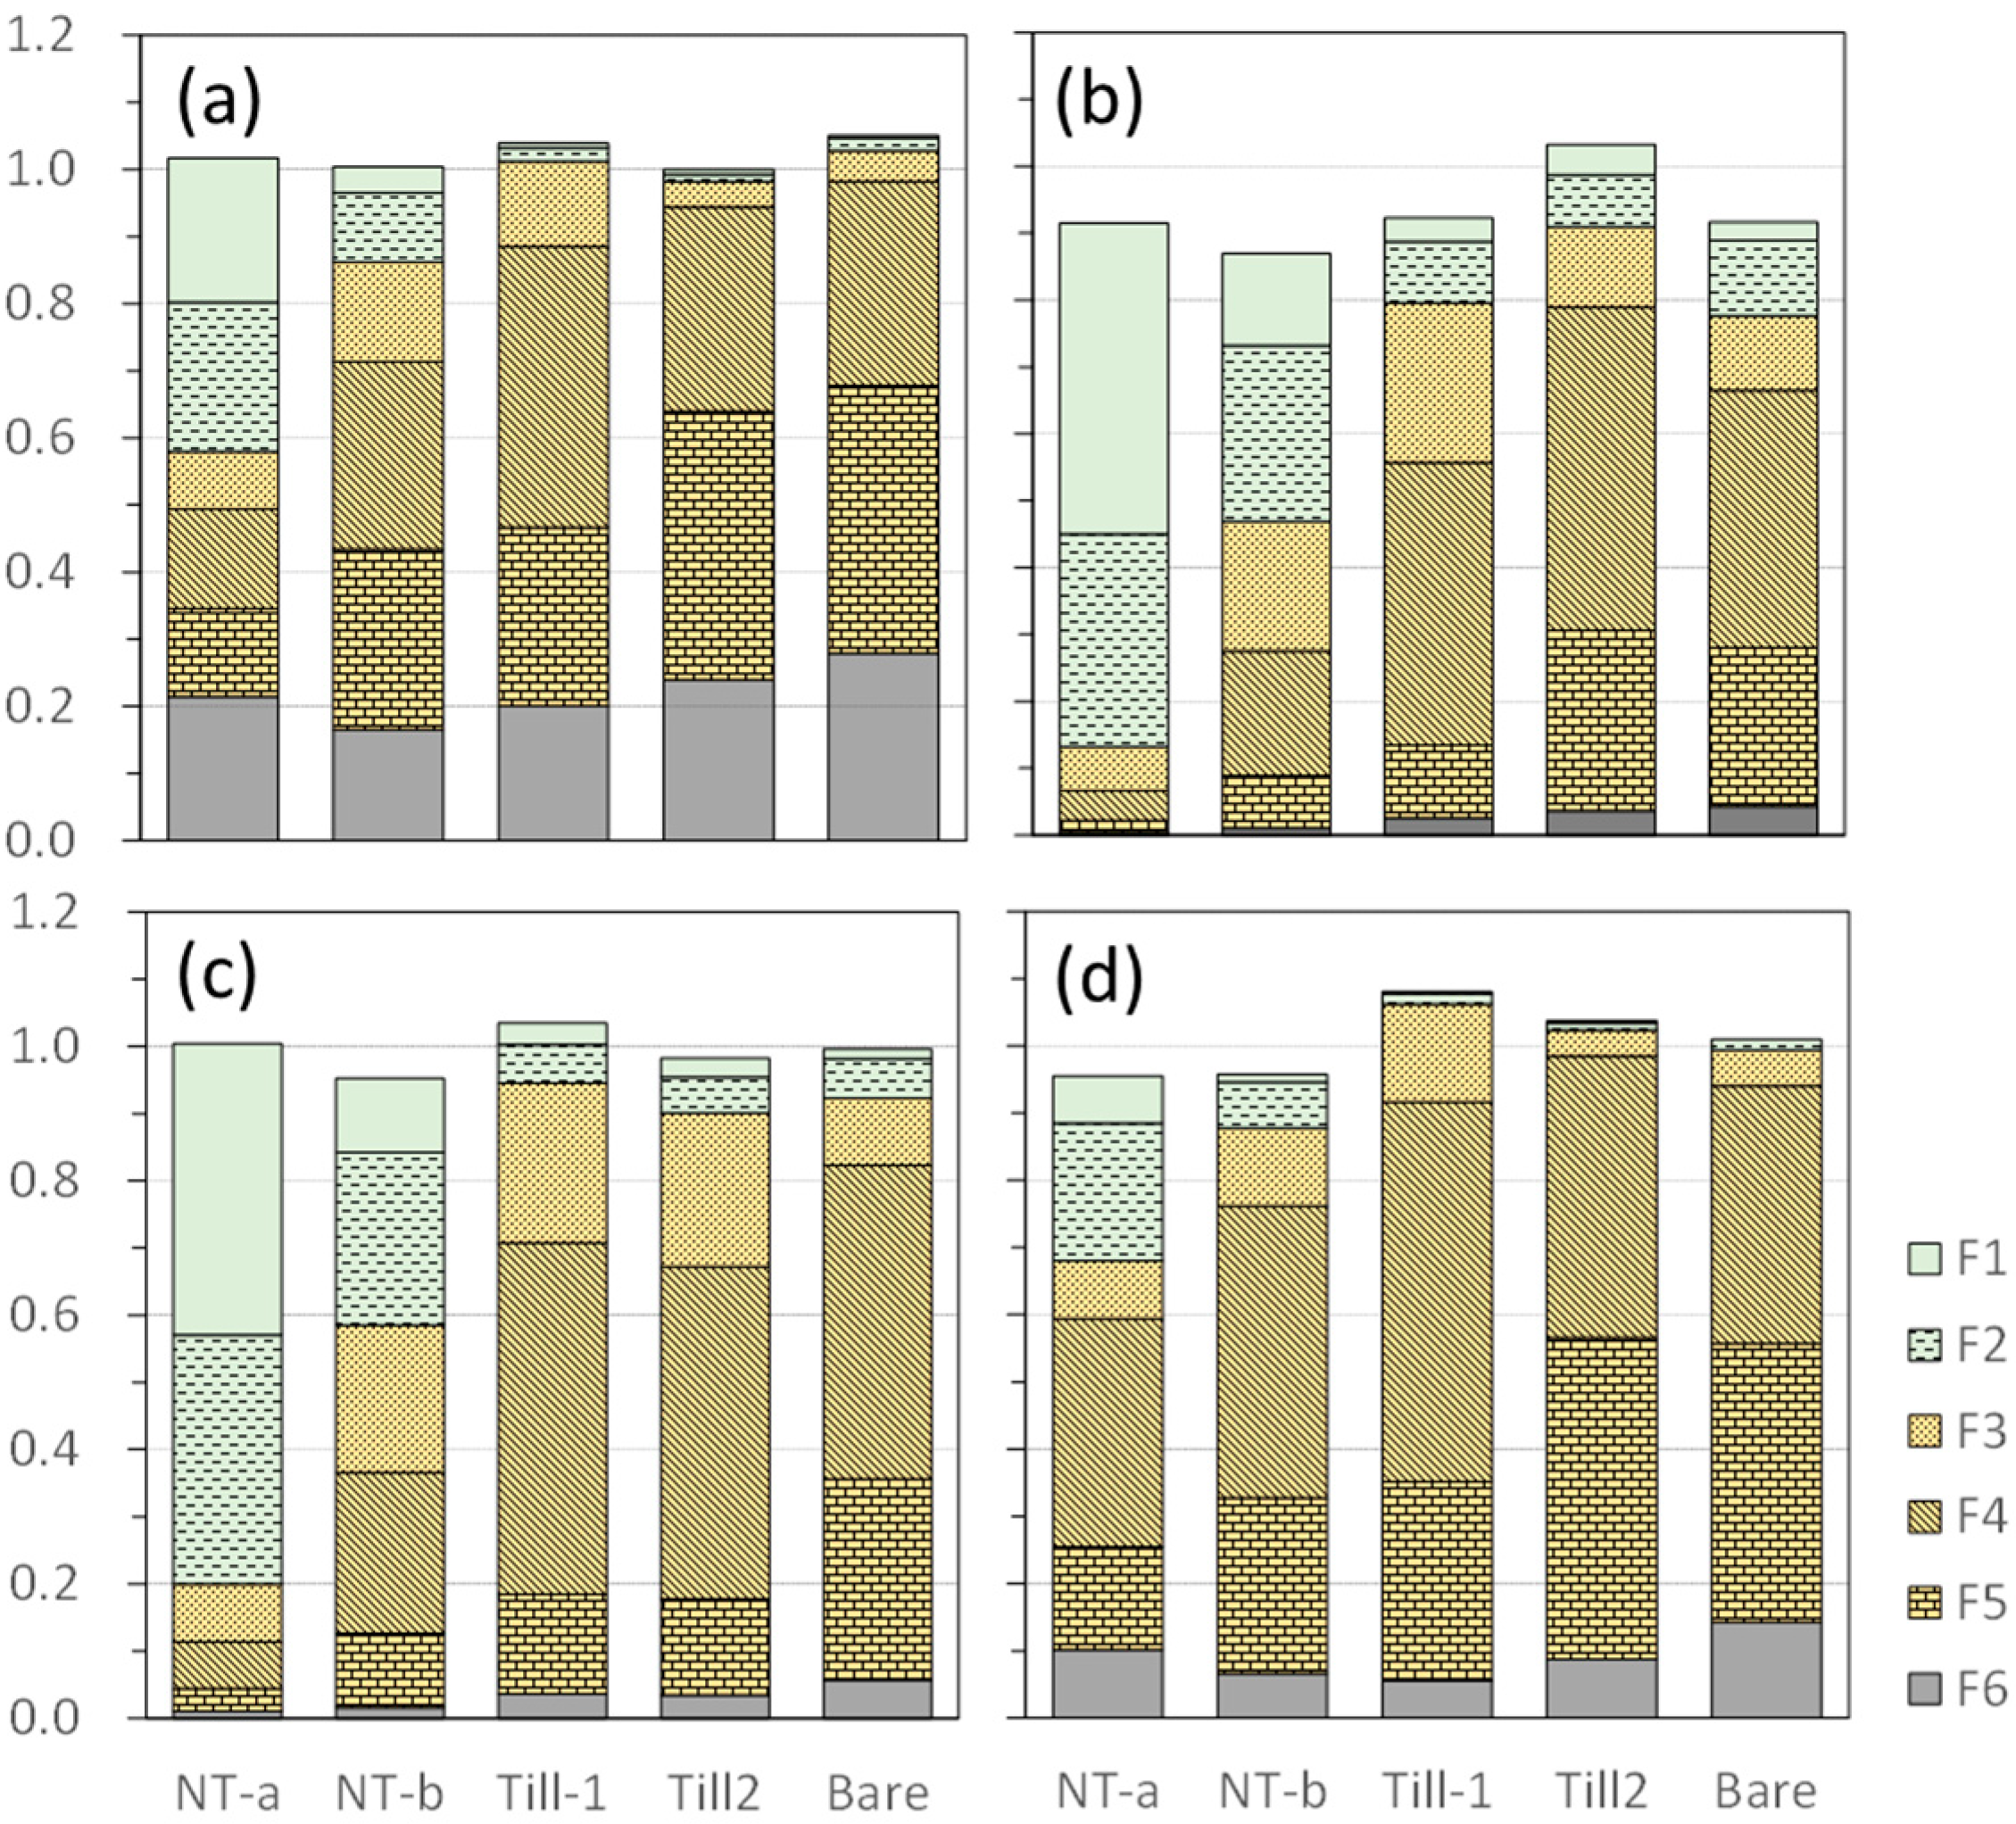
3.2.2. Recovery and Distribution

The metal distribution across the fractions generally showed similar patterns to that of C and N (Figure 1d and Figure S3). While the results from the initial PP extraction suffered from apparent colloid inclusion in extracts, the subsequent OX- and DC-extractions showed reasonable recoveries (Figure 1d and Figure S2). In addition, the pool sizes of PP-extractable metals were much smaller than those of subsequent OX- metals (by 9–86 folds). We thus considered it reasonable to assess the distribution of the extractable metals with the assumption that no systematic errors occurred in the metal quantification across the fractions (see Appendix A). The distribution patterns of individual elements analyzed in all three extractions (PP, OX, and DC) were similar and changed among the soils along the TC concentration gradient. The metal distributions in F1 + F2 decreased and those in F5+F6 increased from NT-a towards Bare sample as shown for OX-extractable metals (Figure 1d). The two low-density fractions (F1 + F2) accounted for 25–46% of the total extractable metals in NT-a sample, 8–10% in NT-b, and 1–2% in Till-1 and Bare sample.

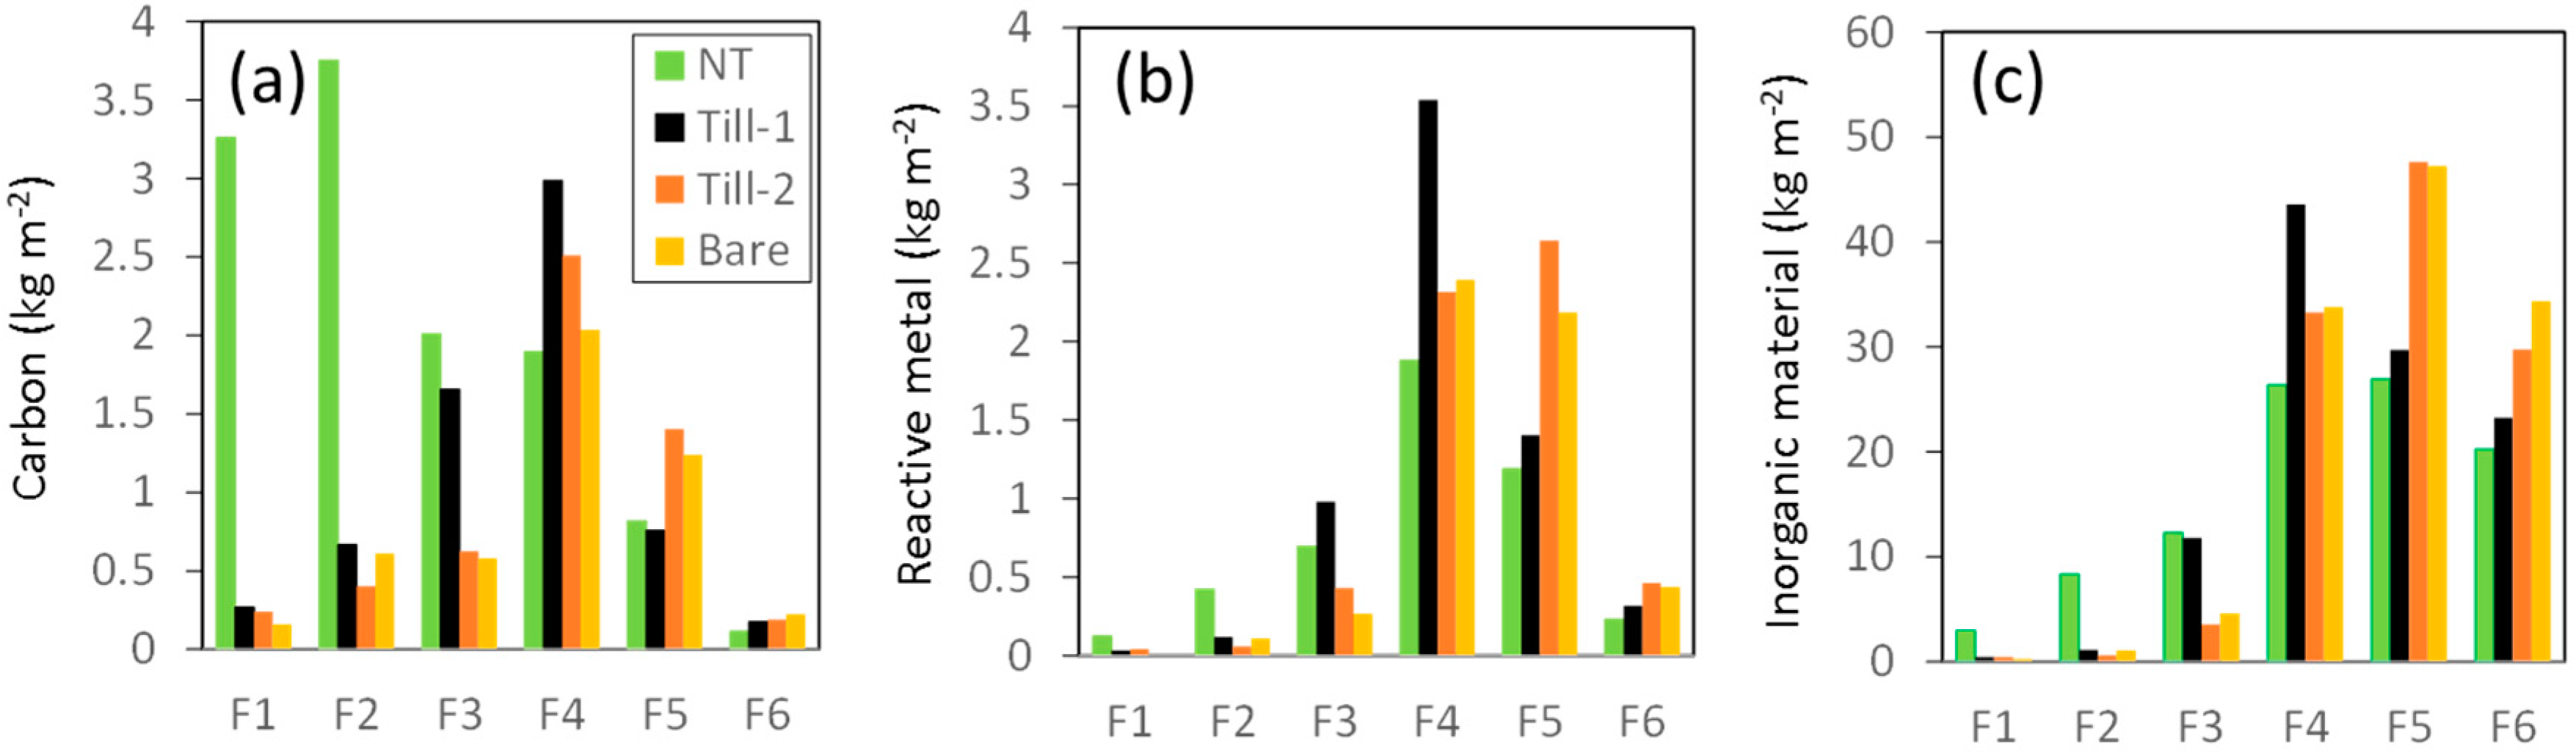
3.3. Standing Stocks of Organic Matter and Reactive Metal Phases

The distribution of OM and the reactive metals across the density fractions was further assessed by comparing the organic and inorganic materials present in the top 20 cm on a ground area basis after mass-equivalent normalization. The two density fractions accounting for the largest proportions of total C standing stock were F1–F2 for NT, F3–F4 for Till-1, and F4–F5 for Till-2 and Bare sample (Figure 4a), reflecting the difference in decadal OM input regime. Nitrogen standing stocks essentially showed the same pattern (data not shown). The standing stock of OX-extractable metal phases was mainly distributed in F4–F5 in all four soil samples. However, NT sample showed greater metal stocks in F1–F2 than the others with lower TC contents, whereas Bare sample showed greater metal stocks in F5–F6 than the others with higher TC contents (Figure 4b). In fact, the sum of the metal standing stocks in F1–F3 followed the TC concentration gradient as follows: NT > Till-1 > Till-2 > Bare. The same patterns are found for PP-extractable metal phases when assuming the normal recovery from each density fraction. Similarly, the total inorganic material showed similar distribution pattern to the OX-extractable metals (Figure 4c).

4. Discussion

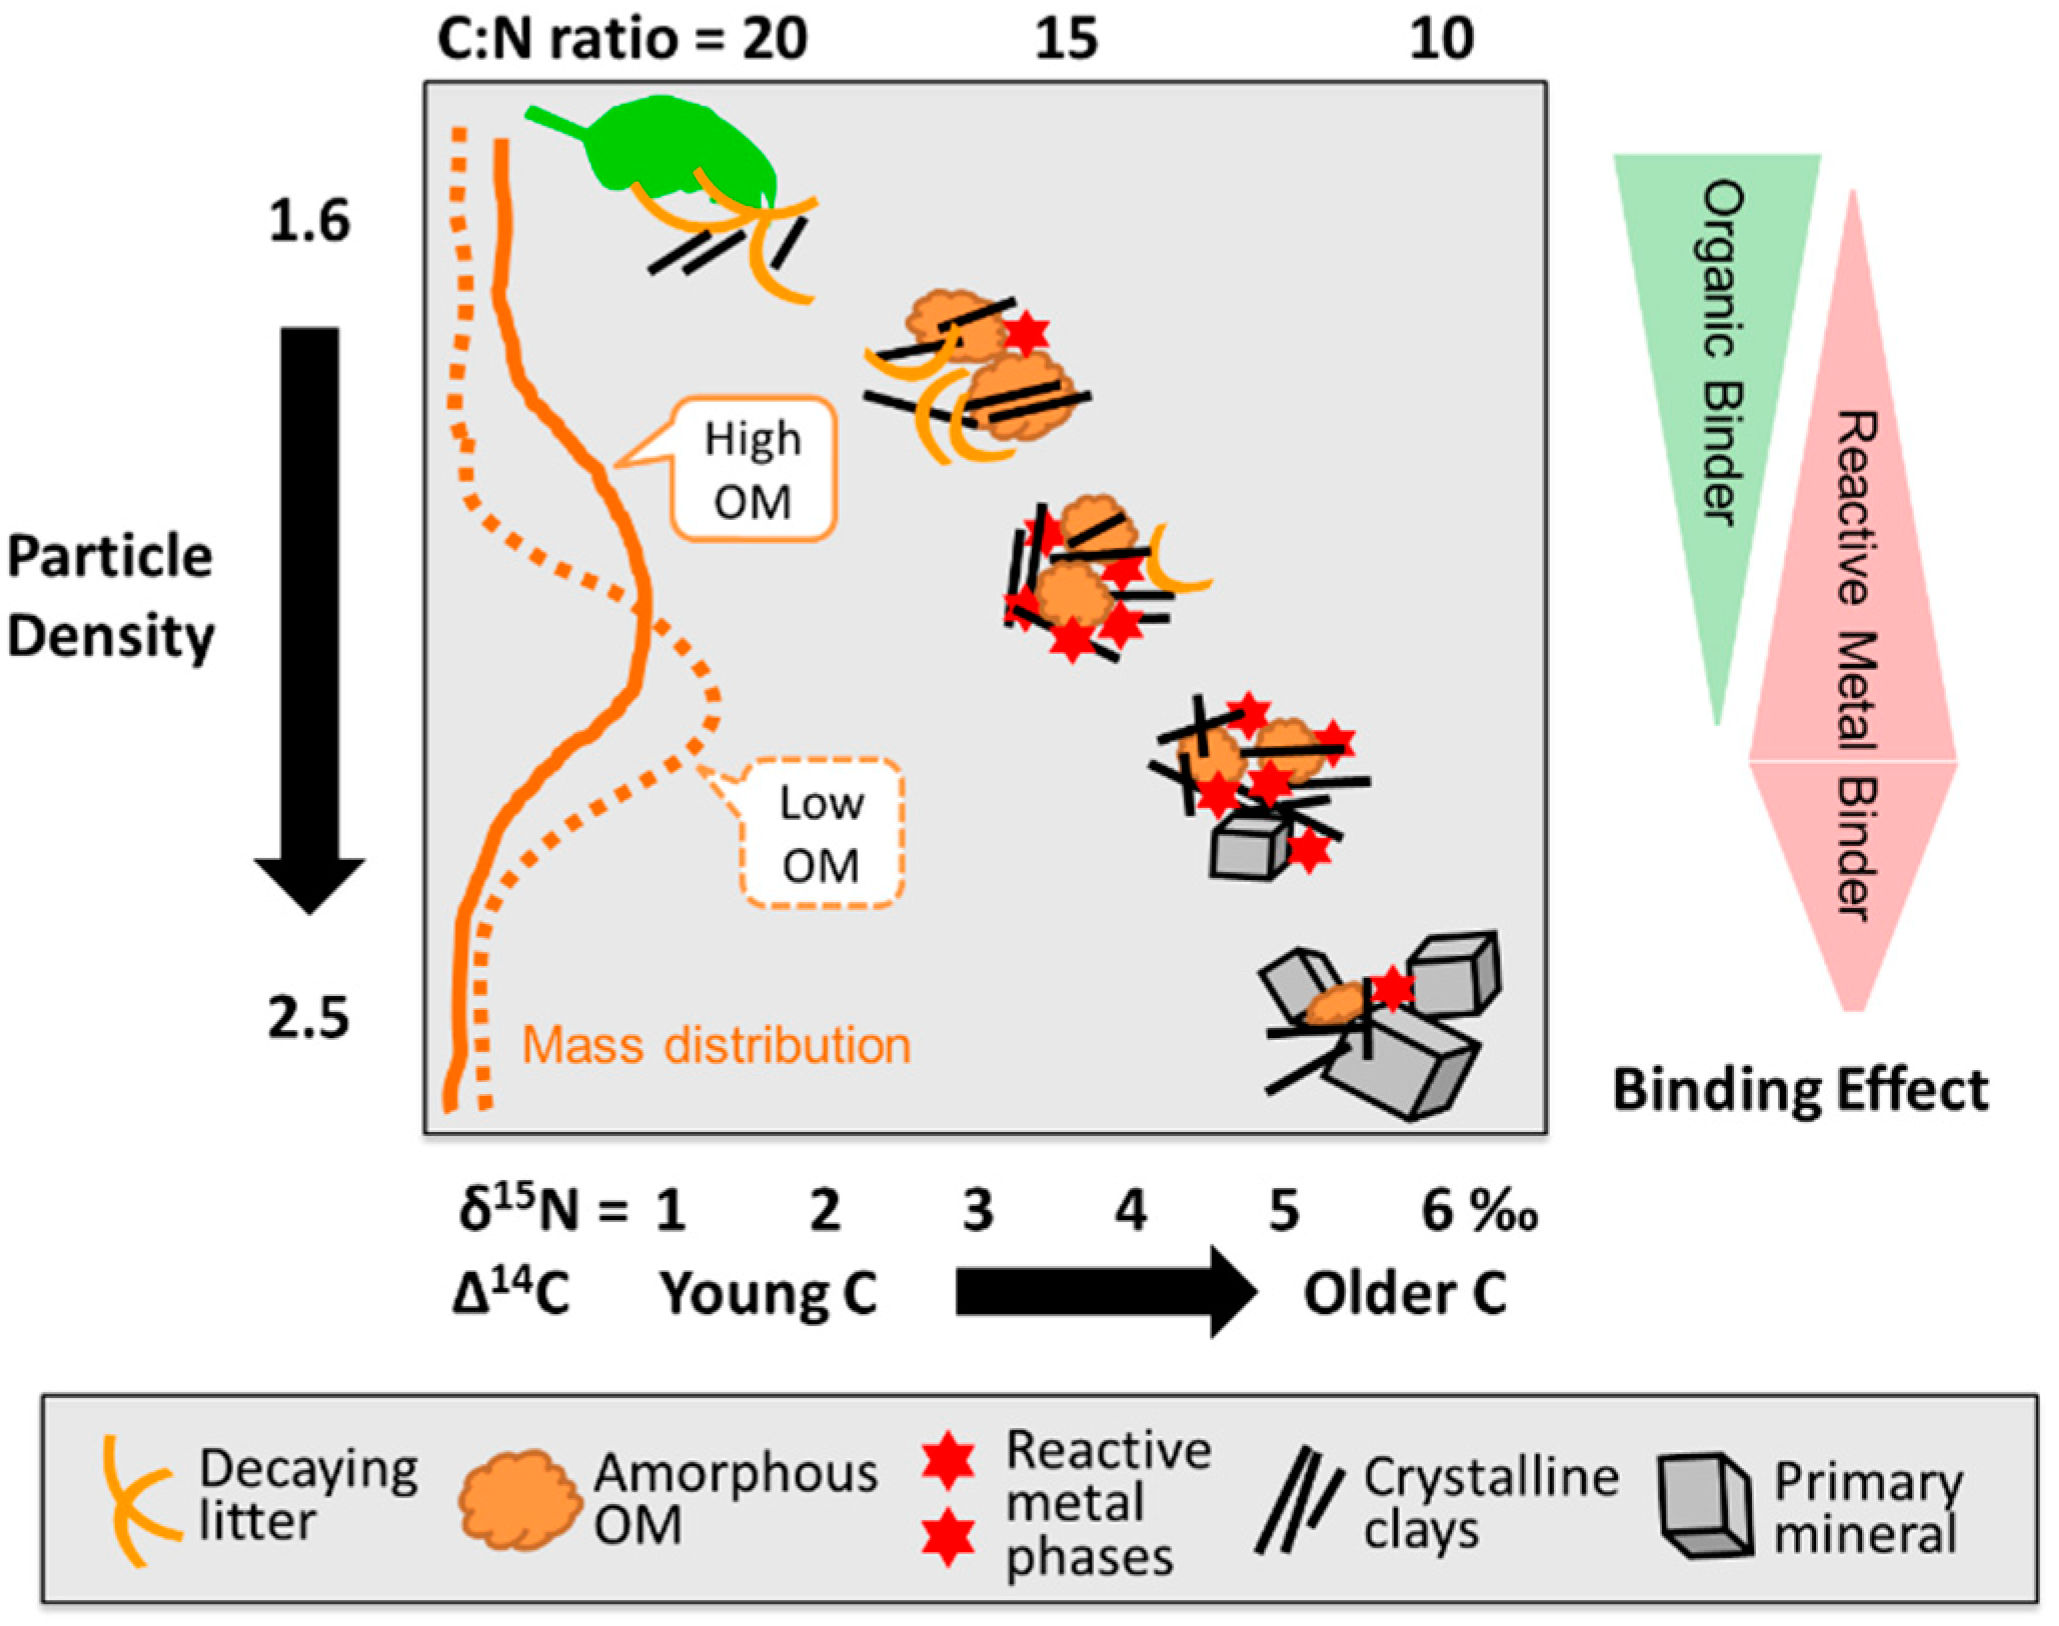
4.1. Different Roles of Organic Matter and Reactive Metal Phases as Binding Agents

We first tested the applicability of basic principle behind density fractionation—the mixing of newly-added OM with soil particles leads to a shift in particle density distribution towards lower density due to organic binding effect. Upon the increase in OM input from the bare fallow to the no-tillage with compost treatment, we found a clear increase in the standing stocks of OM and the inorganic phases in lower-density fractions (especially F1–F2) and corresponding declines in higher-density fractions (F5–F6, Figure 4a–c). Our results thus give a strong support for the basic principle which has not been tested at finer density intervals under field condition before. The observed shift in the particle density distribution by the OM management must result from the changes in the mass or concentration of OM and metals among the density fractions. The results suggest that the shift was largely caused by the change in mass, in other words, by the physical transfer of soil particles from high to lower density fractions, because the changes in elemental concentrations within each density fraction do not account for the shift. For organic component, the changes in C and N concentrations in each fraction were little from Bare to NT sample (Table 2) while the mass distribution clearly showed the increase in F1–F2 (Figure 1a) which accounts for the distribution shifts in C and N (Figure 1b,c). Similarly, for the reactive metal phases, the distribution of OX- and DC-extractable Al, Si, and Fe in F1–F2 increased by 8–11 folds (OX) and 4–12 folds (DC) from Bare to NT-a samples along the TC gradient on a concentration basis (Figure 1d and Figure S2) while their concentrations per fraction remained or decreased by up to two folds (Figure 3b,c).
The physical transfer of soil particles and concurrent (dis)aggregation may be explained with a simple schematic flow (Figure 5). The microbes decomposing the newly-added OM produce metabolites (glue). Such organic glues would adhere to mid-density aggregates, the most abundant type of aggregates (Figure 5a,b). When the adhesion is strong, new shaking-resistant aggregates of lower density would form as the OM-bound subunits are physically pulled off (Figure 5c). The OM-induced formation of low-density aggregates suggested here is generally consistent with the conceptual model [39] which describes an initial aggregation process with decaying plant litter serving as a core to form occluded low-density fraction (o-LF), and also related to the macroaggregate formation upon OM input found in many soils [4,7,8].
Second, we assessed the contribution of the reactive metal phases on aggregation. We did not find any indication of preferential metal binding with the newly-added OM at the intermediate hierarchy level (shaking-resistant aggregate) because the increase in lower-density fractions from Bare to NT soil sample was essentially the same between the reactive metal phase and whole inorganic materials (Figure 4b vs. Figure 4c). Instead, the reactive metals appeared to contribute to the formation of mid-density aggregates (2.0–2.5 g cm−3) together with OM at a lower hierarchy level. Three lines of evidence support this view. (i) SRO minerals, approximated by OX-extractable metals, were most concentrated in F4 (Figure 3b) and mainly distributed in F45 across the density fractions (Figure 4b) even in NT soil which had much higher OM input. DC-extractable metals showed similar patterns (Table S2). These results suggest that these metal phases contributed to the binding of shaking-resistant aggregates of 2.0–2.5 g cm−3 density range. (ii) Overall, 65–74% of the total Al and Fe extracted by PP and OX and 64–70% of total C and N were located in F4 (2.0–2.25 g cm−3) as the aggregates resistant to a moderate level of sonication (at 270 J mL−1) for Till-1 soil [42]. In other words, these organo-metal associations acted as more “persistent” binding agents than organic binders and thus presumed to work at a lower hierarchy level. (iii) Theoretical density calculation suggests that the sorptive capacity of SRO minerals in F4 might have been saturated. Given the absolute density of allophane and imogolite (2.6–2.7 g cm−3) and ferrihydrite (3.8–4.0 g cm−3), large amounts of OM adhesion to the SRO minerals are necessary to achieve the net density of 2.0–2.5 g cm−3. Maximal sorption of dissolved OM onto the SRO minerals (i.e., saturation of sorption sites) under laboratory condition leads to the net density of 2.2–2.4 g cm−3 for organo-allophane and organo-imogolite adsorptive associations and that of 3.0–3.1 g cm−3 for organo-ferrihydrite association (see Appendix 1 in [42] for more detail). These values also agree with the measurement from sorption experiments [43]. Thus, the SRO minerals need to be bound with pre-existing OM at nearly maximum sorption level to account for the major presence of the reactive metals in F45 (2.0–2.5 g cm−3). Predominance of other (crystalline) minerals in F4–F5 (58–84% of mass, Table 3) will not change the density argument because those minerals have much lower sorptive capacity compared to the SRO mineral phases [61] while having similar particle density. Therefore, we speculate that the reactive metal phases in the mid-density fraction were likely to be in strong association with roughly maximum levels of OM in the soil well before the start of no-tillage with compost addition management.

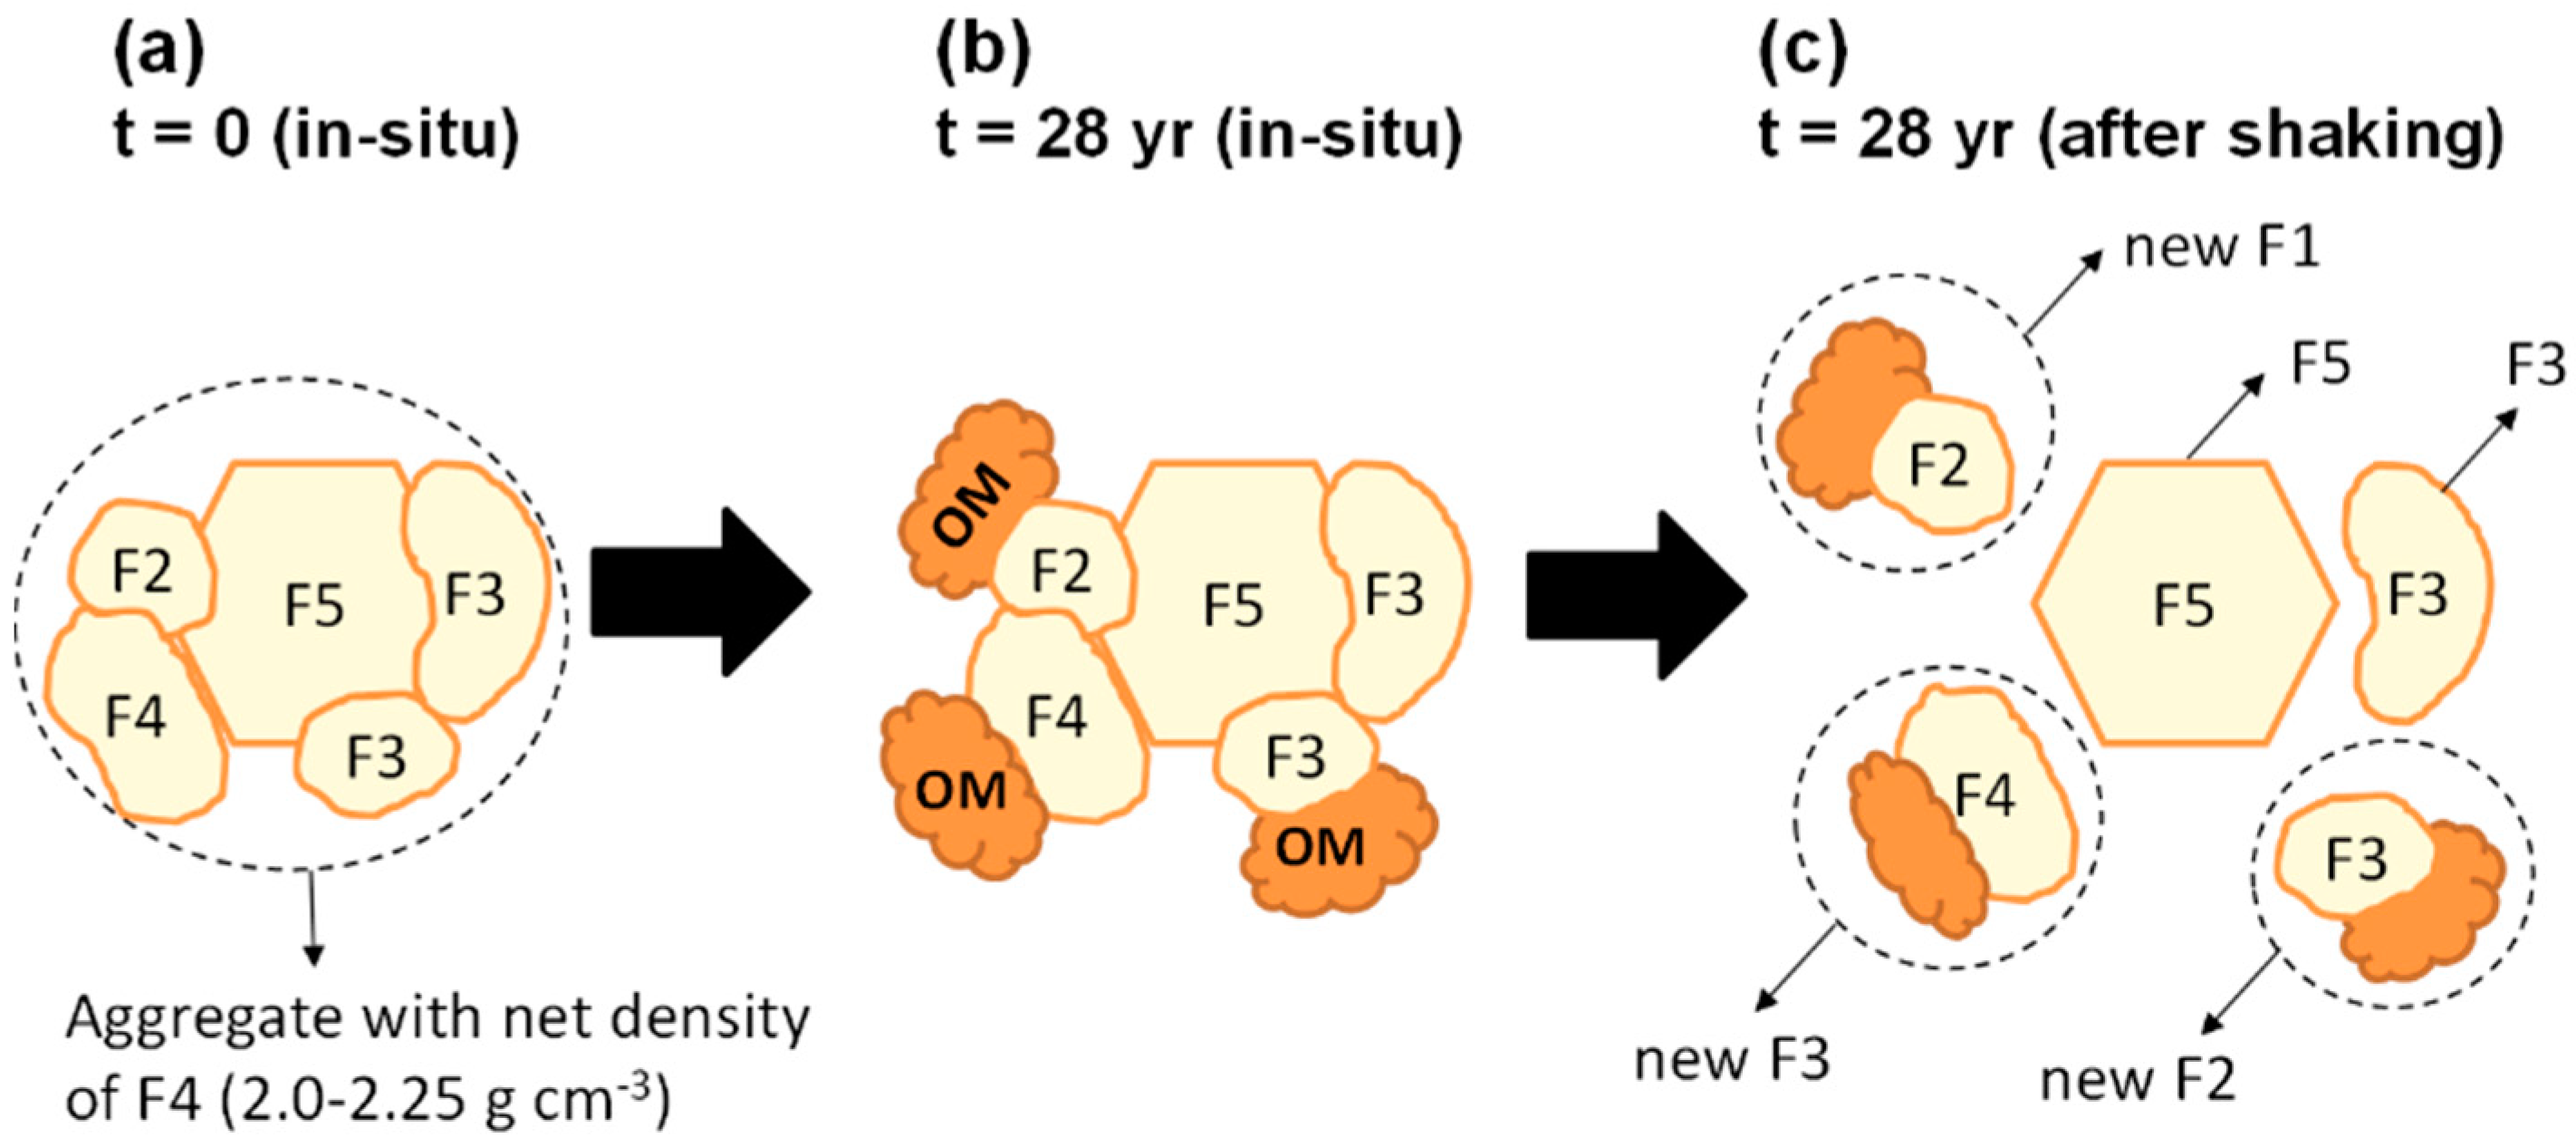
4.2. Dynamic Changes in Organo-Mineral Aggregation Controlled by OM Input

The formation of OM-rich, lower-density aggregates upon the decadal OM addition must be balanced by the loss of higher-density aggregates. We observed decreasing trends in both organic and inorganic components in higher-density fractions (F5–F6) along the TC gradient from Bare towards NT sample (Figure 4a–c), implying that reduced OM input (and thus OM depletion) might have promoted the disruption of less-stable, organically-glued aggregates. Then, the released subunits would fall into higher-density fractions due to the loss of low-density OM (e.g., a reverse of Figure 5).
The concurrent processes of aggregation in the lower density range and disaggregation in the higher density fractions upon enhanced OM input are strongly supported by previous studies that used sequential density fractionation approach. Forest ecosystems in Wisconsin (Mollisols) under long-term field manipulation (50 years) showed similar shifts in the mass distribution upon doubling of litter input rate: an increase in the lowest three density fractions (<2.0 g cm−3) and concurrent decline mainly in 2.4–2.65 g cm−3 fraction in both prairie and forest systems [34]. Furthermore, litter removal treatment showed a reversed distribution pattern [34]. By applying the sequential density fractionation after removal of F1 and o-LF (<1.8 g cm−3) with 100 J mL−1 sonication, Crow et al. (2014) [41] compared Hawaiian Andisols under native forest and the pasture system having higher OM input. From the forest to the pasture, main increase in OM and SRO mineral occurred in 1.8–2.0 g cm−3 fraction, whereas a main decrease in these phases largely occurred in >2.4 g cm−3 fraction. Furthermore, the decline in soil TC from the pasture to Eucalyptus plantation reversed the distribution pattern of both OM and SRO mineral [41].
These results provide strong evidence that the OM-controlled (dis)aggregation processes are reversible at the intermediate hierarchy level. It may thus be possible to view that the shaking-resistant aggregates are present under a dynamic equilibrium state. The changes in OM input balance regulate the equilibrium by changing the amounts, location and activity of organic binding agents thereby causing some re-assembly (aggregation and disaggregation) and directional shifts in particle density distribution.

4.3. Insights from Radiocarbon Analysis: Two Pools of Stable C

Two clear patterns emerged from the radiocarbon analysis were highly negative Δ14C of F12 except for NT-a, b samples and the progressive decline in Δ14C from F3 towards F5 for all five samples (Table 2 and Figure 2a), which implies the presence of two C pools stabilized by contrasting mechanisms. Old pyrogenic C (Δ14C of <−100‰, Table 2) appears to explain the first stable C pool. Among the low-density fractions (F1–F2), Δ14C was negatively correlated with the aromaticity index based on solid-state 13C NMR spectroscopy (ratio of aromatic-C to O-alkyl-C, r2 = 0.79, p < 0.001, using data from [53]) as well as with C:N ratio (Figure 2b). Burning and charring of plant residues increase their aromaticity, and remaining materials have higher stability against microbial degradation [62,63,64]. Thus, these negative correlations in F1–F2 suggest the presence of old pyrogenic, thus recalcitrant C. This interpretation is further supported by the high abundance of shiny dark-colored fragments in mixture with decaying plant litter based on light microscopic observation in F2 of Till-1 soil [42]. Strong influence of pyrogenic C on the dark-color and old radiocarbon age of surface and subsurface Andisols in Japan has been reported [63,64,65,66]. However, its location in soil matrix, isolation method, and molecular structure are not fully understood. Old pyrogenic C is often occluded in aggregates and can be isolated as occluded low-density fraction (o-LF) from a range of soils (e.g., [66,67,68,69,70]) including our soil [42]. In our soils, however, the old pyrogenic C pool would account for no more than 5% of TC in Till-1, Till-2, and Bare samples based on the limited C distribution in F2 (Table 2 and Figure 1b) and its aromatic-C proportion (23–36% of C [53]).
The second stable C pool, indicated by the progressive Δ14C decline from F3 to F5 by 70–100‰ shown for all five samples (Table 2, Figure 2a), appears to be dominated by N-rich compounds bound to minerals, particularly to SRO minerals as speculated from the theoretical density of organo-mineral associations (see Section 4.1). Similar density-dependent Δ14C trends have been shown for Hawaiian Andisols [41] and for other soil types [33,35] using the same fractionation scheme. The mid-density fractions (F4–F5: 2.0–2.5 g cm−3) always had negative Δ14C even in NT-a and NT-b samples that have been receiving additional OM as litter compost, indicating the dominance of pre-modern C (old C). In addition, 58–81% of total C and N and 79–86% of the reactive metal phases were present in these fractions except for the OM in NT soil (Figure 1b,c and Figure 4a). The mid-density fractions thus represent the main reservoirs of stable OM protected at least partly by the reactive metal phases (especially by SRO minerals) in our Andisols. SEM observation showed that these fractions were largely present as aggregates of 20–100 µm diameters (see Figure 5e,g in [42]). The formation of OM- and reactive metal-rich aggregates in the mid-density range appeared to be a general feature at least among Andisols. The main reservoir of OM and SRO minerals in the forest soil with andic property in Oregon, USA, was the shaking-resistant aggregates of 2.0–2.3 g cm−3 density [35] and those in a buried horizon of a volcanic soil in Reunion Island was the sonication-resistant aggregates of 2.1–2.3 g cm−3 density [22]. In Hawaiian Andisols under different land uses, OM was mainly present in 1.8–2.4 g cm−3 density fractions after a weak sonication (100 J mL−1), whereas SRO minerals were most concentrated in 2.0–2.4 and >2.4 g cm−3 fractions [41].
The progressive decline in both Δ14C and C:N ratio (Table 2) with increasing particle density, together with δ13C and δ15N enrichment towards higher density found for Till-1 [42], indicates greater contribution of microbially-reworked OM in the mineral-dominant fractions in accord with previous studies [32,35,37]. These results also suggest that microbial OM becomes a more dominant binding agent in higher-density fractions relative to plant-derived OM. Carbon or N stabilization mechanisms in Andisols are not fully understood, however. Strong evidence of sorptive stabilization of high C:N, aromatic compounds, as oppose to N-rich compounds, are shown in Hawaiian Andisols [28,71]. In addition, sorptive stabilization by SRO minerals may not be the single dominant mechanism in Andisols. Direct sorptive association with SRO minerals alone was not able to account for the amounts of OM present in the mid-density fractions in Till-1 [42]. The OM directly bound to the reactive metal phases accounted for rather minor proportions (15–55%) of bulk soil OM among six types of Andisols [55]. It may thus be important to consider additional mechanisms such as those controlling physical accessibility and diffusion constraints [72,73].
Radiocarbon results may provide further insights on how and where plant-derived young C incorporates into the shaking-resistant aggregates of varying densities. We focused on NT and Till-1 soils because these are a paired plot (adjacent with each other) whereas the other plots (Till-2 and Bare), located 500 m away, likely experienced slightly different land history (see Appendix B). Consistently more positive Δ14C in NT-a and NT-b relative to Till-1 sample across all density fractions by ca. 50–200‰ (except for F6 from NT-b, Figure 2a) indicates the incorporation of modern C (bomb C) into these fractions due to the newly-added OM input and the indirect effect of no tillage over the last 28 years. While coarse-sized primary mineral and the mineral particles become more dominant with increasing density towards F6, SEM confirmed the presence of organo-mineral aggregates in F5 [42]. Large bomb C influxes into F1–F2 is consistent with 5–10-fold increase in C standing stocks in NT relative to Till-1 (Figure 4a). A major net influx of bomb C into the mid-density fractions (F3–F5, especially F4) was indicated by 50–100‰ Δ14C enrichment in NT relative to Till-1 (Figure 2a) given that NT had similar or lower C stocks in these fractions relative to Till-1 (Figure 4a). These results suggest that the mid-density aggregates had at least a small capacity to bind new C derived from the compost addition. This is not necessarily contradictory to the saturation of the sorptive capacity inferred from the density constraints (see Section 4.1) due to the high sensitivity of radiocarbon tracer. While C and metal distributions were slightly different, Hawaiian Andisols also showed the transfer of modern C to the highest density fraction (>2.4 g cm−3) when soils underwent land-use change from forest to high C input pasture system [41]. These results are in line with previous studies where plant-derived C was incorporated into mineral-associated C pool such as high-density fraction and clay-sized aggregates in relatively short time period possibly via DOC sorption or adhesion of microbial metabolites to the surface of organo-mineral aggregates [74,75,76].

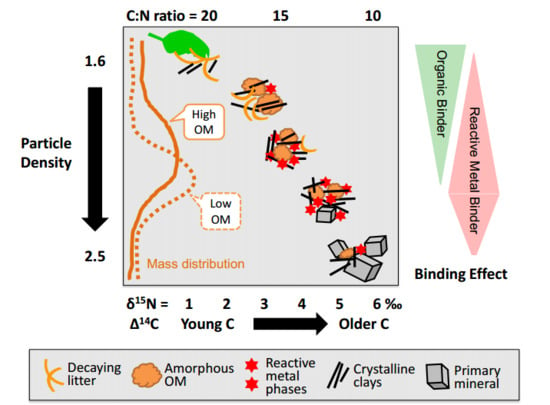
4.4. A Tentative Synthesis: Linking Aggregate Formation, Binding Agents, and OM Dynamics

We showed that OM-induced changes in organo-mineral (dis)aggregation as witnessed in the shift in particle density distribution (Section 4.1 and Section 4.2) and that the variation in C stability (Δ14C) was largely controlled by the association with reactive metal phases and, to a limited extent, by old pyrogenic C (Section 4.3). We attempted to summarize the linkage between the two in a schematic figure (Figure 6). Continuum of soil organic, mineral, and organo-mineral particles along a density gradient at the intermediate hierarchy level was represented by cartoon particles. Progressive changes in OM composition (lowering of C:N ratio and Δ14C as well as 15N enrichment) along x-axes occurred in conjunction with the increase in particle density in y-axis due initially to the binding of young, plant-derived OM (and the metabolites of the microbes degrading the OM) with pre-existing mineral and organo-mineral particles (from low to mid-density range). At a later stage, the dominance of OM-poor, mineral-rich particles (from intermediate- to high-density range) resulted from the depletion of the organic binder and increasing contribution of the reactive metals and older C bound to them. Additional OM input in NT soil led to enhanced organic gluing effect, resulting in a shift in the particle density distribution from the dominance of mid-density fractions (dotted brown line along left y-axis, Figure 6) towards lower density (solid brown line) as shown in Figure 4c. It is also important to recognize the (dis)aggregation co-occurred with dynamic C transfers. A portion of the modern C newly added in NT soil moved to higher-density fractions up to F5 (NT vs. Till-1, Figure 2a) at the same time as the formation of low-density aggregates that incorporated some of the mid- to high-density aggregates and their subunits (Figure 5a–c).
The interaction of OM with the reactive and other mineral phases occurring at lower hierarchy levels is beyond the scope of current study but critical better understand long-term OM stabilization. By a series of dispersion tests using Andisol surface horizons, we previously identified a maximum dispersion condition (sodium saturation followed by 5 kJ mL−1 sonication) which was regarded as the lowest hierarchy level operationally achievable [18]. The fundamental building blocks acting as highly persistent binding agents at this hierarchy level appeared to be nano-sized composites that are enriched in amorphous Al and Fe phases and potentially-labile OM (amide and carboxyl C) relatively depleted in radiocarbon content (Asano et al., submitted to current Special Issue in Soils). Such nanocomposites are likely to constitute the reactive metal binders depicted in Figure 6. Bridging the processes occurring at the intermediate and the lowest hierarchy level would be critical to explain the modern C flux into the mid-density, shaking resistant aggregates where the reactive metal phases appeared to be strongly bound to pre-existing OM.

4.5. Concluding Remarks with Some Implications

The relationship between soil structural change and OM dynamics is difficult to examine because these two processes influence with each other. Our working hypothesis was that the aggregate hierarchy concept (distinctive roles for different types of binding agents) helps to tease a part the complex relationship. Andisol was used because two potentially important binding agents, OM and the reactive metal phases (e.g., organo-metal complexes and short-range-order minerals) are characteristically high.
By comparing the particle density distribution of four surface horizons, each representing different OM input regime with no replication, we found that relatively young C with higher C:N ratios acted as a major binding agent to form shaking-resistant, low-density aggregates (<2.0 g cm−3) at a decadal time scale. We thus concluded that such organic binding agent operated at the intermediate hierarchy level. The reactive metal phases did not show clear contribution at this level. Instead, the metal phases appeared to work at a lower hierarchy level (i.e., sonication-resistant aggregate formation, also see Asano et al. under review in current Special Issue) by binding with the OM characterized by older C (Δ14C of −82 to −170‰, equivalent to radiocarbon age of 600 to 1400 years) and lower C:N ratios (7.5–10.8). These results highlight the distinctive roles of the two binding agents (Figure 6, right side): organic binder (relatively young C) and reactive metal binder associated with older C. The former is linked to short-term OM dynamics whereas the latter appears to control the dynamics of sonication-resistant aggregates at a longer time scale. Further study to fully test these ideas is essential because we focused on one soil type and the changes along a TC concentration gradient without replication of each TC level.
Is density fractionation more effective than aggregate- or particle-size fractionation? In general, density- and size-based approaches can be used to gain complementary information on the dynamics of aggregates and OM. However, our previous and current results suggest that the answer depends on soil type (the composition of binding agents) and the aggregate hierarchy level (the degree of aggregate disruption) we chose to study. For Andisols (and presumably for other soils rich in reactive metal binder), aggregate-size fractionation at a high hierarchy level (by wet sieving) failed to detect the effect of OM management (Table S1, also see Section 2.2) due to the abundance of both organic and reactive metal binders. Thus a commonly-used criteria of aggregate hierarchy used for soils of silicate clay mineralogy (i.e., higher C concentration and C:N ratio for larger-sized aggregates) was not applicable to Andisols [25,77,78].
At the intermediate hierarchy level, our current results were comparable to previous findings from other soil types using size-based fractionation. The formation of OM-rich, low-density aggregates found here is analogous to macroaggregate formation (i.e., >250 µm isolated by wet sieving) upon OM input [4,7,8]. The density fractionation approach was therefore more effective to detect the OM-induced aggregation for the studied Andisol compared to the aggregate-size fractionation. Furthermore, the sequential density fractionation was clearly more effective in isolating the C pools of contrasting Δ14C compared to aggregate-size fractionation for Hawaiian Andisols [41]. At lower or the lowest hierarchy level that can be reached by high sonication energy, the nature of strong organo-mineral associations was successfully studied by particle-size fractionation [18,79] and by sequential density fractionation for Andisols [22]. Thus, the physical fraction method should be chosen by paying close attention to the soil type, aggregate hierarchy level (the degree of aggregate disruption), and specific question or hypothesis.
When focusing on the intermediate level of hierarchy, our results and the literature showed that the OM-controlled (dis)aggregation processes are reversible in decadal time scale and further suggested that the shaking-resistant aggregates are present under a dynamic equilibrium state. The changes in OM input balance regulates the equilibrium state by changing the amounts, location and activity of organic binding agents thereby causing some re-assembly (aggregation and disaggregation) and directional shifts in particle density distribution (Figure 6). The dynamic re-assembly of soil organic and mineral particles challenges the common assumption in the soil C modeling studies where kinetically-defined C pools are to be matched with specific soil physical fractions without considering the changes in mineral phases. Our approach, at the same time, may give useful data for soil structure- or particle-based models that are designed to model both physical structural changes and OM dynamics [5,80,81].

Supplementary Materials

The following are available online at https://www.mdpi.com/2571-8789/2/2/29/s1, Figure S1: Photo images of NT and Till-1 top soil profiles. Till-2 and Bare plots are not shown but had similar profile feature to Till-1. Figure S2: The concentration of C (a), N (b), and C:N ratio (c) across the density fractions for the five soil samples studied. Figure S3: Recoveries of pyrophosphate-extractable Fe (a), Al (b), and Mn (c), acid-oxalate-extractable Fe (d), Al (e), Si (f), and Mn (g), and dithionite-citrate-extractable Fe (h), Al (i), Si (j), and Mn (k) as well as their distributions among the six density fractions. F1: <1.6, F2: 1.6–1.8, F3: 1.8–2.0, F4: 2.0–2.25, F5: 2.25–2.5, and F6: >2.5 g cm−3. Table S1: Mass recoveries, C and N concentrations and distributions after aggregate-size separation (by wet sieving) of conventional till (Till-1) and no-tillage (NT-a) samples. The data on Till is from [79]. Table S2: The concentration of aluminum, silica, iron, and manganese extracted sequentially by pyrophosphate (PP), acid-oxalate (OX), and dithionite-citrate (DC) from each density fractions for the five soil samples studied.

Author Contributions

R.W. conceived and designed the experiments; R.W., M.K. and M.A. performed the experiments; R.W. and M.K. analyzed the data; M.U. contributed radiocarbon analysis and its interpretation; all contributed to the discussion of the results; and R.W. and M.K. wrote the paper.

Funding

This research was supported by JSPS Grant-in-Aid for Scientific Research (B) JP21310016 and JP15KT0036 for R.W. and by NIES project SR-62-2012 for M.U.

Acknowledgments

We thank Y. Yaegaki for laboratory assistance, NIAES staffs for maintaining long-term field experiment, and C. Sierra and T. Baisden for the discussion on radiocarbon data interpretation. Helpful comments by the two reviewers and C. Chenu are also kindly acknowledged.

Conflicts of Interest

The authors declare no conflict of interest. The founding sponsors had no role in the design of the study; in the collection, analyses, or interpretation of data; in the writing of the manuscript, and in the decision to publish the results.

Appendix A. Mass Balance (Elemental Budget) and Caution in Pyrophosphate Extraction

It is critical to calculate the mass balance and the budget of measured elements as a first step when interpreting the data from physical fractionation studies. Ideally, the sum of the physical fractions should be equal to the bulk sample. However, the smaller is the pool size of target element (e.g., oxalate-extractable Fe), the greater are the errors.
The recovery of mass, C and N was reasonably close to 100% (Figure 1a–c). In contrast, the recoveries of Fe, Al, Si, and Mn dissolved by the initial pyrophosphate (PP) extraction, when summing up all six fractions, were not as good. Specifically, the recoveries were 90–241% for Fe, 108–135% for Al, and 70–209% for Mn (Figure S3). The greater errors compared to C and N were partly attributable to the greater number of analytical steps required (i.e., extraction, centrifugation, filtration, and dilution) and the small pool sizes of PP-soluble metals. The recoveries well above 100% indicate cumulative contributions of the colloidal particles that were not fully removed by our high-speed centrifugation treatment. Our attempt to remove the colloids by 0.025 µm filtration following the centrifugation did not show consistent improvement in the recovery among the samples, suggesting that: (i) sub-sampling error was large; (ii) some colloids were smaller than 0.025 µm; and/or (ii) greater metal dissolution after isolation of the fractions compared to the bulk sample. Peptization problem appears to be an inevitable artifact in PP extraction (with a possible exception of organic flocculant) and we need to pay great care for the data interpretation as pointed out by earlier workers [55,82].
We, nevertheless, think this overestimation had little effect on the overall metal distribution patterns from OX- and DC-extractions because the pool sizes of PP-extractable metals were much smaller—1/9 (Al), 1/86 (Fe), 1/45 (Si) and 1/18 (Mn)—compared to the sizes of subsequent OX-extractable metals (Table S2). The acid oxalate (OX) extraction showed more reasonable recoveries of 91–133% for Fe, 90–108% for Al, 89–110% for Si, and 76–107% for Mn (Table S2 and Figure S3). The dithionite-citrate extraction following the OX extraction also showed reasonable recoveries of 89–105% for Fe, 95–110% for Al, 95–111% for Si, and 83–124% for Mn (Table S2, Figure S3). In this study, we thus avoided the use of PP-extraction results and focused on OX- and DC-extraction results in our discussion.
Overall, the efficiency of recovery largely depended on the pool size of measured variables. The most complete recovery was shown for total mass followed by C and N, OX and DC extractable metals, and the least complete recoveries were shown for PP extractable metals.

Appendix B. Site History Inferred from Radiocarbon Results

Cautions are required when comparing Δ14C between the samples from slightly different locations and land history. If the Δ14C among the density fractions was comparable for NT, Till-1, Till-2, and Bare soil samples prior to the start of decadal soil OM management, we expect that Δ14C pattern follows the TC gradient not only in F1 but in the higher-density fractions as a portion of modern C entered as plant litter can move to higher density fraction in decadal time scale [35,75]. However, despite higher input rates of modern C as plant residues in Till-1 relative to Till-2 or Bare plots, we found consistently more negative Δ14C (i.e., older C) in Till-1 compared to Till-2 and Bare for F2–F6 (Table 2). We speculated that the difference in site history between the two locations (NT and Till-1 vs. Till-2 and Bare) would account for the Δ14C pattern. The plots of NT and Till-1 were located 320 m northwest from those of Till-2 and Bare. When comparing each density fraction from F2 to F6 individually, Till-1 was 43‰ ± 19‰ (mean ± SD) more negative than Till-2 and 74‰ ± 14‰ more negative than Bare, respectively. This result implies that the surface soil in NT/Till-1 plots had inherently more negative Δ14C (i.e., older C) than that in Till-2/Bare plots. The most plausible explanation for the consistent Δ14C differences is greater surface soil removal from NT/Till-1 section of the experimental field compared to Till-2/Bare section when the study area was first established in 1978 by mechanically leveling the fields to remove small topographic variation (NAIES report in Japanese). Radiocarbon age increased by 300–700 years per 10 cm depth among Japanese Andisol profiles [83], which is consistent with up-building pedogenesis of tephra-derived soils in Japan [64]. While nearly impossible to identify specific reasons due to the lack of detail records, the small difference in surface soil movement (removal, addition, or mixing) between NT/Till-1 and Till-2/Bare plots prior to the start of current soil OM management appears to be the plausible explanation of the consistent difference in Δ14C of 40–70‰ between the two locations.

References

  1. Oades, J. Soil organic matter and structural stability: Mechanisms and implications for management. Plant Soil 1984, 76, 319–337. [Google Scholar] [CrossRef]
  2. Plante, A.F.; Parton, W.J. The dynamics of soil organic matter and nutrient cycling. In Soil Microbiology, Ecology and Biochemistry, 3rd ed.; Academic Press: San Diego, CA, USA, 2007; pp. 433–467. [Google Scholar]
  3. Chenu, C.; Cosentino, D. Microbial regulation of soil structural dynamics. In The Architecture and Biology of Soils: Life in Inner Space; Ritz, K., Young, I., Eds.; CAB: Wallingford, UK, 2011; pp. 37–70. [Google Scholar]
  4. Six, J.; Bossuyt, H.; Degryze, S.; Denef, K. A history of research on the link between (micro)aggregates, soil biota, and soil organic matter dynamics. Soil Tillage Res. 2004, 79, 7–31. [Google Scholar] [CrossRef]
  5. Totsche, K.U.; Amelung, W.; Gerzabek, M.H.; Guggenberger, G.; Klumpp, E.; Knief, C.; Lehndorff, E.; Mikutta, R.; Peth, S.; Prechtel, A.; et al. Microaggregates in soils. J. Plant Nutr. Soil Sci. 2018, 181, 104–136. [Google Scholar] [CrossRef]
  6. Tisdall, J.M.; Oades, J.M. Organic-matter and water-stable aggregates in soils. J. Soil Sci. 1982, 33, 141–163. [Google Scholar] [CrossRef]
  7. Abiven, S.; Menasseri, S.; Chenu, C. The effects of organic inputs over time on soil aggregate stability—A literature analysis. Soil Biol. Biochem. 2009, 41, 1–12. [Google Scholar] [CrossRef]
  8. Jastrow, J.D. Soil aggregate formation and the accrual of particulate and mineral-associated organic matter. Soil Biol. Biochem. 1996, 28, 665–676. [Google Scholar] [CrossRef]
  9. Oades, J.M.; Waters, A.G. Aggregate hierarchy in soils. Aust. J. Soil Res. 1991, 29, 815–828. [Google Scholar] [CrossRef]
  10. Krishna Murti, G.S.R.; Huang, P.M. Influence of constituents on the stability of mechanical separates of soils representing major taxonomic orders. Appl. Clay Sci. 1987, 2, 299–308. [Google Scholar] [CrossRef]
  11. Duiker, S.W.; Rhoton, F.E.; Torrent, J.; Smeck, N.E.; Lal, R. Iron (hydr)oxide crystallinity effects on soil aggregation. Soil Sci. Soc. Am. J. 2003, 67, 606–611. [Google Scholar] [CrossRef]
  12. Emerson, W. A classification of soil aggregates based on their coherence in water. Soil Res. 1967, 5, 47–57. [Google Scholar] [CrossRef]
  13. Boix-Fayos, C.; Calvo-Cases, A.; Imeson, A.C.; Soriano-Soto, M.D. Influence of soil properties on the aggregation of some mediterranean soils and the use of aggregate size and stability as land degradation indicators. Catena 2001, 44, 47–67. [Google Scholar] [CrossRef]
  14. Chenu, C.; Plante, A.F. Clay-sized organo-mineral complexes in a cultivation chronosequence: Revisiting the concept of the ‘primary organo-mineral complex’. Eur. J. Soil Sci. 2006, 57, 596–607. [Google Scholar] [CrossRef]
  15. Boudot, J.P.; Bel Hadj Brahim, A.; Steiman, R.; Seigle-Murandi, F. Biodegradation of synthetic organo-metallic complexes of iron and aluminium with selected metal to carbon ratios. Soil Biol. Biochem. 1989, 21, 961–966. [Google Scholar] [CrossRef]
  16. Kaiser, K.; Guggenberger, G. Sorptive stabilization of organic matter by microporous goethite: Sorption into small pores vs. Surface complexation. Eur. J. Soil Sci. 2007, 58, 45–59. [Google Scholar] [CrossRef]
  17. Schneider, M.P.W.; Scheel, T.; Mikutta, R.; van Hees, P.; Kaiser, K.; Kalbitz, K. Sorptive stabilization of organic matter by amorphous al hydroxide. Geochim. Cosmochim. Acta 2010, 74, 1606–1619. [Google Scholar] [CrossRef] [Green Version]
  18. Asano, M.; Wagai, R. Evidence of aggregate hierarchy at micro- to submicron scales in an allophanic andisol. Geoderma 2014, 216, 62–74. [Google Scholar] [CrossRef]
  19. Field, D.J.; Minasny, B. A description of aggregate liberation and dispersion in a horizons of Australian vertisols by ultrasonic agitation. Geoderma 1999, 91, 11–26. [Google Scholar] [CrossRef]
  20. Vrdoljak, G.; Sposito, G. Soil aggregate hierarchy in a Brazilian oxisol. Dev. Soil Sci. 2002, 28A, 197–217. [Google Scholar]
  21. Shoji, S.; Nanzyo, M.; Dahlgren, R. Volcanic Ash Soils: Genesis, Properties, and Utilization; Elsevier: Amsterdam, The Netherlands, 1993; p. 288. [Google Scholar]
  22. Basile-Doelsch, I.; Amundson, R.; Stone, W.E.E.; Borschneck, D.; Bottero, J.Y.; Moustier, S.; Masin, F.; Colin, F. Mineral control of carbon pools in a volcanic soil horizon. Geoderma 2007, 137, 477–489. [Google Scholar] [CrossRef]
  23. Percival, H.J.; Parfitt, R.L.; Scott, N.A. Factors controlling soil carbon levels in new zealand grasslands is clay content important? Soil Sci. Soc. Am. J. 2000, 64, 1623–1630. [Google Scholar] [CrossRef]
  24. Wada, K.; Higashi, T. The categories of aluminum- and iron-humus complexes in ando soils determined by selective dissolution. J. Soil Sci. 1976, 27, 357–368. [Google Scholar] [CrossRef]
  25. Huygens, D.; Boeckx, P.; Van Cleemput, O.; Oyarzun, C.; Godoy, R. Aggregate and soil organic carbon dynamics in south chilean andisols. Biogeosciences 2005, 2, 159–174. [Google Scholar] [CrossRef] [Green Version]
  26. Rasmussen, C.; Torn, M.S.; Southard, R.J. Mineral assemblage and aggregates control carbon dynamics in a California conifer forest. Soil Sci. Soc. Am. J. 2005, 69, 1711–1721. [Google Scholar] [CrossRef]
  27. Wagai, R.; Mayer, L.M. Sorptive stabilization of organic matter in soils by hydrous iron oxides. Geochim. Cosmochim. Acta 2007, 71, 25–35. [Google Scholar] [CrossRef]
  28. Kramer, M.G.; Sanderman, J.; Chadwick, O.A.; Chorover, J.; Vitousek, P.M. Long-term carbon storage through retention of dissolved aromatic acids by reactive particles in soil. Glob. Chang. Biol. 2012, 18, 2594–2605. [Google Scholar] [CrossRef]
  29. Rasmussen, C.; Heckman, K.; Wieder, W.R.; Keiluweit, M.; Lawrence, C.R.; Berhe, A.A.; Blankinship, J.C.; Crow, S.E.; Druhan, J.L.; Pries, C.E.H.; et al. Beyond clay: Towards an improved set of variables for predicting soil organic matter content. Biogeochemistry 2018, 137, 297–306. [Google Scholar] [CrossRef]
  30. Christensen, B. Physical fractionation of soil and organic matter in primary particle size and density separates. In Advances in Soil Science; Stewart, B.A., Ed.; Springer: New York, NY, USA, 1992; Volume 20, pp. 1–90. [Google Scholar]
  31. Von Lützow, M.; Kögel-Knabner, I.; Ekschmitt, K.; Flessa, H.; Guggenberger, G.; Matzner, E.; Marschner, B. Som fractionation methods: Relevance to functional pools and to stabilization mechanisms. Soil Biol. Biochem. 2007, 39, 2183–2207. [Google Scholar] [CrossRef]
  32. Hatton, P.-J.; Bodé, S.; Angeli, N.; Boeckx, P.; Zeller, B.; Boiry, S.; Gelhaye, L.; Derrien, D. Assimilation and accumulation of c by fungi and bacteria attached to soil density fractions. Soil Biol. Biochem. 2014, 79, 132–139. [Google Scholar] [CrossRef]
  33. Kondo, M.; Uchida, M.; Shibata, Y. Radiocarbon-based residence time estimates of soil organic carbon in a temperate forest: Case study for the density fractionation for Japanese volcanic ash soil. Nucl. Instrum. Methods Phys. Res. Sect. B Beam Interact. Mater. At. 2010, 268, 1073–1076. [Google Scholar] [CrossRef]
  34. Lajtha, K.; Townsend, K.L.; Kramer, M.G.; Swanston, C.; Bowden, R.D.; Nadelhoffer, K. Changes to particulate versus mineral-associated soil carbon after 50 years of litter manipulation in forest and prairie experimental ecosystems. Biogeochemistry 2014, 119, 341–360. [Google Scholar] [CrossRef]
  35. Sollins, P.; Kramer, M.G.; Swanston, C.; Lajtha, K.; Filley, T.; Aufdenkampe, A.K.; Wagai, R.; Bowden, R.D. Sequential density fractionation across soils of contrasting mineralogy: Evidence for both microbial- and mineral-controlled soil organic matter stabilization. Biogeochemistry 2009, 96, 209–231. [Google Scholar] [CrossRef]
  36. Sollins, P.; Swanston, C.; Kleber, M.; Filley, T.; Kramer, M.; Crow, S.; Caldwell, B.A.; Lajtha, K.; Bowden, R. Organic c and n stabilization in a forest soil: Evidence from sequential density fractionation. Soil Biol. Biochem. 2006, 38, 3313–3324. [Google Scholar] [CrossRef]
  37. Baisden, W.T.; Amundson, R.; Cook, A.C.; Brenner, D.L. Turnover and storage of c and n in five density fractions from california annual grassland surface soils. Glob. Biogeochem. Cycle 2002, 16, 1117. [Google Scholar] [CrossRef]
  38. Castanha, C.; Trumbore, S.; Amundson, R. Methods of separating soil carbon pools affect the chemistry and turnover time of isolated fractions. Radiocarbon 2008, 50, 83–97. [Google Scholar] [CrossRef]
  39. Golchin, A.; Baldock, J.A.; Oades, J.M. A model linking organic matter decomposition, chemistry, and aggregate dynamics. In Soil Processes and the Carbon Cycle; Lal, R., Kimble, J.M., Follett, R.F., Stewart, B.A., Eds.; CRC Press: Boca Raton, FL, USA, 1997; pp. 245–266. [Google Scholar]
  40. Gunina, A.; Kuzyakov, Y. Pathways of litter c by formation of aggregates and som density fractions: Implications from 13c natural abundance. Soil Biol. Biochem. 2014, 71, 95–104. [Google Scholar] [CrossRef]
  41. Crow, S.; Reeves, M.; Schubert, O.; Sierra, C. Optimization of method to quantify soil organic matter dynamics and carbon sequestration potential in volcanic ash soils. Biogeochemistry 2014, 123, 1–21. [Google Scholar]
  42. Wagai, R.; Kajiura, M.; Asano, M.; Hiradate, S. Nature of soil organo-mineral assemblage examined by sequential density fractionation with and without sonication: Is allophanic soil different? Geoderma 2015, 241–242, 295–305. [Google Scholar] [CrossRef]
  43. Kaiser, K.; Guggenberger, G. Distribution of hydrous aluminium and iron over density fractions depends on organic matter load and ultrasonic dispersion. Geoderma 2007, 140, 140–146. [Google Scholar] [CrossRef]
  44. Mayer, L.M.; Schick, L.L.; Hardy, K.R.; Wagai, R.; McCarthy, J. Organic matter in small mesopores in sediments and soils. Geochim. Cosmochim. Acta 2004, 68, 3863–3872. [Google Scholar] [CrossRef]
  45. Nickel, E.H.; Nichols, M.C. Mineral Reference Mannual; Springer: Boston, MA, USA, 1991. [Google Scholar]
  46. Sposito, G. The Chemistry of Soils, 2nd ed.; Oxford University Press: New York, NY, USA, 2008. [Google Scholar]
  47. Parfitt, R.; Childs, C. Estimation of forms of Fe and Al—A review, and analysis of contrasting soils by dissolution and mossbauer methods. Soil Res. 1988, 26, 121–144. [Google Scholar] [CrossRef]
  48. Levard, C.; Doelsch, E.; Basile-Doelsch, I.; Abidin, Z.; Miche, H.; Masion, A.; Rose, J.; Borschneck, D.; Bottero, J.Y. Structure and distribution of allophanes, imogolite and proto-imogolite in volcanic soils. Geoderma 2012, 183, 100–108. [Google Scholar] [CrossRef]
  49. Thompson, A.; Rancourt, D.G.; Chadwick, O.A.; Chorover, J. Iron solid-phase differentiation along a redox gradient in basaltic soils. Geochim. Cosmochim. Acta 2011, 75, 119–133. [Google Scholar] [CrossRef]
  50. Misra, S.G.; Mishra, P.C. Forms of manganese as influenced by organic matter and iron oxide. Plant Soil 1969, 30, 62–70. [Google Scholar] [CrossRef]
  51. Chorover, J.; Amistadi, M.K. Reaction of forest floor organic matter at goethite, birnessite and smectite surfaces. Geochim. Cosmochim. Acta 2001, 65, 95–109. [Google Scholar] [CrossRef]
  52. Suda, A.; Makino, T. Functional effects of manganese and iron oxides on the dynamics of trace elements in soils with a special focus on arsenic and cadmium: A review. Geoderma 2016, 270, 68–75. [Google Scholar] [CrossRef]
  53. Wagai, R.; Kishimoto-Mo, A.W.; Yonemura, S.; Shirato, Y.; Hiradate, S.; Yagasaki, Y. Linking temperature sensitivity of soil organic matter decomposition to its molecular structure, accessibility, and microbial physiology. Glob. Chang. Biol. 2013, 19, 1114–1125. [Google Scholar] [CrossRef] [PubMed]
  54. Dahlgren, R.; Shoji, S.; Nanzyo, M. Mineralogical characteristics of volcanic ash soils. In Volcanic Ash Soils: Genesis, Properties, and Utilization; Shoji, S., Nanzyo, M., Dahlgren, R., Eds.; Developments in Soil Science 21; Elsevier: Amsterdam, The Netherlands, 1993; Volume 21, pp. 101–143. [Google Scholar]
  55. Wagai, R.; Mayer, L.M.; Kitayama, K.; Shirato, Y. Association of organic matter with iron and aluminum across a range of soils determined via selective dissolution techniques coupled with dissolved nitrogen analysis. Biogeochemistry 2013, 112, 95–109. [Google Scholar] [CrossRef]
  56. Shoji, S.; Dahlgren, R.; Nanzyo, M. Chemical characteristics of volcanic ash soils. In Volcanic Ash Soils: Genesis, Properties, and Utilization; Shoji, S., Nanzyo, M., Dahlgren, R., Eds.; Developments in Soil Science 21; Elsevier: Amsterdam, The Netherlands; 1993; Volume 21, pp. 145–187. [Google Scholar]
  57. Uchida, M.; Shibata, Y.; Yoneda, M.; Kobayashi, T.; Morita, M. Technical progress in AMS microscale radiocarbon analysis. Nucl. Instrum. Methods Phys. Res. Sect. B Beam Interact. Mater. At. 2004, 223–224, 313–317. [Google Scholar] [CrossRef]
  58. Uchida, M.; Mantoku, K.; Kobayashi, T. Recent improvements for ultra-microscale radiocarbon measurements at NIES-TERRA. Nucl. Instrum. Methods Phys. Res. B 2018, in press. [Google Scholar]
  59. Uchida, M.; Shibata, Y.; Ohkushi, K.; Yoneda, M.; Kawamura, K.; Morita, M. Age discrepancy between molecular biomarkers and calcareous foraminifera isolated from the same horizons of northwest pacific sediments. Chem. Geol. 2005, 218, 73–89. [Google Scholar] [CrossRef]
  60. Crow, S.E.; Swanston, C.W.; Lajtha, K.; Brooks, J.R.; Keirstead, H. Density fractionation of forest soils: Methodological questions and interpretation of incubation results and turnover time in an ecosystem context. Biogeochemistry 2007, 85, 69–90. [Google Scholar] [CrossRef]
  61. Kaiser, K.; Guggenberger, G. Mineral surfaces and soil organic matter. Eur. J. Soil Sci. 2003, 54, 219–236. [Google Scholar] [CrossRef]
  62. Kajiura, M.; Wagai, R.; Hayashi, K. Optimal thermolysis conditions for soil carbon storage on plant residue burning: Modeling the trade-off between thermal decomposition and subsequent biodegradation. J. Environ. Qual. 2015, 44, 228–235. [Google Scholar] [CrossRef] [PubMed]
  63. Keiluweit, M.; Nico, P.S.; Johnson, M.G.; Kleber, M. Dynamic molecular structure of plant biomass-derived black carbon (biochar). Environ. Sci. Technol. 2010, 44, 1247–1253. [Google Scholar] [CrossRef] [PubMed]
  64. McBeath, A.V.; Smernik, R.J.; Schneider, M.P.W.; Schmidt, M.W.I.; Plant, E.L. Determination of the aromaticity and the degree of aromatic condensation of a thermosequence of wood charcoal using NMR. Org. Geochem. 2011, 42, 1194–1202. [Google Scholar] [CrossRef]
  65. Golchin, A.; Baldock, J.A.; Clarke, P.; Higashi, T.; Oades, J.M. The effects of vegetation and burning on the chemical composition of soil organic matter of a volcanic ash soil as shown by 13C NMR spectroscopy. II. Density fractions. Geoderma 1997, 76, 175–192. [Google Scholar] [CrossRef]
  66. Inoue, Y.; Hiradate, S.; Sase, T.; Hosono, M.; Morita, S.; Matsuzaki, H. Using C-14 dating of stable humin fractions to assess upbuilding pedogenesis of a buried holocene humic soil horizon, towada volcano, Japan. Geoderma 2011, 167–168, 85–90. [Google Scholar] [CrossRef]
  67. Nishimura, S.; Hirota, T.; Hirahara, O.; Shindo, H. Contribution of charred and buried plant fragments to humic and fulvic acids in Japanese volcanic ash soils. Soil Sci. Plant Nutr. 2006, 52, 686–690. [Google Scholar] [CrossRef]
  68. Shindo, H.; Honna, T.; Yamamoto, S.; Honma, H. Contribution of charred plant fragments to soil organic carbon in japanese volcanic ash soils containing black humic acids. Org. Geochem. 2004, 35, 235–241. [Google Scholar] [CrossRef]
  69. Brodowski, S.; John, B.; Flessa, H.; Amelung, W. Aggregate-occluded black carbon in soil. Eur. J. Soil Sci. 2006, 57, 539–546. [Google Scholar] [CrossRef]
  70. Heckman, K.; Throckmorton, H.; Clingensmith, C.; González Vila, F.J.; Horwath, W.R.; Knicker, H.; Rasmussen, C. Factors affecting the molecular structure and mean residence time of occluded organics in a lithosequence of soils under ponderosa pine. Soil Biol. Biochem. 2014, 77, 1–11. [Google Scholar] [CrossRef]
  71. Mikutta, R.; Schaumann, G.E.; Gildemeister, D.; Bonneville, S.; Kramer, M.G.; Chorover, J.; Chadwick, O.A.; Guggenberger, G. Biogeochemistry of mineral–organic associations across a long-term mineralogical soil gradient (0.3–4100 kyr), hawaiian islands. Geochim. Cosmochim. Acta 2009, 73, 2034–2060. [Google Scholar] [CrossRef]
  72. Chevallier, T.; Woignier, T.; Toucet, J.; Blanchart, E. Organic carbon stabilization in the fractal pore structure of andosols. Geoderma 2010, 159, 182–188. [Google Scholar] [CrossRef]
  73. Filimonova, S.; Kaufhold, S.; Wagner, F.E.; Häusler, W.; Kögel-Knabner, I. The role of allophane nano-structure and Fe oxide speciation for hosting soil organic matter in an allophanic andosol. Geochim. Cosmochim. Acta 2016, 180, 284–302. [Google Scholar] [CrossRef]
  74. Cotrufo, M.F.; Soong, J.L.; Horton, A.J.; Campbell, E.E.; Haddix, M.L.; Wall, D.H.; Parton, W.J. Formation of soil organic matter via biochemical and physical pathways of litter mass loss. Nat. Geosci. 2015, 8, 776–779. [Google Scholar] [CrossRef]
  75. Swanston, C.W.; Torn, M.S.; Hanson, P.J.; Southon, J.R.; Garten, C.T.; Hanlon, E.M.; Ganio, L. Initial characterization of processes of soil carbon stabilization using forest stand-level radiocarbon enrichment. Geoderma 2005, 128, 52–62. [Google Scholar] [CrossRef]
  76. Vogel, C.; Mueller, C.W.; Höschen, C.; Buegger, F.; Heister, K.; Schulz, S.; Schloter, M.; Kögel-Knabner, I. Submicron structures provide preferential spots for carbon and nitrogen sequestration in soils. Nat. Commun. 2014, 5, 2947. [Google Scholar] [CrossRef] [PubMed]
  77. Hoyos, N.; Comerford, N.B. Land use and landscape effects on aggregate stability and total carbon of andisols from the Colombian Andes. Geoderma 2005, 129, 268–278. [Google Scholar] [CrossRef]
  78. Paul, S.; Martinson, G.O.; Veldkamp, E.; Flessa, H. Sample pretreatment affects the distribution of organic carbon in aggregates of tropical grassland soils. Soil Sci. Soc. Am. J. 2008, 72, 500. [Google Scholar] [CrossRef]
  79. Asano, M.; Wagai, R. Distinctive organic matter pools among particle-size fractions detected by solid-state 13c-NMR, δ13c and δ15n analyses only after strong dispersion in an allophanic andisol. Soil Sci. Plant Nutr. 2015, 61, 242–248. [Google Scholar] [CrossRef]
  80. Malamoud, K.; McBratney, A.B.; Minasny, B.; Field, D.J. Modelling how carbon affects soil structure. Geoderma 2009, 149, 19–26. [Google Scholar] [CrossRef]
  81. Sollins, P.; Gregg, J.W. Soil organic matter accumulation in relation to changing soil volume, mass, and structure: Concepts and calculations. Geoderma 2017, 301, 60–71. [Google Scholar] [CrossRef]
  82. Schuppli, P.A.; Ross, G.J.; McKeague, J.A. The effective removal of suspended materials from pyrophosphate extracts of soils from tropical and temperate regions 1. Soil Sci. Soc. Am. J. 1983, 47, 1026–1032. [Google Scholar] [CrossRef]
  83. Yamada, Y. The Characterization of Humus Accumulation in Andosols by 14c Dating; National Institute for Agro-Environmental Sciences: Tsukuba, Ibaraki, Japan, 1986; pp. 23–86. [Google Scholar]
Figure 1. Recovery of: mass (a); organic C (b); nitrogen (c); and oxalate-extractable aluminum and iron (Al + 0.5Fe) (d), as well as their distributions among the density fractions (F1: <1.6; F2: 1.6–1.8; F3: 1.8–2.0; F4: 2.0–2.25; F5: 2.25–2.5; and F6: >2.5 g cm−3).
Soilsystems 02 00029 g001
Figure 2. Radiocarbon content: against the density fractions (a); and against C:N ratio (b), from all five soil samples. Two density fractions were grouped to assign same symbol in (b).
Soilsystems 02 00029 g002
Figure 3. Concentrations of aluminum and iron (Al + 0.5Fe) in each of the six density fractions from the five samples sequentially extracted by: pyrophosphate (a); acid-oxalate (b); and dithionite-citrate (c) (F1: <1.6; F2: 1.6–1.8; F3: 1.8–2.0; F4: 2.0–2.25; F5: 2.25–2.5; and F6: >2.5 g cm−3).
Soilsystems 02 00029 g003
Figure 4. Standing stocks of: organic C (a); reactive metals—AlOX + 0.5FeOX (b); and inorganic material (c) in the top 20 cm soils, partitioned to the six density fractions. The soil mass was normalized to the top 20 cm of NT soil. Inorganic material was calculated as total mass minus organic matter (organic C × 2). F1: <1.6; F2: 1.6–1.8; F3: 1.8–2.0; F4: 2.0–2.25; F5: 2.25–2.5; and F6: >2.5 g cm−3.
Soilsystems 02 00029 g004
Figure 5. Schematic of re-assembly of shaking-resistant aggregates upon OM accretion. (a) A large shaking-resistant aggregate under field conditions. The aggregate consisted of five subunits, having the density ranges from F2 to F5, and has a net density of F4 (2.0–2.25 g cm−3). (b) Adhesion of newly-accreted OM to the aggregate surface under field conditions due to long-term compost addition in NT plot. (c) When OM binding force exceeds the force between subunits (e.g., between F4 and F5 subunits), OM-glued subunits are recovered as new lower-density aggregates by the density fractionation with mechanical shaking. The subunit “F5” which was a part of the large aggregate of F4 density range at t = 0 is now recovered at F5 density (2.25–2.5 g cm−3) because the adhered OM pulled off lower-density subunits (F2–F4) from the aggregate. The net effect is the relative increase in lower-density particles (F1–F3) in this schematic.
Soilsystems 02 00029 g005
Figure 6. Schematic of the inter-relationship of particle density with the changes in OM composition, aggregation mode and mass distribution after mechanical shaking at the intermediate level of aggregate hierarchy (Note: relative sizes of cartoon particles are inaccurate). OM entering to soil system as high C:N, lowest-density litter progressively experiences both microbial transformation (leading to N and 15N enrichment) and mineral interaction (leading to the increase in net particle density). The latter process is assisted by increasing contents of the reactive metal phases as major binding agents. Additional OM input leads to greater organic binding effect, which results in a shift in the density distribution of shaking-resistant aggregates from the dominance of higher-density fractions (dotted line along left Y axis) towards lower-density aggregates (solid brown line). Note that the pyrogenic C present in low-density fractions (high C:N with older C age) cannot be depicted in this framework.
Soilsystems 02 00029 g006
Table 1. Basic physical and chemical characteristics of the five soil samples from the four long-term field experiment plots (NT, Till-1, Till-2, and Bare).
Sample
ID
Sample Depth
cm
Bulk Density
g cm−3
TCTNC:NΔ14C
pH in H2OPP 1-ExtractableOX 1-ExtractableDC 1-Extractable
mg g−1FeAlFeAlFeAl
mg g−1mg g−1mg g−1
NT-a0–50.451491014.947.4 6.2 1.51.68.619.115.13.6
NT-b5–200.6380.45.913.624.3 6.2 1.23.514.035.526.65.6
Till-10–200.7851.44.112.5−125.86.1 1.05.018.541.625.56.3
Till-20–200.7342.33.611.8−65.66.71.33.829.853.429.96.2
Bare0–200.7436.93.012.3−33.16.50.53.618.539.630.15.8
1 PP, OX, and DC refer to pyrophosphate, acid-oxalate, and dithionite-citrate, respectively. Silica and manganese extracted by these extractants are shown in Table S2.
Table 2. Mass recovery, organic carbon (C) and nitrogen (N) as well as radiocarbon activity among the density fractions of the five soil samples along the TC gradient.
Sample
ID
Fraction
ID
Mass FractionC 1N 1C:NC 2N 214CΔ14C
mg g fraction−1mg g bulk−1pMC
NT-aF10.21533.92.1915.574.54.8105.774.1
F20.22222.21.8012.451.04.1104.961.2
F30.08612.11.0911.110.71.0101.219.0
F40.1484.70.519.27.10.890.2−102.5
F50.1312.20.297.52.90.490.4−99.4
F60.2150.50.076.20.90.185.4−147.8
NT-bF10.03930.91.8217.012.00.7103.550.5
F20.10421.81.5713.922.91.6105.060.2
F30.14811.30.9412.016.81.4101.213.0
F40.2795.80.5510.616.21.592.7−81.7
F50.2692.60.289.57.10.791.6−94.1
F60.1650.60.068.90.90.193.1−77.8
Till-1F10.00826.11.6415.92.00.199.2−2.5
F20.01926.21.2021.95.10.284.3−165.6
F30.12710.50.8013.113.31.092.4−86.9
F40.4195.60.5210.823.52.287.2−145.6
F50.2662.30.249.76.00.684.6−169.4
F60.2010.70.089.21.40.288.4−131.6
Till-2F10.00725.51.1921.41.90.195.7−42.2
F20.01128.31.1524.63.30.190.4−104.3
F30.03813.10.8914.75.30.494.8−64.0
F40.3046.50.6310.320.92.093.7−81.0
F50.4012.80.2710.211.81.289.0−127.3
F60.2400.60.079.51.60.291.2−105.1
BareF10.00426.21.0924.11.20.093.9−64.2
F20.01825.91.1223.24.60.290.6−102.3
F30.0469.90.7413.44.60.399.1−22.6
F40.3035.20.5210.015.91.697.1−48.5
F50.3992.40.269.69.81.092.3−95.9
F60.2790.60.079.21.80.296.0−58.2
1 C and N concentration on fraction mass basis. 2 C and N concentrations on bulk soil mass basis.
Table 3. Distribution of mass among specific poorly-crystalline and crystalline mineral phases as well as organic matter in bulk and density fractions. The means (and ranges) among the five soil samples.
Fraction & DensityAllophane/Imogolite-Type Phase 1Ferrihydrite 2Poorly-Crystalline Minerals 3Other Minerals 4Organic Matter 5
(g cm−3)(% by mass)
Bulk13 (8–17)3 (2–5)16 (9–22)71 (65–73)14 (7–30)
F1<1.65 (2–8)1 (1–3)6 (3–11)36 (29–41)58 (51–68)
F21.6–1.811 (2–8)2 (1–4)13 (8–19)37 (24–47)50 (44–56)
F31.8–2.014 (7–15)3 (1–4)16 (9–21)61 (53–66)23 (20–26)
F42.0–2.2521 (7–17)4 (3–6)25 (22–29)64 (58–69)11 (9–13)
F52.25–2.515 (19–23)3 (2–5)19 (11–26)76 (68–84)5 (4–6)
F6>2.53 (9–21)4 (2–4)7 (5–9)92 (90–94)1 (1–1)
1 Estimated from [SiOX] × 7.1 [56]; 2 estimated from [FeOX] × 1.7 [56]; 3 the sum of allophane-type phase and ferrihydrite; 4 100 − [poorly-crystalline minerals + organic matter]; 5 [OC] × 1.72 following [56].

