


Influence of Wooden Compartment’s Fuel Moisture Content on Time to Flashover: An Experimental and Numerical Study


1
Department of Safety, Chemistry and Biomedical Laboratory Sciences, Western Norway University of Applied Sciences, 5528 Haugesund, Norway
2
Fire Disasters Research Group, Department of Safety, Chemistry and Biomedical Laboratory Sciences, Western Norway University of Applied Sciences, 5528 Haugesund, Norway
*
Author to whom correspondence should be addressed.
†
These authors contributed equally to this work.
Fire 2024, 7(1), 17; https://doi.org/10.3390/fire7010017
Submission received: 23 October 2023
/
Revised: 18 December 2023
/
Accepted: 20 December 2023
/
Published: 4 January 2024
(This article belongs to the Special Issue Forest Fuel Treatment and Fire Risk Assessment)
Abstract
:Time to flashover is an important fire safety parameter. The present study investigated the effects of fuel moisture content on the time to flashover, crucial in fire safety analysis. Experiments and simulations of an ISO 9750-1 room model at 1/8 scale were performed by varying the wooden compartment boundaries’ moisture content between 5% and 16%. The results showed a linear increase in time to flashover with fuel moisture content. An empirical model to predict the time to flashover according to the moisture content was developed. The experiments showed that increasing the moisture from 6.5% to 14.4% prolonged the flashover time from to . These experimental results are consistent with computational fluid dynamics (CFD) modeling using Fire Dynamics Simulator (FDS), which also depicts a corresponding increase in the time to flashover. These findings demonstrate the critical role of fuel moisture content in fire safety analysis. The results suggest that a 1/8-scale model can be utilized for cost-effective and easily manageable education and demonstration purposes. This includes helping fire brigades and fire academy students comprehend the significance of fuel moisture content in compartment fire development. Since the FDS modeling is not restricted to a 1/8 scale, the presented results are promising regarding CFD modeling of time to flashover in full-scale compartments.
1. Introduction
Fires are a major cause of accidental injury, resulting in over 300,000 deaths worldwide annually [1]. Residential fires account for approximately 83% of these fire-related fatalities [2]. In areas with abundant wood resources, both older and modern settlements often feature all-wood construction, which aligns with environmentally friendly practices as wood is a fully recyclable and carbon-neutral material. In Norway, there are many densely populated residential areas composed of wooden houses, many of which have historical significance. However, wooden buildings are also vulnerable to fire. As it is commonly known that dry wood burns more intensely than more-humid wood, the moisture content of the wood can play a significant role in determining the risk of fire and further development towards a conflagration [3]. During dry indoor conditions, these wooden buildings are then particularly vulnerable to fires, as demonstrated by the fire in Lærdaløyri in 2014. That fire resulted in the loss of 40 buildings, including 4 historic buildings, one of which was a listed building [3,4]. It was the most-severe fire in Norway regarding the number of lost structures since 1923 [5]. Investigations have shown that the low indoor relative humidity during the week before the fire in Lærdalsøyri led to a low fuel moisture content (FMC) of the indoor wooden materials, which facilitated a rapid development of the fire in the involved all-wooden constructions [3,4]. Additionally, strong winds spread the fire to buildings located several hundred of meters away from the initial fire source.
It has been shown that the intensity and frequency of wooden house fires vary with the humidity content of the surrounding air [3,4,6]. The phenomenon of more-extreme wooden home fires during wintertime was identified as early as in 1956 by Pirsko and Fons [7] and has recently been pointed out as an issue that requires further investigations [8]. Indoor and outdoor recordings of temperature and relative humidity (RH) in selected homes in Norway has shown that the indoor RH may represent a fire risk indicator [3]. Set in system, this may enable reducing a wooden structure’s fire disaster risk [8]. Recent research has shown that the associated fire risk may be modeled and predicted for a few days into the future, both regarding a single home’s fire risk and conflagration risk in densely built wooden settlements [9,10]. It is common knowledge that fires in dry wood develop faster than in more humid wood; however, how much faster fires develop when a wooden compartment has a low FMC is still under-researched. According to [10], this needs further attention for general wooden homes. In 2005, the Norwegian Directorate for Civil Protection (DSB) identified 167 areas with wooden buildings of historical significance across Norway [11]. Understanding the possible implications of the varying moisture contents on the safety of these buildings during fire events is important [11].
By studying 27,500 structural fires in New Zealand, Challands discovered that the fraction of fires over was linearly related to the response time [12]. For each additional minute of response time, about 2.3% more fires had grown beyond . His results demonstrate that early fire brigade intervention statistically reduces the impact of the fires. The other way around, for each minute, the shorter the time to flashover, the more damage would have been inflicted by the fire before the fire brigades managed to limit the damages [13].
Fires in enclosed spaces, such as homes and similar buildings, typically progress through three distinct phases: initial fire development (minutes), fully developed fire (hour(s)), and decaying fire (hour(s)) [14]. During the initial fire development, the fire may self-extinguish due to human intervention, insufficient fuel, or limited air supply. However, if the fire continues to progress, a common scenario is that the hot gases confined beneath the ceiling emit increasing amounts of heat radiation, eventually igniting a fire at ground level. Since the heat radiation is a function of the absolute temperature to the fourth power, the radiant feedback increases significantly with time. When the temperature of the smoke layer reaches the range of 550–600 , the heat radiation to the floor level generally reaches , which is sufficient to quickly involve all combustible surfaces in the enclosure. Often, windows break at this time, and flames escape through the upper part of any ventilation openings. The transition from an initial fire to a fully developed fire usually takes place within a few seconds. This sudden transition is called flashover [14]. Post flashover, fires in wooden constructions are usually under-ventilated due to limited air access through the ventilation openings, resulting in excessive flaming on the outside of the compartment. Such massive external flames present a significant risk of fire propagation to adjacent buildings and the potential initiation of a conflagration in densely built areas. This whole process, from ignition to flashover, will take less time when the wooden building material is very dry. The less time it takes, the less likely it is that firefighters will arrive in time to manage the fire before multiple homes are involved in a conflagration. This is especially the case in rural areas, where part-time firefighters need more time to water-on-fire than in densely populated areas. Most of the identified 167 areas with wooden buildings of historical significance across Norway are in rural areas [11]. Gaining more knowledge about any expected fire development in dry wooden buildings is, therefore, needed. More knowledge about all-wooden compartment flashover phenomena, possible realistic small-scale demonstration setups, and possible modeling approaches demonstrating the differences between normal FMC and low FMC compartment fire development are, therefore, much appreciated.
It is well known that the fluid dynamics in fire scale quite well through Froude number scaling [15]. Scaling with respect to heat radiation is far more difficult, since, e.g., the emissivity of a smoke layer has a non-linear dependency on the layer’s optical thickness. However, using modern computational fluid dynamics (CFD) opens for scaling with respect to the Froude number and modeling the physical parameters involved in heat radiation. Analyzing fire development towards flashover in small-scale experiments can yield valuable results that are applicable for practical demonstrations at fire stations and similar settings. Since the scale has previously been studied successfully [16], it is interesting in the current study to investigate the viability of using a scale. Compartments measuring in height and in length, with an open door of in height and in width, offer a scale that is cost-effective, easy to manage, and the optimal size for practical demonstrations.
Determining the time to flashover is critical for fire safety [17,18,19,20]. Therefore, the goal of the present study was to understand the correlation between the moisture content of wooden buildings and potential fire hazards. Experimental and simulation work on a scale model of a full-sized ISO room was undertaken to investigate the influence of enclosure walls’ FMC on the time to flashover (TTF). The experiments were conducted with the FMC ranging from 6.5% to 16%, which is quite representative of the variations through the year in Norwegian climate areas. Data on the mass loss rate, recorded compartment temperatures, and observations were collected to evaluate the fire development and determine the time to flashover (TTF). Based on these results, the effect of the fuel moisture content (FMC) of enclosure boundaries on time to flashover (TTF) has been quantified. As expected, the experiments demonstrated that moisture content significantly influences the time to flashover. The impact of the FMC on the fire development was greater in the pre-flashover period, but also influenced the post-flashover fire.
This paper is structured as follows: In Section 2, we describe the experimental setup utilized in this study. Subsequently, in Section 3, we present the results obtained by experiments. In Section 4, we conduct numerical simulation work and present the numerical results. Finally, we outline our conclusions in Section 5.
2. Experimental Design and Procedure
We performed experiments in the 1/8-scale model of a full-size ISO 9705-1 room [21,22,23]. To construct the room, we used spruce panel boards. The dimensions of the 1/8 scaled down ISO 9705-1 room were × × . The door, placed in the middle, measured in width and in height. The standard ISO 9750-1 uses propane as an ignition source with a maximum heat release rate (HRR) of . To determine the HRR for the 1/8-scale model, we employed the Froude modeling [15]:
where is the HRR for the 1/8-scale model, is the HRR for the full scale, is the model dimension, and is the dimension for the full scale. From Equation (1), we found the HRR for the 1/8 scale model to be . The ISO 9705-1 standard recommends the use of propane fuel, but in our approach, we utilized methanol fuel as the ignition source. This choice was based on the distinctive clear blue flame produced by methanol fires, which enhances the visibility of wall and ceiling ignitions, making them easier to notice. Table 1 lists the properties of methanol.
To theoretically estimate the burner size for the 1/8-scale model, we used the equations [21]:
where is the combustion efficiency, is the surface area of the burner (=), is the mass loss rate per unit area, is the effective heat of combustion, is the asymptotic mass loss rate per unit area, is the empirical constant for the fuel, and D is the diameter of the burner. From Equation (2), we obtained . Thus, the equivalent size of the corresponding square burner for the 1/8-scale model is . In order to enhance the reliability of our theoretical estimates for the burner size, we conducted a series of experiments. To determine the appropriate burner size for the 1/8-scale model, a series of experiments were carried out using square burners of different sizes: , , and . These burners yielded heat release rates (HRRs) of , , and , respectively. Based on our observations from these experiments, it was found that the square burner produced an HRR closest to . To further confirm this observation, three additional experiments were conducted specifically with the square burner. The results of these experiments are presented in Table 2. The first column indicates the size of the burner in millimeters (mm). The second column provides the initial amount of methanol used in each test, measured in grams (g). The third column displays the duration it takes for the methanol to burn completely, presented in the format of minutes and seconds (min:s). The fourth column represents the mass loss rate, which indicates the rate at which the methanol is consumed, expressed in grams per second (g/s). Lastly, the fifth column presents the heat release rate (HRR), measured in kilowatts (kW). The HRR is calculated using the equation , where represents the mass loss rate, denotes the combustion efficiency, and signifies the heat of combustion. Based on these tests and the theoretical computation, we decided to use the square burner of size as an ignition source. Figure 1 is a picture of our burner.
To determine the equilibrium moisture content of the wood, we used the following equation [24]:
where T is the temperature in degree Celsius, h is the relative humidity percentage, EMC is the equilibrium moisture content percentage, and W, K, , and are the coefficients of an adsorption model. Experiments showed that the effective heat of combustion during the flaming period for dry Norwegian spruce is [25]. We determined the heat of combustion for the humid wood by the equation [25]:
where EMC is the equilibrium moisture content in percent. To calculate the heat release rate, we used
where, is the mass loss rate of fuel (1/8 scaled down ISO-9705 room), is the complete heat of combustion, and is the combustion efficiency.
Our experimental setup, illustrated in Figure 2, involved the strategic placement of 14 thermocouples to monitor the gas temperatures. Among these thermocouples, nine were positioned along the center line of the room, while an additional four were placed at different heights along the door opening. Table 3 provides a detailed overview of the thermocouple numbering and their respective distances above the floor. Thermocouple number 14 was placed above the burner. Thermocouple number 14 was placed from the corner and above the floor. This configuration allowed us to accurately capture temperature data throughout the experimental space and analyze the temperature distribution within the room. The burner was placed in the left back corner of the room (see Figure 2).
To measure the mass loss rate of the room during burning, the 1/8-scaled room was placed on top of a KERN DS 30k0.1l balance [26]. The balance was directly linked to a computer, enabling continuous mass recording at five-second intervals. Between the balance and the room, we placed a -thick fire-resistant plate for heat protection. In our study, we conducted a series of nine experiments using different wall fuel moisture contents: , , , , , , , , and . In the next section, we present and discuss the experimental results.
3. Experimental Results and Discussion
The experimental results are presented in Figure 3, Figure 4 and Figure 5. Figure 3 shows the temperature over the burner for each fuel moisture content. We observed that the average temperature recorded was approximately . To compare the experimental results with the Heskestad equations, assuming no radiative heat loss for methanol fires, we utilized the equations and , where , , , and . Substituting these values, we obtained , which closely aligns with the experimental results. This comparison between the experimental data and the Heskestad calculation method demonstrated the close agreement between the two approaches in predicting the temperature at a specific height above the fuel surface.
Figure 4 illustrates the temperatures measured at the center of the room using thermocouples 9 and 8, which were positioned and below the ceiling, respectively. We observed that the smoke layer temperature was significantly influenced by the fuel moisture content (FMC) of the lining material of the room, indicating its impact on fire development. In Figure 4, we observe that, for an FMC ranging from % to %, it took approximately for the temperature to reach at a location below the ceiling. Similarly, for an FMC within the same range, it took around for the temperature to reach at a location below the ceiling. However, it is noteworthy that, for an FMC of %, even after , the temperatures at and below the ceiling did not reach . During experiments conducted in rooms with an FMC between % and %, an interesting observation was made. Initially, the fire exhibited growth towards flashover. However, at a certain point, the flames suddenly retreated and eventually extinguished. This phenomenon is represented as a distinct bump during the growth phase in Figure 4. One possible reason for this behavior could be the evaporation of water present in the humid rooms (FMC ≥ %), which contributed to cooling the smoke layer. These experimental findings demonstrated the influence of the FMC on the smoke layer temperature and highlight the dynamic nature of fire behavior in different fuel moisture conditions.
Figure 5 depicts the temperature variation at different heights along the centerline of the room for the nine experiments conducted. In Figure 5, we notice that the temperature at different heights depends on the FMC.
To determine time to flashover, we reviewed several flashover criteria. Flashover criteria offer a practical means to assess flashover conditions in compartment fires. Babrauskas [27] formulated a simple combustion model in an attempt to identify the minimum heat release rate necessary for flashover. He integrated this model with a flashover criterion based on a temperature increase of , alongside the empirical data obtained from experiments. Babrauskas deduced the minimum heat release rate to produce flashover [27]:
where is the estimated heat release rate in kW, A is the door area in , and h is the door height in m. The factor is usually referred to as the “ventilation factor”. Through two-zone computer simulations, Hagglund [28] and Babrauskas [27,29] derived the following heat release rate criterion for flashover:
Thomas [30] developed a flashover correlation by simplifying an energy balance equation for a compartment fire. This correlation comprises two terms. The first term accounts for the heat loss to the total internal surface area of the compartment, while the second term represents the energy flow out of the door. The flashover correlation is expressed as
McCaffrey, Quintiere, and Harkleroad [31] developed a method for calculating the hot gas layer temperature through a combination of theoretical analysis and experimental work. The method is described by the following equation:
where represents the effective heat conduction coefficient for the room boundaries, denotes the total interior surface area, is the heat release rate (HRR), represents the area of the door, and h is the height of the door. Considering the flashover criterion of the upper layer temperature equal to above the ambient temperature (), we obtain the energy release rate necessary to cause flashover:
Figure 6 reports the HRR as a function of time for different fuel moisture content (FMC). From Equations (6)–(8) and (10), the minimum HRR required for flashover were , , , and , respectively. For comparing the experimental results, we used the average of these values. The average minimum HRR required for flashover was , i.e., . Figure 6 illustrates the relationship between the heat release rate (HRR) and time to flashover for different fuel moisture content (FMC). The HRR values were calculated using Equation (5), assuming a combustion efficiency of 0.7, and the dotted horizontal line in Figure 6 represents the average HRR required for flashover. The plot clearly demonstrates that the HRR was influenced by the moisture content of the wooden compartment boundaries. Increasing the FMC led to a longer time to reach flashover. Specifically, for FMC values of 6.4% and 6.5%, the time to flashover was approximately . For FMC values of 6.7%, 11.3%, and 11.9%, the time to flashover increased to around . Similarly, for FMC values of 14.4% and 14.5%, the time to flashover extended to approximately . In the case of an FMC equal to 11.4%, the time to flashover was approximately . Notably, the room with an FMC of 16% did not exhibit flashover even after . The relationship between the FMC and the time to flashover is clearly demonstrated in Figure 6, where an increase in the FMC corresponds to a longer time to reach flashover. It is worth mentioning that the HRR for an FMC equal to 11.4% stood out as an outlier. Overall, the experimental data suggested a clear trend: as the FMC increased from 6.4%, 6.5%, 6.7%, 11.3%, 11.9%, 14.5%, 14.4%, 11.4%, to 16%, the time to flashover progressively increased. However, it is important to note that the experimental data for an FMC equal to 11.4% may be an outlier. Such outliers are not uncommon in fire research since fire is a very complex phenomenon, where many factors influence the results [32]. This can be related to factors such as variations in the wooden boards used for constructing the 1/8-scale rooms and nuts in the wood.
4. Numerical Results and Discussion
For simulating fire in the ISO room, we used the Fire Dynamics Simulator (FDS), which is a popular and validated tool for simulating fires. FDS employs Large Eddy Simulation (LES) together with the Deardorff turbulence model to resolve turbulence. FDS is an implicitly filtered, second-order accurate LES code. This means that the ratio of the filter width to the grid spacing is one and that the code is accurate to second order in space and time. In LES, large scales of fluid motions are simulated while the small scales are either ignored or modeled. FDS uses a combustion model based on the mixing-limited, infinitely fast reaction of lumped species (Eddy Dissipation Concept of Magnussen and Hjertager) [33]. To reduce the computation cost of transport processes, FDS lumps the species together into groups. To account for radiation, FDS solves a radiative transport equation through the finite-volume method [33]. FDS uses the low Mach (the speed of typical fire applications is less than ) formulations of the conservation equations [33]:
where is the density, is the mass fraction of the gaseous species , is the combustion heat release rate per unit volume, represents the radiation and conduction heat fluxes, is the rate of formation per unit volume of the species , is the diffusion coefficient of the species , is the tension tensor for the Newtonian fluids, represents kinetic energy dissipation, and h is the sensible enthalpy of the fluid, which is a function of the specific heat and temperature of the fluid. Combustion and radiation are introduced into the governing equations via the source terms , and [33]. Equation (11) constitutes a set of partial differential equations for the density (or component mass fractions), velocity, pressure, and sensible enthalpy of the fluid. The momentum equation is three equations for the three components of velocity. So, there are five equations and six unknowns. The system is closed via the equation of state.
The following pyrolysis reaction schemes were employed in the present study:
Thus, wet wood pyrolyzes to dry wood and water vapor, while dry wood pyrolyzes to form volatiles and char. The solid phase model assumes that volatiles and evaporated moisture are transported to the surface instantaneously. This is a simplification of reality, but it allows for the mathematical model to be solved more easily. For a detailed description of the underlying mathematical models of pyrolysis, please refer to the literature [34]. The Arrhenius equation has been used to successfully predict the rates of wood pyrolysis and water evaporation in a variety of studies [35]. The reaction rates of wood pyrolysis and water evaporation are determined by the following equation [34,35]:
where the term r defines the rate of reaction at the temperature , is the mass concentration of the component , is the density of the solid material mixture, is the reaction order and is 1 by default, is the pre-exponential factor, is the activation energy, R is the universal gas constant, and is the solid temperature at the depth x. The pre-exponential factor, A, and the activation energy, E, are parameters that are specific to each reaction. The kinetic constants A and E are not available for most real materials and are typically determined through experiments such as thermogravimetric analysis (TGA). FDS can employ the reference temperature parameter to calculate the effective values for A and E [35]. The reference temperature is the temperature at which the mass fraction of the material decreases at its maximum rate within the context of a TGA or similar experimental apparatus. In our simulation, we specified the reference temperature for the pyrolysis of dry wood. We specified A and E for the evaporation of water from the wet wood. In our case, 85% of the mass of dry wood was converted to gaseous fuel, while the remaining 15% was converted to solid char. Char does not decompose further. See the Table 4 for the properties of the materials used in the FDS simulation.
To calculate the solid phase temperature , FDS [34,35,36] solves the following one-dimensional transient heat conduction equation in the solid phase:
where is the specific heat capacity of the solid phase material mixture, t is the time, and is the thermal conductivity of the solid material. The source term is the energy required by endothermic reaction. In FDS, we define the wet wood surface as a combination of the materials dry wood and moisture. For example, Table 5 presents a wet wood surface with 15% fuel moisture content.
The purpose of the FDS simulations was to examine the influence of wooden fuel moisture content on the time to flashover. Figure 7 presents the results of nine FDS simulations, each with a different fuel moisture content of the wall linings (5%, 6%, 7%, 8%, 9%, 10%, 11%, 14%, and 16%). The simulation results (Figure 7) clearly demonstrated that the time to flashover depends on the fuel moisture content of the wood lining within the compartment. The simulation results showed that, as the fuel moisture content increased, the time to flashover also increased, which is consistent with the experimental investigation.
Specifically, the time to flashover ranged from approximately for a fuel moisture content of 5% to around for a fuel moisture content of 14%. The time to flashover increased linearly with the FMC. This was consistent with the experimental findings. The increase in time to flashover with increasing fuel moisture content was because the moisture content of the wood lining acted as a heat sink, absorbing heat from the fire. This slowed down the rate of combustion, which, in turn, delayed the onset of flashover.
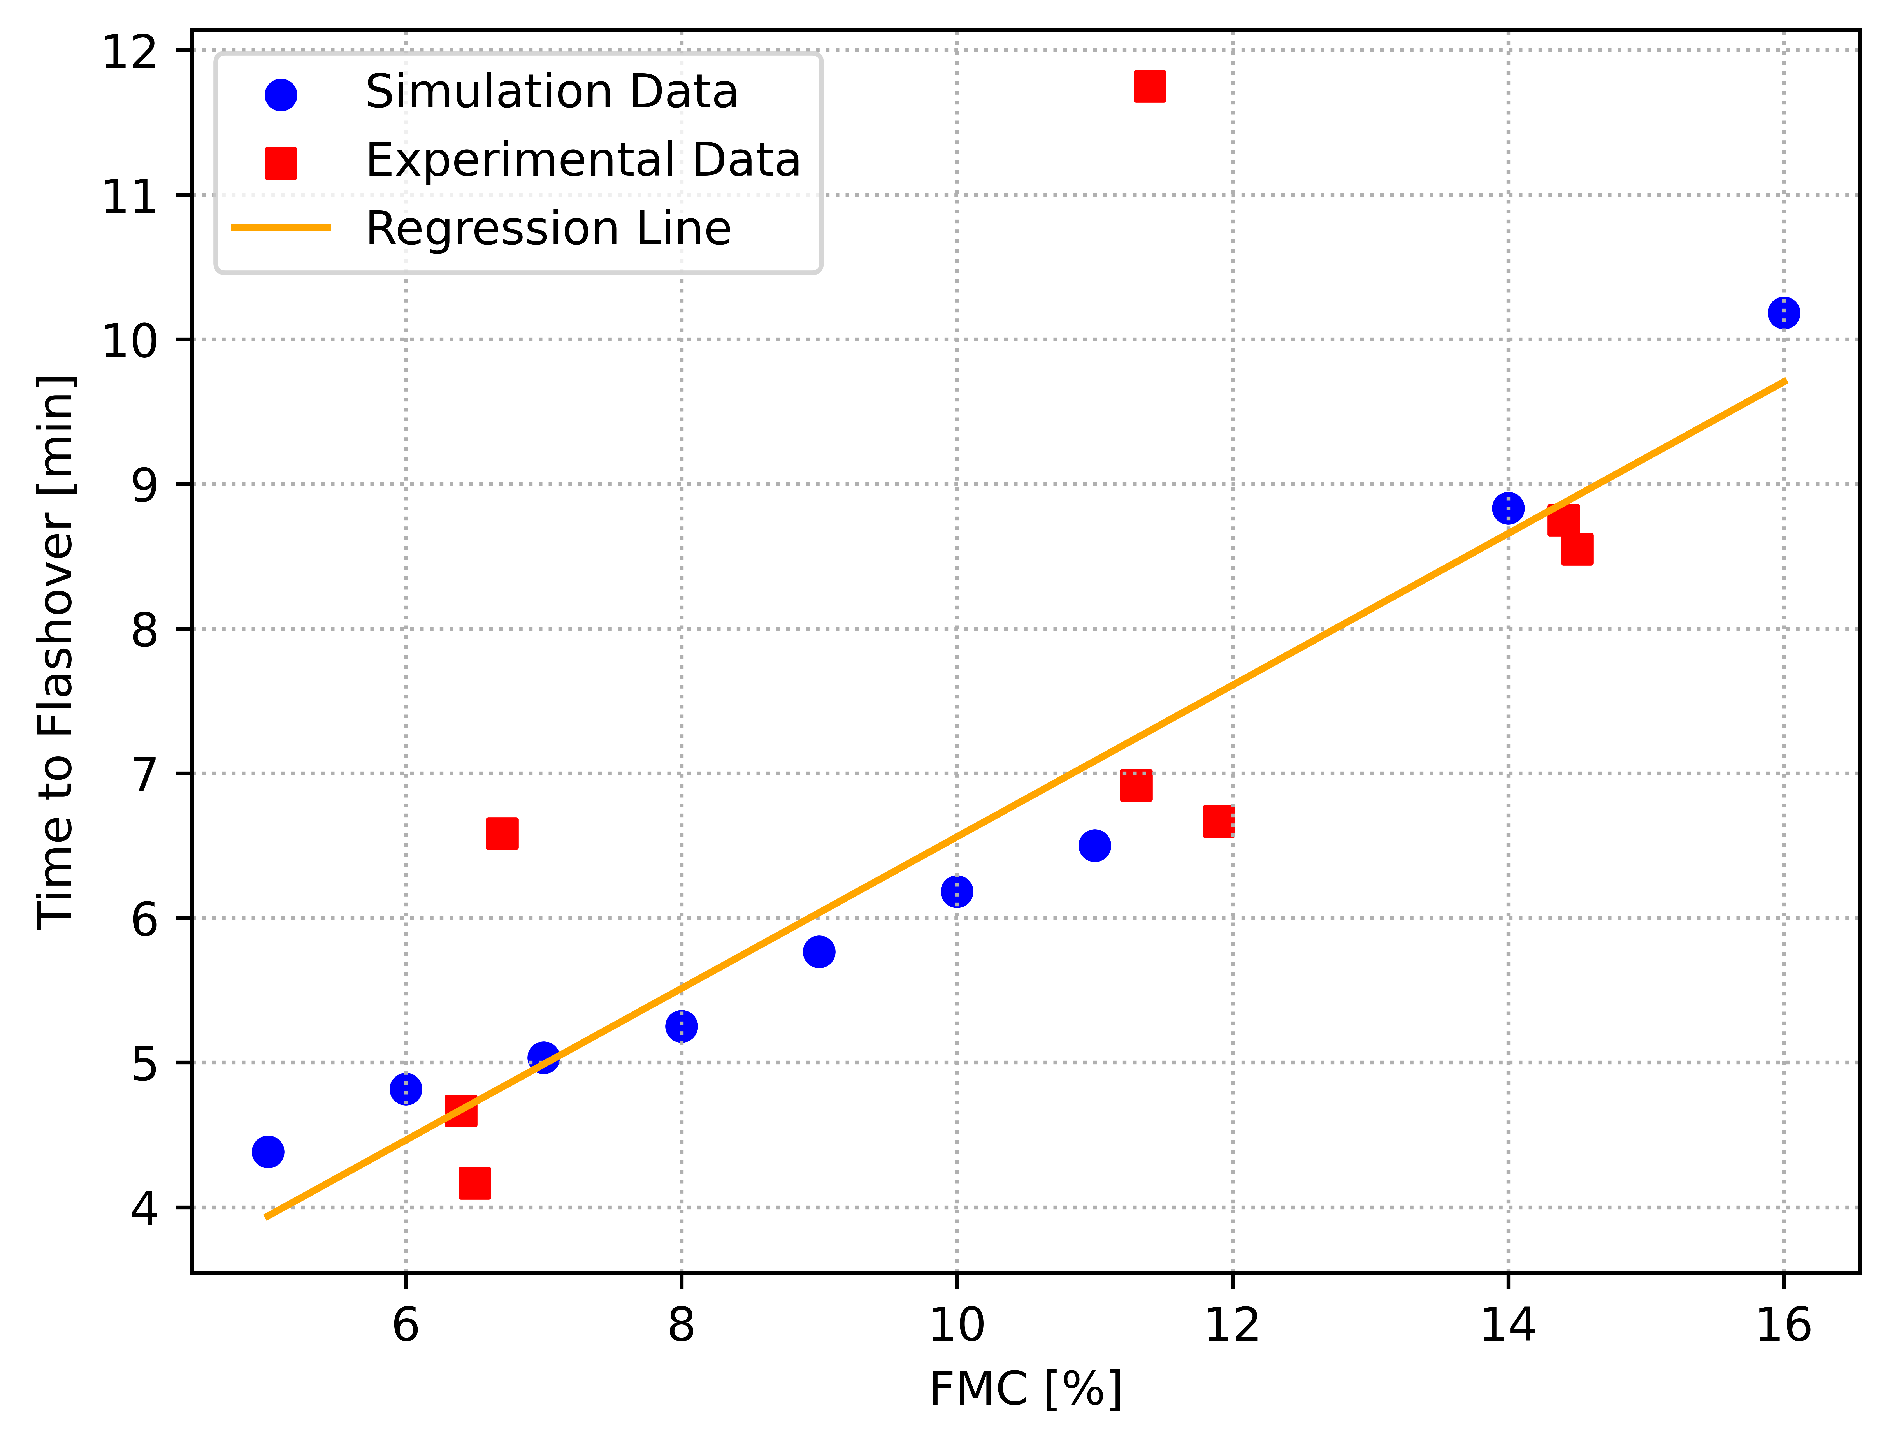
Figure 8 reports the experimental and simulation results for the time to flashover under different fuel moisture content. The experimental and simulation results showed a linear relationship between the time to flashover and the fuel moisture content. The simulation results agreed well with the experimental data, with a correlation coefficient of 0.915. This suggested that the FDS fire simulator can be used to predict the time to flashover for different fuel moisture contents. The experimental results showed that the time to flashover increased from to as the fuel moisture content increased from 6.5% to 11.4%, while the simulation results showed an increase from to over the same range of fuel moisture content. The good agreement between the experimental and simulation results suggested that the pyrolysis model of FDS is reasonably accurate in capturing the influence of the FMC on the TTF. Equation (16) is a linear regression model to calculate the time to flashover for a given fuel moisture content.
The model (16) can be used to make better predictions of fire behavior in materials with known fuel moisture content. By understanding the relationship between fuel moisture content and time to flashover, fire safety engineers can design buildings and materials that are less likely to ignite and spread flames. The data obtained from these experiments and simulations can be used as a guide for designing buildings and materials that are more fire-resistant and can support efficient fire-fighting strategies.
The linear relationship between the time to flashover and the fuel moisture content indicates that the fuel moisture content is a significant factor in determining the fire development rate. A higher fuel moisture content will result in a longer time to flashover, which can give firefighters more time to extinguish the fire. This information can be used to improve fire safety by helping firefighters make better decisions about how to fight fires. Firefighters can employ this information to identify areas where the fire is most likely to spread.
Many researchers have also conducted small-scale testing of materials. The primary objective of these studies is to analyze the materials to predict their behavior in full-scale fires. Some of these studies utilize larger-scale simulation models than the actual tests. For example, the study [37] examined the fire behavior of cable trays through full-scale numerical simulations while employing small-scale experimental data. Similar approaches have proven valuable in fire investigations, as seen in [38]. However, when conducting a comparative analysis of thermal insulation on a small scale versus a large scale, certain phenomena like the melting of XPS and the generation of ignition sources could not be replicated using Fire Dynamics Simulator (FDS) as per the study [39]. This suggests that many studies, when comparing small and large scales, encounter issues that cannot be fully modeled. This was also evident in the present study. When examining the 1/8-scale room with 11.4% fuel moisture content, an initial increase in fire spread was observed, which then declined before the fire developed towards flashover. However, despite these peculiarities, small-scale testing offers numerous advantages. These include easier handling of materials, reduced overall cost of fire testing, and others.
5. Conclusions
In this study, we conducted a series of nine experiments using a 1/8-scale ISO-9705 room model to systematically assess the impact of fuel moisture content on time to flashover. Our empirical investigations demonstrated a linear proportional relationship between fuel moisture content and the time to flashover. Complementing these experiments, we conducted nine FDS simulations to quantify the effect of fuel moisture content on the time to flashover. The simulation results displayed a similar linear correlation between fuel moisture content and time to flashover. The experimental and simulations results showed that the time to flashover increased linearly with the fuel moisture content for the FMC range studied. This showed that FMC is a significant factor in determining the fire dynamics of wooden compartments. From these results, we formulated a predictive linear regression model to estimate flashover time based on fuel moisture content. This model can be used by fire safety professionals and firefighters to make decisions about fire safety in buildings with different FMCs. Given the critical importance of time to flashover in fire safety assessment, these results hold the potential to significantly improve decision-making for fire safety professionals and emergency responders.
Author Contributions
Conceptualization, T.L. and S.K.K.; methodology, A.K.; software, S.K.K. and T.L.; validation, S.K.K., T.L. and A.K.; formal analysis, S.K.K.; investigation, T.L. and S.K.K.; resources, T.L. and S.K.K.; data curation, T.L. and A.K.; writing—original draft preparation, S.K.K.; writing—review and editing, T.L. and S.K.K.; visualization, T.L. and S.K.K.; supervision, S.K.K. and T.L.; project administration, T.L.; funding acquisition, T.L. All authors have read and agreed to the published version of the manuscript.
Funding
The present work was supported by the Norwegian Research Council, grant No. 298993 (DYNAMIC) and grant No. 301569 (BUILDER).
Institutional Review Board Statement
Not applicable.
Informed Consent Statement
Not applicable.
Data Availability Statement
The data presented in this article are accessible by making a direct request to the authors.
Acknowledgments
We express our gratitude to Magne Laumark-Møller Vabø for his invaluable assistance in setting up and conducting the experimental work. His contributions have greatly contributed to the success of this research.
Conflicts of Interest
The authors declare no conflict of interest.
References
- Mock, C.; Peck, M.; Juillard, C.; Meddings, D.; Gielen, A.; McKenzie, L. Burn Prevention: Success Stories and Lessons Learned; World Health Organization: Geneva, Switzerland, 2011. [Google Scholar]
- Brushlinsky, N.; Sokolov, S.; Wagner, P.; Messerschmidt, B. World Fire Statistics, Report 27; CTIF (Comité Technique International de Prevention et d’Extinction de Feu): Paris, France, 2022. [Google Scholar]
- Log, T. Indoor relative humidity as a fire risk indicator. Build. Environ. 2017, 111, 238–248. [Google Scholar] [CrossRef]
- Log, T. Cold climate fire risk; A case study of the Lærdalsøyri Fire, January 2014. Fire Technol. 2016, 52, 1825–1843. [Google Scholar] [CrossRef]
- Losnegård, G. Norske Ulykker og Katastrofar (Norwegian Accidents and Disasters); Skald: Leikanger, Norway, 2013. [Google Scholar]
- Himoto, K.; Shinohara, M.; Sekizawa, A.; Takanashi, K.I.; Saiki, H. A field experiment on fire spread within a group of model houses. Fire Saf. J. 2018, 96, 105–114. [Google Scholar] [CrossRef]
- Pirsko, A.R.; Fons, W.L. Frequency of Urban Building Fires as Related to Daily Weather Conditions; Interim Technical Report AFSWP-866; Division of Fire Research, Forest Service, U.S. Department of Agriculture: Washington, DC, USA, 1956.
- Log, T.; Vandvik, V.; Velle, L.G.; Metallinou, M.M. Reducing Wooden Structure and Wildland-Urban Interface Fire Disaster Risk through Dynamic Risk Assessment and Management. Appl. Syst. Innov. 2020, 3, 16. [Google Scholar] [CrossRef]
- Stokkenes, S.; Strand, R.; Kristensen, L.; Log, T. Validation of a Predictive Fire Risk Indication Model using Cloud-based Weather Data Services. Procedia Comput. Sci. 2021, 184, 186–193. [Google Scholar] [CrossRef]
- Strand, R.D.; Log, T. A Cold Climate Wooden Home and Conflagration Danger Index: Justification and Practicability for Norwegian Conditions. Fire 2023, 6, 377. [Google Scholar] [CrossRef]
- Kristoffersen, M.; Log, T. Experience gained from 15 years of fire protection plans for Nordic wooden towns in Norway. Saf. Sci. 2022, 146, 105535. [Google Scholar] [CrossRef]
- Challands, N. The relationships between fire service response time and fire outcomes. Fire Technol. 2010, 46, 665–676. [Google Scholar] [CrossRef]
- Metallinou, M.M.; Log, T. Cold Climate Structural Fire Danger Rating System? Challenges 2018, 9, 12. [Google Scholar] [CrossRef]
- Drysdale, D. An Introduction to Fire Dynamics; John Wiley & Sons: Hoboken, NJ, USA, 2011. [Google Scholar]
- Khattri, S.; Log, T.; Kraaijeveld, A. A novel representation of the critical ventilation velocity for mitigating tunnel fires. Tunn. Undergr. Space Technol. 2021, 112, 103853. [Google Scholar] [CrossRef]
- Kraaijeveld, A.; Gunnarshaug, A.; Schei, B.; Log, T. Burning Rate and Time to Flashover in Wooden ¼ scale Compartments as a Function of Fuel Moisture Content. In Proceedings of the 8th International Fire Science & Engineering Conference, Windsor, UK, 4–6 July 2016. [Google Scholar]
- Mozaffari, M.H.; Li, Y.; Ko, Y. Real-time detection and forecast of flashovers by the visual room fire features using deep convolutional neural networks. J. Build. Eng. 2023, 64, 105674. [Google Scholar] [CrossRef]
- Caton, S.E.; Hakes, R.S.; Gorham, D.J.; Zhou, A.; Gollner, M.J. Review of pathways for building fire spread in the wildland urban interface part I: Exposure conditions. Fire Technol. 2017, 53, 429–473. [Google Scholar] [CrossRef]
- Cicione, A.; Walls, R.S.; Kahanji, C. Experimental study of fire spread between multiple full scale informal settlement dwellings. Fire Saf. J. 2019, 105, 19–27. [Google Scholar] [CrossRef]
- Moradi, A. A Physics-Based Model for Fire Spreading in Low Cost Housing in South African; Stellenbosch University: Stellenbosch, South Africa, 2016. [Google Scholar]
- Hurley, M.J.; Gottuk, D.T.; Hall, J.R., Jr.; Harada, K.; Kuligowski, E.D.; Puchovsky, M.; Torero, J.; Watts, J.M., Jr.; Wieczorek, C.J. SFPE Handbook of Fire Protection Engineering; Springer: Berlin/Heidelberg, Germany, 2015. [Google Scholar]
- Lock, A.; Bundy, M.; Johnsson, E.L.; Hamins, A.; Ko, G.H.; Hwang, C.; Fuss, P.; Harris, R. Experimental study of the effects of fuel type, fuel distribution, and vent size on full-scale underventilated compartment fires in an ISO 9705 room. NIST Tech. Note 2008, 1603, 53–54. [Google Scholar]
- Vabø, M.M. Analysis of Wood Fuel Moisture Content on Enclosure Fire through Small Scale Experiments. Master’s Thesis, Western Norway University of Applied Sciences, Haugesund, Norway, 2021. [Google Scholar]
- Simpson, W.T. Equilibrium Moisture Content of Wood in Outdoor Locations in the United States and Worldwide; Technical Report; U.S. Department of Agriculture: Washington, DC, USA, 1998. [CrossRef]
- Aniszewska, M.; Gendek, A. Comparison of heat of combustion and calorific value of the cones and wood of selected forest trees species. For. Res. Pap. 2014, 75. [Google Scholar] [CrossRef]
- KERN; SOHN. Platform Scales. 2023. Available online: https://www.kern-sohn.com/shop/en/industrial-scales/platform-scales/ (accessed on 10 March 2023).
- Babrauskas, V.; Peacock, R.D.; Reneke, P.A. Defining flashover for fire hazard calculations: Part II. Fire Saf. J. 2003, 38, 613–622. [Google Scholar] [CrossRef]
- Hägglund, B. Estimating flashover potential in residential rooms. FOA Rapp. C 1980, 202369, A3. [Google Scholar]
- Babrauskas, V. Estimating room flashover potential. Fire Technol. 1980, 16, 94–103. [Google Scholar] [CrossRef]
- Thomas, P.H. Testing products and materials for their contribution to flashover in rooms. Fire Mater. 1981, 5, 103–111. [Google Scholar] [CrossRef]
- McCaffrey, B.; Quintiere, J.; Harkleroad, M. Estimating room temperatures and the likelihood of flashover using fire test data correlations. Fire Technol. 1981, 17, 98–119. [Google Scholar] [CrossRef]
- Melcher, T.; Zinke, R.; Trott, M.; Krause, U. Experimental investigations on the repeatability of real scale fire tests. Fire Saf. J. 2016, 82, 101–114. [Google Scholar] [CrossRef]
- McDermott, R.; McGrattan, K.; Hostikka, S. Fire dynamics simulator (version 5) technical reference guide. NIST Spec. Publ. 2008, 1018, 5. [Google Scholar]
- McGrattan, K.; Hostikka, S.; McDermott, R.; Floyd, J.; Weinschenk, C.; Overholt, K. Fire dynamics simulator technical reference guide volume 1: Mathematical model. NIST Spec. Publ. 2013, 1018, 175. [Google Scholar]
- Rinta-Paavola, A.; Hostikka, S. A model for the pyrolysis of two Nordic structural timbers. Fire Mater. 2022, 46, 55–68. [Google Scholar] [CrossRef]
- Wang, X. Fire Dynamics Simulator (FDS) Pyrolysis Model Analysis of Heavy Goods Vehicle Fires in Road Tunnels. Ph.D Thesis, University of Canterbury, Christchurch, New Zealand, 2017. [Google Scholar]
- Beji, T.; Merci, B. Numerical simulations of a full-scale cable tray fire using small-scale test data. Fire Mater. 2019, 43, 486–496. [Google Scholar] [CrossRef]
- Lannon, C.M.; Stoliarov, S.I.; Lord, J.M.; Leventon, I.T. A methodology for predicting and comparing the full-scale fire performance of similar materials based on small-scale testing. Fire Mater. 2018, 42, 710–724. [Google Scholar] [CrossRef]
- Suh, H.W.; Im, S.M.; Park, T.H.; Kim, H.J.; Kim, H.S.; Choi, H.K.; Chung, J.H.; Bae, S.C. Fire spread of thermal insulation materials in the ceiling of piloti-type structure: Comparison of numerical simulation and experimental fire tests using small-and real-scale models. Sustainability 2019, 11, 3389. [Google Scholar] [CrossRef]
Figure 1.
Burner for the 1/8-scale ISO room.

Figure 2.
Experimental setup.
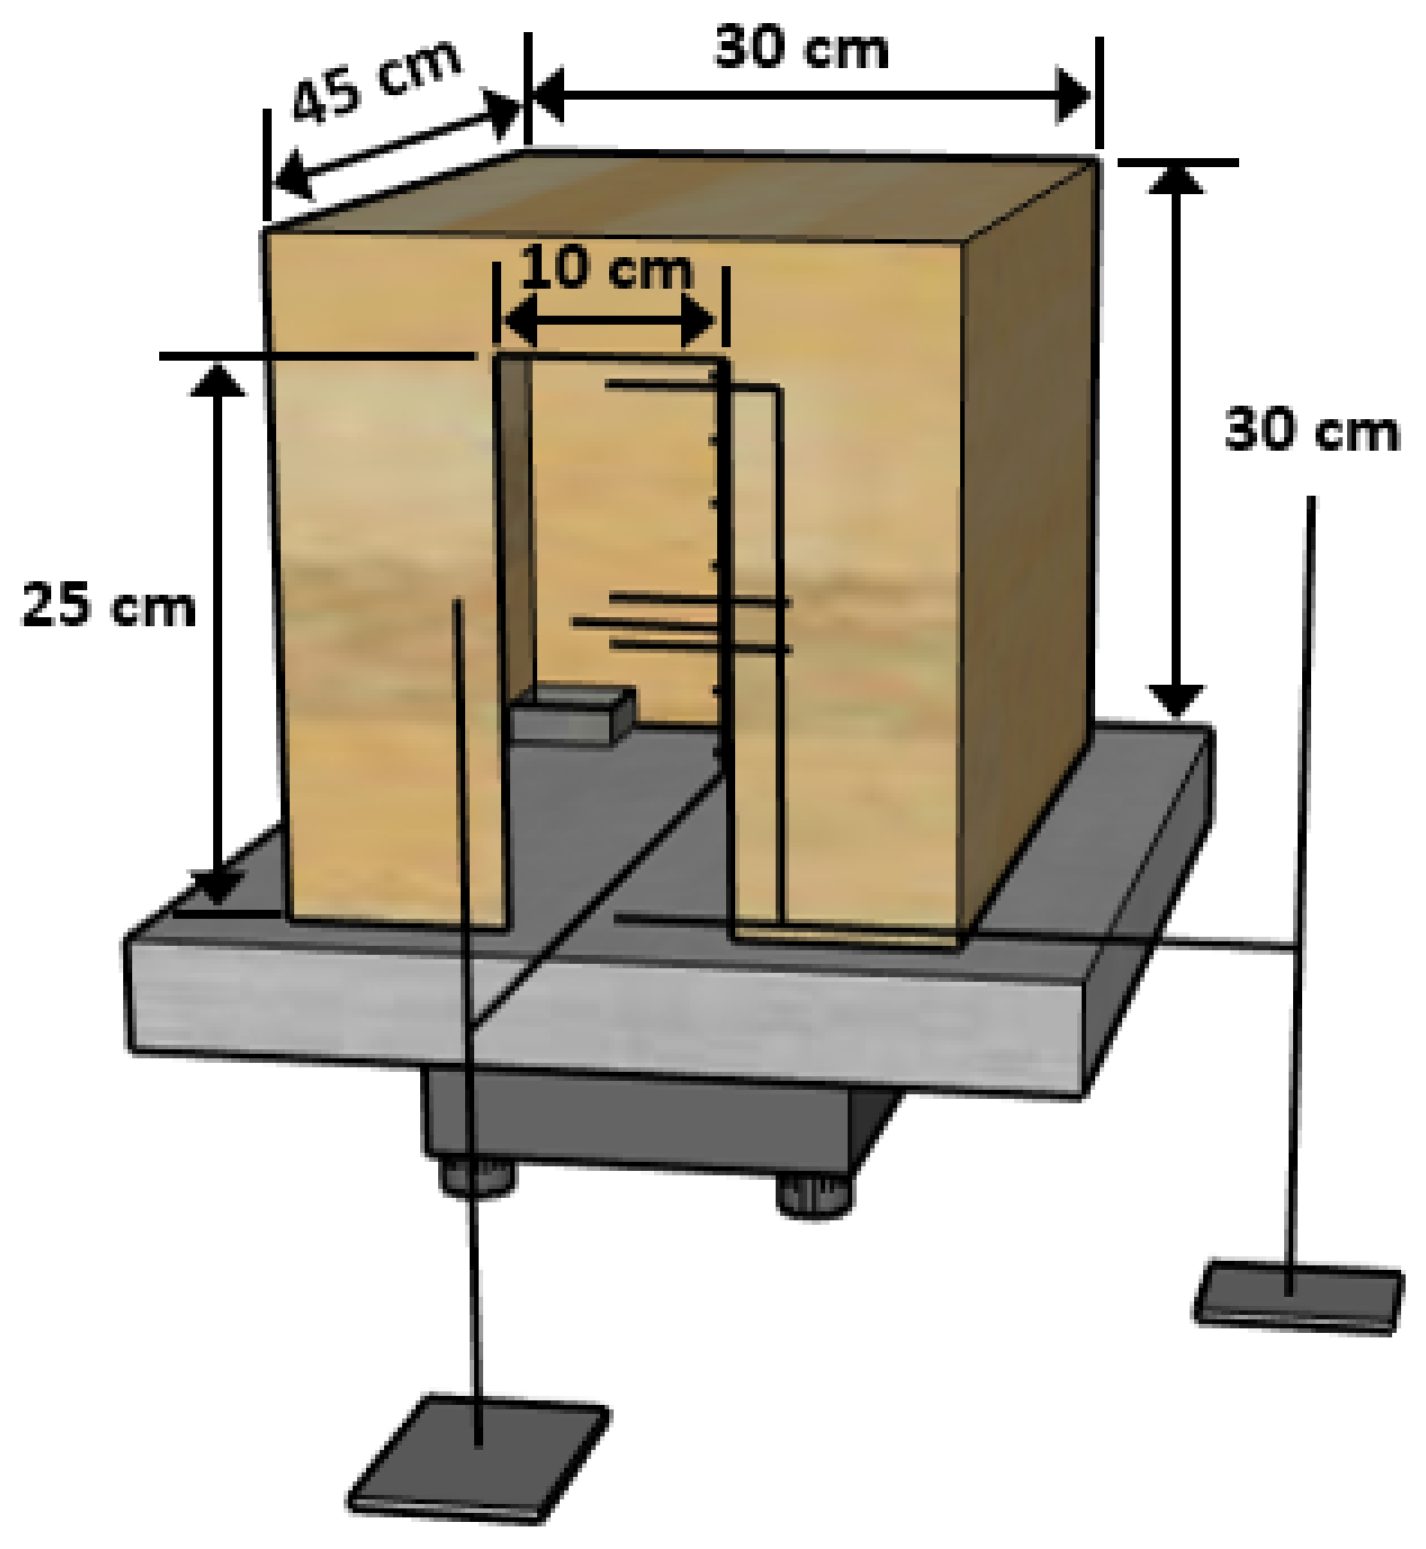
Figure 3.
Temperature above the burner for different fuel moisture content.
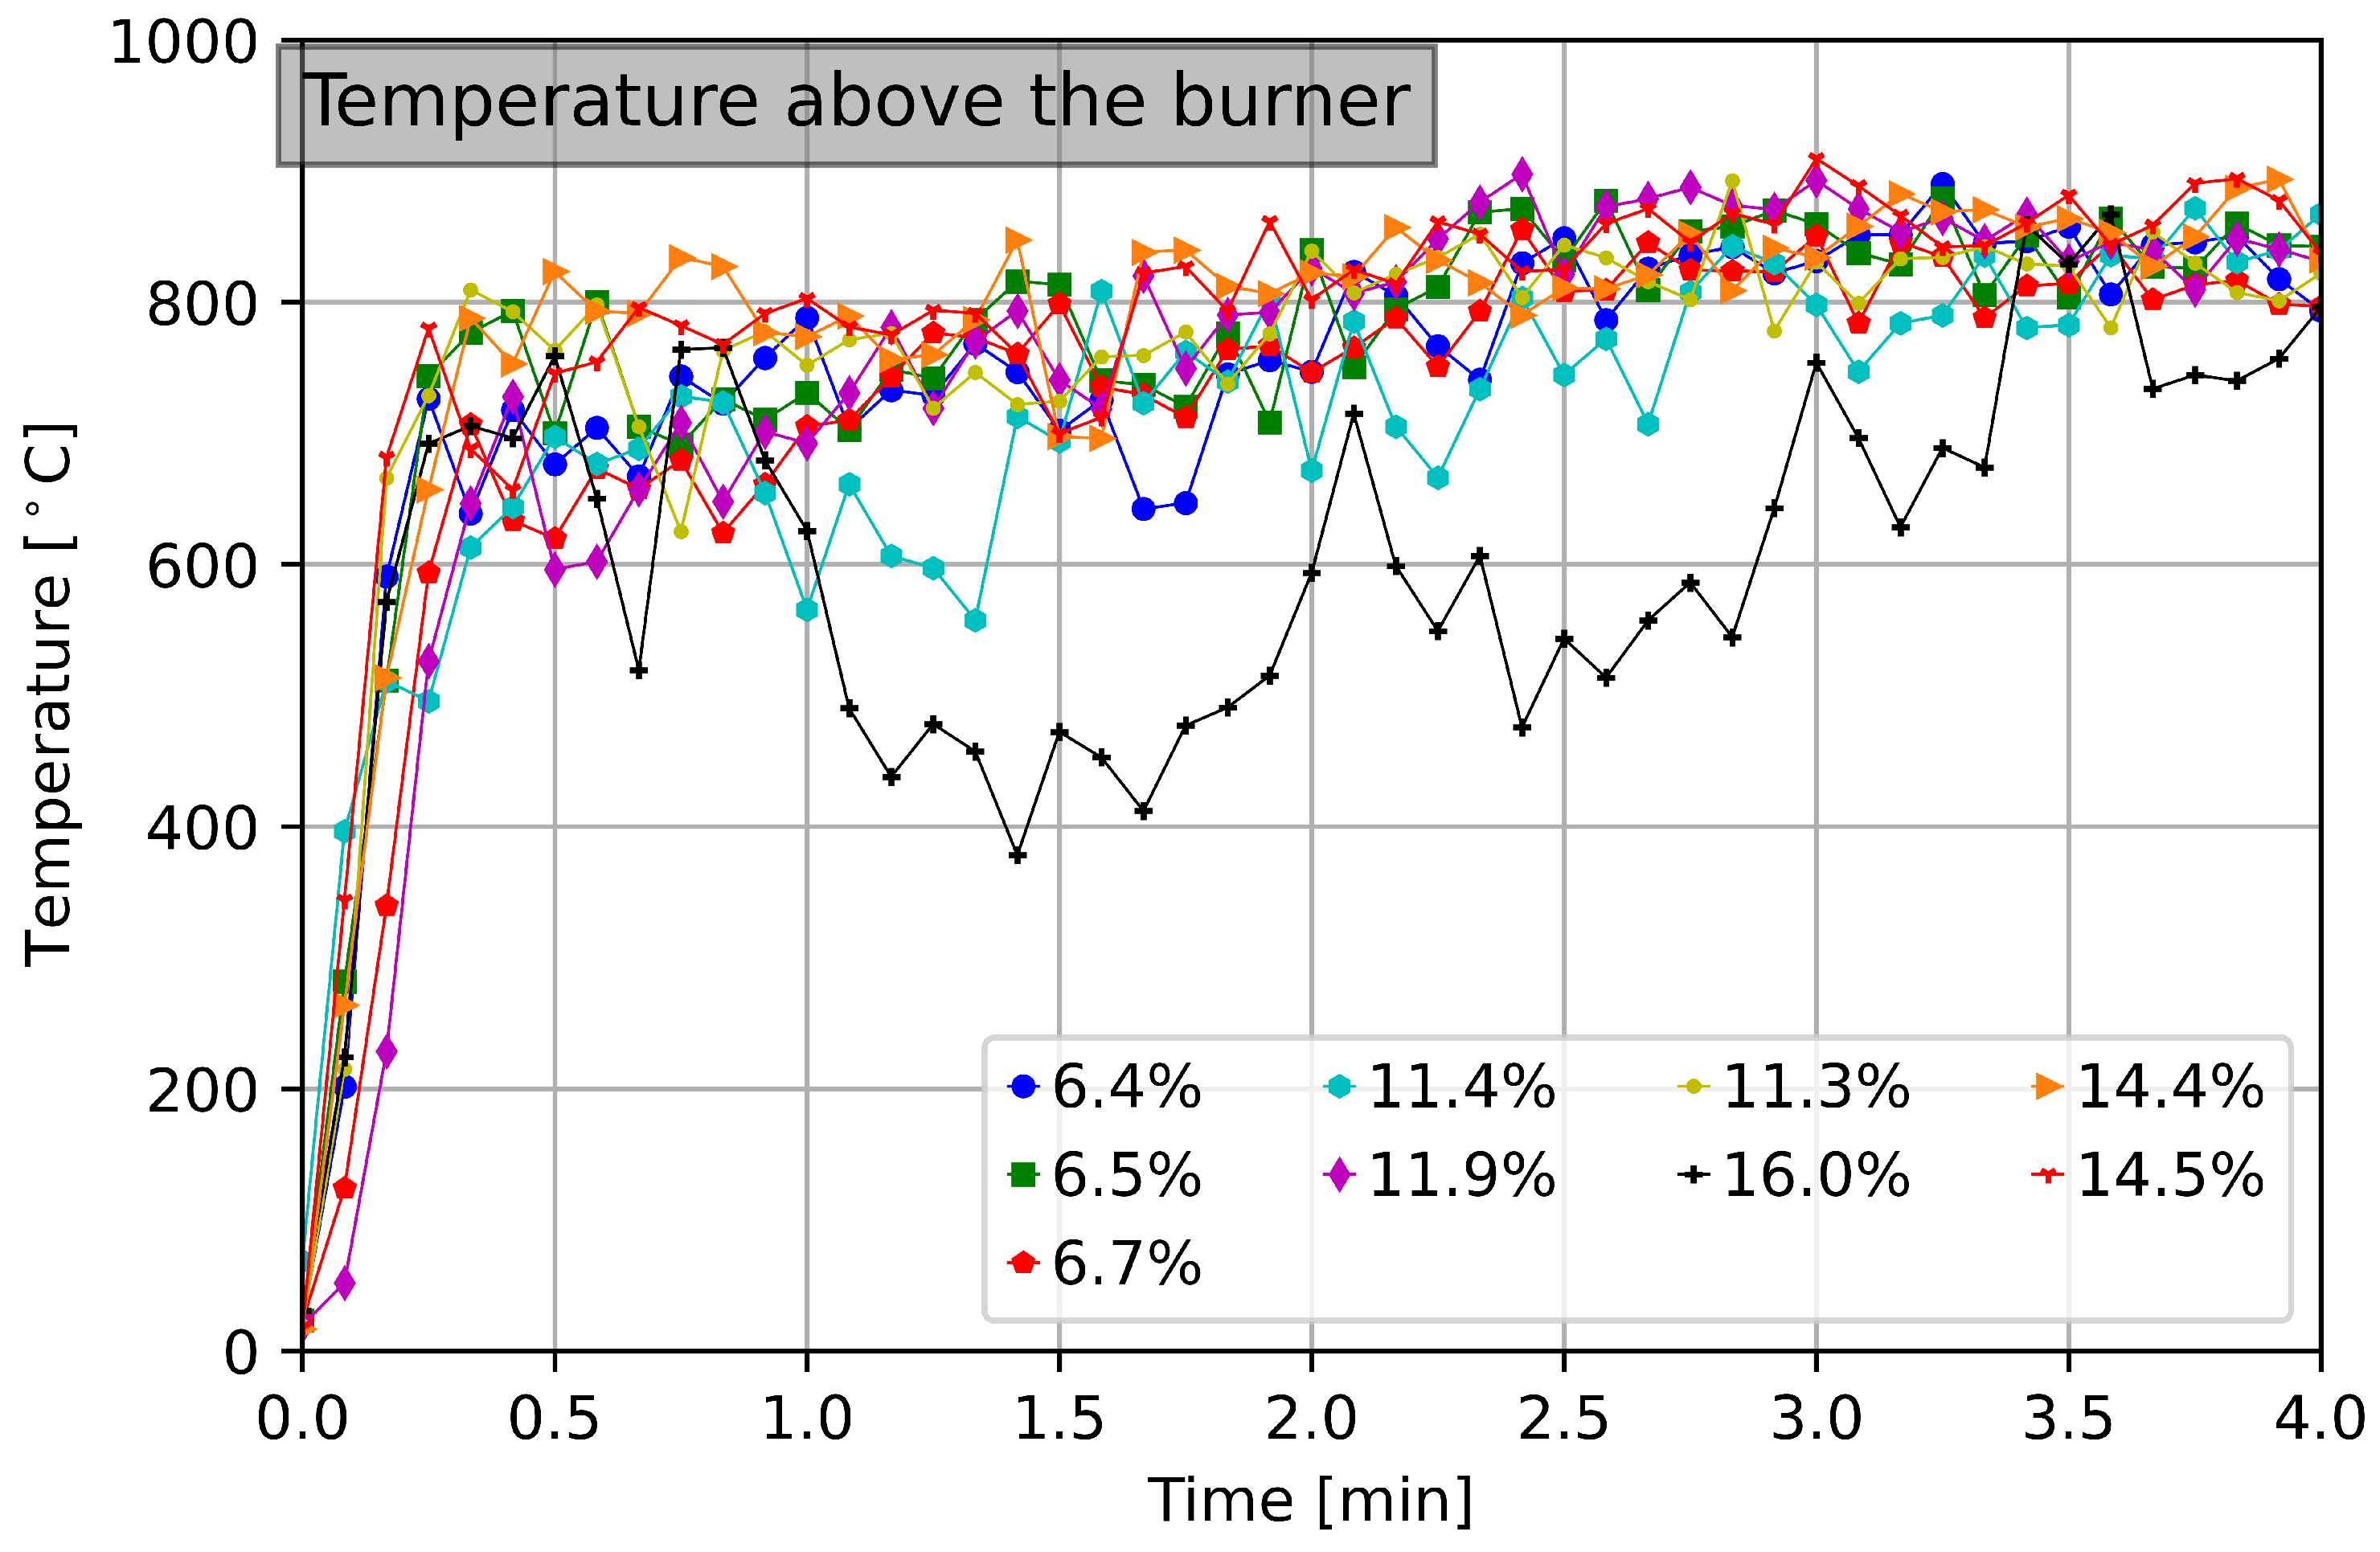
Figure 4.
Smoke layer temperature. Temperature development at the center of the room and from the ceiling under different FMC conditions.
Figure 4.
Smoke layer temperature. Temperature development at the center of the room and from the ceiling under different FMC conditions.

Figure 5.
Temperature development along the room centerline for different FMC.
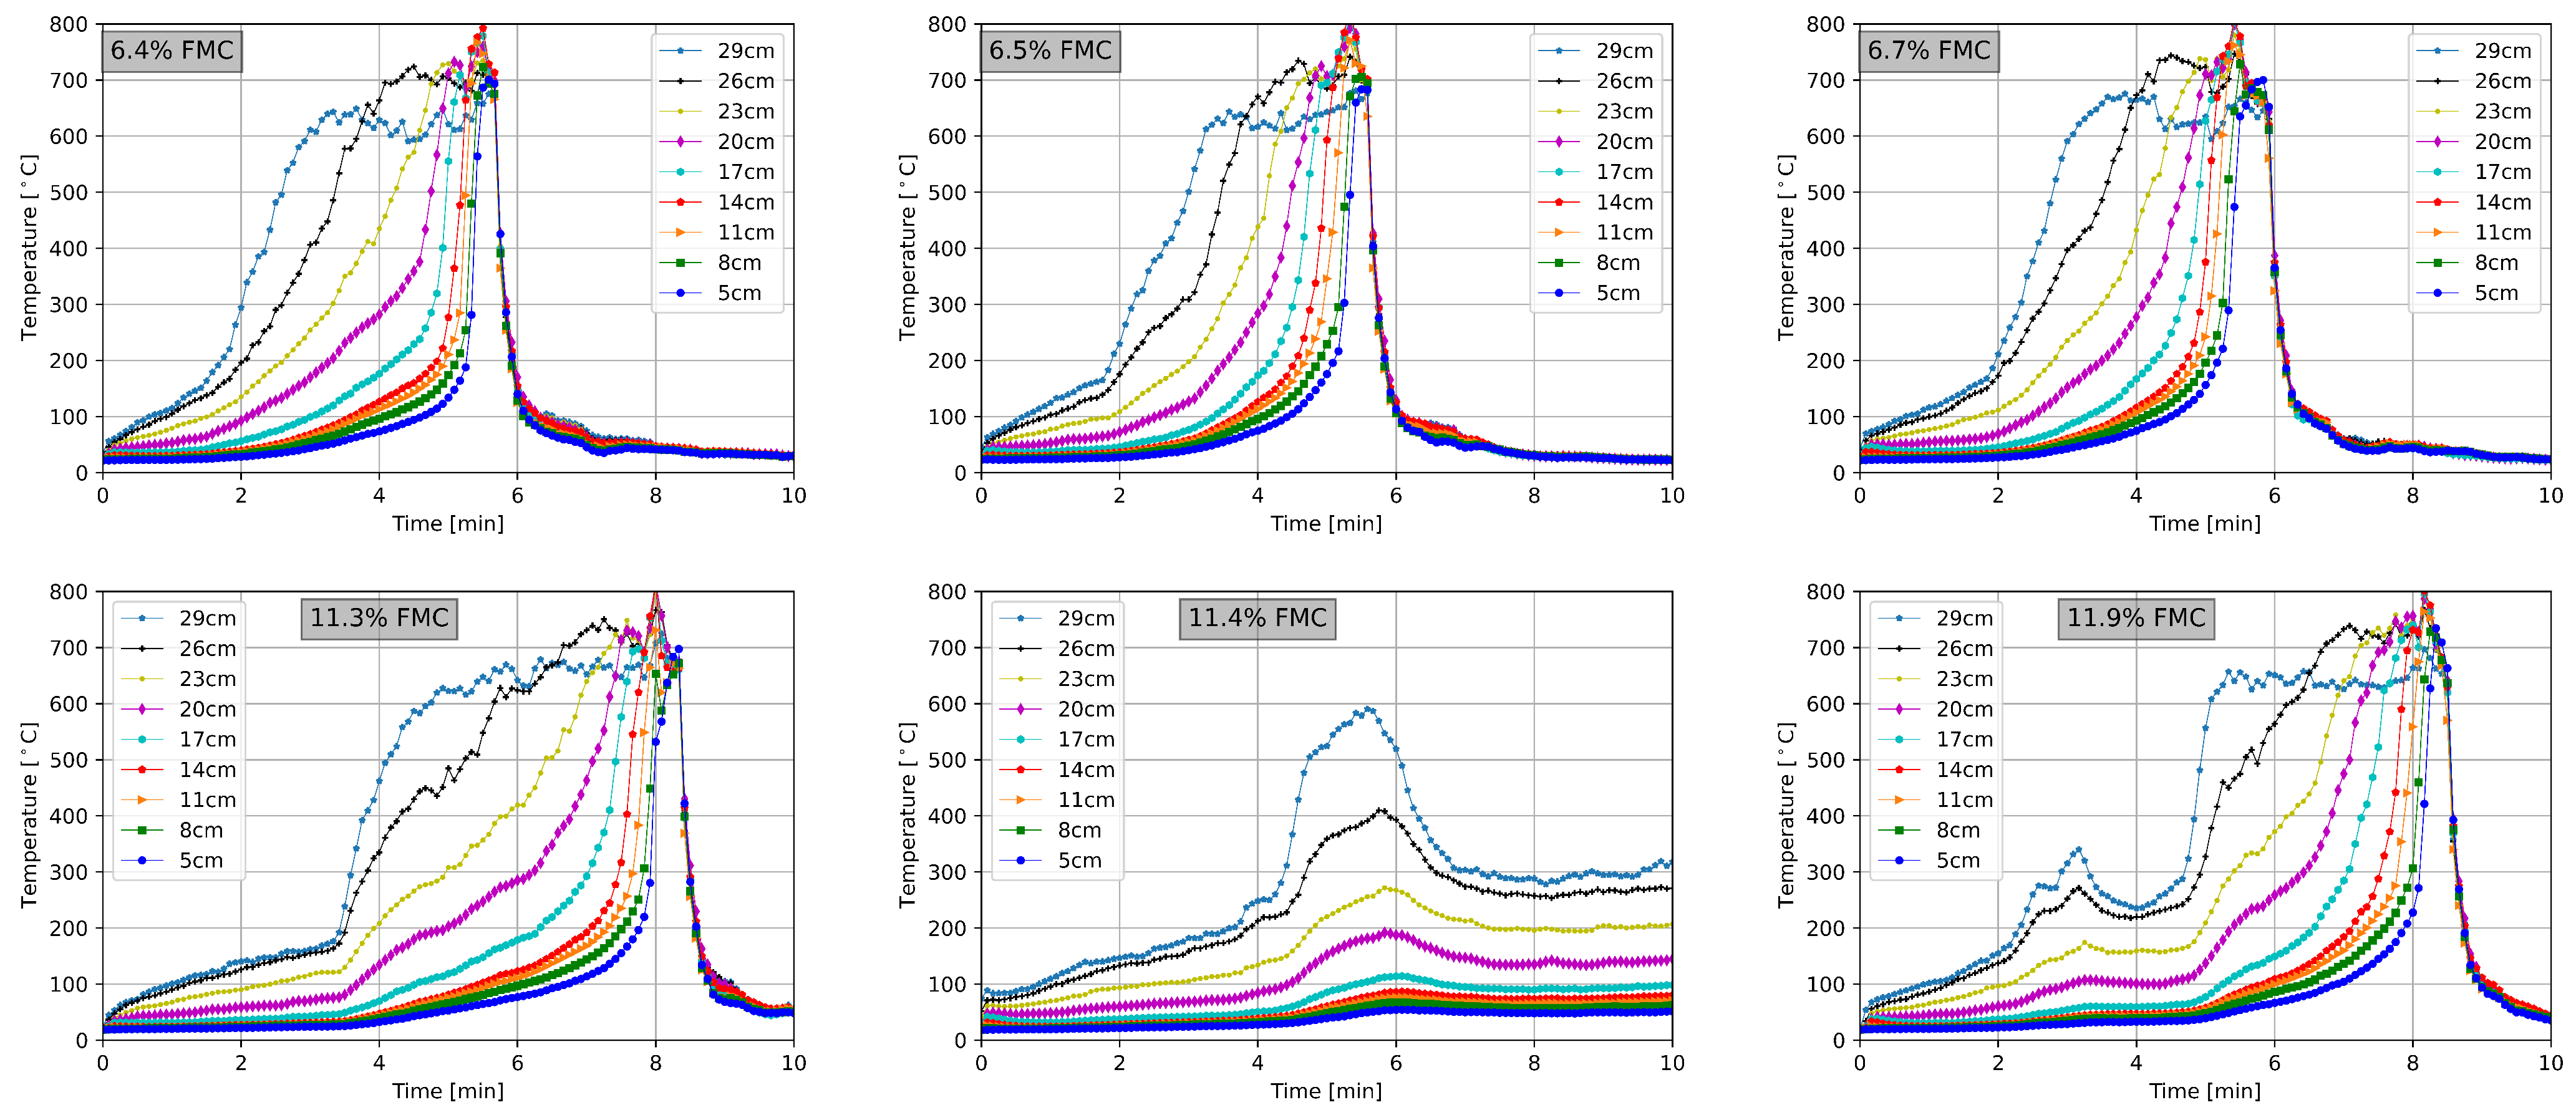

Figure 6.
Dependence of the HRR on the FMC.
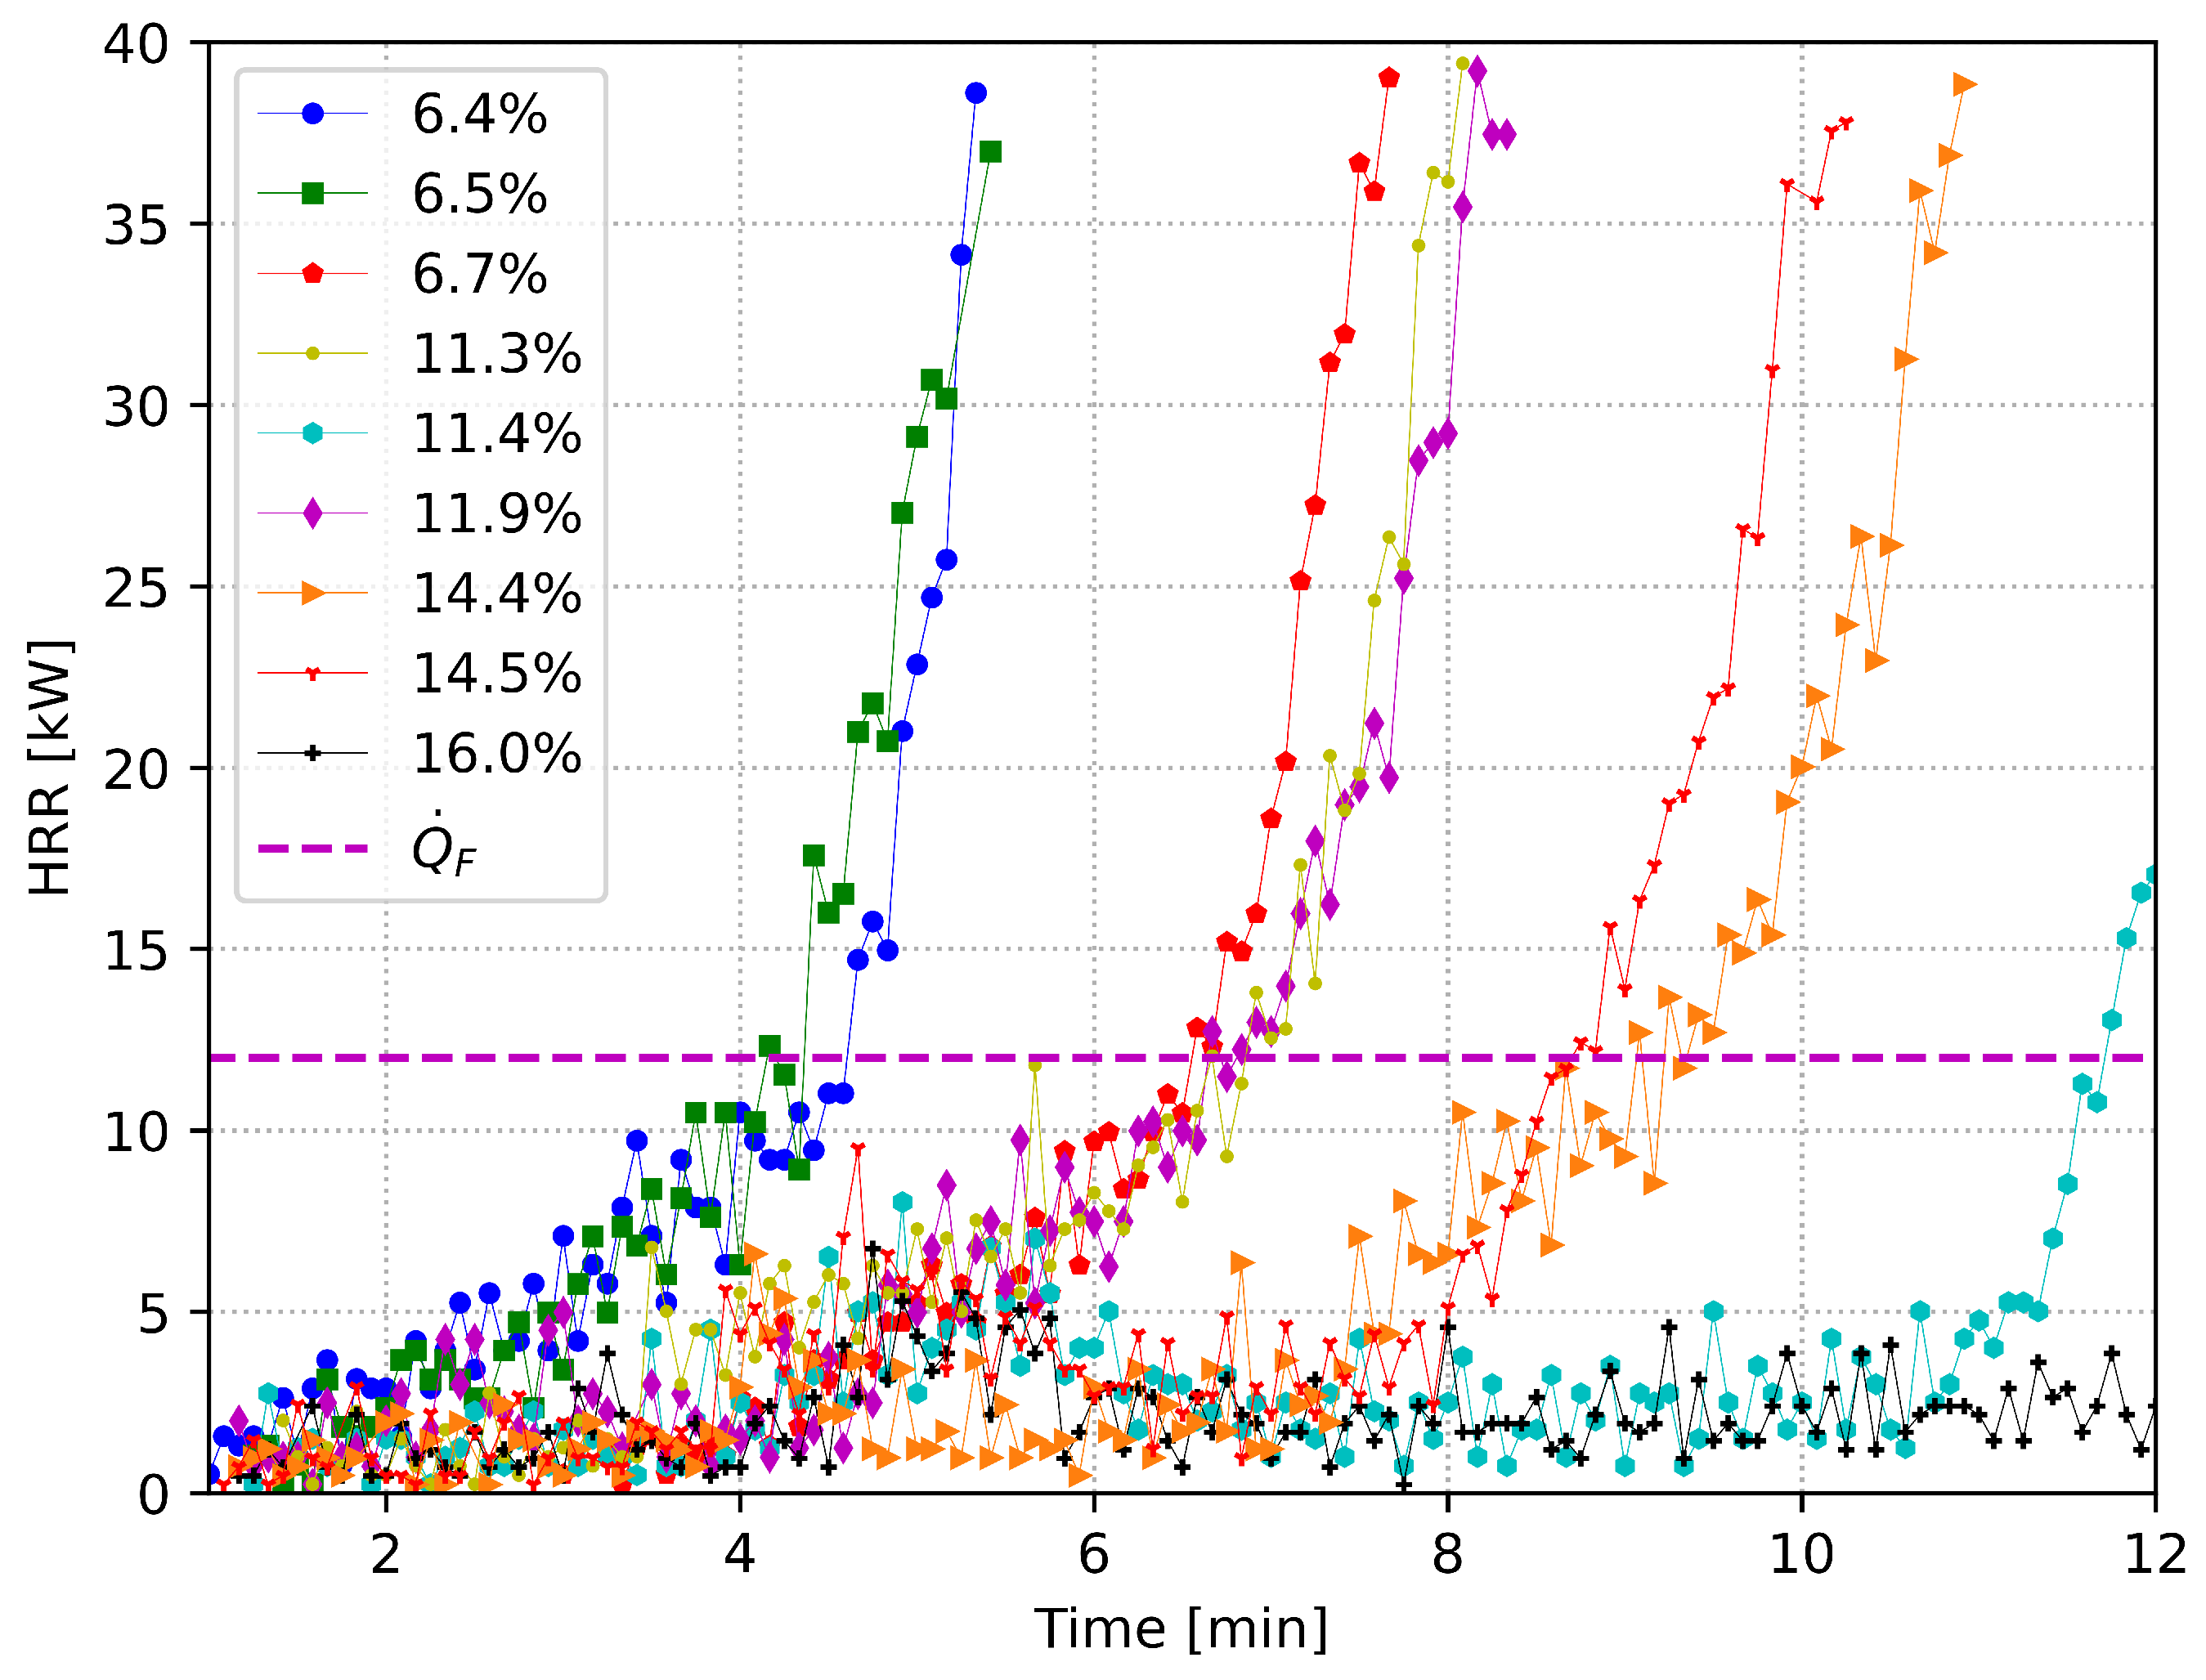
Figure 7.
Results of 9 fire simulations with different wall lining moisture content.
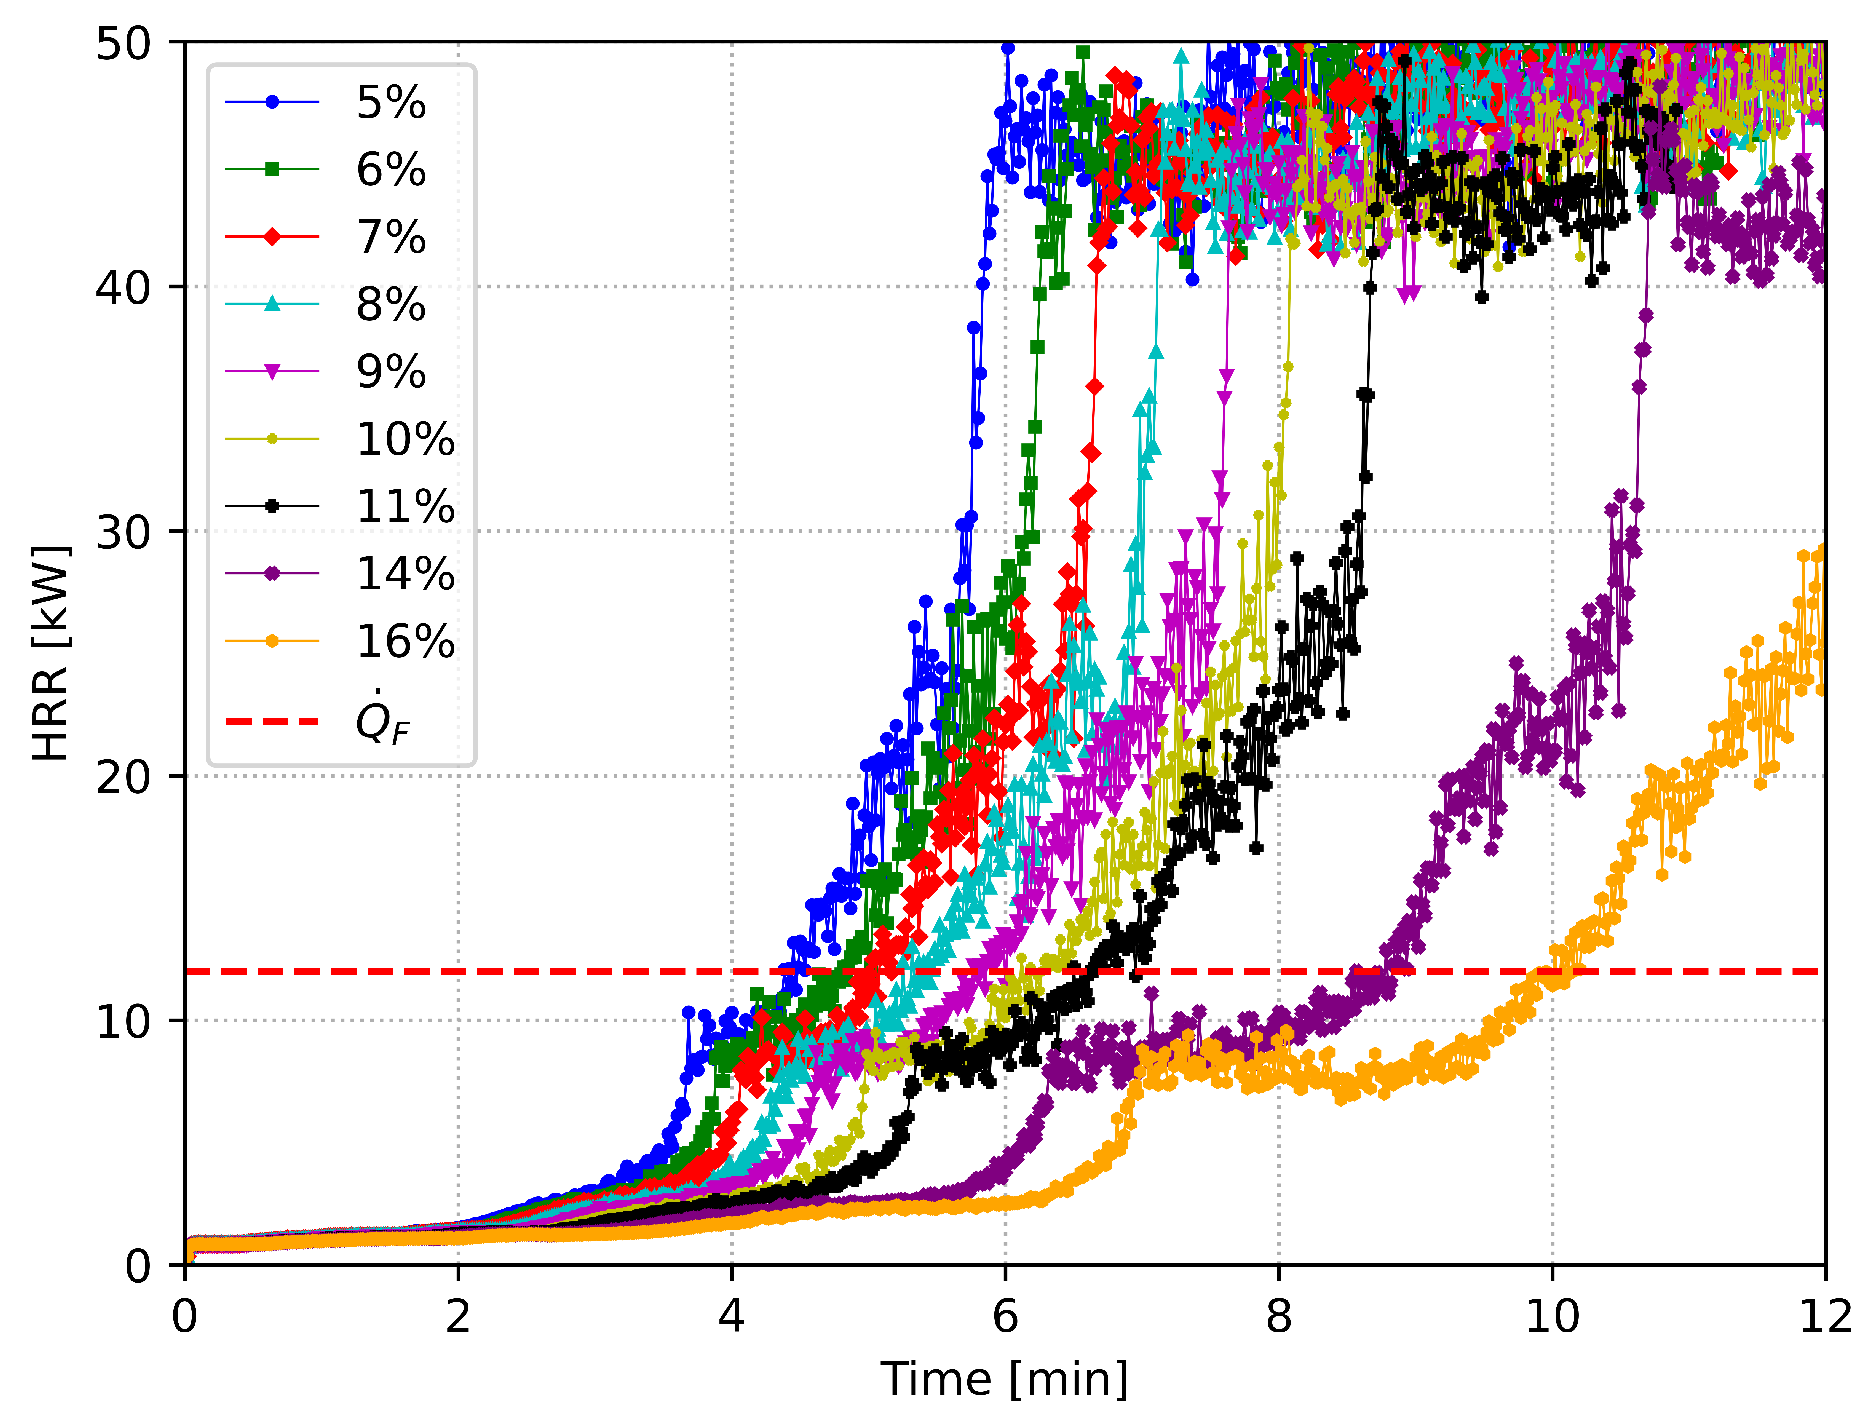
Figure 8.
Time to flashover at varying FMC from experiments and simulations.

Table 1.
Properties of methanol.
| Combustion Efficiency () | Heat of Combustion | Density | Asymptotic Burning Rate () | Empirical Constant () |
|---|---|---|---|---|
| 0.993 | 719 | 40 |
Table 2.
Experimental output of burner tests.
| Burner Size | Methanol | Time | Mass Loss Rate | HRR |
|---|---|---|---|---|
| (mm) | (g) | (min:s) | (g/s) | (kW) |
| 55 × 55 | 26.7 | 10:07 | 0.043 | 0.85 |
| 55 × 55 | 29 | 11:32 | 0.042 | 0.83 |
| 55 × 55 | 33 | 12:44 | 0.043 | 0.85 |
Table 3.
Location of the 13 thermocouples.
| Thermocouple (center of room) | 1 | 2 | 3 | 4 | 5 | 6 | 7 | 8 | 9 |
| Height from floor (cm) | 5 | 8 | 11 | 14 | 17 | 20 | 23 | 26 | 29 |
| Thermocouple (center of door) | 10 | 11 | 12 | 13 | |||||
| Height from the floor (cm) | 1 | 13 | 15 | 24 |
Table 4.
Properties of materials wood, char and moisture for the FDS simulations.
| MATL ID | Dry Wood | Char | Moisture |
|---|---|---|---|
| Specific heat | 2.85 | 1.6 | 4.148 |
| Conductivity | 0.14 | 0.09 | 0.6 |
| Density | 640.0 | 200.0 | 1000.0 |
| Heat of combustion | - | - | |
| N Reactions | 1 | - | 1 |
| Heat of reaction | 300.0 | - | 2200.0 |
| NU MATL (1,1) | - | 0.15 | - |
| SPEC ID (1,1) | “REAC_FUEL” | - | “WATER VAPOR” |
| NU SPEC (1,1) | 0.85 | - | 1.0 |
| Reference temperature | 300.0 | - | - |
| A | - | - | |
| E | - | - |
Table 5.
A wet wood surface with 15% FMC for the FDS simulations.
| SURF ID | “Wet Wood” |
| Backing | “VOID” |
| MATL ID (1, 1:2) | “Dry Wood”, “Moisture” |
| MATL MASS FRACTION (1, 1:2) | 0.85, 0.15 |
| Thickness (1) | 0.02 |
Disclaimer/Publisher’s Note: The statements, opinions and data contained in all publications are solely those of the individual author(s) and contributor(s) and not of MDPI and/or the editor(s). MDPI and/or the editor(s) disclaim responsibility for any injury to people or property resulting from any ideas, methods, instructions or products referred to in the content. |
© 2024 by the authors. Licensee MDPI, Basel, Switzerland. This article is an open access article distributed under the terms and conditions of the Creative Commons Attribution (CC BY) license (https://creativecommons.org/licenses/by/4.0/).
Share and Cite
MDPI and ACS Style
Khattri, S.K.; Log, T.; Kraaijeveld, A. Influence of Wooden Compartment’s Fuel Moisture Content on Time to Flashover: An Experimental and Numerical Study. Fire 2024, 7, 17. https://doi.org/10.3390/fire7010017
AMA Style
Khattri SK, Log T, Kraaijeveld A. Influence of Wooden Compartment’s Fuel Moisture Content on Time to Flashover: An Experimental and Numerical Study. Fire. 2024; 7(1):17. https://doi.org/10.3390/fire7010017
Chicago/Turabian StyleKhattri, Sanjay Kumar, Torgrim Log, and Arjen Kraaijeveld. 2024. "Influence of Wooden Compartment’s Fuel Moisture Content on Time to Flashover: An Experimental and Numerical Study" Fire 7, no. 1: 17. https://doi.org/10.3390/fire7010017