
Modelling and Numerical Simulation of a Compartment Fire: Flow Rate Behaviour at Opening
by
Ahmed El-kebir Iya
1,2,*,
Alban Fabrice Epée
1,2,
Philippe Onguéné Mvogo
3,
Justin Tégawendé Zaida
4 and
Ruben Mouangue
1,2,5 1
National Higher Polytechnic School of Douala, University of Douala, Douala P.O. Box 2701, Cameroon
2
Laboratory of Energy, Materials, Modelling and Methods, University of Douala, Douala P.O. Box 2701, Cameroon
3
School of Chemical Engineering and Mineral Industries, University of Ngaoundéré, Ngaoundéré P.O. Box 454, Cameroon
4
Institute of Industrial and Textile Engineering, Polytechnic School of Ouagadougou, Ouagadougou 18 P.O. Box 234, Burkina Faso
5
Group of Research in Combustion and Green Technology, University of Ngaoundéré, Ngaoundéré P.O. Box 454, Cameroon
*
Author to whom correspondence should be addressed.
Fire 2023, 6(5), 185; https://doi.org/10.3390/fire6050185
Submission received: 15 March 2023
/
Revised: 14 April 2023
/
Accepted: 21 April 2023
/
Published: 3 May 2023
(This article belongs to the Special Issue Compartment Fire and Safety)
Abstract
:The modelling of fire behaviour in a compartment is the subject of this work. A small-scale experimental study was carried out in a compartment sized 0.5 m × 0.5 m × 0.5 m with a single door with a width of 0.2 m and a height of 0.4 m. The collected results were converted to full-scale results using Froude modelling. The objective of this study was to see how ventilation affects fuel decomposition rate, gas flow rate at the opening and the power generated inside the compartment. This small-scale experimental study allowed us to determine four values of the fuel’s (diesel) mass loss rate, which correspond to four values of the ventilation factor. Numerical simulation using Fire Dynamics Simulator (FDS) software was used to show the gas’ behaviour at the opening and the variation of the power generated inside the compartment. The vertical profiles of the experimental and numerical temperatures were compared. It was found that the dimensions of the opening have a significant influence on the power generated inside the compartment.
1. Introduction
The understanding of the physical and chemical characteristics of fire and the advances made in the field of computer science have largely favoured the development of numerical tools allowing the numerical simulation of fire situations in confined, semi-enclosed or open environments. This was done in order to overcome the limitations encountered during the experimental phase, the main ones being the impossibility of modifying or varying certain experimental conditions and the inaccessibility of certain physical parameters. Although previously validated by experiments, the simulation not only offers many possibilities for fire case studies but also provides details on the propagation. However, numerical simulation is confronted with the problem of accurately representing the real phenomenon. The key point for the validation of fire models is the ability to measure the difference between model predictions and experimental data or between two model predictions or two experimental databases.
The main characteristic of fires in indoor environments (buildings) is their unpredictable nature due to the relative lack of air supply. Depending on the case, the fire can be self-extinguishing or evolve to a flashover when the conditions are right. The complexity of fire behaviour in a room has been the subject of important studies in the past. The ignition, growth and generalisation of the fire, as well as the movement of incoming fresh air and outgoing burnt gases and the behaviour of the structure, have been the main concerns of researchers.
This work has focused on small and large-scale compartment fires by highlighting the type of fuel, varying the diameter and location of the firebox, and the effect of the ventilation factor on the fire. Indeed, much work has shown that the size of the opening has a significant influence on fire propagation in a compartment [1,2,3]. Kawagoe [4] has shown that the height and width of the opening play an important role in the flow of incoming air and the flow of hot gases out of the burning compartment. This is expressed by:
where A and h represent the area and height of the opening, respectively, and the term is called the “ventilation factor”. It is again equal to:
when expressed as a function of the width (𝑊0) and the height (𝐻0) of the opening.
Prahl and Emmons [5] studied the airflow through a door in a burning room. The results established a relationship between the airflow () drawn by negative pressure towards the source of the fire (hearth) and the ventilation factor. This relationship was later improved by Zukoski et al. [6] (Equation(3)):
Rockett [7], on the other hand, was interested in the hot gases leaving the chamber through the opening. He was able to establish a relationship determining the flow rate of burnt gases out of the chamber.
where ) is the flue gas flow coefficient through the opening, ) is the neutral or discontinuity height of the compartment, () and () are the width and height of the opening, respectively. is the ratio of the temperatures of the incoming ambient air and the outgoing hot gases.
As for the theoretical power HRR (heat release rate) of the fire source calculated in this paper, it was obtained using the formula [8,9]:
where is the mass loss rate (pyrolysis rate), is combustion efficiency, it represents the more or less complete character of the combustion reaction. It is always less than one and generally between 0.7 and 0.9 [10] and is the heat of combustion of the fuel and is given here by [11]. The power released inside a compartment is obtained by the code as follows [12]:
is the power released per unit volume and v is the volume corresponding to the volume of the compartment. All of these investigations, conducted theoretically, experimentally, or numerically by writers, aimed to understand more about the processes governing compartment fires and creating certain phenomena, one of which is the flashover phenomenon. Each of these studies concluded that the probability of flashover during an unexpected fire is determined by a number of factors, including the fire load inside the compartment, the calorific value of the combustible, the size of the compartment, heat transfers, and the ventilation factor. In light of this previous research, the processes governing compartment fires are numerous, but the key determinant is ventilation level, which is determined by the size of the entrances.
Thus, it will be a question for us to verify if the behaviour of the numerical model chosen within the framework of this work is adequate with these expressions to evaluate the combustion model of the industrial calculation code Fire Dynamics Simulator (FDS) under this configuration and specially to reproduce these phenomena. For this, this paper will present the model and experimental protocol, details of the simulations, and highlight the influence of the ventilation factor on the gas and airflow rates, the power generated inside the compartment, and the measured temperatures. These results obtained with the FDS software are progressively compared with Onguéne et al’s [13] work on the numerical and experimental study of the behaviour of the flows at the opening with the ISIS software. Compared to this work, this new study will be able to show the power generated inside the compartment as a function of the ventilation factor. It can also be seen as a benchmark of the CFD (Computational Fluid Dynamics), FDS and ISIS tools.
2. Materials and Methods
2.1. Froude Modelling
To avoid the problems of costly repeatability of tests on a full-scale installation in fire safety research and the risks associated with it, Froude modelling has been exploited by the authors [14]. Froude modelling was used by the authors to conduct fire experiments using a small geometric model and extrapolate the results to full scale. The extrapolation of the results to the full scale is based on the equivalence relations established from the similarity laws. This can be carried out by relying on geometric similarity and assuming that the dynamic similarity holds if the Froude number is kept constant [15].
Equations (8) and (9) show the scaling relationships of the velocity 𝑉 and the heat release rate . 𝐿 represents the characteristic length of the domain and g the acceleration of gravity [16]:
2.2. CFD Code
The numerical simulations were performed using a CFD tool, the Fire Dynamic Simulator (FDS) version FDS 6.7.1., which is a finite volume field code for solving on a three-dimensional computational grid the fluid mechanics’ equations describing the motion of fluids at a low Mach number [17]. Turbulence is modelled using the Large Eddy Simulation (LES) technique. The FDS code has a mathematical model characterized by equations in the form of partial differential equations with simplifications and approximations [18]. The solution method consists of a finite difference approximation of the different equations and a procedure for updating the equations in time [12].
2.3. Experimental Configuration
The compartment configuration for our fire experiment were inspired by Onguéné et al’s [13] model. It was a compartment of internal dimensions 0.50 m × 0.50 m × 0.50 m, which included a single opening of dimensions 0.20 m × 0.40 m (W0 × H0) at the front (Figure 1). The walls and ceiling of the model were made of lightweight concrete with a thickness of 15 mm and a density and thermal conductivity of 800 kg/m3 and 0.20 W/mK, respectively. The burner was located in the centre of the compartment and was a square metal pan of 0.115 m on each side and 0.003 m in thickness. The surface of the burner was open and a mass of 0.065 kg of diesel with an average calorific value of 43.4 MJ/kg was introduced. The temperature of the hot gases inside the compartment was recorded using two eight-shaft and seven N-type thermocouples installed inside the domain and on the inside of the opening. The location of these sensors is shown in Table 1.
The Experimental Protocol
It consisted of lighting the fire source and then taking measurements until the fuel was completely burnt. A scale balance on which the fire source was placed provided information on the mass of the fuel during combustion. During the experiment, only the width of the door was changed. Four width values were used (0.20 m, 0.15 m, 0.10 m and 0.075 m) corresponding to four fire scenes to be simulated. Each fire experiment was repeated three times and only the average values were evaluated and interpreted.
2.4. Sensitivity of the Model Mesh
For simulation results that better approach real life situations, a sensitivity study of the grid size is necessary. It consists of calculating the same simulation several times by doubling the number of meshes until the output data converges. The more refined the mesh, the longer the simulation time. Thus, a compromise must be made between the accuracy of the mesh and the computing power of the machine. The cell size (dx) for a specific simulation may be connected to the typical fire diameter; the smaller the cell size, the more accurately the fluid and fire dynamics can be resolved. The following equation gives the typical fire diameter (D*) [17]:
where Q is HRR [W], is ambient density, is ambient temperature, and is the specific heat of ambient.
Bounagui [19] studied the effect of the mesh size on the simulation of the flame temperature of a 0.1 m2 propane burner (1500 kW) and compared this temperature with the theory. The results are presented in the Table 2 below:
It can be seen that for a 1500 kW flame, numerical convergence is observed for a mesh size less than or equal to 0.10 m.
Xin [20] evaluated the influence of mesh size and domain size on a 1 m2 methane burner flame. He showed that the sensitivity of the mesh size was particularly important around the burner surface and that the domain size is closely related to the flame height. Thus, from the dimensions of the enclosure, and with the characteristic fire diameter (D*) we were able to obtain the suggested cell sizes. Three cell sizes were obtained to test its influence on the results: large = 0.025 m, moderate = 0.020 m, and fine = 0.015 m.
Figure 2 shows the T2 thermocouple data that was plotted. Each T2 curve represents a mesh size. It can then be seen that numerical convergence is observed for mesh sizes smaller than 0.025 m. It was not considered appropriate to test even finer mesh sizes as the trade-off between computation time and accuracy was satisfactory. The results of the following simulations were all obtained with a mesh size of 0.020 m. Table 3 summarises the details of the simulation parameters.
3. Results and Discussion
3.1. Experimental Results and Interpretations
Influence of the Ventilation Factor on the Fuel Combustion Rate
The term represents the mass loss of fuel during a fire. Babrauskas [21] showed that it can be determined using the burning rate of the fuel:
The term expresses the burning time of the fuel, the diameter D of the fuel pan remains constant throughout the development of the fire. Thus, for a fixed volume of fuel 𝑊 placed in a pan of diameter D, the rate of fuel mass loss is calculated using the expression [22]:
The expressions et represent the density and surface area of the fuel pool, respectively. The following Table 4 gives the fuel mass loss rate values for each fire scene.
From Figure 3 which shows the variation of the mass loss rate as a function of the ventilation factor, it can be seen that the three curves have a similar shape and seem to describe an identical phenomenon. By varying the ventilation factor, one can observe the phenomenon of switching from a ventilation-controlled fire to a fuel-controlled fire. The VC/FC (Ventilation control/Fuel control) point is in this case between the values 0.022 and 0.027 . At the first point, the compartment is almost closed, the ventilation factor is 0.019 . Due to the lack of air, the fire is controlled by fuel. There is a lot of pyrolysis gas and the temperature rises. Then, at the second point, the ventilation factor increases, an opening is created, fresh air rushes in and the smoke comes out. This fresh air will cause the mass loss rate of the fuel to increase to 1.3397 × kg/s and 1.4396 × for both curves and the power of the fire. The fire has therefore just changed from FC to VC. Then from 0.025 to 0.051 , the fuel burn rate continues to decrease, approaching a constant value representing the mass loss rate in an open environment. The size of the openings and the ventilation determine the transition from fuel controlled to ventilation-controlled fire.
3.2. Numerical Simulation
3.2.1. Temperature Profiles along the Door as the Door Width Varies
Figure 4a–d represents, for each fired case, the comparison between the experimental and numerical (FDS and ISIS) temperature profiles along the door height, plotted at t = 400 s.
Functional analysis was performed for the different scenes. The Euclidean Standard allowed us to analyse and compare the experimental data with the data calculated by FDS and ISIS. In the analysis, the vector denotes the experimental data, the vector the prediction from the FDS calculation and the prediction from the ISIS calculation. The cosine represents the collinearity of the vectors, i.e., in this case the agreement in shape of the curves. The relative difference represents the difference in values between the two curves. These two parameters allow a reliable comparison. The comparison is based on the data in Figure 4 and the results are summarised in the following Table 5:
Number of benchmarks: 7
In general, the average relative difference between the experimental and FDS prediction is 0.64% and 4.17% for the experimental and ISIS prediction. With 0.64% being the closest value to 0, FDS has thus obtained values close to the experimental one compared to ISIS. However, the overall dephasing being close to one, the curves are therefore practically collinear, which reflects a good reproduction of the phenomenon.
3.2.2. Velocities Fields at the Door
Following the authors’ results [1,4], the analysis of these results showed that two zones of the opening are highlighted: a lower zone through which the incoming air feeding the fire is passed, and an upper zone through which the outgoing hot gases are passed. The smaller the width of the door, the larger the area for the outgoing gases and the smaller the area for the incoming fresh air (Figure 5). There is also a small neutral zone which represents the contact area between the hot gas and fresh air surfaces. The values of air inlet velocity (𝑉𝑖𝑛) and gas outlet velocity (𝑉𝑜𝑢𝑡) are evaluated as a function of door height and compared with Onguéne et al. [13] (Figure 6).
Number of benchmarks: 10
A significant difference is observed between the values of Scenes 1 and 3 for the hot gas velocities (Table 6). Larger values were recorded with the ISIS software. However, considering the values of the deviations and of the phase shift in general, a good co-linearity of the vectors is observed, so that the curves are very close in shape and in value.
For each fire scene, only the maximum values of the air inlet velocity (𝑉in) and gas outlet velocity (𝑉out) are evaluated. The heights occupied by these flowing fluids are deduced using the vertical velocity profiles at the door. All these different values of velocities and heights are reported in Table 7.
By applying Froude modelling, these scaled-down results are converted to full-scale results. The full-scale compartment measures 2.50 m × 2.50 m × 2.50 m and the open-door measures 1.0 m × 2.0 m. Table 8 highlights the heat release rate of each fire scene, the maximum velocity, the area of the doorway and the mass flow rate of the fluid entering or leaving at full scale.
The following figures show the data in Table 8 as a function of ventilation factors.
After extrapolating the results to full scale, Figure 7 shows the curves of variation of the maximum velocities of the incoming air stream and the outgoing flue gas stream from the domain as a function of the ventilation factor. It is found that as the effect of ventilation becomes smaller than the effect of fuel, the velocity of the fresh air stream decreases while the burnt gas stream increases. The point of intersection between the air velocity curve and the gas velocity curve represents the case where the air inlet velocity is equal to the gas outlet velocity and this corresponds to fire Scene 4 with an actual door width of 1.0 m.
As for the sections through which these different gases pass (Figure 7), we notice that the cross-section through which the air passes grows faster than that through which the burnt gases pass. This explains the fact that, although the speed decreases with ventilation, the fresh air stream entering the compartment always has a mass flow rate of largely greater than the outgoing flue gas mass flow (Figure 7).
After simulating the velocity and surface area of the fluids, the mass flow rate is calculated assuming a fluid density of 1.25 kg/. These figures (Figure 8) illustrate the variation of the mass flow rates of the incoming air and outgoing flue gas compared to the results obtained by Zukoski et al. [6], Rockett et al. [7] and Onguéné et al. [13].
3.2.3. Influence of the Ventilation Factor on the Power Released Inside the Compartment
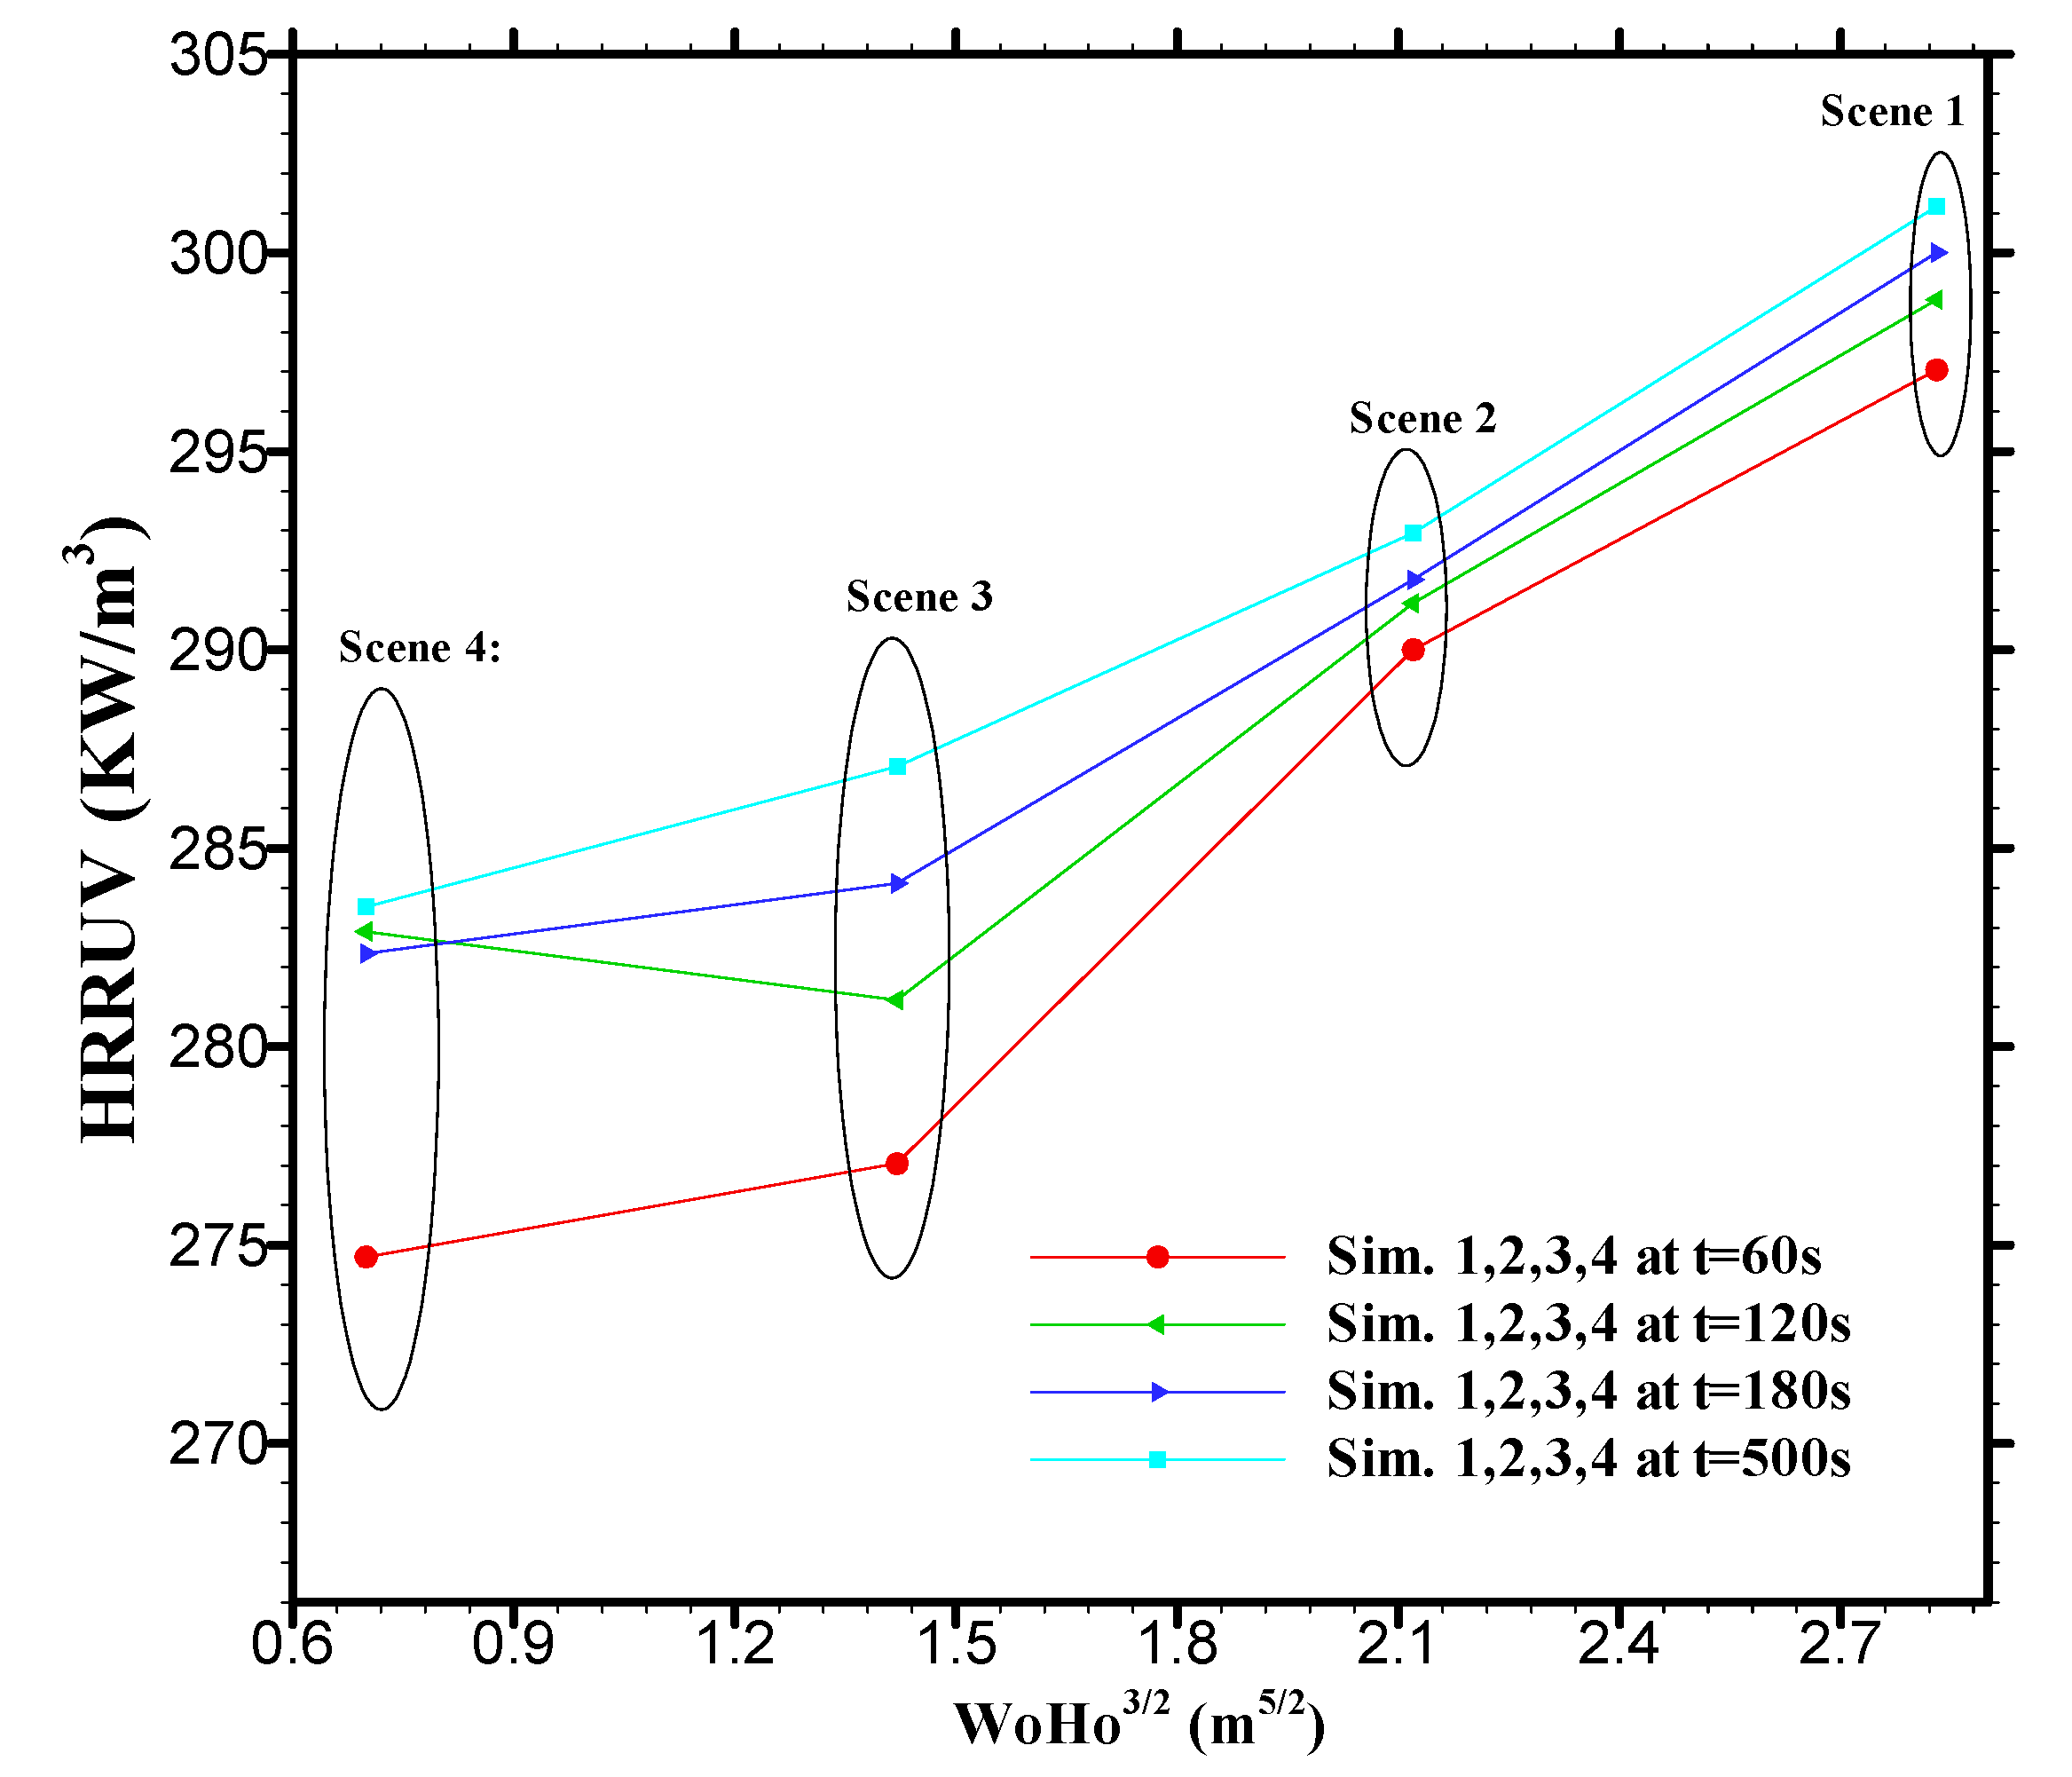
Figure 9 shows a comparison of the large-scale numerical predictions of the power inside the compartment as a function of the compartment’s opening size. There were four opening sizes corresponding to four fire scenes. A fixed value of 250 kW was used as input for the firebox surface power for the four scenes.
It was observed that the heat release rate measured inside the compartment varies significantly with the opening. Indeed, when increasing the surface area from to , we observe an increase in the HRRUV of about 2.6 percent on average between Scenes 4 and 3, of 3.4 percent between Scenes 2 and 3, and of 0.8 percent between Scenes 1 and 2. It can be seen that the power inside the compartment changes not only as a function of time in each fire scene but also as a function of the ventilation factor. The larger the area of the opening, the greater the power inside. The heat release rate in Scene 4 is the highest. Ventilation affects compartment fires as well as heat feedback to the fuel surface. A small opening area reduces the oxygen supply, which leads to a reduction in the rate of combustion. A small opening area also increases the heat inside the compartment, and this heat transfer to the fuel surface improves fuel vaporisation.
4. Conclusions
This study aimed to make a contribution to the study of compartment fires with diesel fuel as the source of the fire. The main focus was on the influence of the opening dimensions on the power released inside the compartment. The results obtained by calculation were compared with those obtained with the ISIS software and with experimental data. We have shown the applicability of the FDS numerical tool for the evaluation of this type of fire scenario. The influence of the width of the opening on the power output inside a compartment was investigated. It was found that for fixed firepower, the total power inside the compartment increases with the width of the door. The size of the compartment and the ventilation present in the compartment determine when the fire will change from ventilation-controlled to a fuel-controlled combustion. The results of the temperature and velocity comparison are satisfactory and can be improved. The validation is quite satisfactory given the experimental uncertainties, and the model results for this parameter and situation can be used with confidence.
Future studies should use this variability in convection current velocity to model the convective exchange coefficient between these hot gases and the burning compartment wall.
Author Contributions
Conceptualization, R.M. and A.E.-k.I.; methodology, A.E.-k.I.; software, A.E.-k.I.; validation, P.O.M.; formal analysis, A.F.E.; investigation, J.T.Z.; resources, P.O.M.; writing—original draft preparation, A.E.-k.I.; writing—review and editing, A.F.E. and A.E.-k.I.; supervision, J.T.Z.; project administration, R.M.; funding acquisition, R.M. All authors have read and agreed to the published version of the manuscript.
Funding
This research received no external funding.
Institutional Review Board Statement
Not applicable.
Informed Consent Statement
Not applicable.
Data Availability Statement
Not applicable.
Conflicts of Interest
The authors declare no conflict of interest.
Abbreviations
| Ain-Aout | [m2] | Surface area of the opening of a hot air and gas compartment |
| W0 | [m] | Width of the opening |
| H0 | [m] | Height of the opening |
| Af | [m2] | Fire plane surface |
| ΔHc,eff | [KJ/Kg] | Effective heat of combustion |
| Cd | Flow coefficient (0.7) | |
| cp | [J·kg−1·K−1] | Heat capacity by mass at constant pressure |
| W | [m3] | Initial volume of fuel oil |
| D* | [m] | Characteristic diameter of the fire |
| [Kg/s] | Mass loss rate of the fuel | |
| Ta-Tg | [k] | Temperature of incoming air and hot exhaust gases |
| Hin-Hout | [m] | Height of hot gases and air |
| [Kg/m3] | Fluid density | |
| fr | Fraction of the enthalpy of combustion of vapours transferred back to the surface of the material by radiation | |
| [W/m·K] | Thermal conductivity of the wall | |
| h | [W·m2·K−1] | Convective transfer coefficient |
| Hk | [kW·m−2·K−1] | Ratio of the thermal conductivity of a material to its thickness |
| Emissivity of hot gases in the enclosure | ||
| tb | [s] | Average fire burning duration |
| Combustion efficiency | ||
| ζ = 5.67 × 10⁻⁸ | W·m−2·K−4 | Stefan–Boltzmann constant |
| g = 9.81 | m·s−2 | Gravity acceleration |
| Γ = 1.4 | Heat capacity ratio for air | |
| [m/s] | Maximal velocity of incoming gases | |
| [m/s] | Maximal velocity of outgoing gases | |
| Combustion efficiency (0.8) | ||
| [m/s] | Regression velocity | |
| L | (m) | Characteristic length |
| D | [m/s] | Characteristic velocity |
| [kg/s] | Mass flow rate of cool air | |
| [kg/s] | Mass flow rate of smoke | |
| [m/s] | Maximal velocity of incoming air | |
| [m/s] | Maximal velocity of outgoing gases | |
| W | m3 | Initial volume of fuel |
| Zn | m | Height of discontinuity |
References
- Sahu, D.; Kumar, S.; Shorab, J.; Gupta, A. Full scale experimental and numerical studies on effect of ventilation in an enclosure diesel pool fire. Build. Simul. 2017, 10, 351–364. [Google Scholar] [CrossRef]
- Peatross, M.J.; Beyler, C.L. Ventilation Effects on Compartment Fire Characterization. FIRE Saf. Sci. 1997, 5, 403–414. [Google Scholar] [CrossRef]
- Au, S.K.; Wangb, Z.-H.; Siu-Ming, L. Compartment fire risk analysis by advanced Monte Carlo simulation. Eng. Struct. 2006, 29, 2381–2390. [Google Scholar] [CrossRef]
- Kawagoe, K. Fire Behavior in Rooms; Building Research Institute: Tokyo, Japan, 1958. [Google Scholar]
- Emmons, J.; Prahl, H.W. Fire induced flow through an opening. Combust. Flame 1975, 25, 369–385. [Google Scholar]
- Zukoski, B.E.; Kubota, T.; Cetegen, B. Entrainment in fire plumes. Fire Saf. J. 1981, 3, 107–121. [Google Scholar] [CrossRef]
- Rockett, A. Fire induced gas flow in an enclosure. Combust. Sci. Technol. 1976, 12, 165–175. [Google Scholar] [CrossRef]
- Meskéoulé, F.; Ngayihi, A.; Zaida, J.T.; Mvogo, P.O.; Mouangue, R. Experimental Study on Fire Behaviour in Room following the Disposition of Openings. J. Combust. 2020. [Google Scholar] [CrossRef]
- Babrauska, V.; Peacock, R.D. Heat Release Rate: The Single Most Important Variable in Fire Hazard. Fire Saf. J. 1992, 18, 255–272. [Google Scholar] [CrossRef]
- Quintiere, J.G. Fire behavior in building compartments. Proc. Combust. Inst. 2002, 29, 181–193. [Google Scholar] [CrossRef]
- Mokhtarzadeh-Dehghan, M. Numerical simulation and comparison with experiment of natural convection between two floors of a building model via a stairwell. Int. J. Heat Mass Transf. 2011, 54, 19–33. [Google Scholar] [CrossRef]
- Mcdermott, R. Fire Dynamics Simulator Technical Reference Guide Volume 2: Verification, 6th ed.; National Institute of Standards and Technology: Gaithersburg, ML, USA, 2013.
- Mvogo, P.O.; Mouangue, R.; Zaida, J.T.; Obounou, M.; Fouda, H.E. Building fire: Experimental and numerical studies on behaviour of flows at opening. J. Combust. 2019, 2019, 2535073. [Google Scholar] [CrossRef]
- Harrack, S.H.; Koutaiba, E.M.; Mehaddi, R.; Boulet, P.; Becker, S. Impact of the room geometry on the smoke filling time due to a fire plume. J. Phys. Conf. Ser. Pap. 2018, 1107, 042022. [Google Scholar] [CrossRef]
- Harrak, S. Contributions à l’étude des écoulements de Fumées dans un Bâtiment en Situation d ’incendie Mécanique des Fluides [physics.class-ph]. Doctoral Dissertation, Université de Lorraine, Nancy, France, 2019. [Google Scholar]
- Chanson, H.; Murzyn, F. Froude similitude and scale effects affecting air entrainment in hydraulic jumps. In World Environmental and Water Resources Congress 2008: Ahupua’A; American Society of Civil Engineers: Reston, VA, USA, 2008; pp. 1–10. [Google Scholar]
- Mcgrattan, K.; Mcdermott, R.; Hostikka, S.; Floyd, J.; Vanella, M. Fire Dynamics Simulator (Version 6) User’s Guide, 6th ed.; National Institute of Standards and Technology: Gaithersburg, MA, USA, 2019. [CrossRef]
- Mcdermott, R. Fire Dynamics Simulator Technical Reference Guide Volume 1: Mathematical Model, 6th ed.; National Institute of Standards and Technology: Gaithersburg, ML, USA, 2019. [CrossRef]
- Bounagui, A.; Benichou, N.; Cartney, C.M. Optimizing the grid size used in CFD simulations to evaluate Fire Safety in House. In Proceedings of the 3rd NRC CFD Symposium on Computational Fluid Dynamics, High Performance Computing and Virtual Reality, Ottawa, ON, Canada, 4 December 2003. [Google Scholar]
- Xin, Y.; Gore, J.; Grattan, K.M. Large Eddy Simulation of Buyoant Turbulent pool Fires. In Proceedings of the 29th International Symposium on Combustion, Sapporo, Japan, 2–26 July 2002. [Google Scholar]
- Babrauskas, V. Free-burning fires. Fire Saf. J. 1986, 11, 33–51. [Google Scholar] [CrossRef]
- Jolly, S. Scale Modeling of Fires with Emphasis on room Flashover Phenomenon. Fire Saf. J. 1992, 18, 139–182. [Google Scholar] [CrossRef]
Figure 1.
Experimental domain of dimensions including in its front wall a single open door of dimensions [13].
Figure 1.
Experimental domain of dimensions including in its front wall a single open door of dimensions [13].
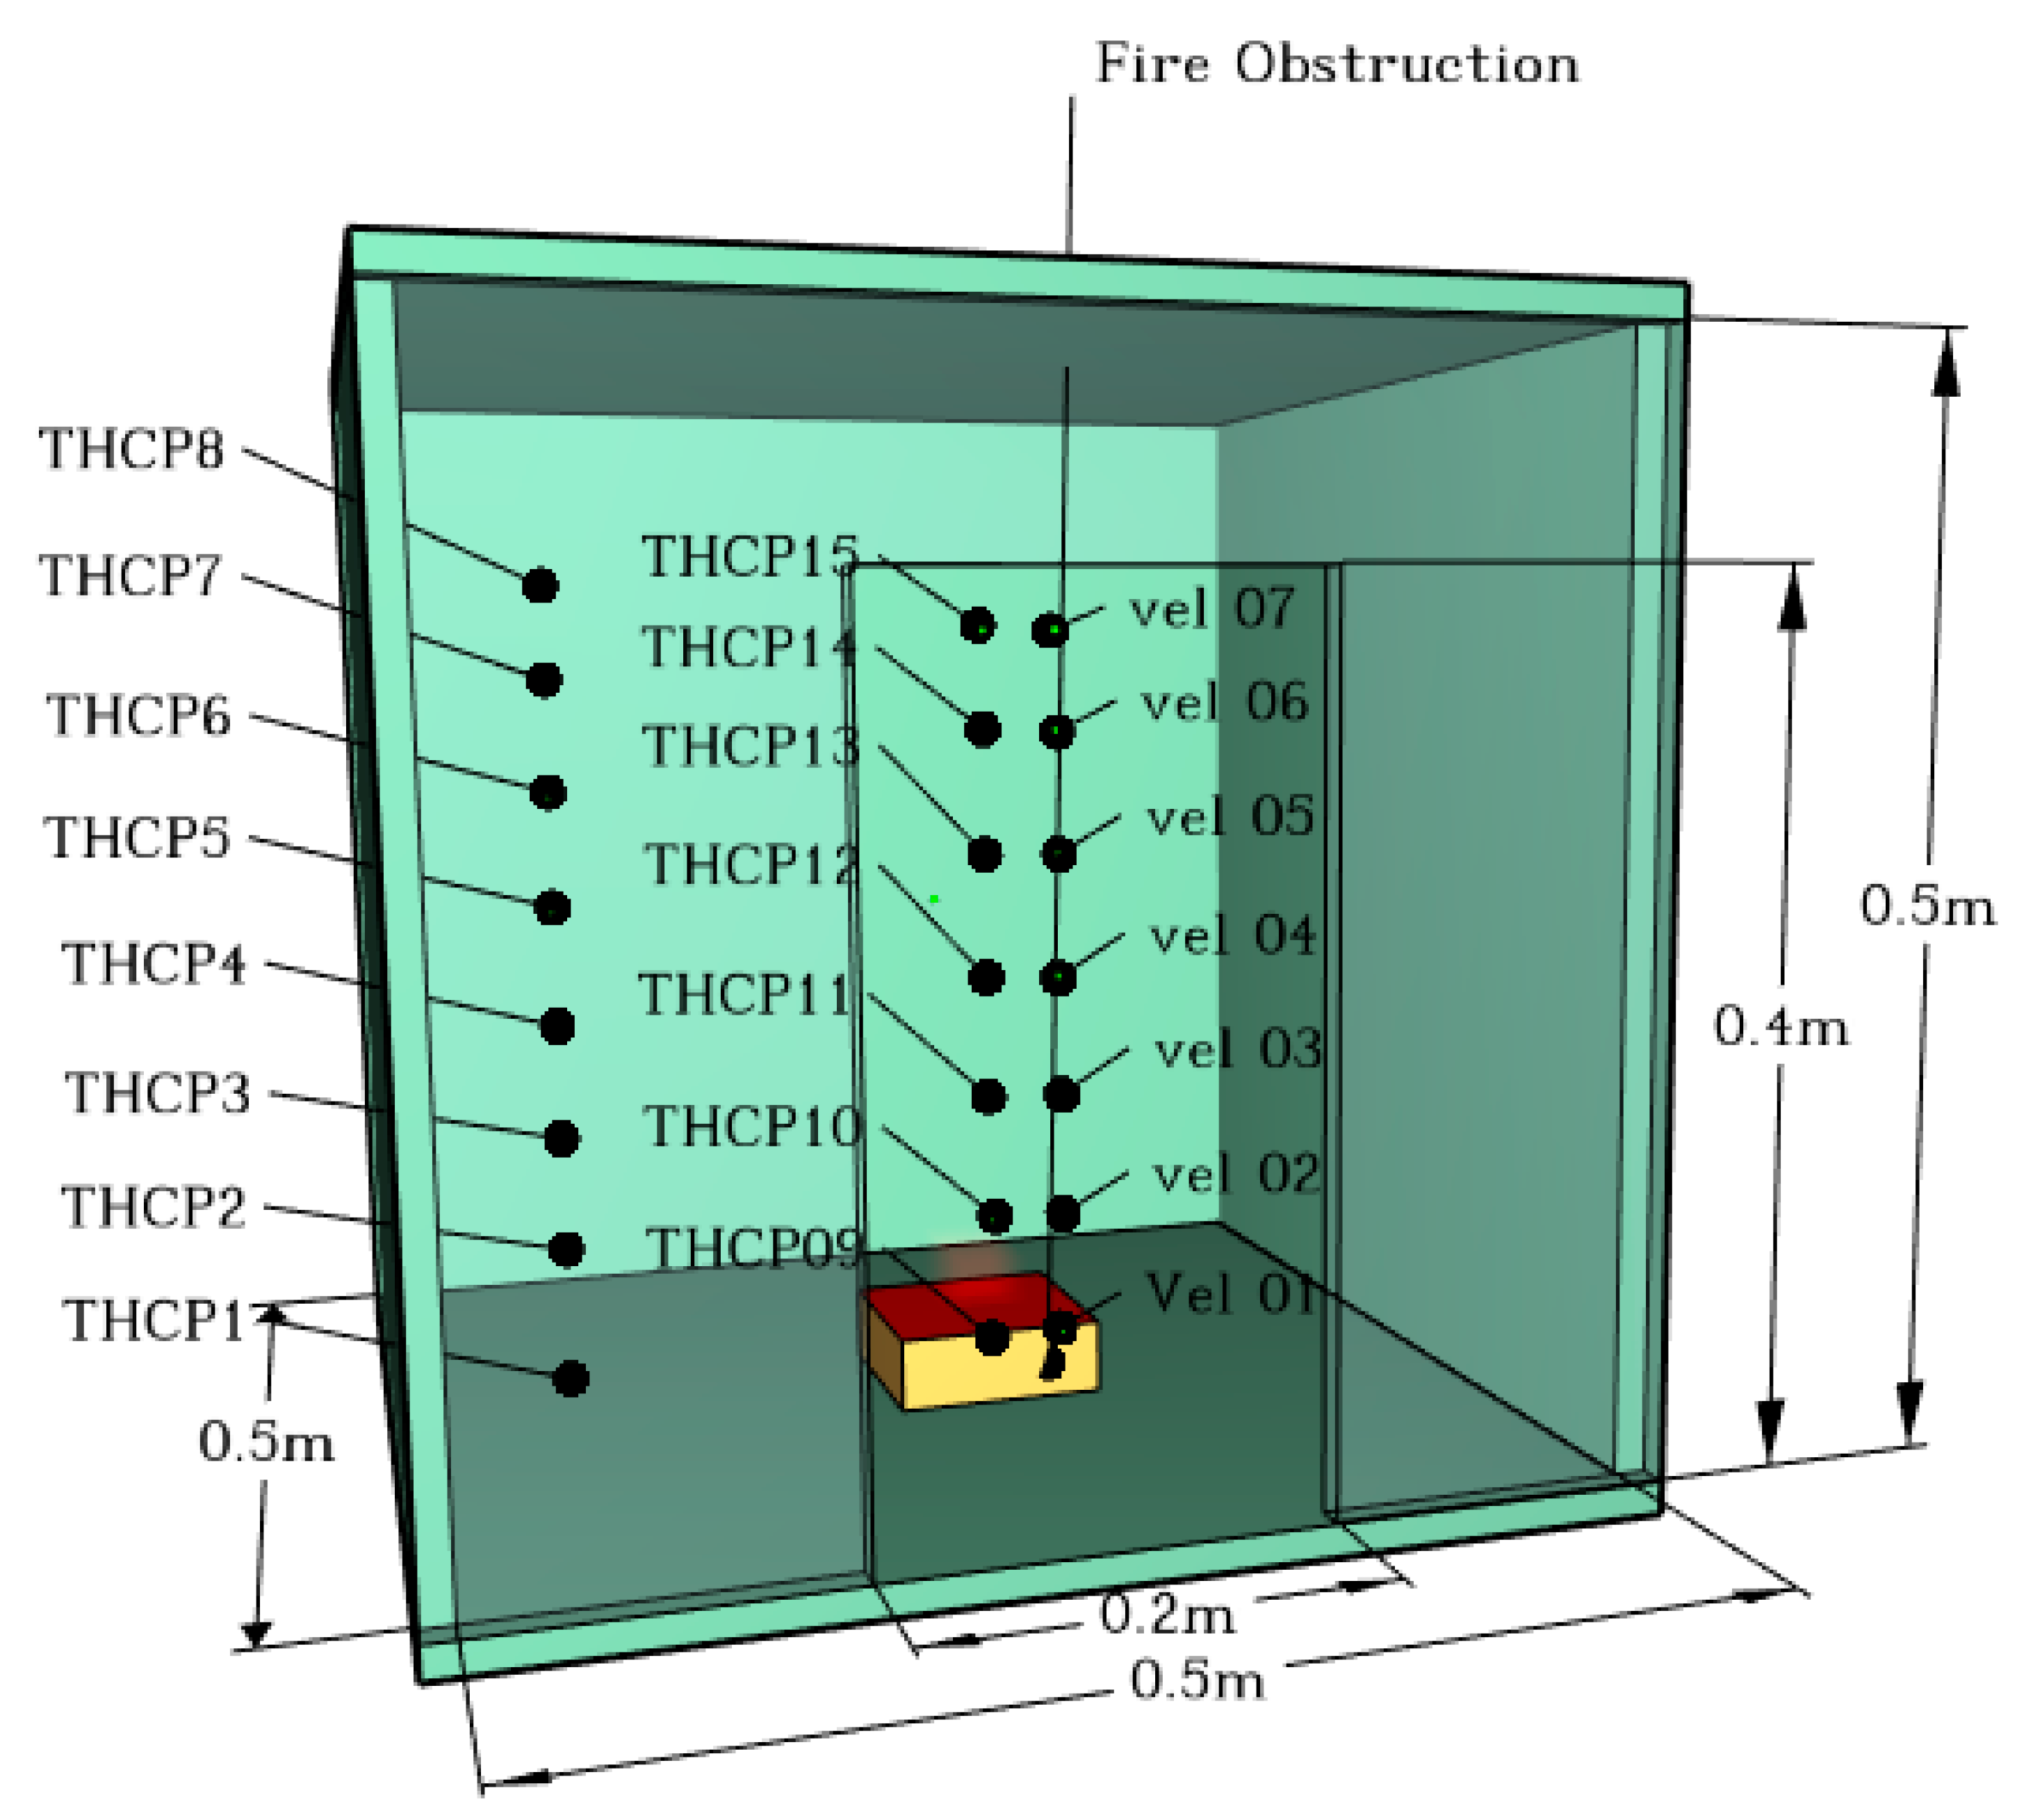
Figure 2.
Effect of mesh sizes on T2 temperature and Mesh domain.
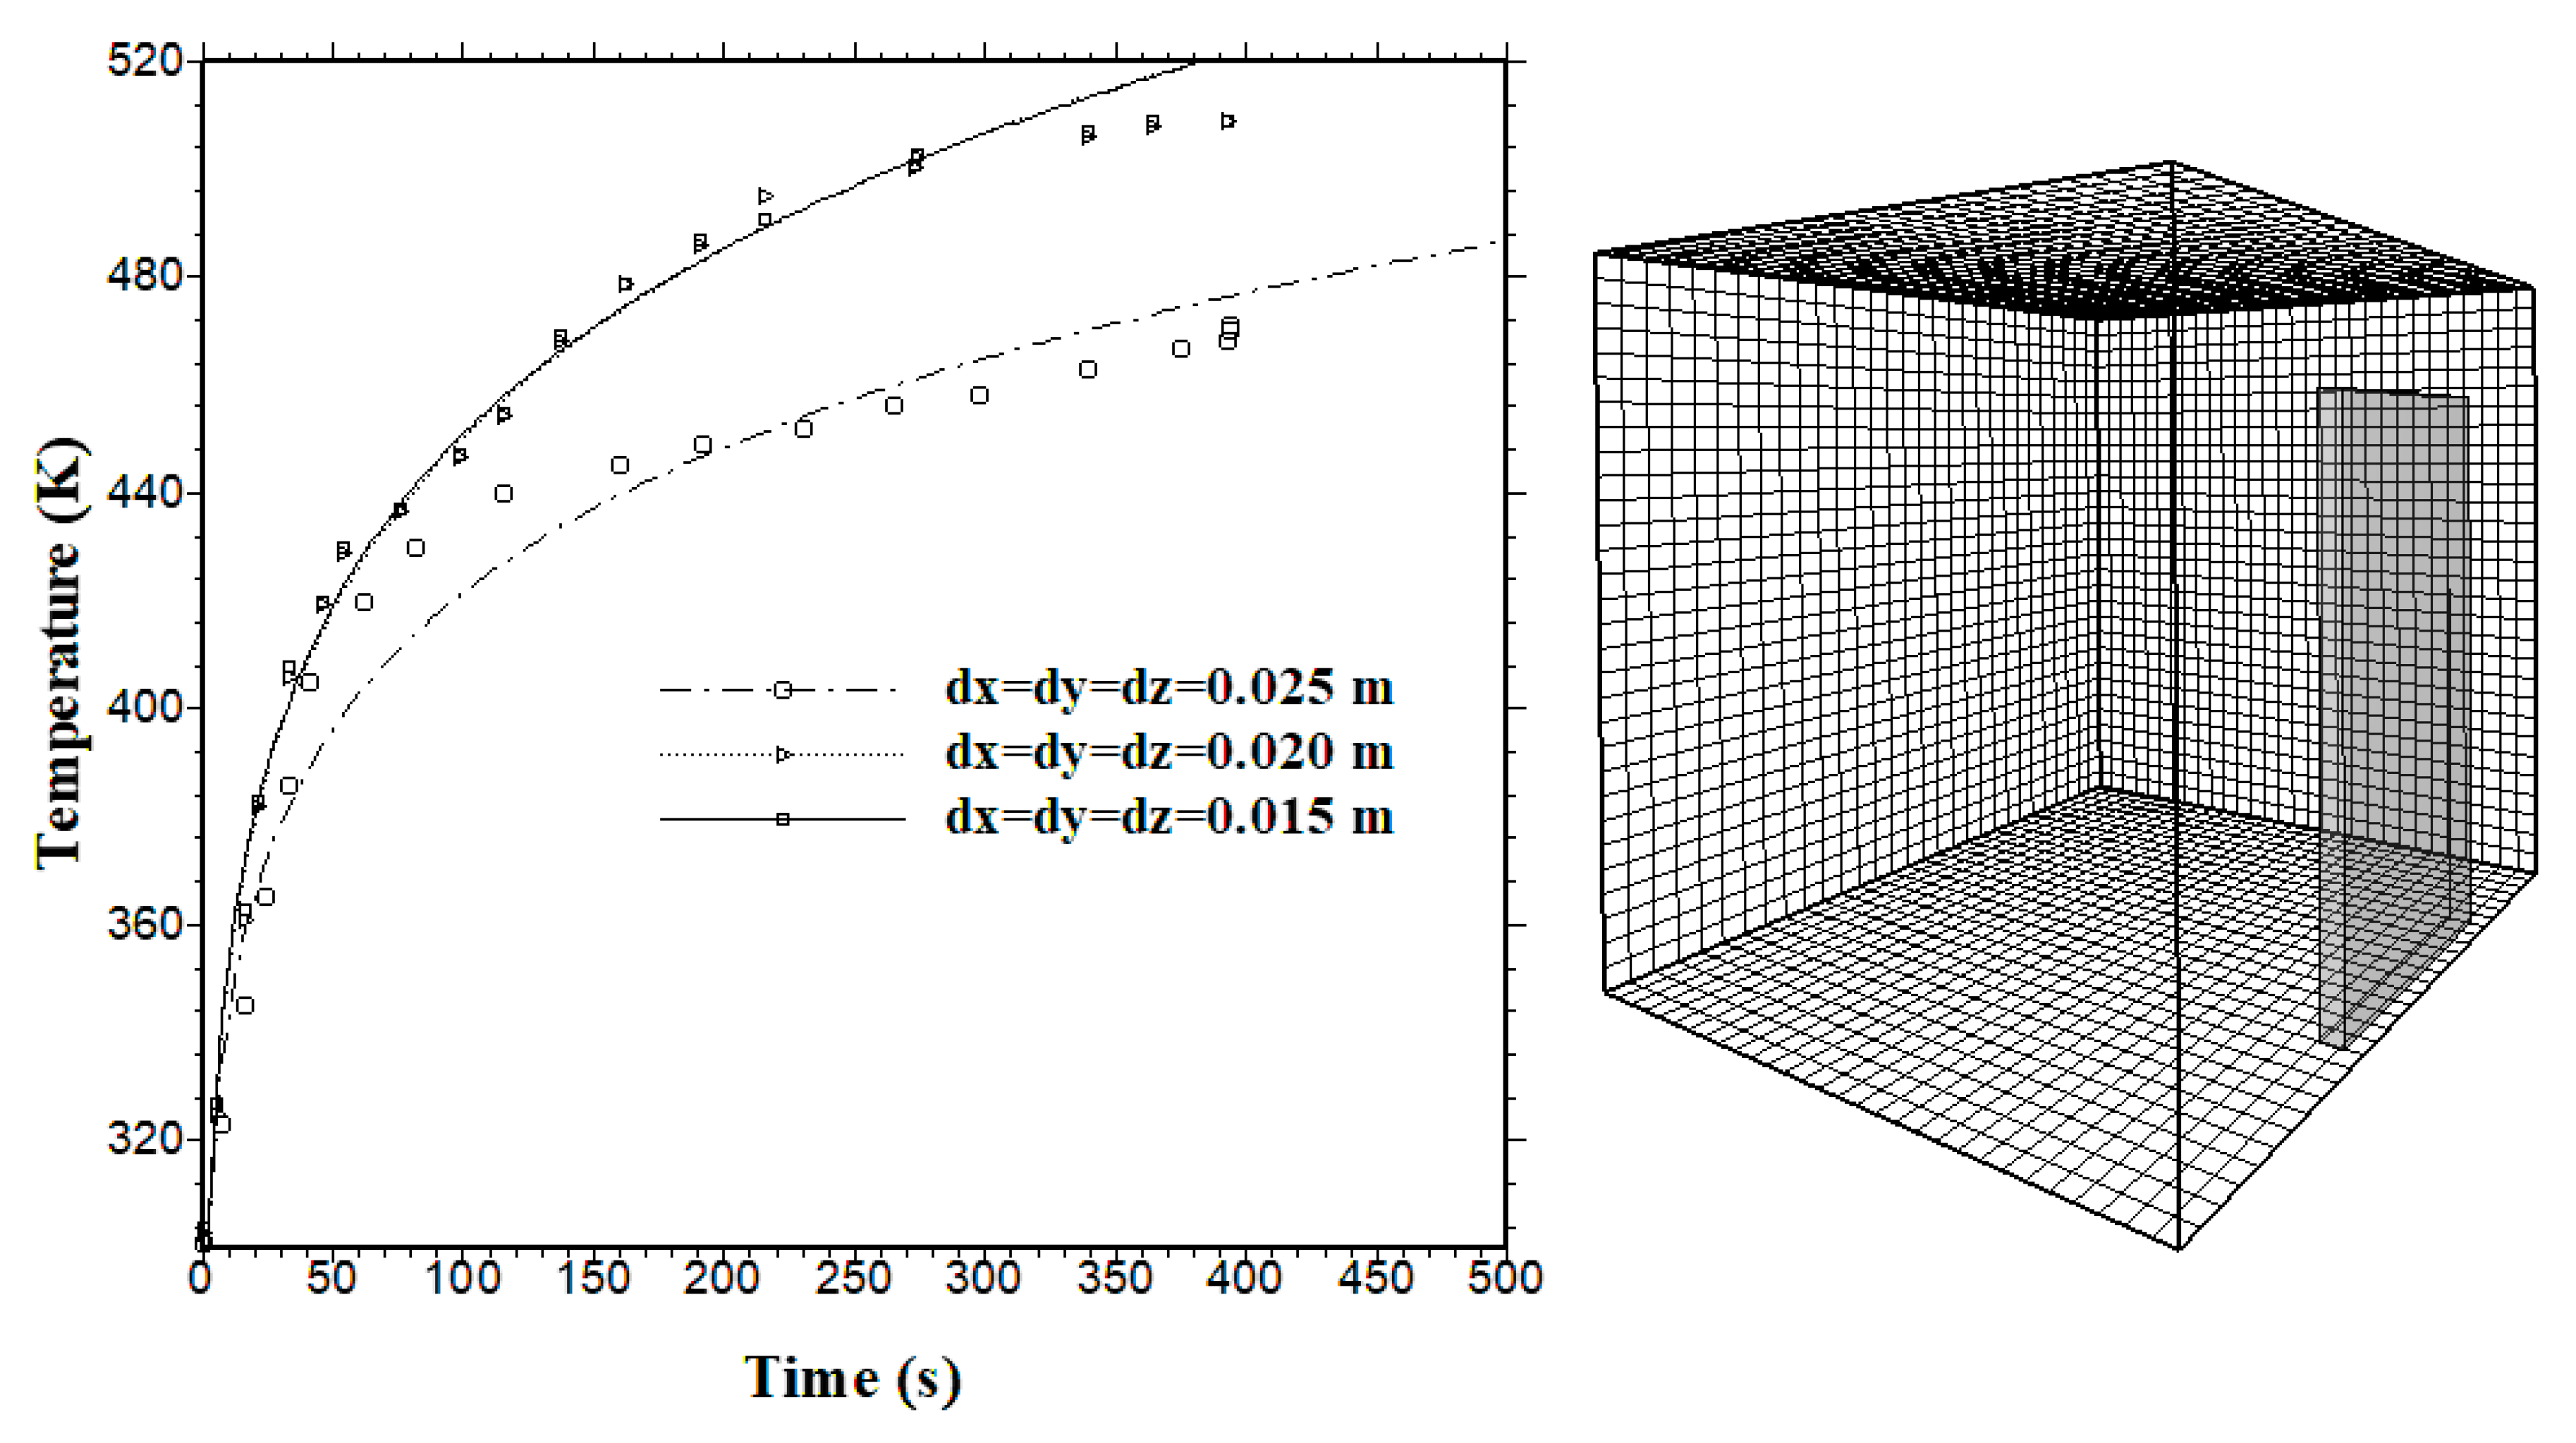
Figure 3.
Influence of the variation of the ventilation factor on the fuel combustion rate [13].
Figure 3.
Influence of the variation of the ventilation factor on the fuel combustion rate [13].
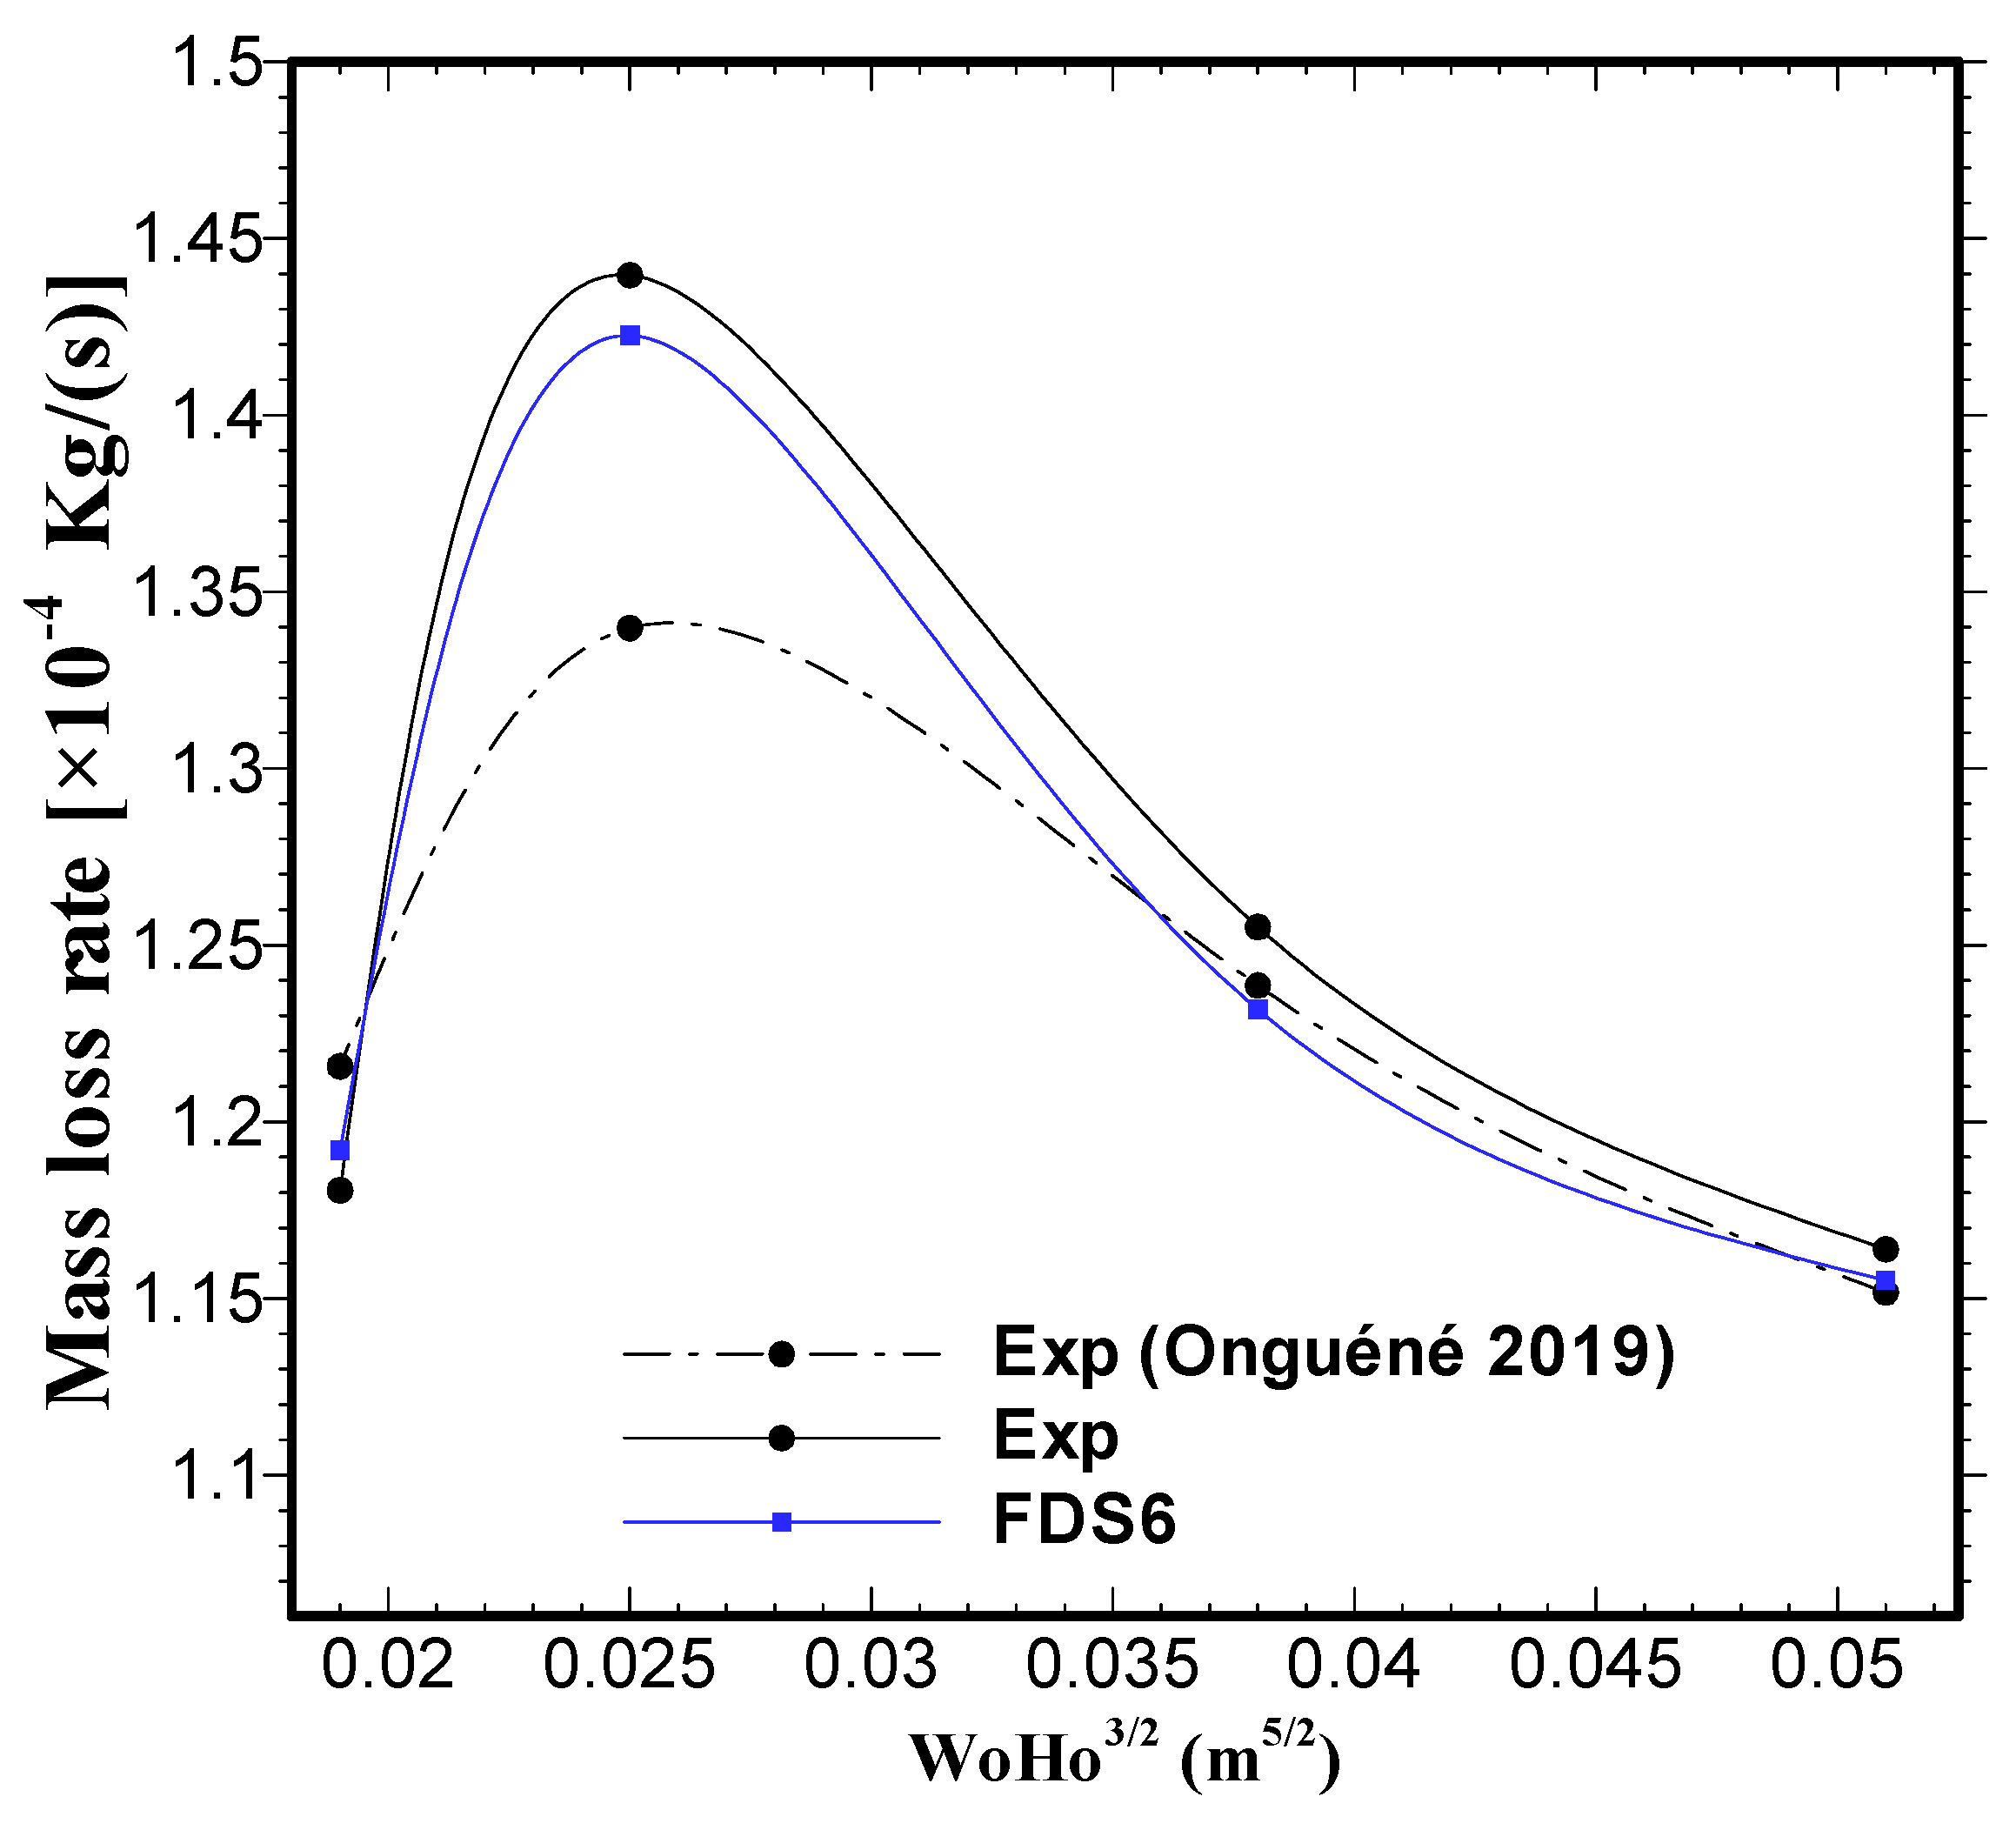
Figure 4.
Temperature profiles at the door at t = 400 s. (a) Scene 1: W = 0.2 m (b) Scene 2: W = 0.15 m (c) Scene 3: W = 0.10 m (d) Scene 4: W = 0.075 m.
Figure 4.
Temperature profiles at the door at t = 400 s. (a) Scene 1: W = 0.2 m (b) Scene 2: W = 0.15 m (c) Scene 3: W = 0.10 m (d) Scene 4: W = 0.075 m.
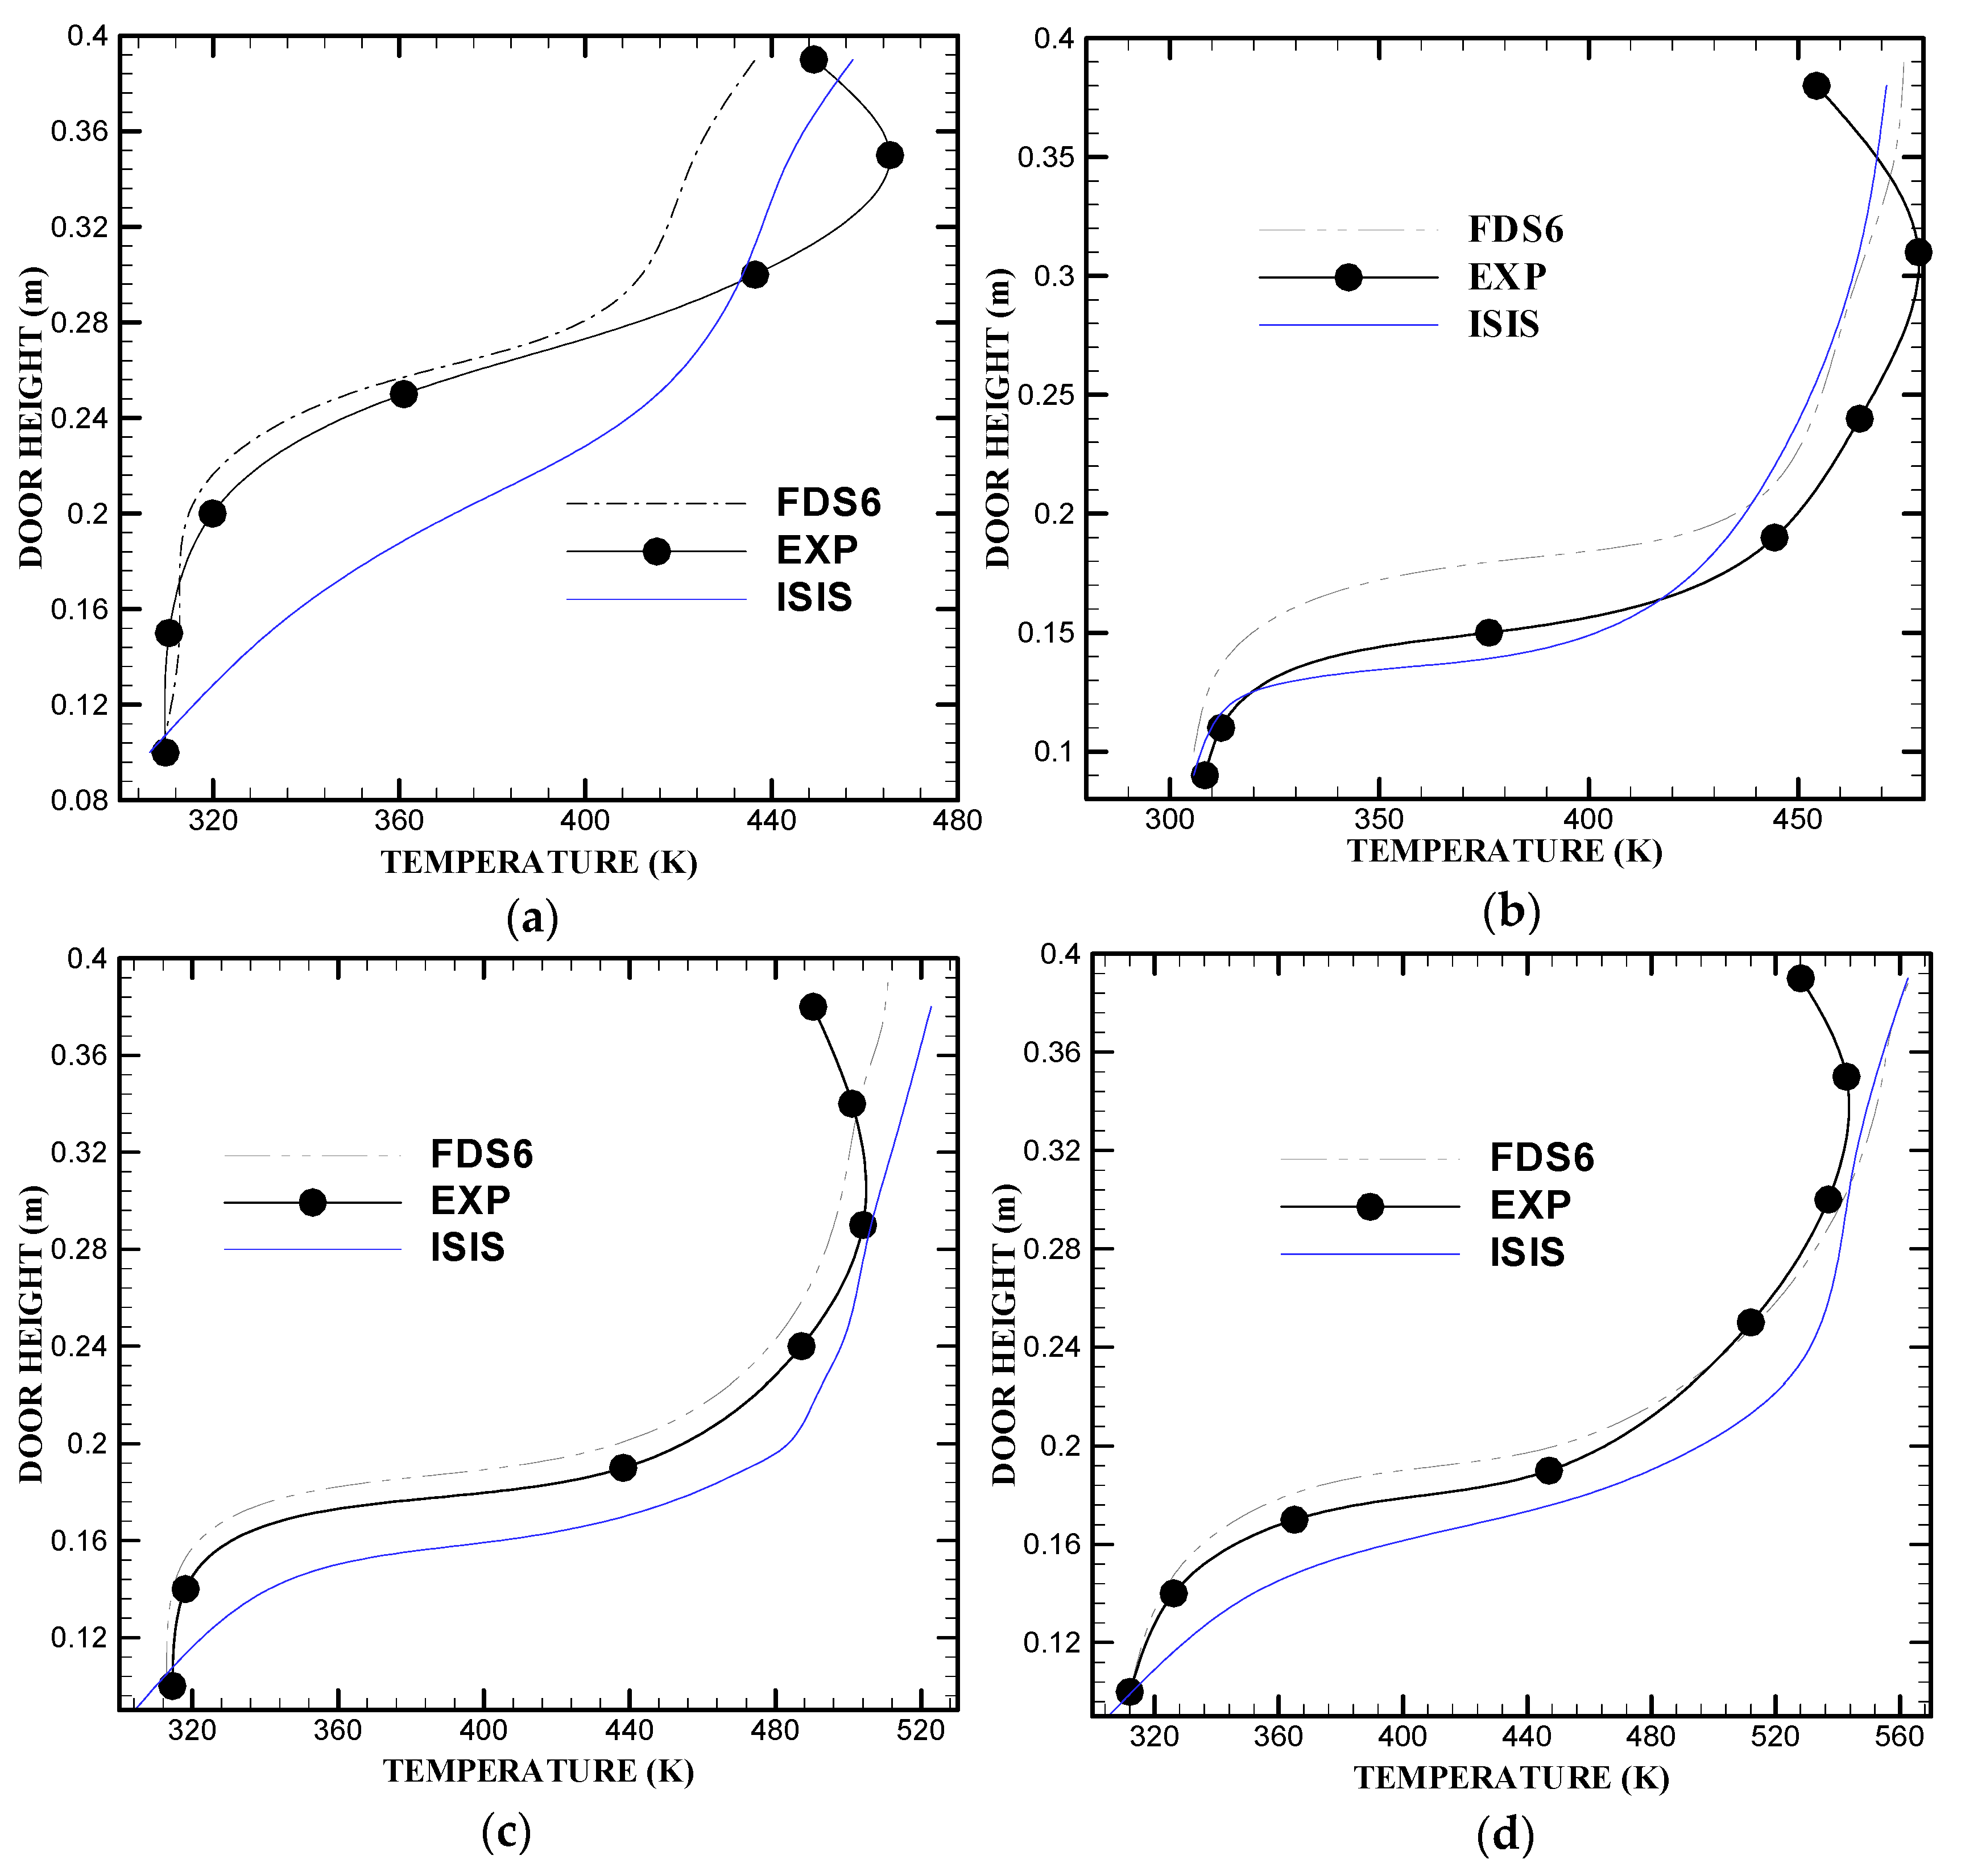
Figure 5.
Velocity contours of burned gas and incoming air at t = 400 s (a) Scene 1: W = 0.2 m (b) Scene 2: W = 0.15 m (c) Scene 3: W = 0.10 m (d) Scene 4: W = 0.075 m.
Figure 5.
Velocity contours of burned gas and incoming air at t = 400 s (a) Scene 1: W = 0.2 m (b) Scene 2: W = 0.15 m (c) Scene 3: W = 0.10 m (d) Scene 4: W = 0.075 m.
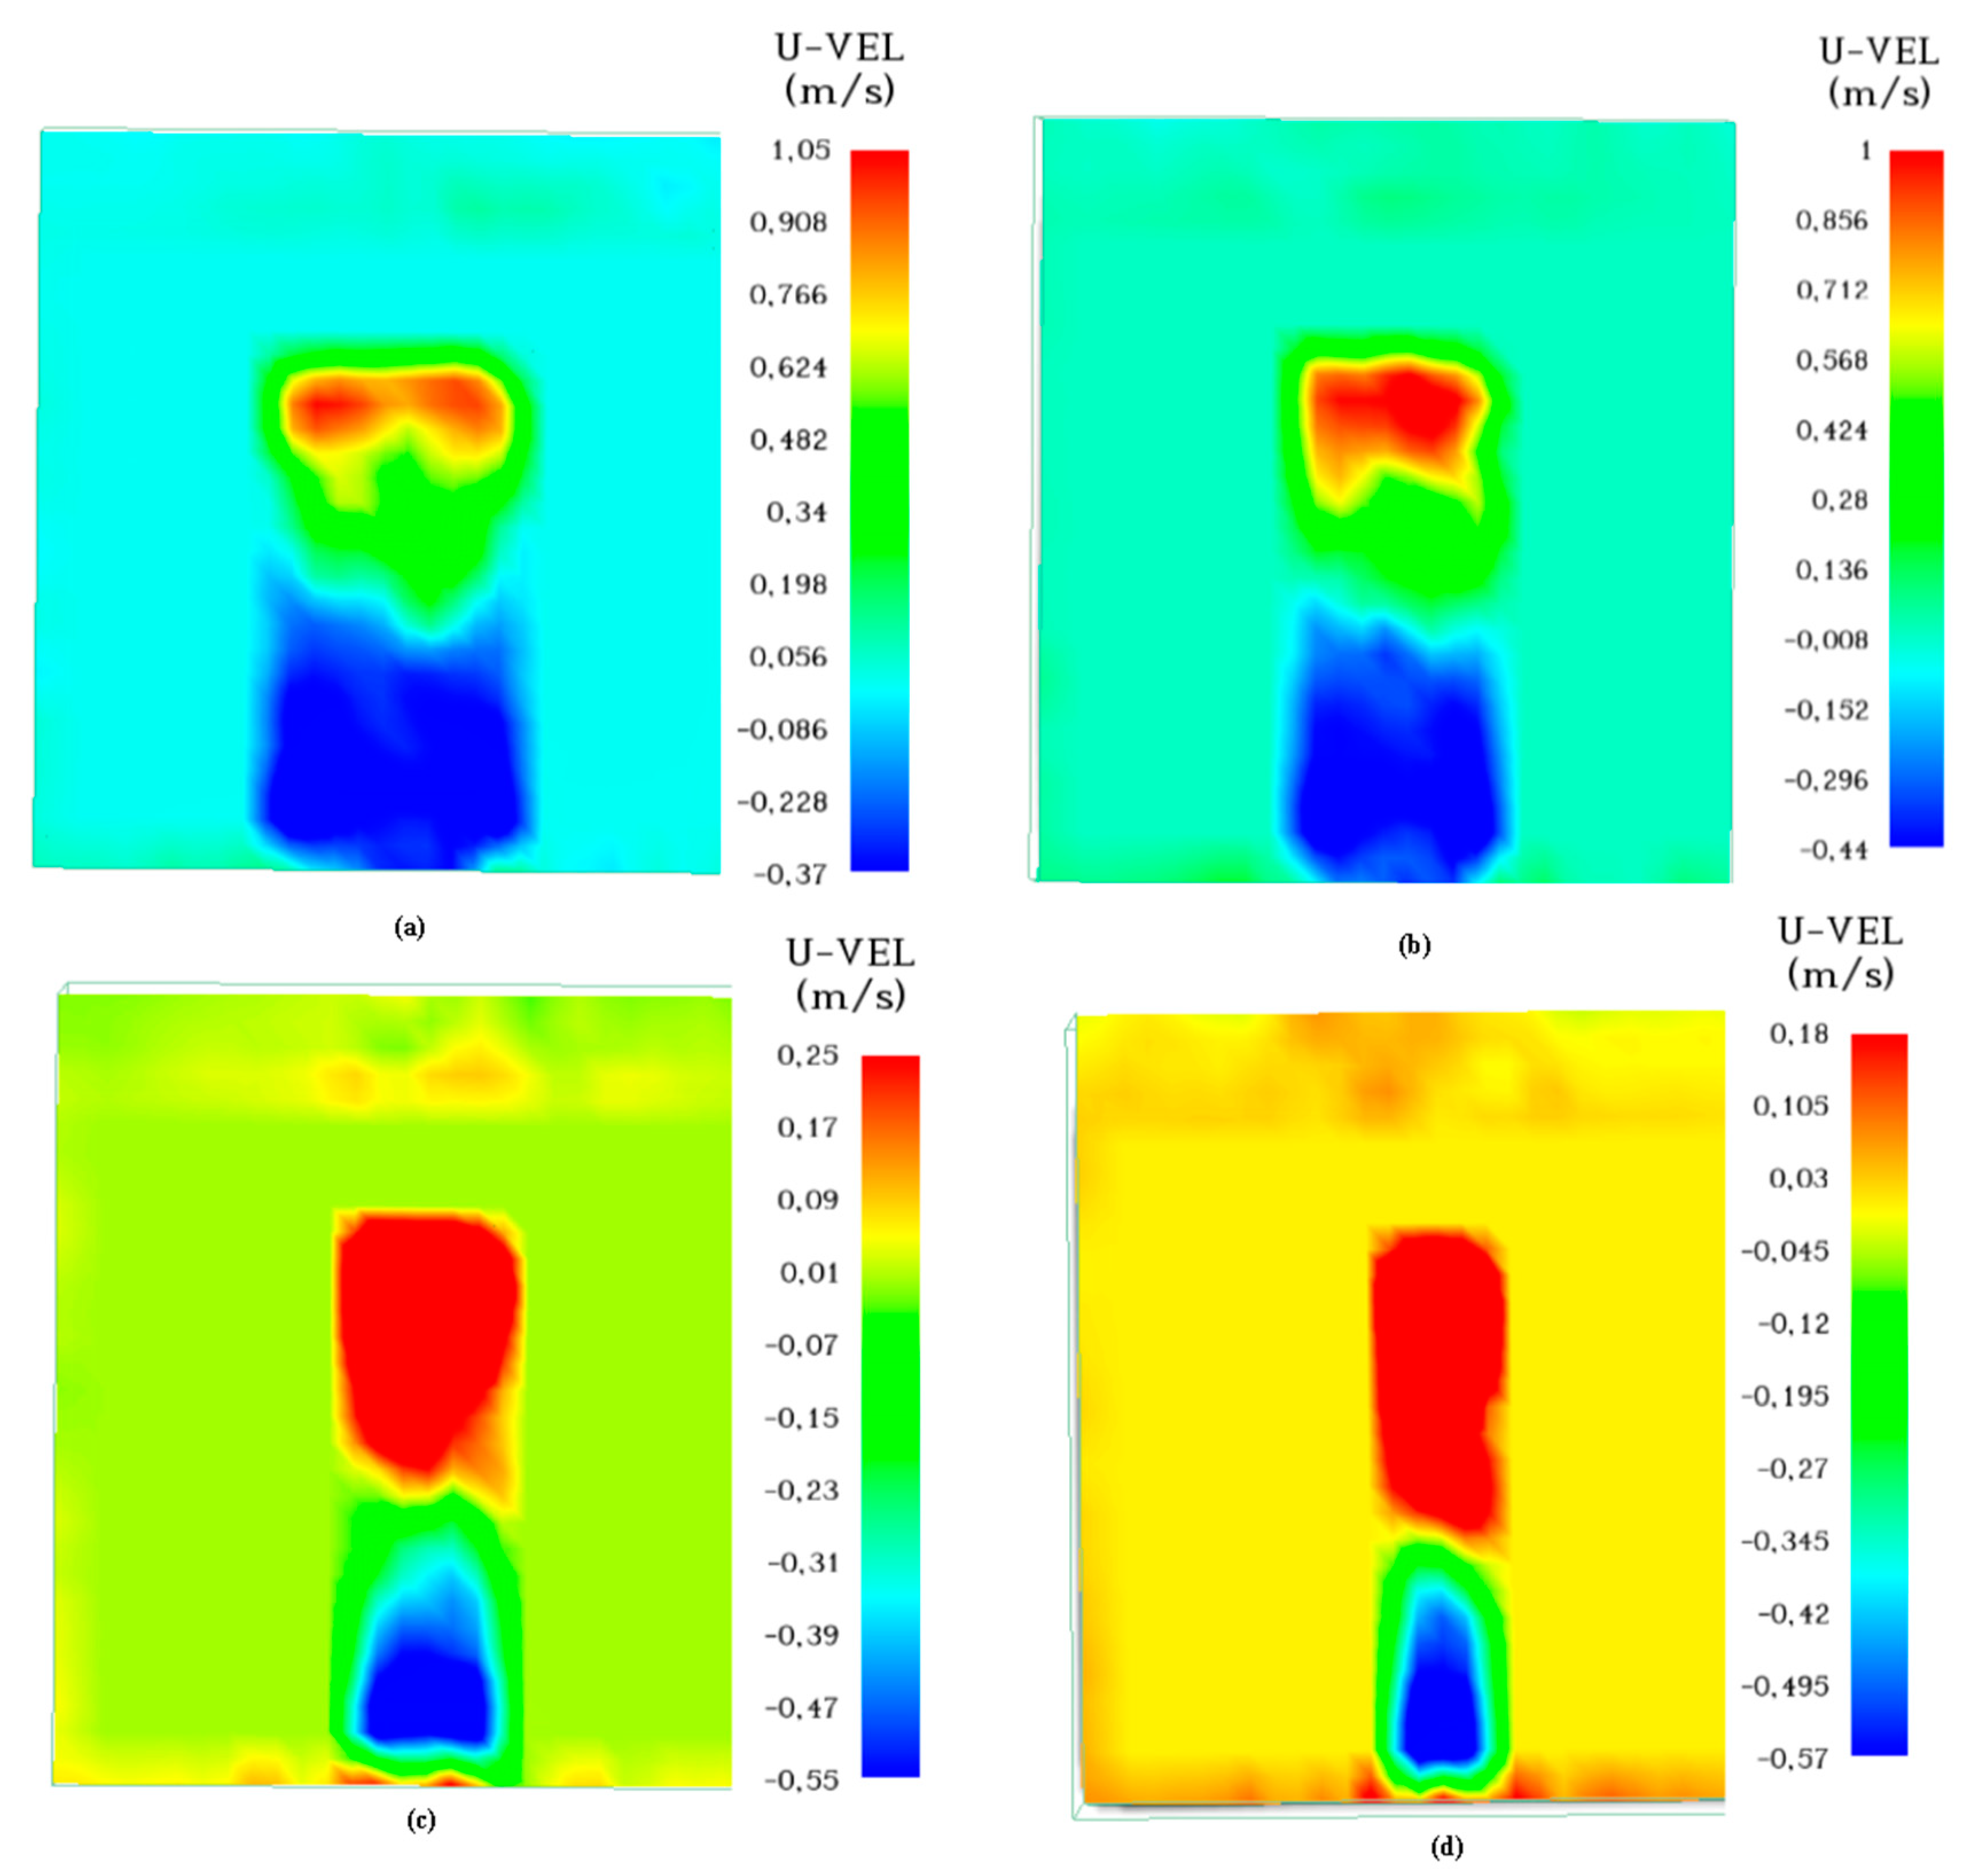
Figure 6.
Comparisons of vertical velocity profiles at the gate at t = 400 s (a) Scene 1: W = 0.2 m (b) Scene 2: W = 0.15 m (c) Scene 3: W = 0.10 m (d) Scene 4: W = 0.075 m.
Figure 6.
Comparisons of vertical velocity profiles at the gate at t = 400 s (a) Scene 1: W = 0.2 m (b) Scene 2: W = 0.15 m (c) Scene 3: W = 0.10 m (d) Scene 4: W = 0.075 m.
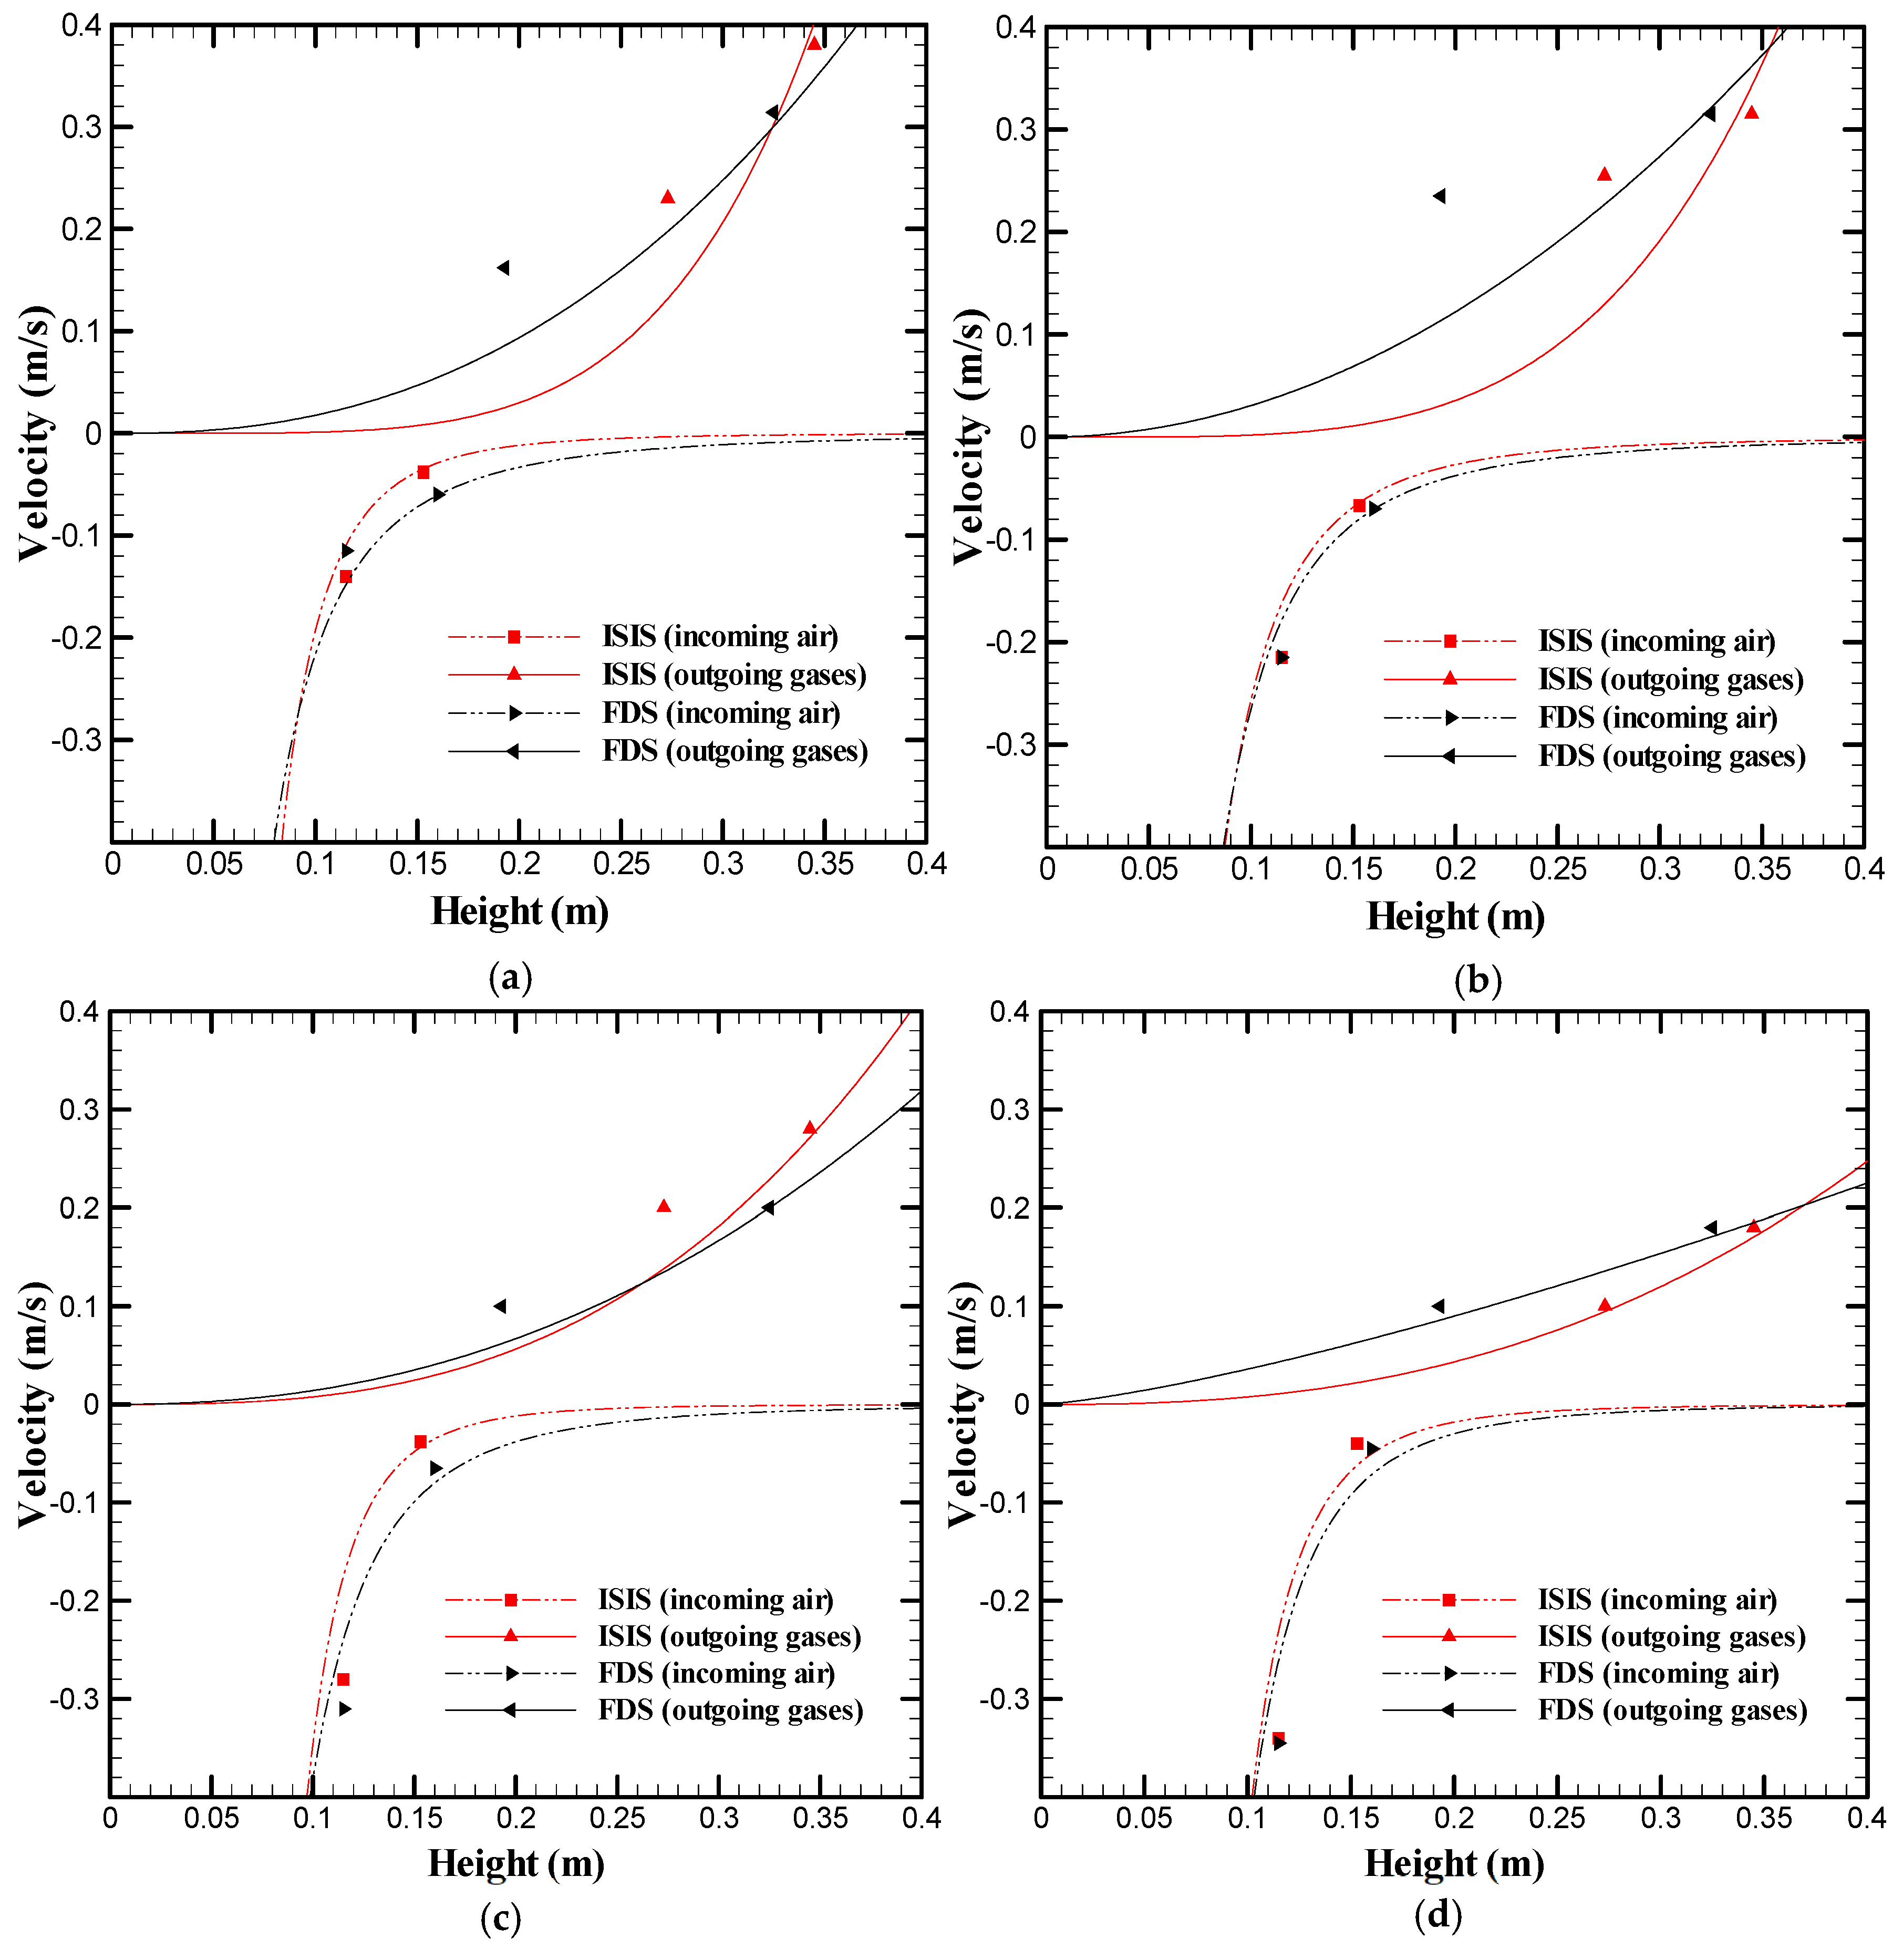
Figure 7.
Variation of velocities and surfaces crossed by the incoming air and outgoing gases as a function of the ventilation factor.
Figure 7.
Variation of velocities and surfaces crossed by the incoming air and outgoing gases as a function of the ventilation factor.

Figure 8.
Variation of incoming airflow and outgoing hot gases as a function of the large-scale ventilation factor [6,7,13].
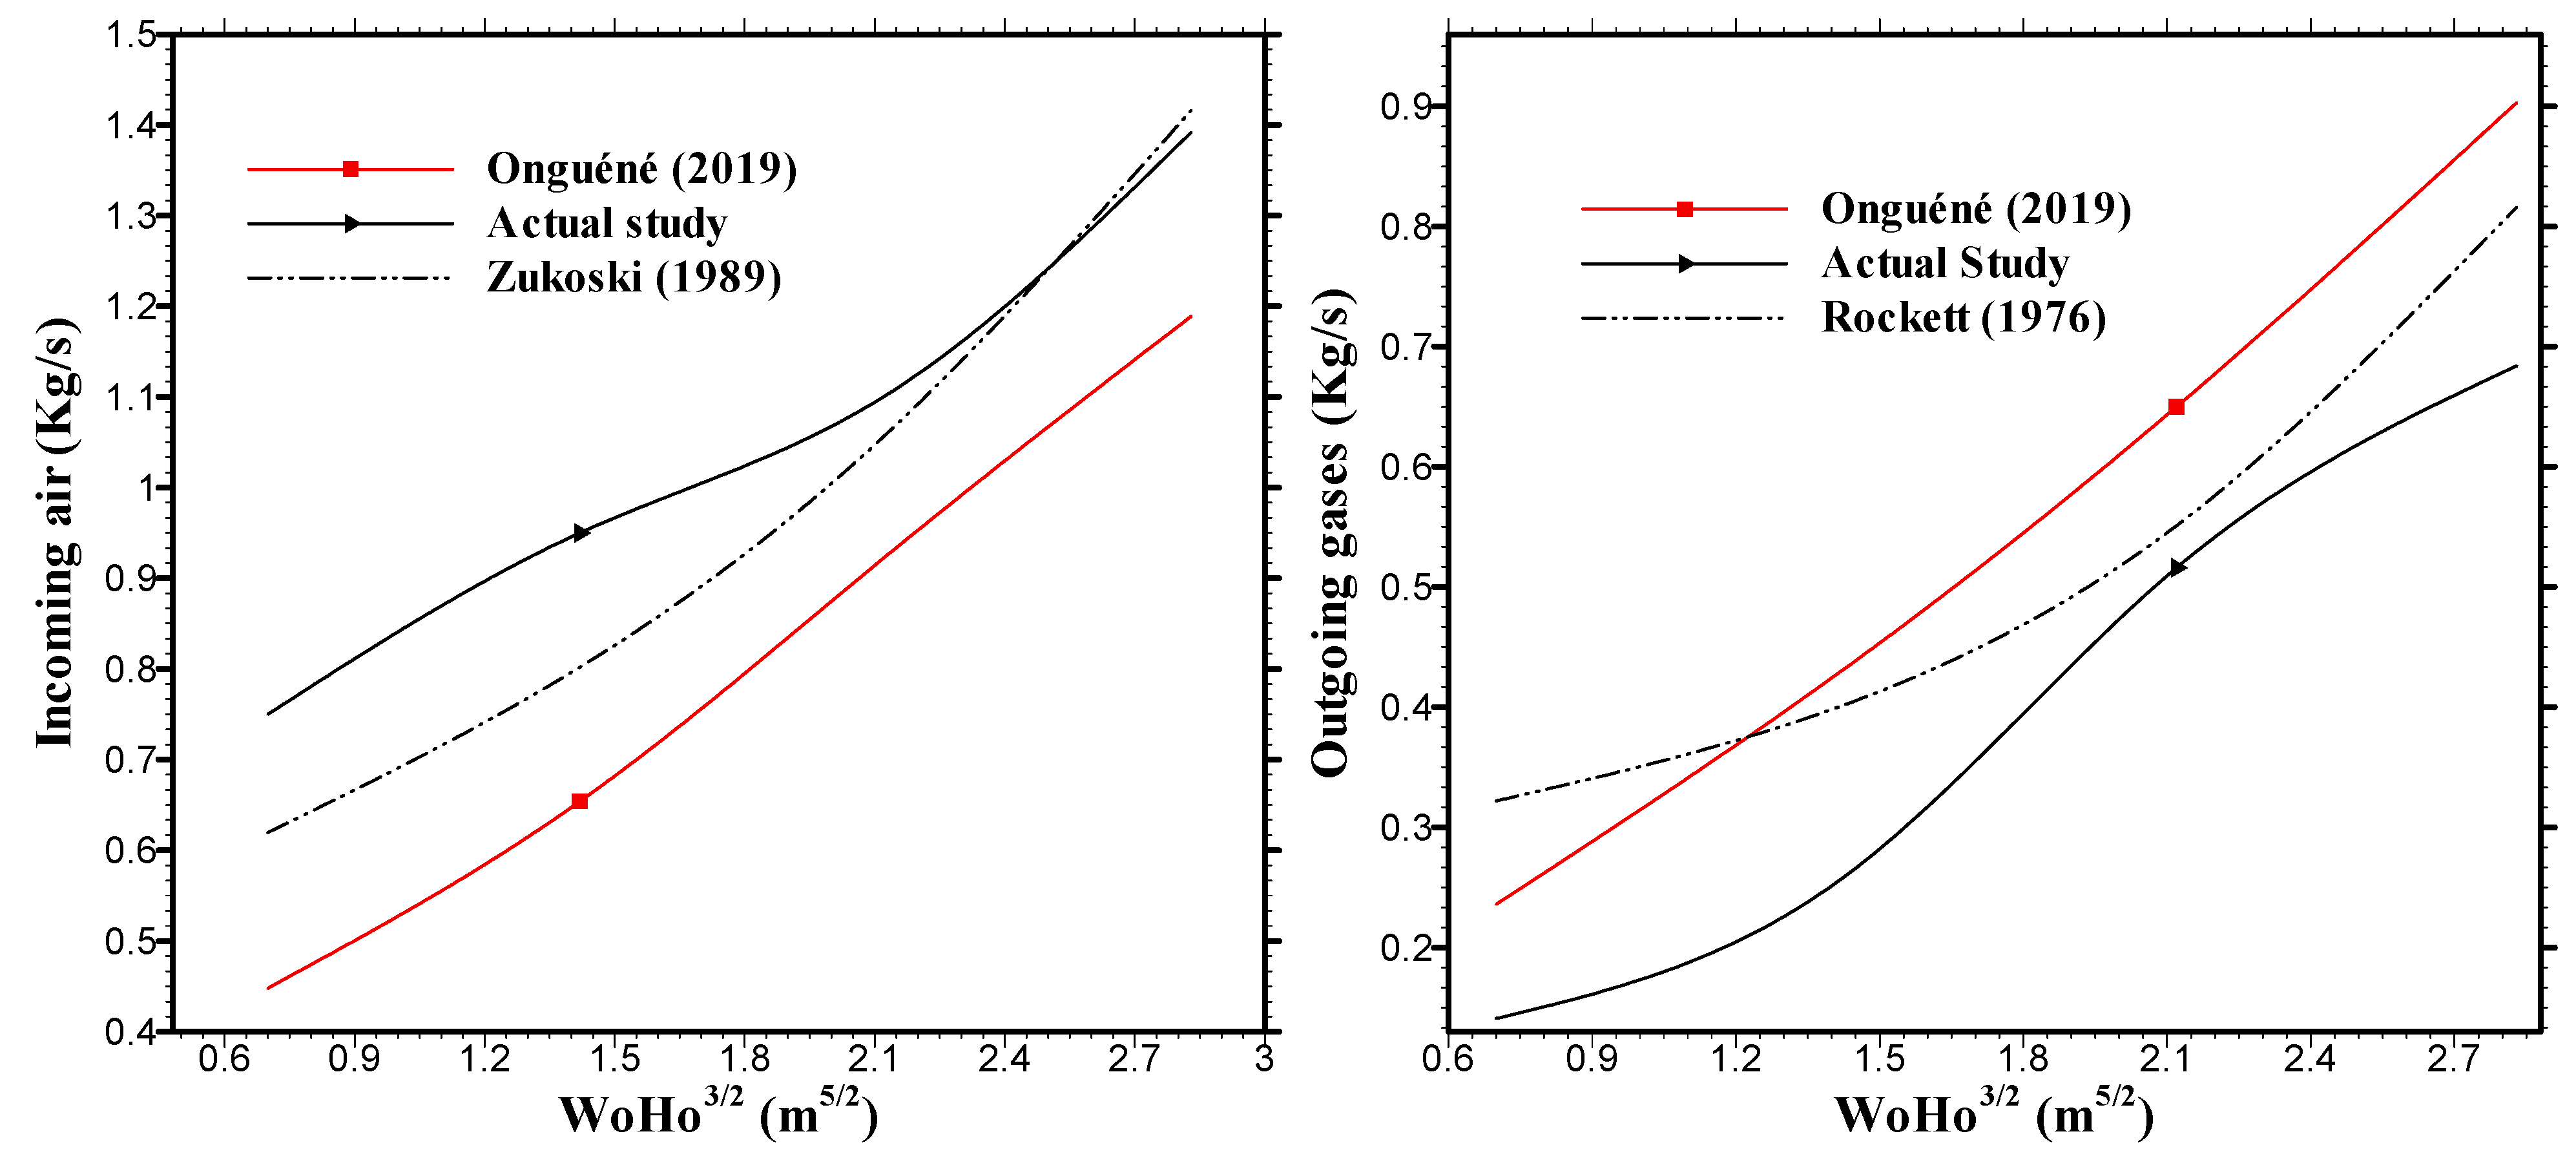
Figure 9.
Influence of the ventilation factor on the heat release rate taking into account the width of the opening.
Figure 9.
Influence of the ventilation factor on the heat release rate taking into account the width of the opening.

Table 1.
Location of thermocouples in the experimental area.
| Thermocouples/Devices for Velocity | x [m] | y [m] | z [m] |
|---|---|---|---|
| T1 | 0.35 | 0.06 | 0.06 |
| T2 | 0.35 | 0.06 | 0.12 |
| T3 | 0.35 | 0.06 | 0.17 |
| T4 | 0.35 | 0.06 | 0.22 |
| T5 | 0.35 | 0.06 | 0.27 |
| T6 | 0.35 | 0.06 | 0.32 |
| T7 | 0.35 | 0.06 | 0.37 |
| T8 | 0.35 | 0.06 | 0.41 |
| T09–Vel 01 | 0.48 | 0.22 | 0.10 |
| T10–Vel 02 | 0.48 | 0.22 | 0.15 |
| T11–Vel 03 | 0.48 | 0.22 | 0.20 |
| T12–Vel 04 | 0.48 | 0.22 | 0.25 |
| T13–Vel 05 | 0.48 | 0.22 | 0.30 |
| T14–Vel 06 | 0.48 | 0.22 | 0.35 |
| T15–Vel 07 | 0.48 | 0.22 | 0.39 |
Table 2.
Influence of mesh size on flame temperature [19].
Table 2.
Influence of mesh size on flame temperature [19].
| Case Study | Mesh Size | Temperature |
|---|---|---|
| Simulation 1 | 0.20 × 0.20 × 0.20 | 479 °C |
| Simulation 2 | 0.14 × 0.14 × 0.14 | 593 °C |
| Simulation 3 | 0.10 × 0.10 × 0.10 | 962 °C |
| Simulation 4 | 0.08 × 0.08 × 0.08 | 967 °C |
Table 3.
Details of simulation parameters.
| Parameters | Simulations (1, 2, 3 and 4) |
|---|---|
| Initial temperatures (°C) | 20.0 |
| Relative humidity (%) | 40 |
| Typical simulation | LES, transient |
| The geometry of the domain (m3) | |
| Simulation time (s) | 1000 |
| Mesh sizes (m) | |
| Turbulence | Smagorinsky model |
| Smagorinsky constant | |
| Radiation loss fraction | 0.25 |
| Input | HRRUA |
| Boundary conditions | Convection–Conduction ( |
Table 4.
Combustion time and fuel mass loss rate of each scene.
| H0 [m] | W0 [m] | [s] | ||||
|---|---|---|---|---|---|---|
| Scene 1 | 0.40 | 0.20 | 0.051 | 564 | 1.0691 | 1.1639 |
| Scene 2 | 0.40 | 0.15 | 0.038 | 523 | 1.1529 | 1.2551 |
| Scene 3 | 0.40 | 0.10 | 0.025 | 456 | 1.3224 | 1.4396 |
| Scene 4 | 0.40 | 0.075 | 0.019 | 556 | 1.0845 | 1.1806 |
Table 5.
Analysis of temperature curve values.
| Euclidean Standard | ||||
|---|---|---|---|---|
| Greatness | Scene 1: W = 0.2 m | Scene 2: W = 0.15 m | Scene 3: W = 0.10 m | Scene 4: W = 0.075 m |
| 651.93 | 729.04 | 793.42 | 732.65 | |
| 640.98 | 724.02 | 789.42 | 733.71 | |
| 1.68 | 0.27 | 0.5 | -0.14 | |
| 0.999 | 0.998 | 0.999 | 0.999 | |
| 651.93 | 729.04 | 793.42 | 732.65 | |
| 650.31 | 667.53 | 763.11 | 763.56 | |
| 0.24 | 8.43 | 3.82 | -4.21 | |
| 0.99 | 0.997 | 0.998 | 0.999 | |
Table 6.
Analysis of velocity curve values.
| Euclidean Standard | ||||||||
|---|---|---|---|---|---|---|---|---|
| Greatness | Scene 1: W = 0.2 m | Scene 2: W = 0.15 m | Scene 3: W = 0.10 m | Scene 4: W = 0.075 m | ||||
| Inc.air | Out.gases | Inc.air | Out.gases | Inc.air | Out.gases | Inc.air | Out.gases | |
| 0.571 | 0.19 | 0.678 | 0.299 | 0.878 | 0.137 | 0.930 | 0.161 | |
| 0.543 | 0.29 | 0.686 | 0.318 | 0.819 | 0.249 | 0.931 | 0.174 | |
| Ecart relatif ( | 2.87 | −10.12 | −0.86 | −1.87 | 5.86 | −11.19 | −0.08 | −1.36 |
| 0.99 | 0.99 | 0.99 | 0.99 | 0.99 | 0.98 | 0.99 | 0.97 | |
Table 7.
Maximum fluid heights and velocities at the small-scale gate.
| Scene 1 | 0.051 | 4.19 | 0.28 | 0.37 | 0.12 | 0.39 |
| Scene 2 | 0.038 | 4.51 | 0.24 | 0.44 | 0.16 | 0.31 |
| Scene 3 | 0.025 | 5.17 | 0.25 | 0.55 | 0.15 | 0.25 |
| Scene 4 | 0.019 | 4.24 | 0.25 | 0.57 | 0.15 | 0.18 |
Table 8.
Characteristics of incoming and outgoing fluids at full scale.
| Scene | [KW] | [m2] | [m/s] | [kg/s] | [m2] | [m/s] | [kg/s] | |
|---|---|---|---|---|---|---|---|---|
| Scene 1 | 2.83 | 235.4 | 1.35 | 0.825 | 1.392 | 0.63 | 0.869 | 0.684 |
| Scene 2 | 2.12 | 253.4 | 0.90 | 0.984 | 1.100 | 0.60 | 0.691 | 0.516 |
| Scene 3 | 1.42 | 290.4 | 0.62 | 1.226 | 0.950 | 0.37 | 0.557 | 0.257 |
| Scene 4 | 0.70 | 238.2 | 0.46 | 1.271 | 0.750 | 0.28 | 0.401 | 0.141 |
Disclaimer/Publisher’s Note: The statements, opinions and data contained in all publications are solely those of the individual author(s) and contributor(s) and not of MDPI and/or the editor(s). MDPI and/or the editor(s) disclaim responsibility for any injury to people or property resulting from any ideas, methods, instructions or products referred to in the content. |
© 2023 by the authors. Licensee MDPI, Basel, Switzerland. This article is an open access article distributed under the terms and conditions of the Creative Commons Attribution (CC BY) license (https://creativecommons.org/licenses/by/4.0/).
Share and Cite
MDPI and ACS Style
Iya, A.E.-k.; Epée, A.F.; Mvogo, P.O.; Zaida, J.T.; Mouangue, R. Modelling and Numerical Simulation of a Compartment Fire: Flow Rate Behaviour at Opening. Fire 2023, 6, 185. https://doi.org/10.3390/fire6050185
AMA Style
Iya AE-k, Epée AF, Mvogo PO, Zaida JT, Mouangue R. Modelling and Numerical Simulation of a Compartment Fire: Flow Rate Behaviour at Opening. Fire. 2023; 6(5):185. https://doi.org/10.3390/fire6050185
Chicago/Turabian StyleIya, Ahmed El-kebir, Alban Fabrice Epée, Philippe Onguéné Mvogo, Justin Tégawendé Zaida, and Ruben Mouangue. 2023. "Modelling and Numerical Simulation of a Compartment Fire: Flow Rate Behaviour at Opening" Fire 6, no. 5: 185. https://doi.org/10.3390/fire6050185