
Reliability Analysis of a Building Real Fire Simulation Training System
by
Zhian Huang
1,2,*, 
Rongxia Yu
1,
Yang Huang
1,
Jinyang Li
1,
Hao Ding
1,3,*,
Yukun Lei
1,
Pengfei Wang
2 and
Danish Jameel
1 1
State Key Laboratory of High-Efficient Mining and Safety of Metal Mines Ministry of Education, University of Science and Technology Beijing, Beijing 100083, China
2
Work Safety Key Laboratory on Prevention and Control of Gas and Roof Disasters for Southern Coal Mines, Hunan University of Science and Technology, Xiangtan 411201, China
3
Institute of Risk Assessment and Control, Guangdong Technology Center of Work Safety Company Limited, Guangzhou 519000, China
*
Authors to whom correspondence should be addressed.
Fire 2023, 6(10), 369; https://doi.org/10.3390/fire6100369
Submission received: 2 August 2023
/
Revised: 15 September 2023
/
Accepted: 19 September 2023
/
Published: 23 September 2023
(This article belongs to the Special Issue Probabilistic Risk Assessments in Fire Protection Engineering)
Abstract
:Real fire simulation training systems have gradually become an important method of emergency rescue team training and improvement. However, the failure rate of such systems is high, which threatens the safety of the trainers. Therefore, this study takes a real fire simulation training scenario as the research object and analyzes the system structure of the real fire simulation training base. The system structure of the real fire simulation training base is analyzed and divided into three systems: a smoke and heat training room, a combustion training room, and a water, oil, and gas supply. Then, a reliability model is established, and the reliability is determined. The main structures affecting the reliability of the system are identified, and an optimization plan for improving the structure is proposed. The results show that the combustion training room is the least reliable of the three parts in the real fire simulation training base. The series link in the system structure should be reduced as much as possible to meet the training requirements while the parallel link should be increased, and a reserve system should be added if necessary.
1. Introduction
During the period 1993–2015, 86.4 million accidental fires around the world caused more than 1 million deaths [1], and, globally, fire hazards caused a total annual loss of 1% of the world’s GDP (approximately USD 857.9 bn) [2,3]. Worldwide, an average of 3.8 million fires caused 44,300 deaths each year [1]. In 2010–2014, developed countries such as the USA suffered the highest number of fires (600,000–1,500,000 per year) and the second highest number of fire deaths (1000–10,000 per year), while the highest number of fire causalities (10,000–25,000 per year) and the second highest number of fires (100,000–600,000 per year) occurred in developing countries, such as India and Pakistan [4]. Fires seriously endanger the safety of people, the national economy, and the ecological environment, and cause a large amount of societal instability [5,6]. Fires mostly occur in enclosed spaces such as homes, hotels, shopping malls, and building construction sites, where numerous combustible materials, as well as the use of open architecture (glass partitions, false ceilings, etc.), can cause rapid fire growth and spread [7]. Combined with the blockage of evacuation routes, etc., this makes firefighting and rescue activities severely limited [8]. Therefore, it is necessary to establish a real fire simulation training scenario in a fire training base and use the scene to help trainees improve their fire emergency rescue ability. On this basis, a reliability analysis of the real fire simulation training scenario is essential.
In the 1960s, Bell Labs, Boeing, and others conducted in-depth analyses of fault-tree-based reliability studies. Fault tree analysis was added to military intercontinental missile systems and civil aircraft designs to identify causes of system failure and find the best solutions to reduce the probability of failure as a way to improve the stability of system operations [9,10,11]. In the 1990s, some European scholars started to use reliability studies for nuclear power safety research. The European Nuclear Energy Agency (ENEA) proposed the REPAS method to reliably evaluate nuclear power plants with nonenergetic systems after a thorough study, which laid the foundation for the development of nuclear power reliability [12,13,14,15]. As the importance of reliability studies of complex systems increased, many scholars began to turn to system studies with more complex reliability theories. Collen et al. [16] proposed a signature for analyzing complex systems with multiple types of components and quickly promoted it as an important industry standard. Borgonov et al. [17] proposed a reliability importance measure for coherent and noncoherent systems, which is an important contribution to the field of time-varying reliability analysis. Tan Changqing et al. [18,19] performed reliability studies on data communication systems in column control systems by means of a new frequency allocation scheme.
In the 1970s, some companies in the United States developed real fire simulation training facilities according to the relevant standards. The real fire simulation training system developed in the UK, which is at a leading technological level, has been able to simulate a large number of scenarios such as high rise, underground, chemical, and blasting [20]. Australia has incorporated simulated combustion training, simulated smoke training, and simulated collapse training into the daily training of firefighters to improve their emergency response [21]. However, China’s real fire simulation training facilities are still at a relatively rudimentary stage. Although leaders at all hierarchical levels attach great importance to safety in fire training, there are still many blind spots in how to build training facilities and ensure the safety of trainees. This seriously hinders the improvement of the training level of rescue capabilities of emergency rescue forces.
This study takes a real fire simulation training scenario in the fire training base as the research object and analyzes the reliability of the training scenario in terms of training equipment and site environment based on reliability theory. By constructing the reliability model of the real fire simulation training scenario, the reliability of the real fire simulation training system is solved and analyzed. On the basis of complying with relevant laws and regulations [22,23,24], the improvement suggestions are put forward at the system structure level.
2. Analysis of Basic Reliability Theory
The study of reliability theory and the analysis of system structure are prerequisites for the establishment of a system reliability model. Therefore, basic reliability theory and mathematical model-building methods need to be studied, and the structure of building real fire simulation training systems also needs to be analyzed to prepare for the model building and analysis.
With the development of industrial technology, reliability has become one of the main indicators of industrial product competition. Qualitatively, reliability means the ability of a device to perform a required function for a stated time interval under given conditions [25]. From a quantitative point of view, reliability is the probability that no operational interruption will occur within a specified time interval. However, it does not mean that redundant parts may not fail, but rather that these components can be repaired after failure; so, reliability theory can be used in repairable as well as nonrepairable systems [26].
2.1. Classification of Reliability Systems
A system refers to a specific group consisting of several parts interconnected and interacting with each other with certain functions. Therefore, reliability theory is applicable to a variety of products, subsystems, equipment, components, and parts [27]. In practical engineering applications, there will be many systems that can be repaired so that the concept of repairability is introduced. Due to the establishment of repairability, reliability systems can be divided into repairable and nonrepairable systems.
The classification of reliability systems is based on whether the components are repairable in the working condition, so it does not mean components are completely irreparable. For example, a train component can be repaired after arriving at a station when it breaks down, but it cannot be repaired while moving, so it can also be considered a nonrepairable system. After making the assumption of irreparability, the system becomes simpler and easier to model and analyze. The system studied in this study is a nonrepairable system.
2.2. System Reliability Indicators
Reliability, when described qualitatively, refers to the ability of the object of study to perform the intended function, and it can be quantified by the introduction of different characteristic quantities [28]. The irreparable system studied in this study has many characteristic parameters such as reliability, failure rate, and average lifetime.
2.2.1. Reliability [29,30]
Reliability refers to the probability of a product completing a predetermined function under specified time and conditions, which is generally recorded as R. It can change with time, so it is recorded as R(t). We assume that the time to failure T is continuously distributed with probability density function f(t) and distribution function:
F(t) thus denotes the probability that the item fails within the time interval (0, t). The probability density function f(t) is defined as:
Then the reliability function of an item is defined by:
2.2.2. Failure Rate [30]
Failure rate means the probability that an item will fail (t, t + ), divided by the time interval. The function is shown in:
Since:
Then:
Since R(0) = 1, then:
And:
When the failure rate is a constant , the expression for the reliability is given by:
2.2.3. Average Lifetime
The average lifetime refers to the average value of the time T from the beginning of the system to the completion of the scheduled function. Its main distribution modes include exponential distribution, normal distribution, log-normal distribution, Poisson distribution, and binomial distribution. The average lifetime of the systems studied in this research conforms to an exponential distribution.
2.3. Reliability of the Irreparable System
A system being irreparable means that components cannot be repaired or replaced in a timely manner when they break down. The training system in this study cannot be replaced in a timely manner due to the failure during the training process, so it is considered a nonrepairable system. The structure of the irreparable system can be divided into series, parallel, mixed, and voting systems, whose mathematical models of reliability are shown in Table 1.
3. Structural Analysis and Reliability Model Establishment of the Building Real Fire Simulation Training System
The site involved in the analysis of this study is a large domestic real fire simulation training base in China. The real fire simulation training base consists of a combustion training room and a fume–heat training room and is equipped with complete water, oil, and gas supply facilities. Propane gas and diesel fuel are used in the combustion training room, which allows for the development of different forms of fire for training.
Reliability modeling and analysis is the focus of reliability research and is a critical step in transforming reliability research from theory to practical application. By modeling the reliability of the research object, the real system can be abstracted into a model that can be analyzed. For the purpose of analyzing the reliability of a system, some of the most widely used techniques are the Reliability Block Diagram (RBD) [31], fault tree (FT) [32], Markov Chain (MC) [33], and Monte Carlo simulation [34].
The RBD method is a graphical means of evaluating the relationship between different parts of the system that is usually used for reliability modeling [35]. According to logical relationships, it connects systems and components in series-parallel, voting systems, and reserve systems as a way to carry out a reliability analysis and find the solution to the system.
3.1. Structural Analysis of the Fume–Heat Training Room
3.1.1. Heating System
The heating system consists of four groups of industrial air heater systems, which can quickly heat up the room. The heat blower can produce a high temperature of 60 °C near the air outlet, which simulates the heat of a fire. Each group of industrial heater systems is connected to a heat generator by an electric button or manual operation. Both the electric control button and the manual operation can turn on the heat generator separately.
All four industrial heater systems operate independently, with no interference from each other as shown in Figure 1. During the training process, at least three industrial heater systems need to work properly to keep the smoke and heat chamber in good operating condition.
3.1.2. Fuming System
The fuming device also consists of four groups of industrial fume generator systems, which can eject smoke harmless to humans, make the whole training room quickly fill with smoke, and choose different gas release concentrations according to different training requirements. Each group of industrial fume generator systems connects to the fume emitter by electric button or manual operation. The electric control button and manual operation can open the fume generator individually.
As shown in Figure 2, during the training process, all groups of industrial fume generator systems operate independently, without any interaction. Also, at least three fume generator systems need to be working properly to keep the smoke and heat chamber in normal working condition.
3.1.3. Air Supply and Exhaust System
As shown in Figure 3, the air supply and exhaust system consists of two supply fans and four exhaust fans, which can quickly discharge harmful gases and deliver fresh air to the room. The fan capacity is greater than 5000 m3/h. Each fan is independent and controlled by an electric switch. In the training process, at least one supply fan and two exhaust fans need to work in order to successfully complete the tasks.
3.1.4. Strobe Light System
A strobe light system simulates disaster scenarios and strengthens the visual effect to enhance the tension of the entire training process. As shown in Figure 4, all of the strobe lights are controlled by a button; if one strobe light does not work, the rest cannot.
3.1.5. Sound System
The training room is equipped with high-powered speakers that can be used to play the sound of explosions, shouting, and other disaster scenarios. It can also control the training process by giving instructions and dialoguing with training personnel, etc.
As shown in Figure 5, the sound system consists of three independent and individually controlled audio elements. In the actual training process, only one is needed to meet the training requirements.
3.1.6. Thermostat System
The thermostat system detects the temperature of the room at two locations and calculates the average temperature of the room. As shown in Figure 6, the thermostat system consists of two independent thermostat structures containing a thermostat and a temperature monitor device. The thermostat system is composed of two separate structures, so only one structure needs to be operational for the entire system to function properly.
3.1.7. Reliability Model Analysis of the Fume–Heat Training Room
Although each facility in a fuming heat room operates independently and other systems can still work when a single system is damaged, all systems need to be in working condition for the fuming heat training room to work properly. Therefore, the RBD of the fuming heat training room should be a serial structure, and this is shown in Figure 7.
3.2. Structural Analysis of the Combustion Training Room
3.2.1. Ground Flow Fire System
A ground flow fire system consists of two groups of oil injectors and ignition systems and water spray systems as shown in Figure 8. When the oil and gas sprayed by the oil injector reach the demand amount, the ignition indicator lights up, which means the ignition system can be started. Finally, it can be stopped by pressing the button. The water spraying system works separately.
In practice, the starting device is triggered first and then controls two oil supply valves to open, which allows the nozzles to spray oil. The ignition indicator lights up upon reaching the ignitable state, at which point the ignition device is triggered to fire. The facility is finally shut down via the shut-off button. Two oil supply values control four nozzles that form a parallel system, and the oil supply systems are in the same position. Therefore, four nozzles are needed to supply oil so that the system can work normally.
The injector and ignition system 1 has two working conditions: (1) one of the two oil supply valves is in working condition, the other is not in working condition, and the four nozzles behind any oil supply valve are all in working condition, and (2) the two valves are open and at least four of the eight nozzles need to work. For injector and ignition system 2, two of the four nozzles controlled by the oil supply valve need to be in normal operation. At least one nozzle in the water spray system 1 and 2 need to be in working condition.
3.2.2. Hearth Fire System
A hearth fire system consists of a gas ignition system, an oil injection ignition system, and a spray system as shown in Figure 9. These systems are independent of each other, and the operation rules are identical to the ground flow fire system. Practically, both the gas ignition system and oil injection ignition system can trigger ignition, but the spray system must be in working condition. The gas ignition system and oil injection and ignition system can complete the work when two nozzles are in a working state.
3.2.3. Flaring System
A flaring system consists of an ignition system as shown in Figure 10. The flaring process starts with the opening of a starting device that releases gas. The detection indicator lights up upon reaching the specified concentration. Then, the judgment device is allowed to determine whether it can be ignited. Finally, the ignition device can be operated to initiate combustion. The system needs at least four nozzles to be in working condition.
3.2.4. Combustion Bed System
As shown in Figure 11, the combustion bed system consists of two identical groups of gas ignition systems, two identical groups of spraying systems, and a group of water pipes with holes. At least one of the two combustion systems needs to be fully operational, and the perforated hose needs to work at all times.
The gas ignition system needs at least four nozzles and the water spray system needs at least two nozzles to be in working condition. The water pipe system needs at least two auxiliary pipelines and one main pipeline to work normally.
3.2.5. Stair Fire and TV Fire System
The ignition process of a stair fire and TV fire is identical to a ground flow fire, but the structure is not the same. As shown in Figure 12, a stair fire is composed of a gas ignition system and three spraying systems, which are independent of each other. Due to the upward spreading trend of the stair fire and the three spraying systems being located at different steps, a gas ignition system and the three spraying systems need to be in working condition. A TV fire system consists of a gas ignition system and a spraying system, and the structure of each part is similar to the stair fire. The gas ignition system requires at least two nozzles to be in working condition and at least one nozzle in each water spray system must be in working condition to complete the training task.
3.2.6. Reliability Model Analysis of the Combustion Training Room
Each facility in the combustion room operates independently, and other systems can still work when a single system is damaged, but all systems need to be in working condition for the combustion training room to work. Therefore, the RBD of the combustion training room should be a serial structure, as shown in Figure 13.
3.3. Structural Analysis of the Water, Oil, and Gas Supply System
3.3.1. Water Supply System and Oil Supply System
As shown in Figure 14, both the water supply system and the oil supply system are composed of a storage tank, a pressure pump, a control valve, and a main pipeline.
3.3.2. Gas Supply System
A gas supply system consists of four independent gas storage cylinders that connect with control valves and the main pipeline as shown in Figure 15. It is used to supply the various gases required in training.
3.3.3. Reliability Model Analysis of the Water, Oil and Gas Supply System
When the water supply system, oil supply system, and gas supply system all work, the water, oil, and gas supply system can be considered to be in working condition. Therefore, the RBD of the water, oil, and gas supply system should be a series structure, as shown in Figure 16.
3.4. Reliability Model Establishment of the Building Real Fire Simulation Training System
Based on reliability theory combined with the structural analysis of each system in the fume–heat training room, combustion training room, and the water, oil, and gas supply system, the RBD of each system was drawn. Thus, the reliability model of each system was established, as shown in Table 2.
4. Reliability Analysis of the Building Real Fire Simulation Training System
The reliability results of each system can be obtained by substituting the field data into the mathematical model. The corresponding conclusions can be drawn by analyzing the calculation results of each system.
4.1. Failure Rate of Key Components
Table 3 shows the basic failure rate of each key component in the smoke and heat training room, combustion training room, and the water, oil, and gas supply system, denoted as . However, in the actual application process, the different environments will have different effects on the components’ failure rate. Therefore, the average failure rate of each component is taken in the calculation. Since the correction factor of the ground fixed equipment ranges from 5 to 20, the correction factor K is taken as 5, 10, 15, and 20, respectively. The worse the working environment is, the greater the correction coefficient is. The corrected failure rate .
4.2. Reliability Results Analysis of the Fume–Heat Training Room
Extensive data show that the basic failure rate of each key component in the fume–heat training chamber does not change over time. Therefore, reliability follows an exponential distribution with respect to the failure rate. The relational expression is given by Equation (9), and the reliability of each system in the fume–heat training room can be solved.
The reliability of each system was calculated by taking 200 h, 400 h, 600 h, 800 h, 1000 h, 1200 h, 1400 h, 1600 h, 1800 h, and 2000 h. The change curve of the reliability of each system with the increase in usage time and the correction factor is shown in Figure 17. When the correction factor is constant, the failure rate of each system gradually increases, and the reliability decreases as the working time increases. At the same time, the larger the correction factor, the harsher the working environment, the higher the failure rate of the system, and the lower the reliability.
The reliability curves of each system in the fume–heat training room with a correction factor k of 15 are shown in Figure 18. In the case of k = 15, the systems have increasing failure rates and decreasing reliability as the operating time grows. The t reliability of the fume–heat training room is the lowest. The proper operation of the fume–heat training room system requires all subsystems forming a series structure to operate normally, so the reliability of the system is lower than each subsystem. The reliability of fume–heat training room systems has been lower than 0.7 at 1400 h with a high probability of failure, which affects the system operation.
Among the basic structures, the strobe light system has the lowest reliability because of the series structure and the low reliability of the components. It is the key part that affects the reliability of the whole system. Therefore, it is necessary to focus on improving the structure of the strobe system. Strobe lights can be changed to every two strobe lights in series and then act in parallel with other strobe lights, forming a structure with fewer series and more parallel connections, as shown in Figure 19, which can significantly improve the reliability of the strobe light system.
The reliability of the heating system and fuming system varies little in the early stage and then starts to increase when the working time exceeds 800 h. Therefore, it is necessary to check and maintain the heating and fuming devices after a long period of use to ensure that they are working properly.
The sound system has the highest reliability and is the most stable part of the fume–heat training system. Therefore, the time interval of inspection and maintenance can be extended appropriately for the sound system to reduce the workload of the overhaul.
4.3. Reliability Results Analysis of the Combustion Training Room
By analyzing each system of the combustion training room, we found that the characteristics of the variation curves of reliability with the increase in use time and correction factor are consistent with the fume–heat training room. When the environment factor is 15, the reliability variation curve of each system is shown in Figure 20.
Compared with the fume–heat training room, the reliability of the combustion training room is lower and is the most failure-prone part of the real fire simulation training system. Therefore, the verification of the structure of the combustion training chamber should be performed more frequently during the design of the real fire simulation training base. The reliability of the overall system can also be improved significantly by prioritizing the improvement of the basic structures in the combustion training room.
Among these basic structures, the flaring and stair fire systems have similarly low reliability, which is the main reason for the lower reliability of the whole system. The extensive use of series structures in the boom-fired system, where failure of any step will lead to the breakdown of the whole system, is the main reason for its low reliability. Therefore, a separate reserve system can be created by adding an additional ignition indicator and a flame-permitting determination device, as shown in Figure 21. The introduction of a reserve system allows for switching to a backup component in case of failure of the ignition indicator or the flaring permitting determination device, which results in increased structural stability and system reliability.
Because of the high number of spraying systems in a series structure that are required to be in working condition, the reliability of the stair system is greatly reduced. Since the spraying systems are in a different location, the special location dictates that the structure of the stair fire system cannot be changed significantly. Therefore, the number of nozzles can be increased to improve reliability. However, due to the high reliability of the nozzle itself, this approach has little effect on improving the overall reliability, so the reliability of the system can be improved through the use of more reliable key components and regular and timely maintenance of parts.
The ground flow fire system has the highest reliability. A large number of parallel structures are used, in which the nozzles are all parallel, and there are multiple oil and water supply systems, so the ground flow fire system has greater stability and reliability.
4.4. Reliability Results Analysis of the Water, Oil, and Gas Supply System
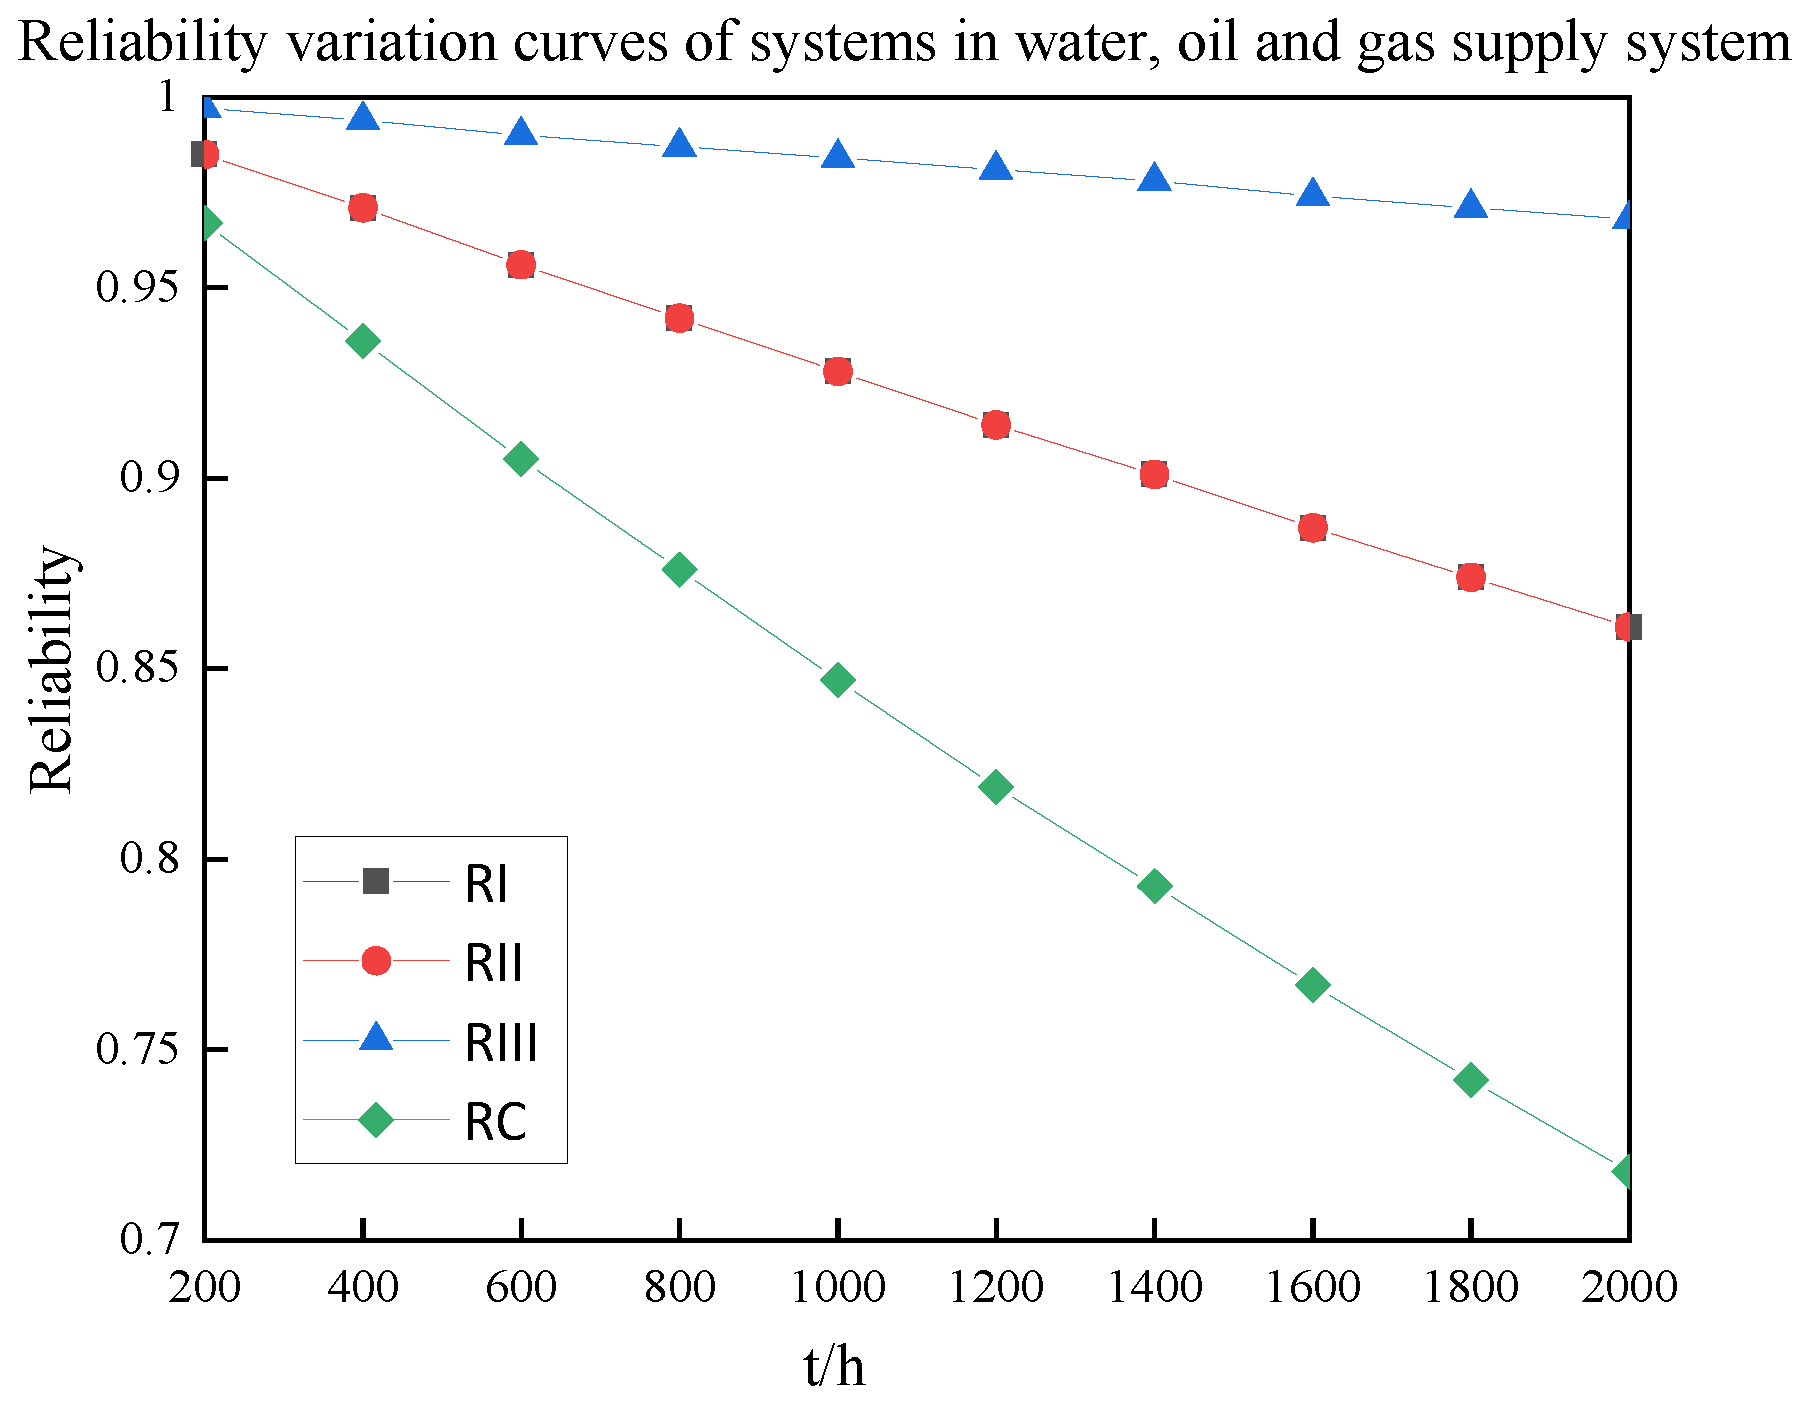
The simulation results of the water, oil, and gas system are consistent with the former and obey the same patterns. However, due to its relatively few structural components, it has higher reliability than the fume–heat training room system and the combustion training room system, which are always higher than 0.7, as shown in Figure 22. The reliability of the subsystems is also high. Therefore, it is the most stable part of the whole building real fire simulation system.
5. Conclusions
In this study, which is based on the basic reliability theory and the structural analysis of the building real fire simulation training base, a mathematical model of reliability was established, and the reliability of each system was solved. Through the analysis of the results, the following conclusions and related recommendations were drawn.
- (1)
- With a constant correction factor, the failure rate of each system gradually increases and the reliability decreases as the working time increases. At the same time, the larger the correction factor, the harsher the working environment, the higher the failure rate of the system, and the lower the reliability. The water, oil, and gas supply system has the highest reliability, while the combustion training room has the lowest reliability.
- (2)
- The structure with the lowest reliability in the fume–heat training room is the strobe light system. The strobe light system can be changed to a structure with more parallel connections and fewer series connections to improve its reliability. The frequency of maintenance should be increased for heating and fuming device systems after a long period of use to ensure their stability.
- (3)
- The least reliable structure in the combustion training room is the flaring system, which can be improved by introducing a reserve system. The components of a stair fire system need to be optimized to improve overall reliability.
- (4)
- Based on meeting the training requirements, the real fire simulation training system should try to reduce the series link, increase the parallel link, and add reserve systems as necessary. Components with high reliability should be selected as much as possible to increase the overall reliability when economic conditions allow.
Author Contributions
Conceptualization, Z.H. and R.Y.; methodology, Y.H.; software, Y.H.; validation, Z.H., R.Y., and J.L.; formal analysis, H.D.; investigation, Y.L.; resources, P.W.; data curation, D.J.; writing—original draft preparation, R.Y.; writing—review and editing, Z.H.; visualization, Y.H.; supervision, Z.H.; project administration, Z.H.; funding acquisition, P.W. All authors have read and agreed to the published version of the manuscript.
Funding
This research was funded by project Nos. 51974015 and 51474017 provided by the National Natural Science Foundation of China; project No. SMDPC202101 provided by the Key Laboratory of Mining Disaster Prevention and Control (Shandong University of Science and Technology); project No. FRF-IC-20-01 and No. FRF-IC-19-013 provided by the Fundamental Research Funds for the Central Universities; project No. 2018YFC0810601 provided by the National Key Research and Development Program of China; project No. 2020CXNL10 provided by the Fundamental Research Funds for the Central Universities (China University of Mining and Technology); project No. WS2018B03 provided by the State Key Laboratory Cultivation Base for Gas Geology and Gas Control (Henan Polytechnic University); and project No. E21724 provided by the Work Safety Key Lab on Prevention and Control of Gas and Roof Disasters for Southern Coal Mines of China (Hunan University of Science and Technology).
Institutional Review Board Statement
Not applicable.
Informed Consent Statement
Not applicable.
Data Availability Statement
Not applicable.
Conflicts of Interest
The authors declare no conflict of interest.
References
- Brushlinsky, N.N.; Ahrens, M.; Sokolov, S.V.; Wagner, P. World Fire Statistics, CTIF, International Association of Fire and Rescue Services, No. 22. 2017. Available online: www.ctif.org/sites/default/files/ctif_report22_world_fire_statistics_2017.pdf (accessed on 30 June 2019).
- Bulletin. World Fire Statistics, The Geneva Association, No. 29. 2014. Available online: www.genevaassociation.org/research-topics/world-fire-statistics-bulletin-no-29 (accessed on 30 June 2019).
- GDP. World Bank National Accounts Data, and OECD National Accounts Data Files. 2018. Available online: https://data.worldbank.org/indicator/NY.GDP.MKTP.CD (accessed on 30 June 2019).
- Brushlinsky, N.N.; Ahrens, M.; Sokolov, S.V.; Wagner, P. World Fire Statistics, CTF, International Association of Fire and Rescue Services, No. 21. 2016. Available online: www.ctif.org/sites/default/files/ctif_report21_world_fire_statistics_2016.pdf (accessed on 30 June 2019).
- Meng, Z.F. A brief overview of fires in the world. Fire Prot. Technol. Prod. Inf. 2011, 2, 91. [Google Scholar]
- Feng, Y.P. World fire statistics. Fire Prot. Technol. Prod. Inf. 2009, 3, 75–78. [Google Scholar]
- Kodur, V.; Kumar, P.; Rafi, M.M. Fire hazard in buildings, review, assessment and strategies for improving fire safety. J. PSU Res. Rev. 2019, 4, 1–23. [Google Scholar] [CrossRef]
- Cha, M.; Han, S.; Lee, J.; Choi, B. A virtual reality based fire training simulator integrated with fire dynamics data. Fire Saf. J. 2012, 50, 12–24. [Google Scholar] [CrossRef]
- Beresh, R.; Ciufo, J.; Anders, G. Basic fault tree analysis for use in protection reliability. Int. J. Reliab. Safe 2008, 2, 64–78. [Google Scholar] [CrossRef]
- Stamatelatos, M.; Vesely, W.; Dugan, J.; Fragola, J.; Minarick, J.; Railsback, J. Fault Tree Handbook with Aerospace Applications; NASA Office of Safety and Mission Assurance: Washington, DC, USA, 2002; pp. 109–112.
- Volkanovski, A.; Cepin, M.; Mavko, B. Application of the fault tree analysis for assessment of power system reliability. Reliab. Eng. Syst. Safe 2009, 94, 1116–1127. [Google Scholar] [CrossRef]
- Baig, A.A.; Ruzli, R.; Buang, A.B. Reliability analysis using fault tree analysis, a review. Int. J. Chem. Eng. Appl. 2013, 4, 169. [Google Scholar] [CrossRef]
- D’Auria, F.; Galassi, G.M. Methodology for the Evaluation of the Reliability of Passive Systems; University of Pisa: Pisa, Italy, 2000. [Google Scholar]
- Ricotti, M.E.; Bianchi, F.; Burgazzi, L.; D’Auria, F.; Galassi, G. The REPAS study, reliability evaluation of passive safety systems. Int. Conf. Nucl. Eng. 2002, 35960, 245–254. [Google Scholar]
- Jafari, J.; D’Auria, F.; Kazeminejad, H.; Davilu, H. Reliability evaluation of a natural circulation system. Nucl. Eng. Des. 2003, 224, 79–104. [Google Scholar] [CrossRef]
- Coolen, F.P.A.; Coolen-Maturi, T. Generalizing the Signature to Systems with Multiple Types of Components. In Complex Systems and Dependability; Zamojski, W., Mazurkiewicz, J., Eds.; Springer Science & Business Media: Berlin/Heidelberg, Germany, 2012; Volume 170, pp. 115–130. [Google Scholar]
- Borgonovo, E.; Aliee, H.; Glaß, M.; Teich, J. A new time-independent reliability importance measure. Eur. J. Oper. Res. 2016, 254, 427–442. [Google Scholar] [CrossRef]
- Nguyen, K.; Beugin, J.; Berbineau, M.; Kassab, M. Modelling Communication Based Train control system for dependability analysis of the LTE Communication network in train control application. In Proceedings of the 2014 European Modelling Symposium, Pisa, Italy, 21–23 October 2014. [Google Scholar]
- Tan, C.Q.; Zhang, X.; Zheng, G.X. A method to improve the reliability of CBTC wireless lin. In Proceedings of the IET International Communication Conference on Wireless Mobile and Computing (CCWMC), Shanghai, China, 7–9 December 2009. [Google Scholar]
- Ebersole, J.F.; Furlong, T.J.; Ebersole Jr, J.F. Method of Generating Three-Dimensional Fire and Smoke Plume for Graphical Display. U.S. Patent 6,809,743, 26 October 2004. [Google Scholar]
- Qiu, P.F.; Hao, A.L. Study on the development status of foreign fire safety engineering technology standards. J. Eng. Constr. Stand. 2014, 6, 53–56. [Google Scholar]
- Ministry of Public Security of the People’s Republic of China. Guide for Fire Training Safety, People’s Republic of China Public Safety Industry Standard GA/T 967-2011; Standards Press of China: Beijing, China, 2011. [Google Scholar]
- The Ministry of Public Security of the People’s Republic of China, People’s Republic of China. Public Safety Industry Standard GA/T 623-2006: Standard on Training Facility Construction for Fire Services Training Center; Standards Press of China: Beijing, China, 2006; pp. 1–8. [Google Scholar]
- National People’s Congress Standing Committee. Fire Protection Law of the People’s Republic of China; China Legal Publishing House: Beijing, China, 2021. [Google Scholar]
- Ram, M. On system reliability approaches, a brief survey. Int. J. Syst. Assur. Eng. 2013, 4, 101–117. [Google Scholar] [CrossRef]
- Birolini, A. Basic Concepts, Quality & Reliability (RAMS) Assurance of Complex Equipment & Systems. In Reliability Engineering; Springer: Berlin/Heidelberg, Germany, 2017; pp. 1–24. [Google Scholar]
- Breneman, J.E.; Sahay, C.; Lewis, E.E. Introduction to Reliability Engineering; John Wiley & Sons: Hoboken, NJ, USA, 2022; pp. 1–8. [Google Scholar]
- Bourouni, K. Availability assessment of a reverse osmosis plant, comparison between reliability block diagram and fault tree analysis methods. Desalination 2013, 313, 66–76. [Google Scholar] [CrossRef]
- Souza, F.A.; de Paula, H.; Cardoso Filho, B.J.; Rocha, A.V.; Lobato, G.I. Influence of environmental factors on the reliability of electronic components used in motor drive systems. In Proceedings of the 2013 Brazilian Power Electronics Conference, Gramado, Brazil, 27–31 October 2013. [Google Scholar]
- Rausand, M.; Hoyland, A. System Reliability Theory: Models, Statistical Methods, and Applications; John Wiley & Sons: Hoboken, NJ, USA, 2003; pp. 15–19. [Google Scholar]
- Čepin, M. Assessment of Power System Reliability, Methods and Applications; Springer Science & Business Media: Berlin/Heidelberg, Germany, 2011; pp. 119–123. [Google Scholar]
- Ruijters, E.; Stoelinga, M. Fault tree analysis, A survey of the state-of-the-art in modeling. Anal. Tools Comput. Sci. Rev. 2015, 15, 29–62. [Google Scholar] [CrossRef]
- Kim, M.C. Reliability block diagram with general gates and its application to system reliability analysis. Ann. Nucl. Energy 2011, 38, 2456–2461. [Google Scholar] [CrossRef]
- Kaczor, G.; Młynarski, S.; Szkoda, M. Verification of safety integrity level with the application of Monte Carlo simulation and reliability block diagrams. J. Loss Prev. Process Ind. 2016, 41, 31–39. [Google Scholar] [CrossRef]
- Verma, A.K.; Ajit, S.; Karanki, D.R. Reliability and Safety Engineering; Springer: London, UK, 2010; pp. 373–392. [Google Scholar]
Figure 1.
RBD of the heating system.
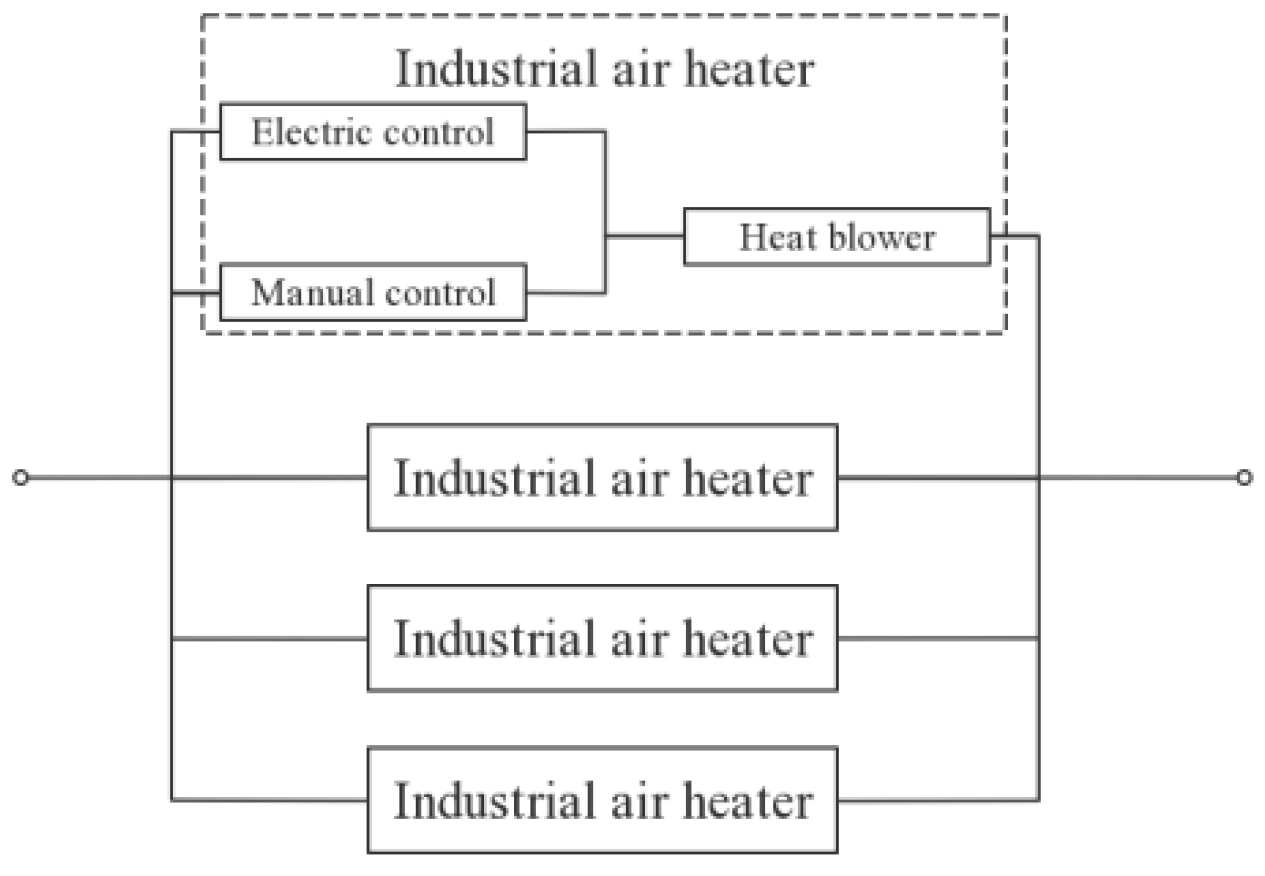
Figure 2.
RBD of the fuming system.

Figure 3.
RBD of the air supply and exhaust system.

Figure 4.
RBD of the strobe light system.

Figure 5.
RBD of the sound system.
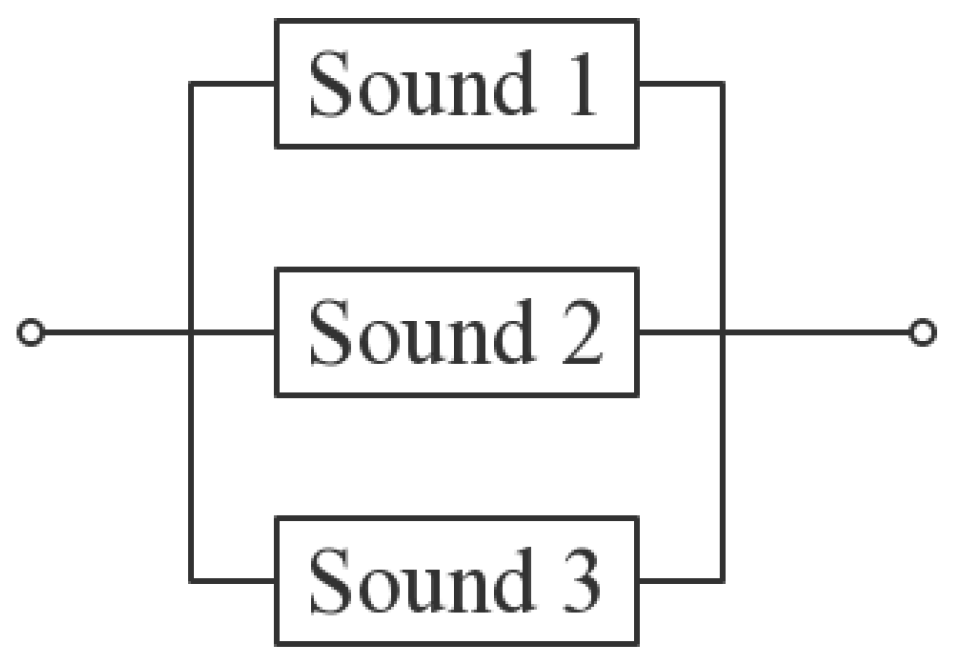
Figure 6.
RBD of the thermostat system.
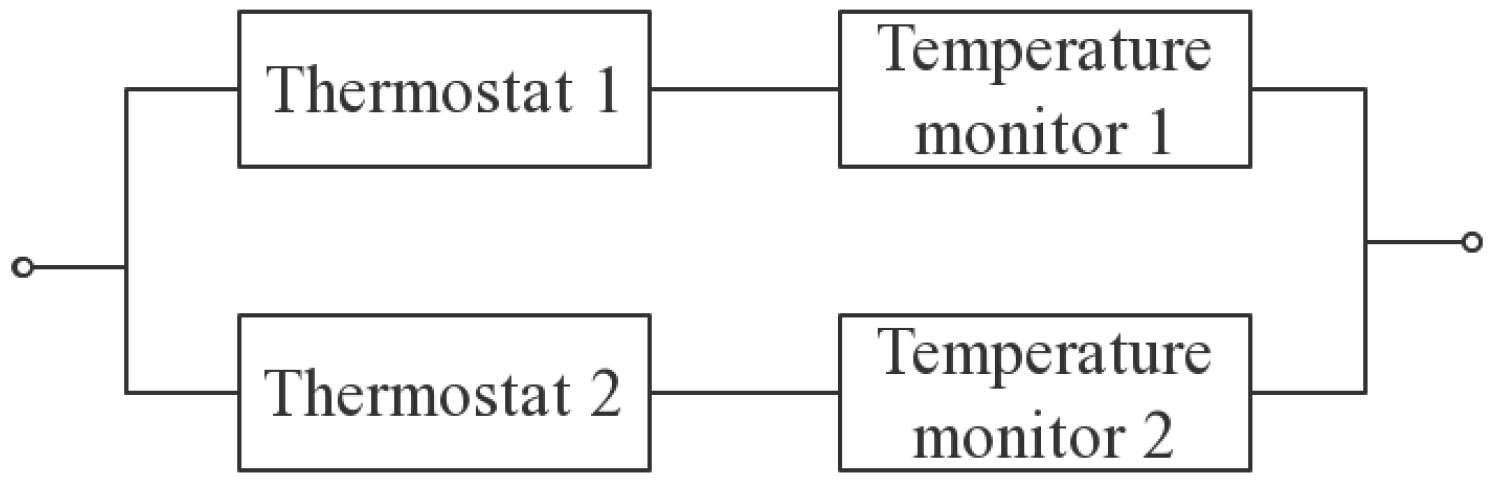
Figure 7.
RBD of the fuming heat training room.
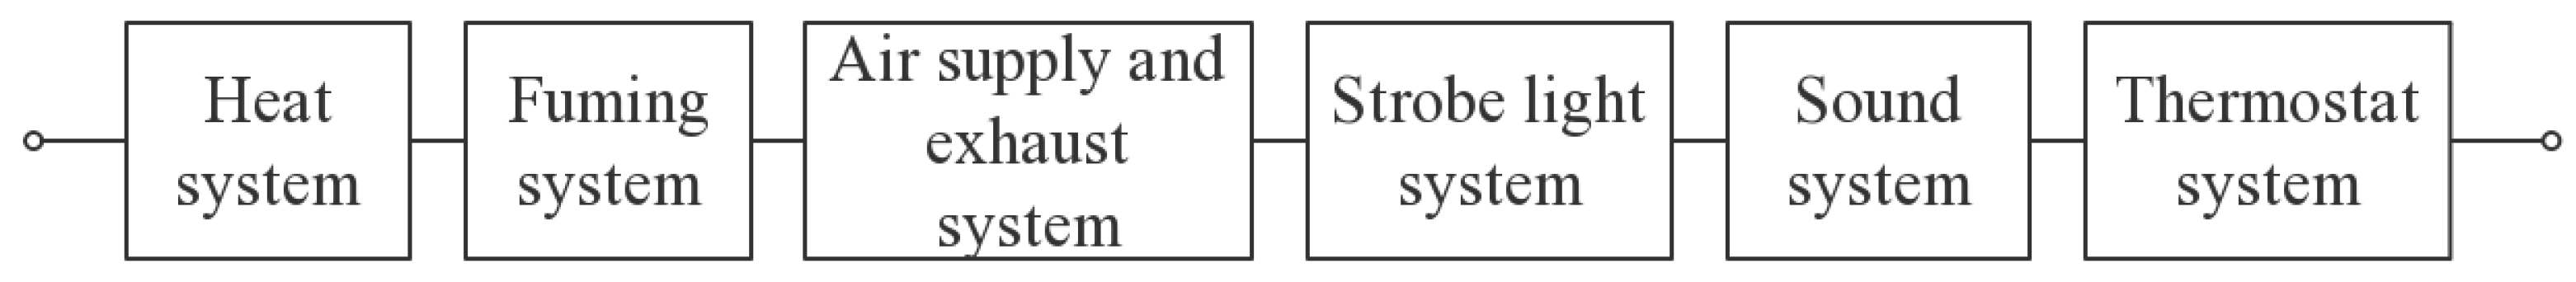
Figure 8.
RBD of the ground flow fire system.

Figure 9.
RBD of the hearth fire system room.
Figure 10.
RBD of the flaring system.
Figure 11.
RBD of the combustion bed system.
Figure 12.
RBD of the stair fire system.
Figure 13.
RBD of the combustion training room.

Figure 14.
RBD of the water supply system and the oil supply system.
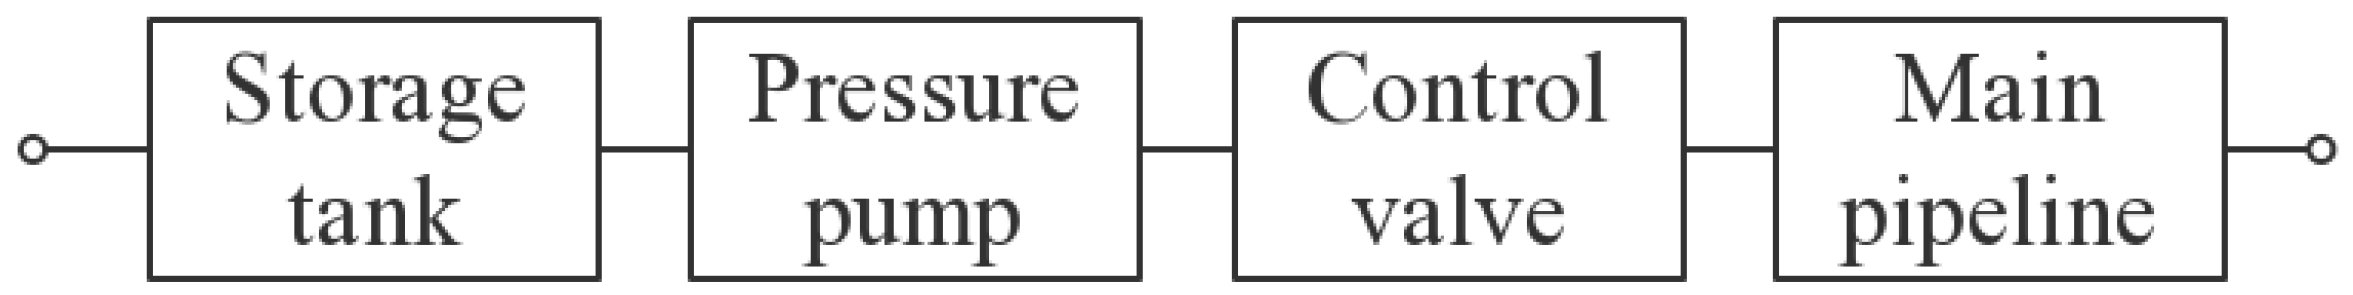
Figure 15.
RBD of the gas supply system.
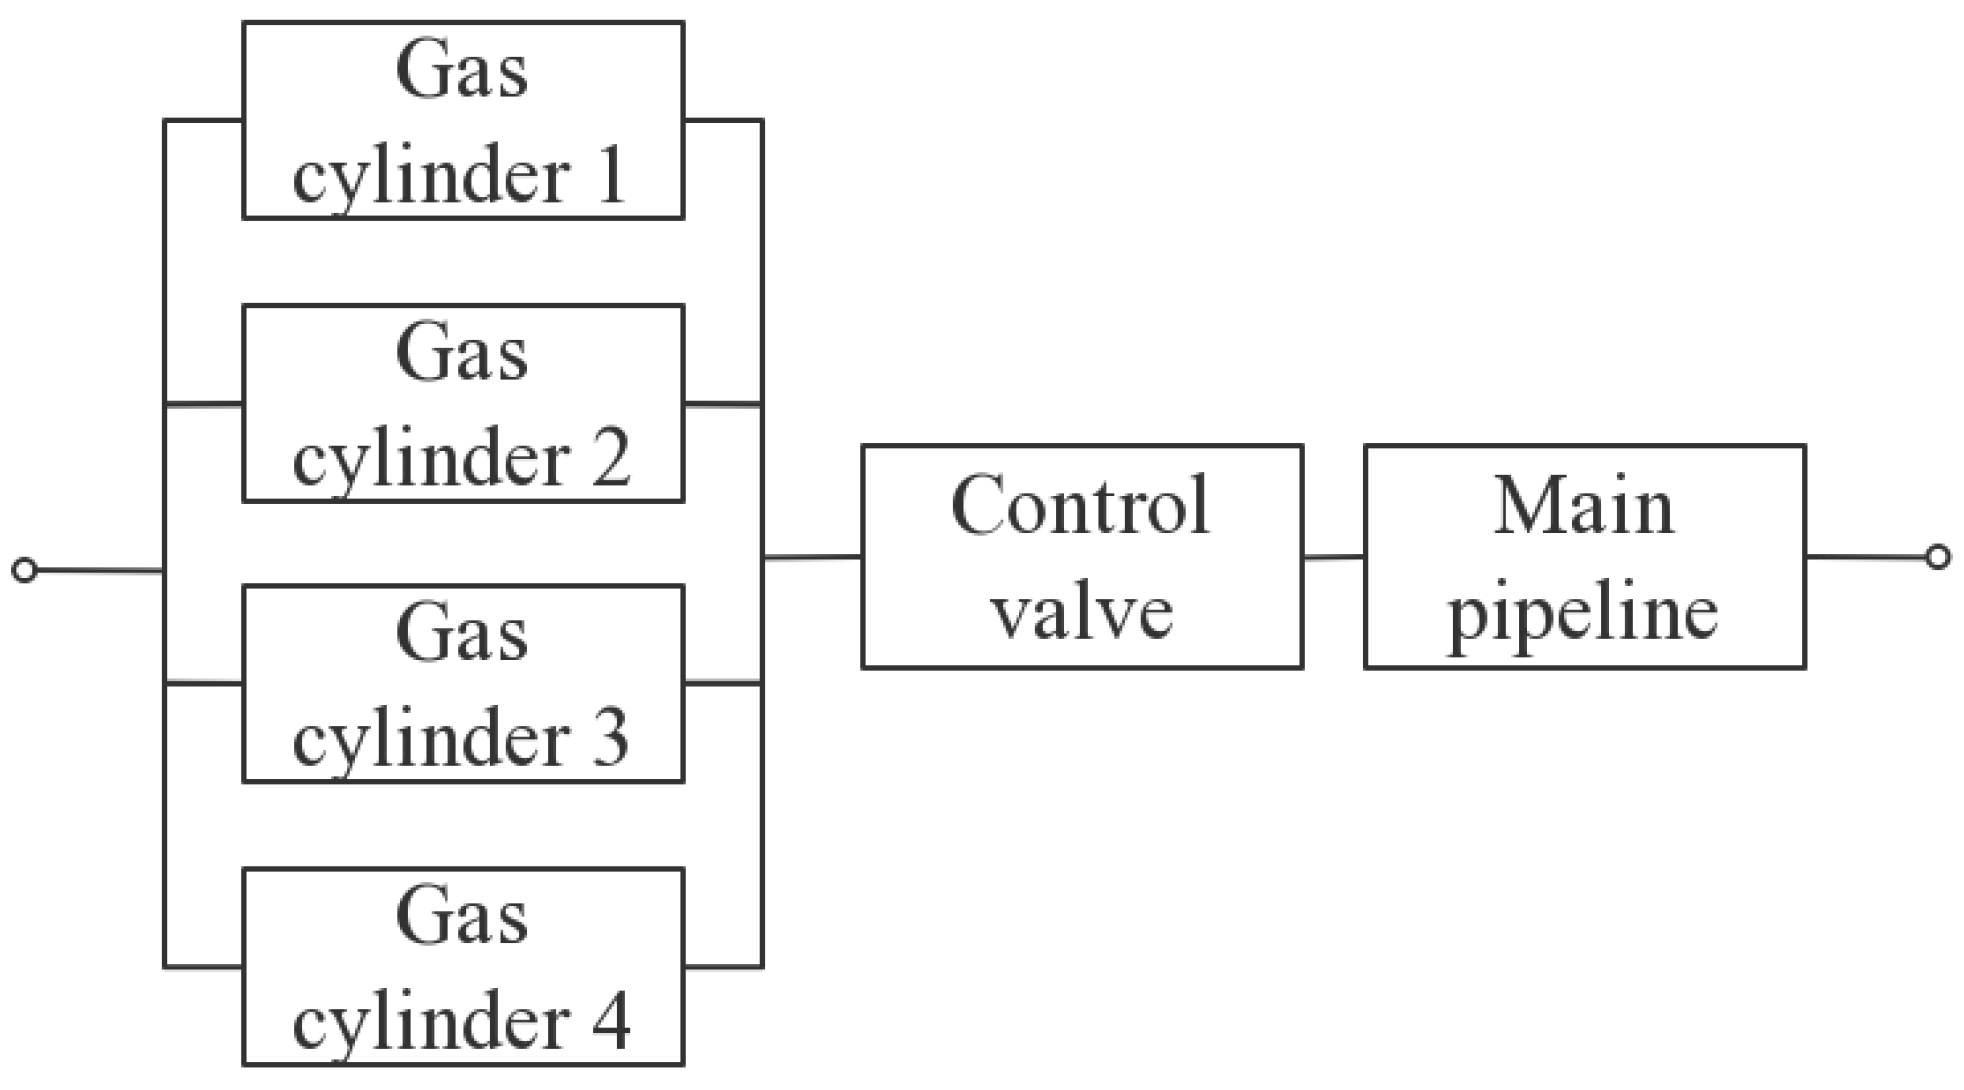
Figure 16.
RBD of the water, oil, and gas supply system.

Figure 17.
Reliability variation curve for the (a) heating system, (b) fuming system, (c) air supply and exhaust system, (d) strobe light system, (e) sound system, (f) thermostat system, and (g) Fume–heat training system.
Figure 17.
Reliability variation curve for the (a) heating system, (b) fuming system, (c) air supply and exhaust system, (d) strobe light system, (e) sound system, (f) thermostat system, and (g) Fume–heat training system.
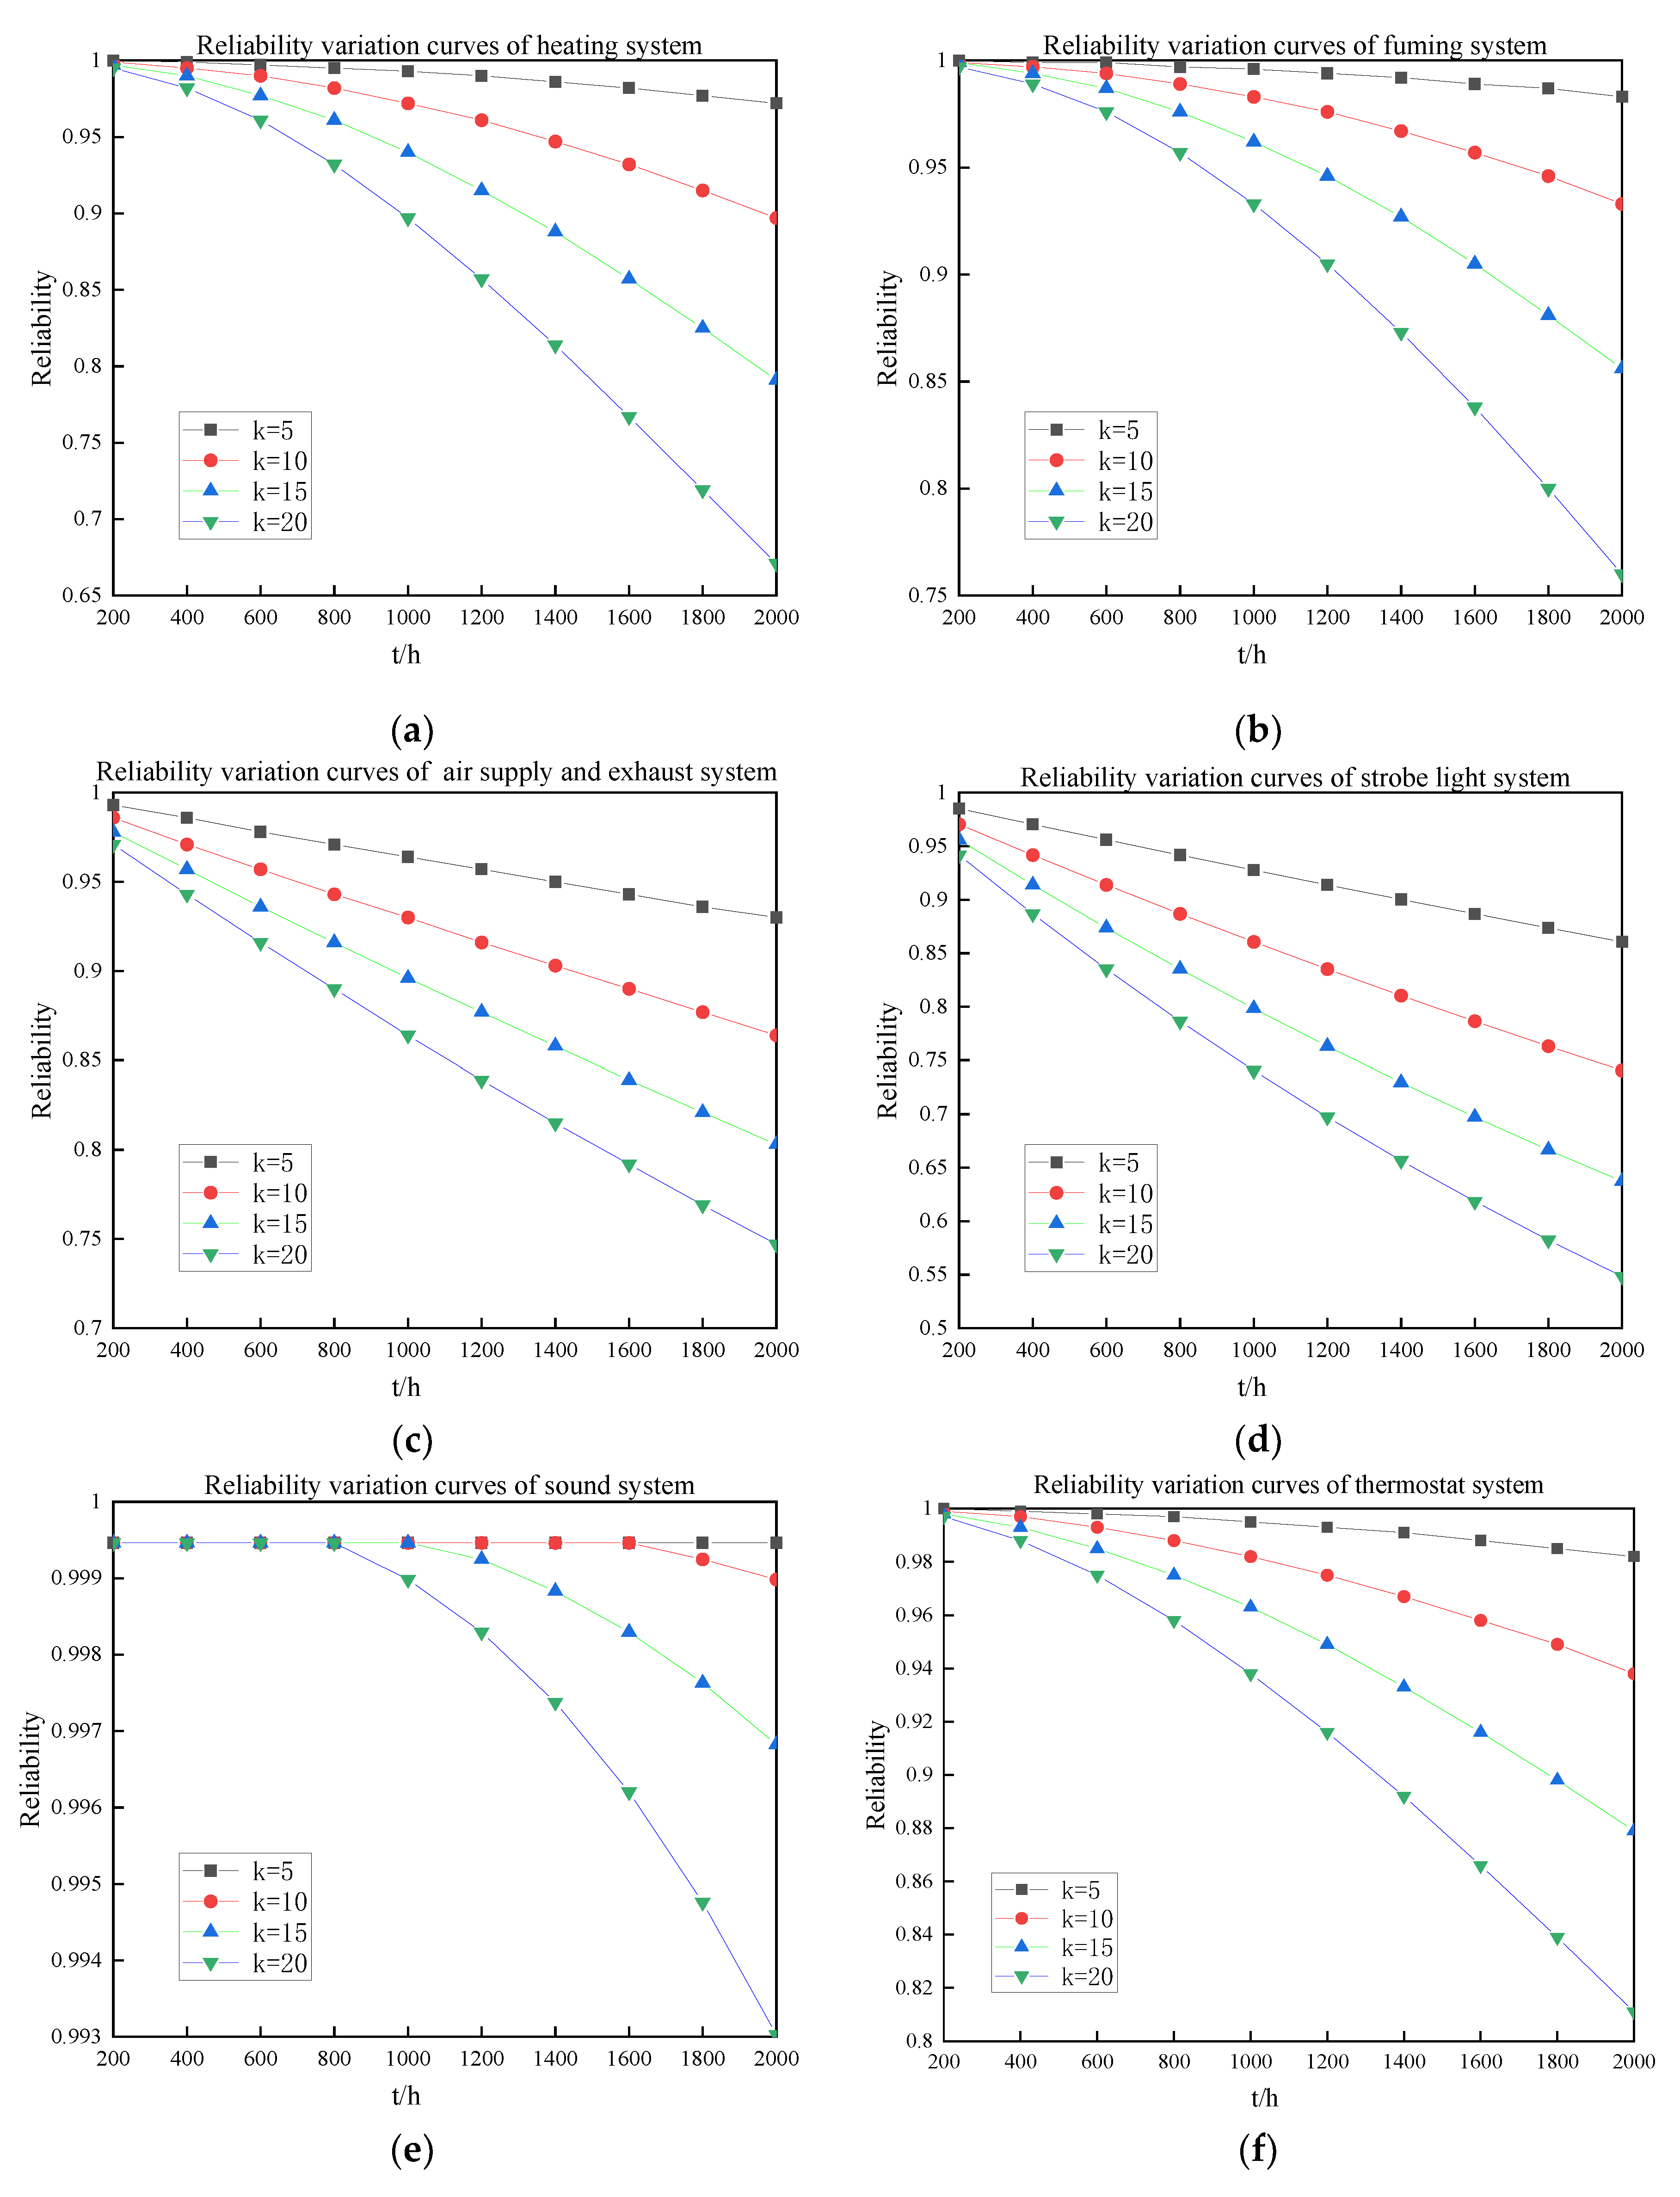
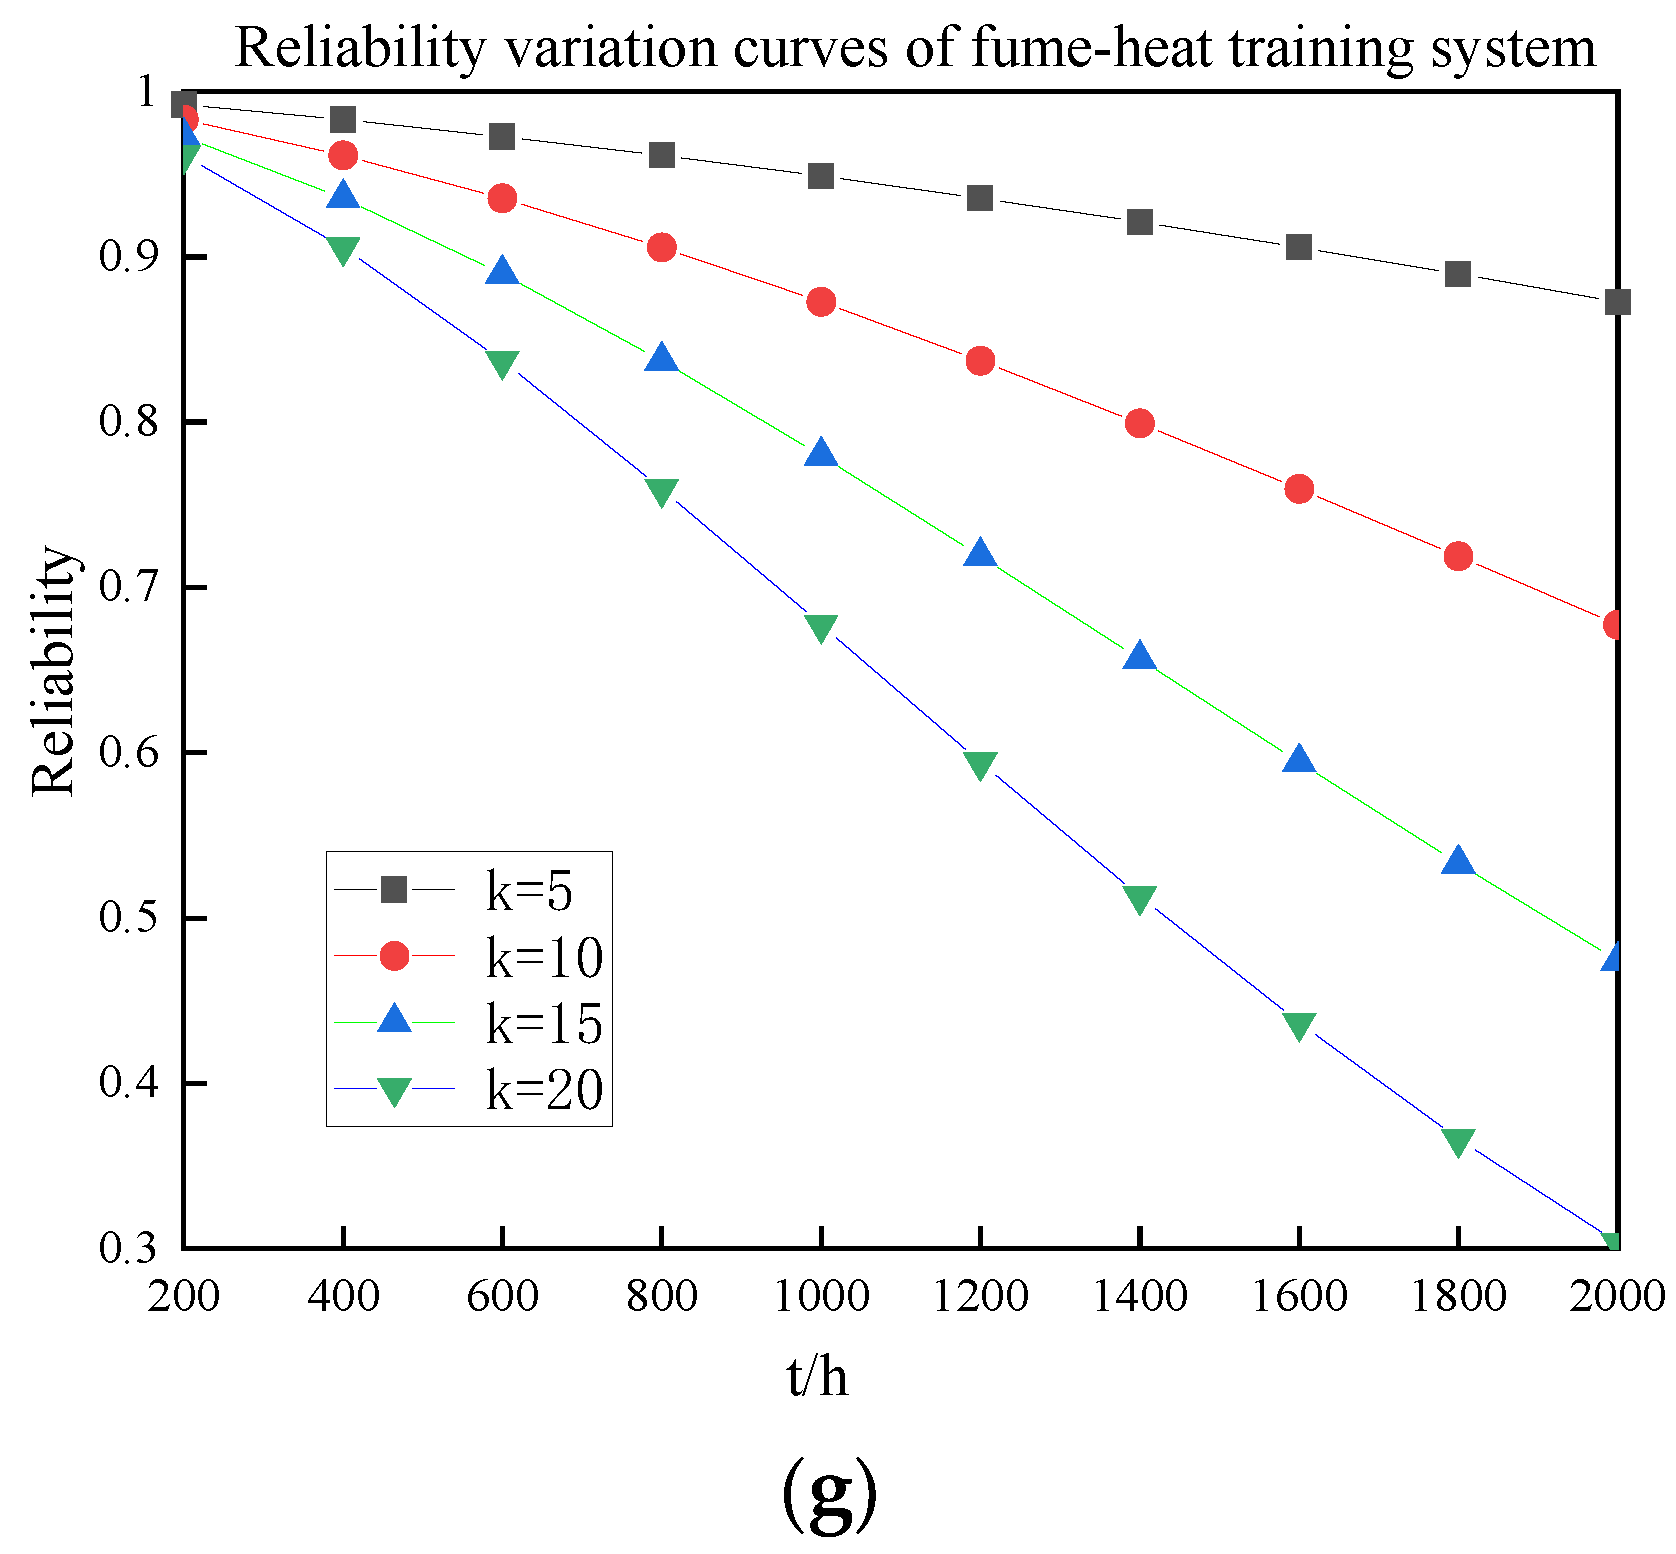
Figure 18.
Reliability variation curves of systems in the fume–heat training room at k = 15.
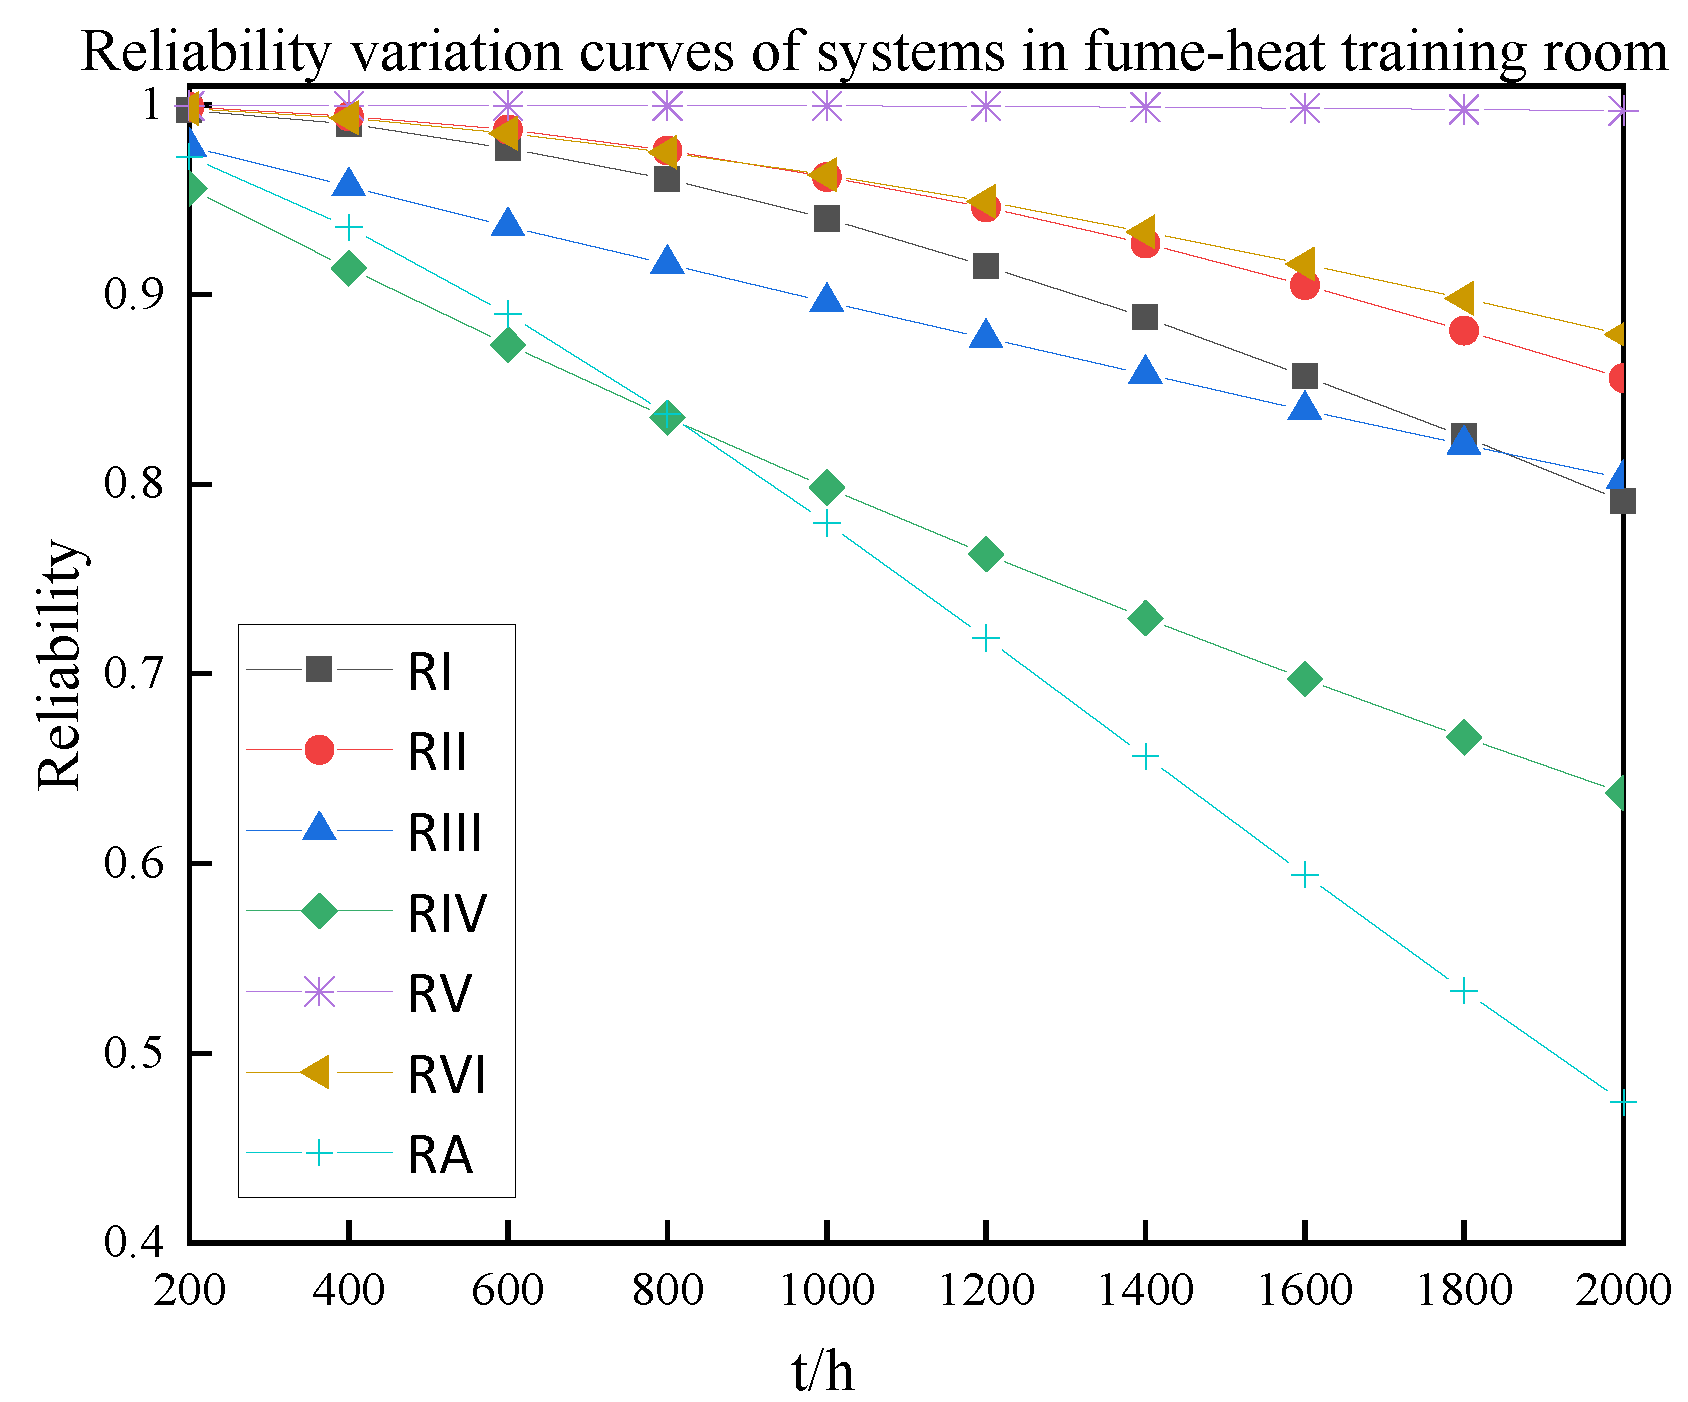
Figure 19.
RBD of the modified strobe light system.
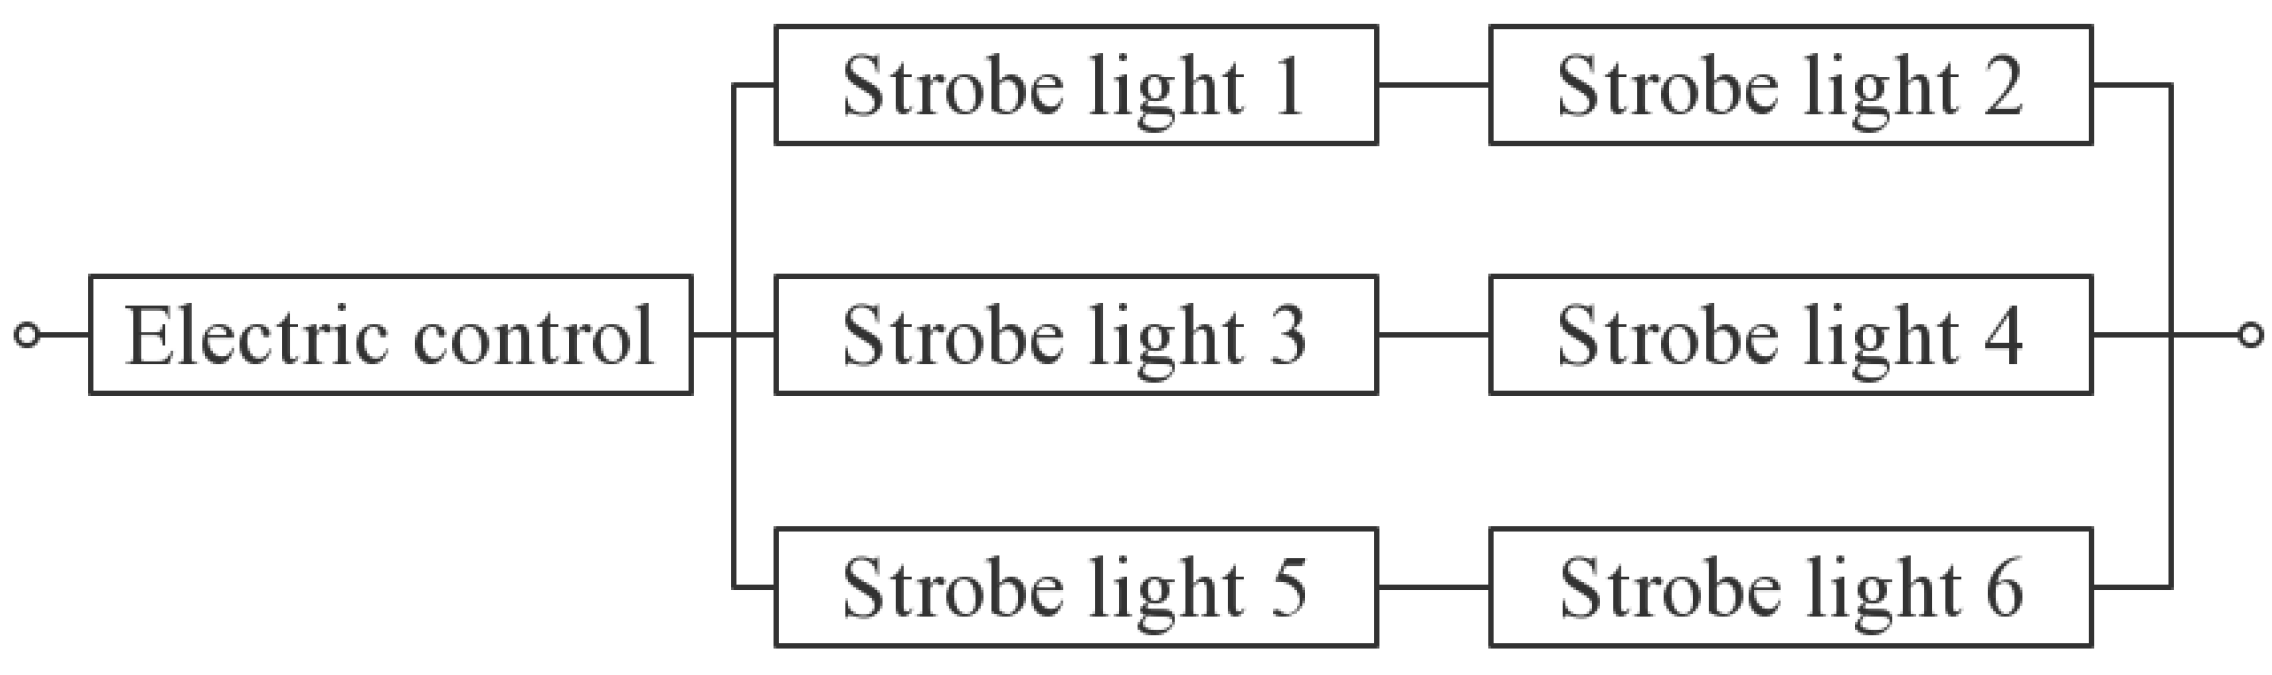
Figure 20.
Reliability variation curves of systems in the combustion training room at k = 15.

Figure 21.
RBD of the modified flaring system.
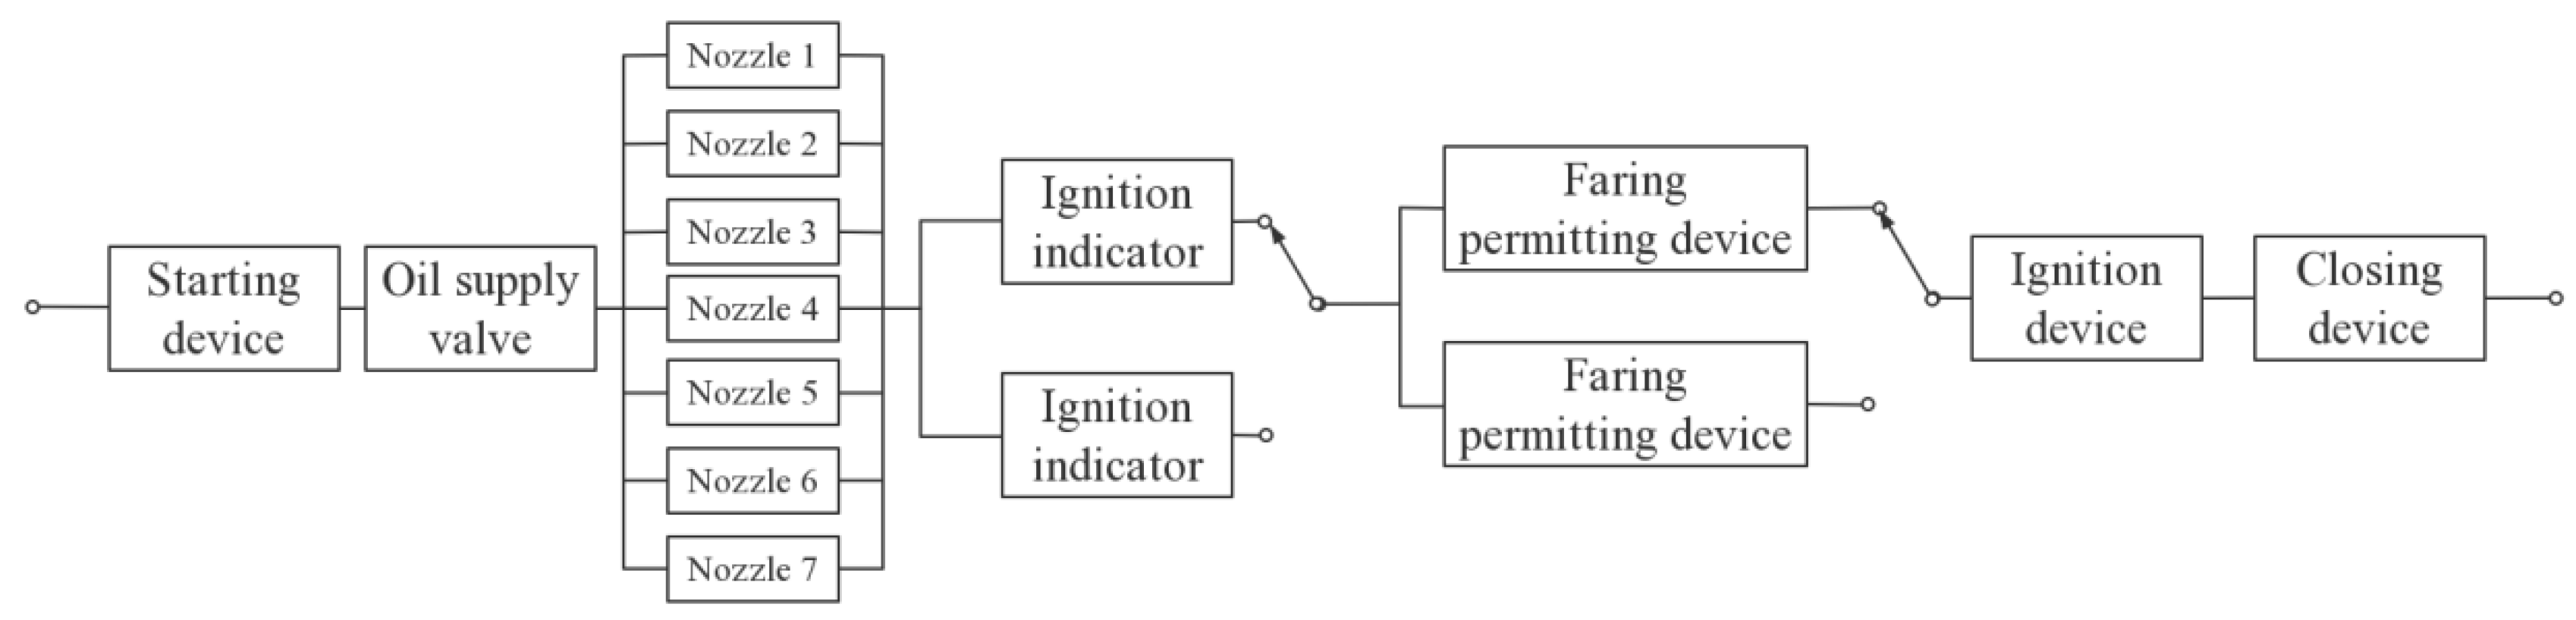
Figure 22.
Reliability variation curves of the systems in the water, oil, and gas system at k = 15.

Table 1.
Structural reliability model for irreparable systems.
| Structure | Mathematical Models |
|---|---|
| Series system | |
| Parallel system | |
| Series-parallel system | |
| Parallel-series system | |
| Voting system |
Table 2.
Reliability model of each system.
| Reliability of the fume—heat training room: | ||
| Heating system | : Reliability of electric controls : Reliability of manual controls : Reliability of heat blower : Reliability of fume emitter : Reliability of industrial heater : Reliability of fume generator | |
| Fuming system | ||
| Air supply and exhaust system | : Reliability of supply fan : Reliability of exhaust fan | |
| Strobe light system | : Reliability of light | |
| Sound system | : Reliability of sound | |
| Thermostat system | : Reliability of thermostat : Reliability of temperature monitor | |
| Ground flow fire system | : Reliability of starting devices : Reliability of valves : Reliability of nozzles : Reliability of ignition indicators : Reliability of ignition devices : Reliability of closing devices : Two operating conditions for the injector and ignition system : Reliability of injectors and ignition system : Reliability of spraying system | |
| Hearth fire system | : Reliability of gas ignition system : Reliability of fuel injection system : Reliability of spraying system | |
| Flaring system | : Reliability of flaring permitting device | |
| Combustion bed system | : Reliability of plumbing system : Reliability of pipeline | |
| Stair fire system | ||
| TV fire system | ||
| Water supply system | : Reliability of water tank : Reliability of water pump : Reliability of control valves : Reliability of main pipeline | |
| Oil supply system | : Reliability of oil tank : Reliability of oil pump | |
| Gas supply system | : Reliability of gas cylinder | |
Table 3.
Basic failure rate of the key components.
| Systems | Components | ||||
|---|---|---|---|---|---|
| Upper Limit | Average | Lower Limit | |||
| Fume–heat training room | Electric controls | 10.81 | 7.3 | 1.5 | |
| Manual controls | 8.0 | 7.2 | 1.6 | ||
| Heat blower | 11.4 | 6.9 | 0.2 | ||
| Fume emitter | 15.8 | 5.13 | 0.32 | ||
| Temperature monitor | 9.2 | 5.74 | 1.3 | ||
| Supply fan | 24.3 | 3.22 | 1.76 | ||
| Exhaust fan | 19.7 | 2.43 | 1.32 | ||
| Light | 6.43 | 1.62 | 0.6 | ||
| Sound | 15.24 | 8.1 | 0.91 | ||
| Thermostat | 10.4 | 8.52 | 1.21 | ||
| Combustion training room | Starting devices | 1.5 | 1.32 | 0.72 | |
| Valves | 2.71 | 1.05 | 0.45 | ||
| Nozzles | 0.77 | 0.3 | 0.01 | ||
| Ignition indicators | 1.77 | 1.59 | 0.41 | ||
| Ignition devices | 2.34 | 1.7 | 0.27 | ||
| Closing device | 2.4 | 1.2 | 0.1 | ||
| Pipeline | 2.01 | 0.03 | 0.012 | ||
| Flaring permitting device | 1.22 | 0.5 | 0.4 | ||
| Water, oil, and gas supply system | Tanks | 2.52 | 1.5 | 0.48 | |
| Valves | 2.71 | 1.05 | 0.45 | ||
| Pumps | 5.54 | 2.41 | 1.34 | ||
| Gas cylinder | 0.8 | 0.3 | 0.041 | ||
| Pipeline | 2.01 | 0.03 | 0.012 | ||
Disclaimer/Publisher’s Note: The statements, opinions and data contained in all publications are solely those of the individual author(s) and contributor(s) and not of MDPI and/or the editor(s). MDPI and/or the editor(s) disclaim responsibility for any injury to people or property resulting from any ideas, methods, instructions or products referred to in the content. |
© 2023 by the authors. Licensee MDPI, Basel, Switzerland. This article is an open access article distributed under the terms and conditions of the Creative Commons Attribution (CC BY) license (https://creativecommons.org/licenses/by/4.0/).
Share and Cite
MDPI and ACS Style
Huang, Z.; Yu, R.; Huang, Y.; Li, J.; Ding, H.; Lei, Y.; Wang, P.; Jameel, D. Reliability Analysis of a Building Real Fire Simulation Training System. Fire 2023, 6, 369. https://doi.org/10.3390/fire6100369
AMA Style
Huang Z, Yu R, Huang Y, Li J, Ding H, Lei Y, Wang P, Jameel D. Reliability Analysis of a Building Real Fire Simulation Training System. Fire. 2023; 6(10):369. https://doi.org/10.3390/fire6100369
Chicago/Turabian StyleHuang, Zhian, Rongxia Yu, Yang Huang, Jinyang Li, Hao Ding, Yukun Lei, Pengfei Wang, and Danish Jameel. 2023. "Reliability Analysis of a Building Real Fire Simulation Training System" Fire 6, no. 10: 369. https://doi.org/10.3390/fire6100369