Article

Remote Sensing-Based Monitoring of Postfire Recovery of Persistent Shrubs: The Case of Juniperus communis in Sierra Nevada (Spain)

by
Javier Blanco-Sacristán
1,2,
Emilio Guirado
3,4,*,
José Luis Molina-Pardo
5,*,
Javier Cabello
4,6,
Esther Giménez-Luque
5,6 and
Domingo Alcaraz-Segura
1,4,7
1
Departamento de Botánica, Facultad de Ciencias, Campus Universitario de Fuentenueva, Universidad de Granada, 18071 Granada, Spain
2
Climate and Livability Initiative, Division of Biological and Environmental Sciences and Engineering, King Abdullah University of Science and Technology, Thuwal 23955, Saudi Arabia
3
Multidisciplinary Institute for Environment Studies “Ramon Margalef” University of Alicante, Edificio Nuevos Institutos, Carretera de San Vicente del Raspeig s/n San Vicente del Raspeig, 03690 Alicante, Spain
4
Centro Andaluz para la Evaluación y Seguimiento del Cambio Global (CAESCG), Universidad de Almería, Ctra. Sacramento s/n, 04120 Almería, Spain
5
Centro de Colecciones de la Universidad de Almería (CECOUAL), Universidad de Almería, Ctra. Sacramento s/n, 04120 Almería, Spain
6
Departamento Biología Vegetal y Ecología, Universidad de Almería, Ctra. Sacramento s/n, 04120 Almería, Spain
7
iEcolab. Instituto para la Investigación del Sistema Tierra en Andalucía, Universidad de Granada, Avda. del Mediterráneo s/n, 18006 Granada, Spain
*
Authors to whom correspondence should be addressed.
Submission received: 22 October 2022 / Revised: 4 December 2022 / Accepted: 19 December 2022 / Published: 22 December 2022
(This article belongs to the Special Issue Mediterranean Fires)

Abstract

:
Wildfires affect the structure, functioning, and composition of ecosystems. Long-term monitoring of the occurrence, abundance, and growth of plant species is key to assessing the responses of the dynamics of plant populations with regard to environmental disturbances, such as wildfires. In this work, we evaluated the changes in the number of individuals and the canopy cover extent of a population of Juniperus communis L. during a four-decade period following a wildfire in a Mediterranean high-mountain ecosystem (Sierra Nevada, Spain). To do this, we used object-based image analysis (OBIA) applied to very high-resolution aerial images. Our study also provides a new approach to optimize the shrub identification process and to semi-automatically evaluate the accuracy of the number of shrubs and their canopy cover. From the 752 individuals present in 1977, only 433 remained immediately after a fire (1984), a few more disappeared one decade later (420 shrubs in 1997), while by 2008, the population had partially recovered to 578 shrubs. The wildfire decreased juniper canopy cover from 55,000 m2 to 40,000 m2, but two decades later it had already recovered to 57,000 m2. The largest shrubs were more resistant to fire than the smallest ones and recovered in a shorter time period. The protection measures introduced with the park declaration seemed to have contributed to the post-fire recovery. The potential of this methodology in the management and conservation of biodiversity in the future is also discussed.

1. Introduction

The high longevity of some plants in high-stress environments (e.g., nutrient-deficient environments, high competition, or extreme climates) means that they can survive under adverse conditions long enough to delay or even avoid extinction by preserving their populations throughout long hostile periods until windows of opportunity allow for their establishment [1]. Such a strategy of the long-term maintenance of individuals in high-stress environments is known as persistence [2]. Monitoring persistent populations is complex since they grow slowly and the environmental conditions when they were established in the past may have now changed [3], but they can inform on the long-term environmental changes they have witnessed and the disturbances they have gone through [4,5,6]. The extreme environmental conditions that persistent plants suffer determine the usually slow dynamics of these populations [7,8,9]. For instance, persistent shrub populations in the Mediterranean high mountains are under intense abiotic stress and are dominated by older adults, with meager proportions of juveniles [10], something that could also be favored by anthropogenic disturbances (e.g., deforestation and fires). This evolution as a function of environmental conditions and anthropogenic disturbances complicates their study and monitoring over long periods of time [4,5]. Furthermore, there is a lack of information on how the persistence of these individuals contributes to expanding the demographic strategies of the species [7]. For these reasons, low-cost automatic monitoring of the distribution and growth of persistent shrubs with very high-resolution aerial and satellite imagery would facilitate an assessment and understanding of the effects of environmental changes and disturbances on the dynamics of long-lived plant populations.
Wildfire is the primary disturbance in the Mediterranean ecosystems of southern Europe [11]. Fires are natural agents that have played a fundamental role in the evolution of ecosystem patterns and processes since prehistorical times [12]. Fire action can create new ecological niches [13,14], be responsible for modifications in vegetation structure and distribution [15], cause changes in erosion regimes [16], and affect the carbon cycle and even the global climate [17]. Fires are sometimes associated with the loss or degradation of natural areas and their associated ecosystem services (forest, livestock, and agricultural resources) [18]. Nevertheless, there are fire-adapted ecosystems and species for which its loss is detrimental [13]. Responses and degrees of adaptation to fire vary among plant species and some species can recover after disturbances, as is the case with resprouting [19]. In other species, the capacity to recover after fire disturbances is minimal, and if individuals die, the only option to recover their populations is by new colonization [10,20]. For many years, fire regimes have been influenced by humans (e.g., [21]). However, the cumulative effects of human actions are leading to changes in the size, intensity, and recurrence of fires, resulting in more severe impacts on biodiversity and ecosystems [13,18].
Aerial and satellite image classification for vegetation monitoring is one of the most widely used remote sensing tools in conservation [22,23,24,25]. Object-based image analysis (OBIA) has proved to be a successful tool for monitoring the effect of fires in the past (e.g., [26,27,28,29]), providing more accurate results with high-resolution images and without spectral information than pixel-based analysis, which presents difficulties in images of very heterogeneous environments [30]. Pixel-based classification analyzes each pixel’s properties independently without considering spatial information or the context surrounding the pixel of interest. In addition, the small pixel size in images of very high spatial resolution means that the objects of interest are often larger and important information in the context of the image is lost through pixel-based image analysis [31]. In contrast, OBIA considers both the spectral information of the object and its context, including its relationship with the environment [32]. OBIA consists of two steps: segmentation, which is the division of the image into homogeneous objects (also called segments) of similar characteristics and the classification of these objects, which is their categorization into classes of interest, based on similarities in their shape, context, and spectral information [33]. During the segmentation phase of OBIA, it is necessary to establish an appropriate scale for the division of objects according to their size in the analyzed image [34]. Therefore, the success of the classification greatly depends on the accuracy of the segmentation [35]. In environments where vegetation appears differentiated from the surrounding landscape, such as in high mountains, OBIA allows accurate and realistic identification by using the spectral information of the vegetation and its spatial relationship to its context. The availability of high-resolution historical photographs and their analysis with OBIA makes it possible to reconstruct the dynamics of plant populations and evaluate their changes over time.
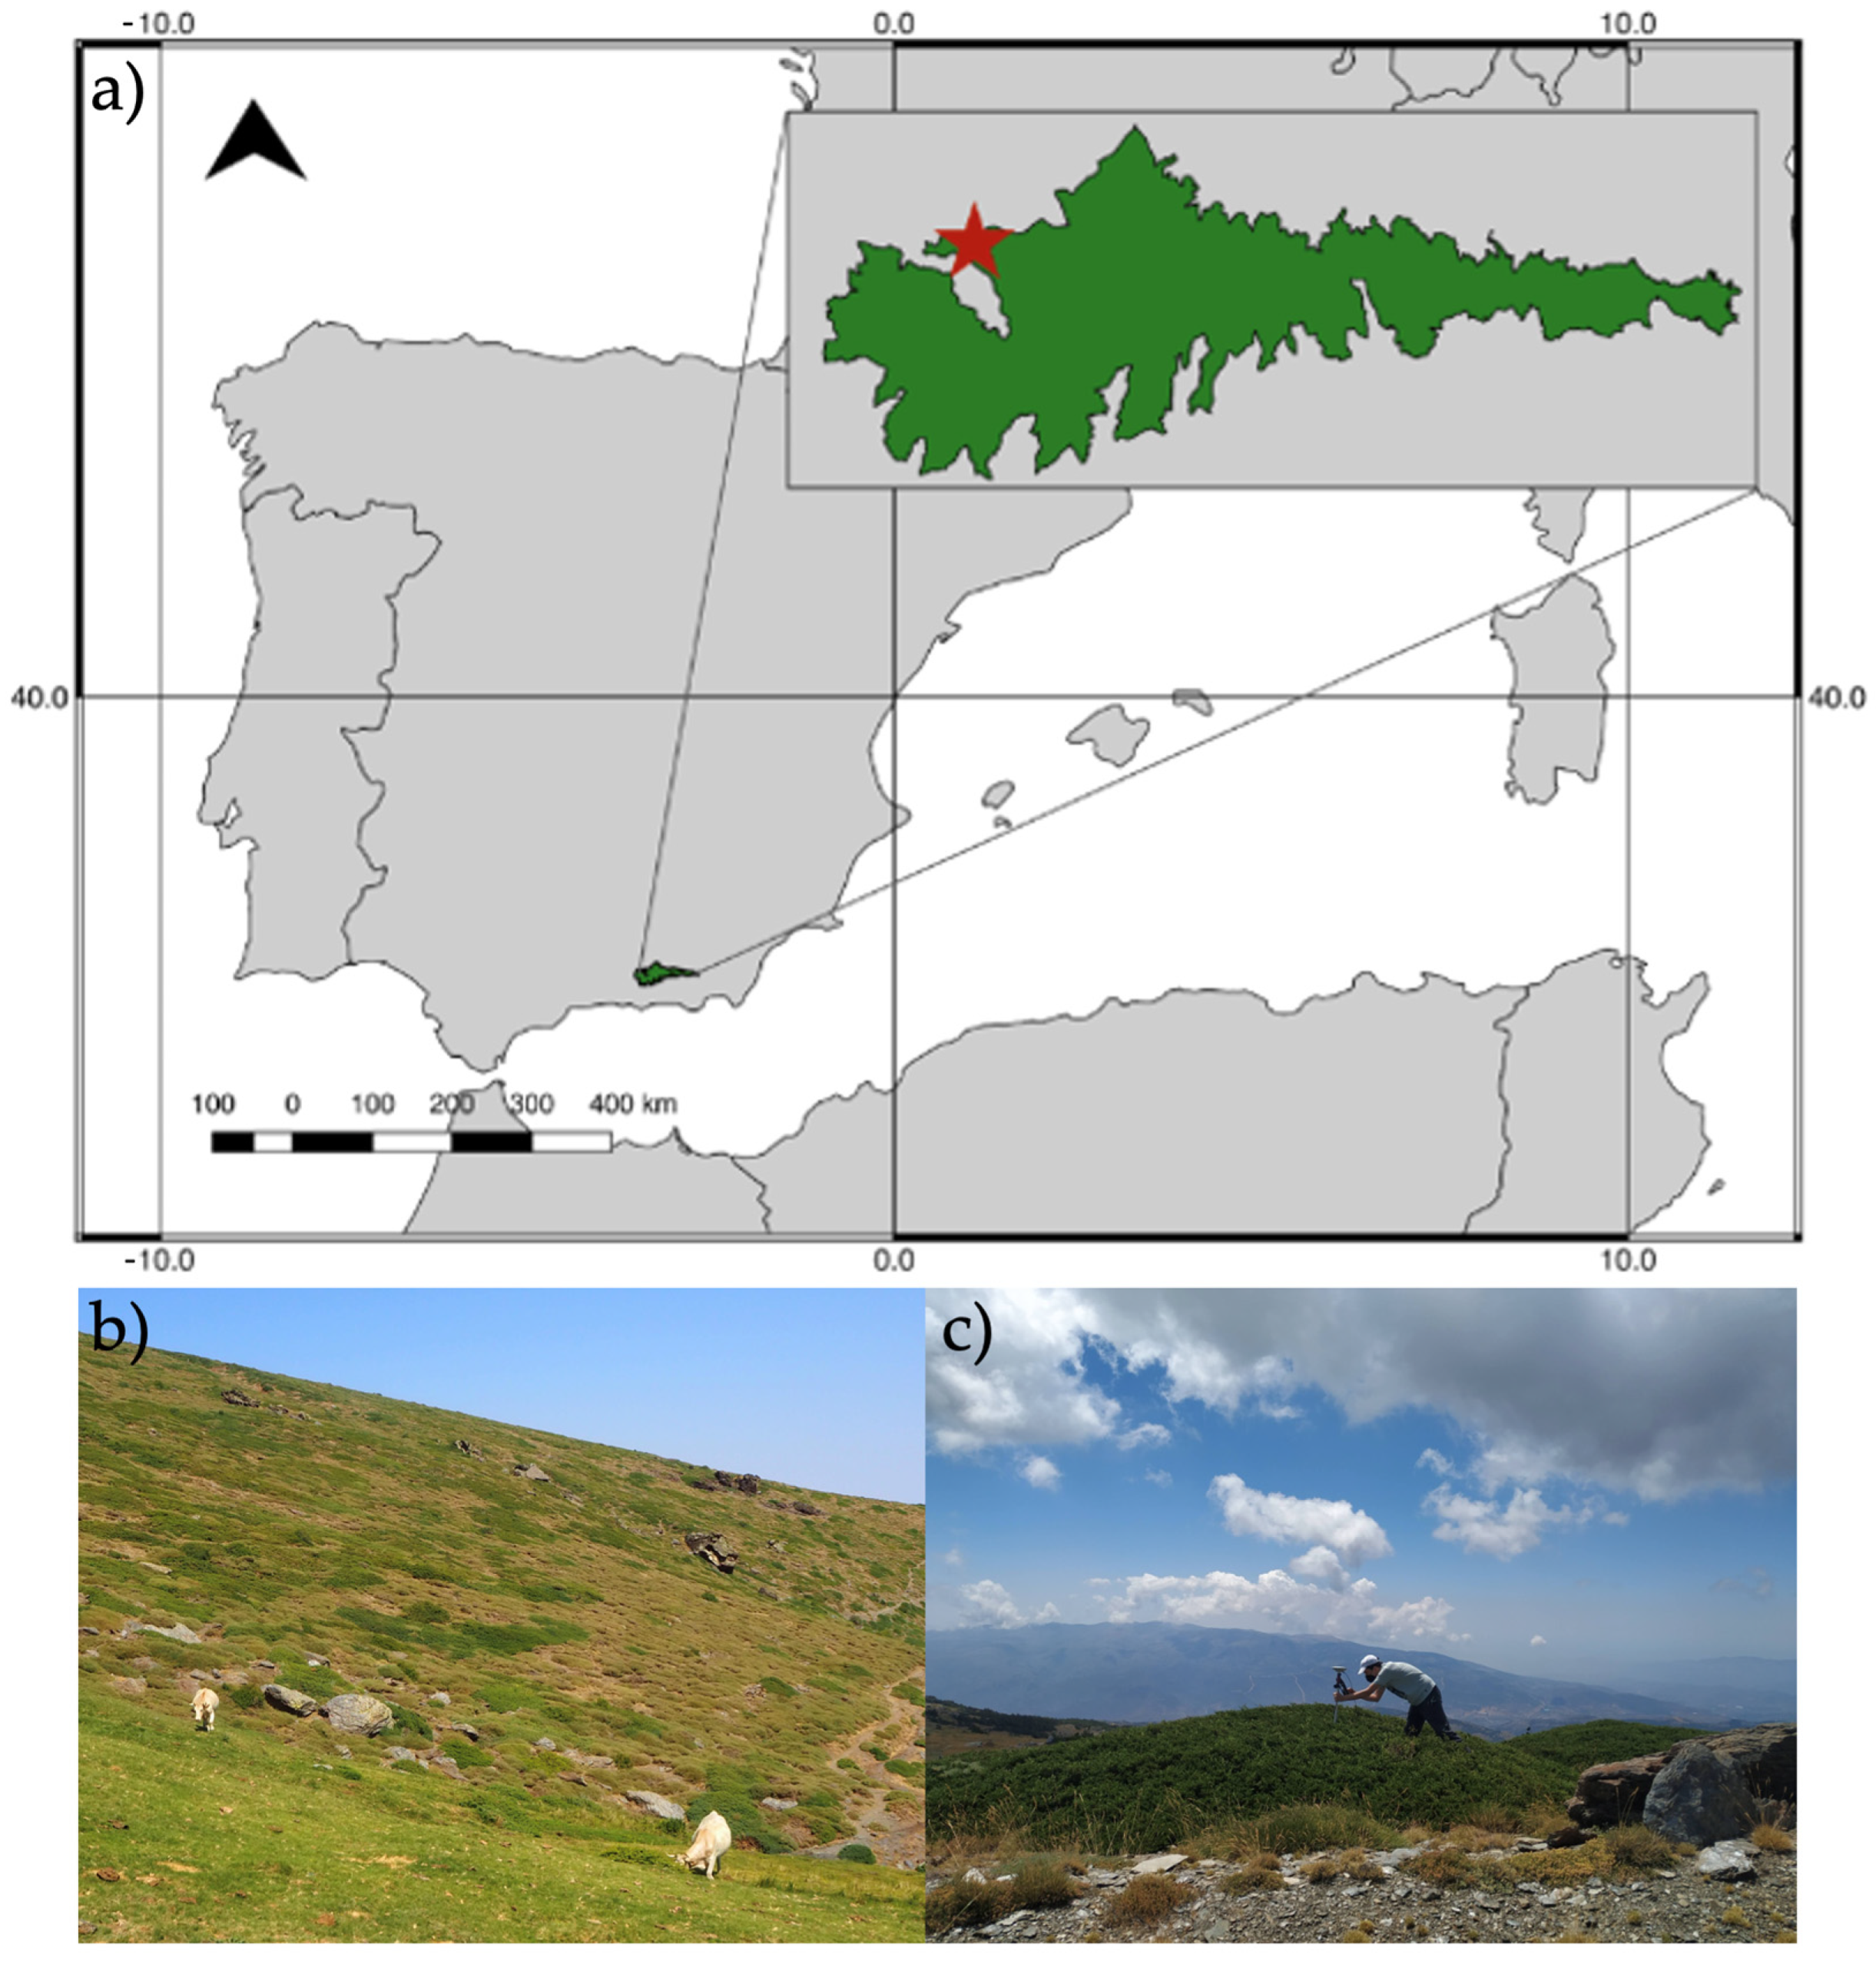
In this study, the historical mapping of a persistent shrub (Juniperus communis) in the Sierra Nevada National Park (Spain) is constructed as a basis for evaluating its population dynamics over 40 years and its evolution after a fire that occurred in 1983. For this purpose, (i) the remote sensing identification of Juniperus communis was optimized by developing a semi-automatic work protocol that allows identifying which segmentation (separation between bush and ground) is best adapted to the characteristics of each moment in the historical images, allowing better identification of the bushes; (ii) a reconstruction of historical changes in the distribution, canopy cover, and population structure of Juniperus communis was carried out to evaluate the possible factors that have determined its post-fire recovery; and (iii) changes in the size structure of the population were compared to bibliographic references and discussed in the context of the different measures adopted to protect the area as a Natural Park in 1989 and as a National Park in 1999.

2. Materials and Methods

2.1. Study Area

We focused on a 0.53 km2 plot at the Barranco de San Juan (37°06′04.6″ N 3°22′07.9″ W), located on the western face of the high mountain massif of Sierra Nevada, Spain (Figure 1), in the oromediterranean subhumid belt [36]. Average annual precipitation is irregular depending on altitude, with values varying between 350 and 1200 mm per year. The average winter temperature is 0 °C, with a persistent snow cover in many places for eight to ten months per year [37]. In the area, there is a community led by the ecosystem engineer Juniperus communis L. (common juniper) associated with Genista versicolor Boiss. ex Steud. and Hormathophylla spinosa (L.) P. Küpfer, among others, holds very diverse plant and animal communities, including passerines, such as Turdus torquatus Linnaeus, 1758 and Turdus viscivorus Linnaeus, 1758, or rodents, such as Apodemus sylvaticus (Linnaeus, 1758) [38,39]. In this area, there are several abandoned irrigation channels [40] and summer grazing was common in the past [41]. Furthermore, there was a fire that affected this community of J. communis in 1983 [42,43].

2.2. Datasets and Ground Truth

Very high spatial resolution orthoimages obtained during the 1977–2008 period using photogrammetric flights carried out within the National Aerial Orthophotography Plan, a project co-financed and cooperated between the General State Administration and the different autonomous communities of Spain, were used in this work. The orthoimages are available at https://www.juntadeandalucia.es/institutodeestadisticaycartografia/prodCartografia/ortofotografias/index.htm (accessed on 10 July 2022). All images were projected to the ETRS89 UTM 30N coordinate system. The specifications of the suitable images that were used in this study can be found in Table 1.
For ground-truthing, the perimeter of individuals detected in the field was digitized with a Leica GD15 (Leica Geosystems, St. Gallen, Switzerland) GPS for each class (e.g., Juniperus communis and soil) by creating polygons in QGIS software v. 2.18.12 (QGIS Development Team, Open Source Geospatial Foundation Project). From a field sampling of the individuals appearing in all the images used, 100 individuals of juniper were digitized. For this digital sampling, transects were systematically carried out parallel to the stream in Barranco de San Juan.

2.3. Object-Based Image Analysis (OBIA)

OBIA consists of two phases (Figure 2). (i) Image segmentation: the image is divided into discrete regions or objects that are homogeneous with respect to spatial and/or spectral characteristics, depending on the parameters entered by the user [44]. (ii) Classification of the generated segments: a process dependent on the segmentation and influenced by its result which consists of interpreting the meaning of the previously created segments according to parameters selected by the user, assigning specific classes to the created objects and corresponding to the reality observed in the image [45].

2.3.1. Image Segmentation

The multiresolution segmentation algorithm from eCognition Developer 8 software (Trimble Geospatial, Munich, Germany) was used. This algorithm allows the formation of larger and larger objects starting from the pixel level, depending on the homogeneity of their groupings. The generation of objects is carried out according to parameters of color, shape, compactness, and average size of the progressively formed objects, ending when certain values, called segmentation parameters, are exceeded. Within them, we find scale, which allows the formation of larger objects as their value increases and, related to each other, shape and compactness, which restrict the formation of objects according to their homogeneity and consistency, respectively.
To find the combination of scale, compactness, and shape parameters that produced the best segmentation, we compared 8100 segmentations carried out in eCognition software by systematically increasing the scale (5 points each, starting at 5 and ending at 125), and also by systematically varying the shape and compactness values (0.1 points each). Segmentations with all possible combinations of scale, shape, and compactness (8100) were performed. The scale value has no minimum or maximum value beyond the size of the pixel itself and the image, respectively, while the values that the shape and compactness parameters adopted ranges from 0.1 to 0.9, both included at steps of 0.1. This process was performed with a computer with an i7-4790K CPU and 32 GB of RAM.

2.3.2. Validation of Segments

To validate the segmentation, that is, to know if the segmentation fits the reality of the objects to be mapped, it is necessary to know the geometric relationships between the reference polygons (ground truth) and their corresponding segments generated in the segmentation process. Three possible options may occur: overlap, over- or under-segmentation, and over- or under-estimation [46]. Overlapping occurs when a polygon, or several polygons, share with a segment, or several segments, a common area; this is the overlapping area. Over-segmentation occurs when a reference polygon is divided into at least two parts. Parts of the reference polygon appear inside the area of the corresponding segment (overlapping area) and other parts outside. The areas left out are called over-segments and are omitted by the segmentation of the reference polygon (overestimation). Sub-segmentation occurs when a reference polygon divides a corresponding segment into at least two parts. Parts of the corresponding segment appear inside the reference polygon area (overlapping area) and others outside. The areas that are left out are called sub-segments and are areas related to the corresponding segment. A correct segmentation should generate low values of over- and under-segmentation [47]. The former does not necessarily lead to errors in downstream processes, while the latter does [48].
The selection of parameters for optimal segmentation is usually a trial-and-error process [49,50]. Nevertheless, in this study, all possible segmentations were generated and objectively chosen [50]. To evaluate the accuracy of all segmentations, we developed an R script to calculate the potential segmentation error (PSE; Equation (1)), number-of-segments ratio (NSR; Equation (2)), and Euclidean distance v2 (ED2; Equation (3)) [46]. This method allowed us to analyze the relationships between the generated segments and the reference polygons.
The PSE index is a geometric measure, being the ratio of the difference between the total number of underestimated segments and the total area of the reference polygons:
PSE = s i r k r k
where rk is the area of the reference polygon and si is the overestimated area of the segment obtained during the segmentation. A PSE value equal to zero indicates that there are no underestimated segments, while a high value indicates a high degree of segmentation underestimation.
The NSR index is an arithmetic measure, which is the absolute difference between the number of reference polygons and the number of corresponding segments divided by the number of reference polygons:
NRS = a b s   m v m
where abs is the absolute value of the difference between the number of reference polygons, m, and the number of segments obtained, v.
An NSR value of zero indicates a one-to-one relationship between the reference polygons and the corresponding segments. A high value indicates a dominant one-to-many relationship. Although not a measure of error, a significant degree of over-segmentation is undesirable. This index is an arithmetic measure of the over-segmentation situation [46].
The ED2 index is a measure of Euclidean distance. This composite index considers both geometric (PSE) and arithmetic (NSR) discrepancies. A point in a two-dimensional PSE–NSR space corresponds to the paired value of PSE and NSR obtained from Equations (1) and (2), respectively:
ED 2 = PSE 2 + NRS 2
where PSE is the potential segmentation error index and NSR is the number-of-segments ratio index. An ED2 value of zero indicates a combination of a good geometric (PSE) and arithmetic (NSR) fit.

2.3.3. Image Classification

There are multiple possibilities for defining the most representative characteristics that will define a given class of objects [51]. Image classification is performed based on the training examples of each class and user-selected features, from which the software analyzes their characteristics and performs an automatic classification. These examples represent only a small set of the total number of objects in the image and should be indicative of the classes they represent [51]. The results depend on these elements and, with hundreds of features that can affect classification, knowing which ones provide optimal classification based on the given examples is a crucial step [52].
The separability and thresholds (SEaTH) algorithm [51] was used to determine which features provide the best classification for each image. The use of this algorithm has been successful in the development of classification in OBIA [52,53], being a robust alternative for feature extraction that provides optimal classification. This semi-automatic extraction algorithm analyzes which are the characteristics that produce a higher separability between the selected classes based on the examples of each one (i.e., how to better differentiate the classes from each other). Value thresholds are calculated for the selected characteristics within which the classes are reliably delimited and differentiated from each other. These thresholds will be used in the subsequent steps of the classification. Thus, two values are provided: separability (J) and threshold (T).
The separability between different classes is indicated by the Jeffries–Matusita distance, J, on a scale of 0–2 in terms of the Bhattacharya distance, B (Equation (4)), which can be used as a measure of separability. Thus, for two classes (1 and 2) and for an analyzed characteristic we find that:
B = 1 8 m 1 m 2 2 2 σ 1 2 + σ 2 2 + 1 2 l n σ 1 2 + σ 2 2 2 σ 1 σ 2  
where m and σ are the mean and variance, respectively, of the feature distributions of the two classes. If the means coincide, the first term disappears, while the second term disappears if the distributions have the same variance. Therefore, a complete separability (Equation (5)), between two classes with respect to a particular feature is indicated by J = 2, implying that there would be no classification failure applying that feature. The lower the value of J, the lower the separability between classes and the worse the final classification.
J = 2 ( 1 e B )  
Assuming a normal distribution of the characteristics of the classes used, the threshold T is defined as (Equation (6)):
T = m 2 σ 1 2 m 1 σ 2 2 ± σ 1 σ 2 m 1 m 2 ) 2 + 2 A ( σ 1 2 σ 2 2   σ 1 2 σ 2 2
where A is the logarithm in base ten of the division between the standard deviation of the distribution of each class and the multiplication of the division by the number of examples given in each class. For the first classification of each image, the features with a J-value closer to 2 were selected. The t-values for each characteristic were used to optimize the classification at a later stage. Once the features indicated by the SEaTH tool were selected, the Random forest automatic classification algorithm was applied, which produces an automatic classification from the given examples and the indicated features. For both spatial and spectral resolution, we worked with three classes (Table 2), depending on the characteristics of the objects. For each class used, 100 examples were provided, following a stratified random sampling that ensured that all the study area was represented in this sampling.
In this case, the classes have a large variability of shapes and sizes; therefore, the classification is complicated and must be optimized after the first classification, since it is not as close as possible to the reality of the image. Fuzzy logic was used for this purpose, consisting of applying ranges of values for the most representative characteristics of each class. This classification system made it possible to consider the attributes of the objects and their relationships [54]. The parameter ranges were bounded by the threshold T, given by the SEaTH algorithm in the previous step.

2.3.4. Classification Validation

To analyze the accuracy of the classifications, the total accuracy of each classification was extracted from the corresponding error matrix, which consists of matrices of columns and rows corresponding to the objects assigned to a given field-verified class [55,56]. The error matrix is the most widely used tool in the evaluation of the accuracy of thematic classification [57]. These matrices compare the reference data and compare it with the classification generated by the software.

2.3.5. Analysis of Changes in the Structure and Dynamics of J. Communis Populations

To analyze the possible determinants of changes in population structure and dynamics, we first extracted the polygons corresponding to the shrubs in the classifications obtained for each year (Table 1). In this work, we will use the term “individual”, although due to the type of growth of these shrubs, it is not possible to certainly know the number of individuals that form each shrub patch recognized in the segmentation. Then, we evaluated the changes along the four decades studied in the number of individuals and total canopy cover. To explore changes in the population structure of shrub canopy cover over the period, changes in kurtosis and skewness were evaluated. The complete range of shrub canopy sizes was also divided into four classes using the interannual mean of the area quartiles for each year, and the changes throughout the years in the number of individuals in each size class were shown. Finally, information about land cover and land use in the study area were collected.

3. Results

3.1. Segmentation and Validation of Image Segmentations

The segmentation time of the highest resolution images (0.5 m/pixel) was longer than the lowest resolution ones (1 m/pixel; Table 3). A total of 81,000 segmentations were validated, with longer validation times for the highest resolution images.
In all segmentations, similar behaviors were observed between the parameters of scale, shape, and compactness with respect to the ED2 index. Thus, specific ranges of scale in each image gave the lowest ED2 values, while moving away from these values increased ED2. Higher values of shape elevated ED2. Compactness did not affect ED2 with a given pattern. For each year, the image segmentation used was the one with the lowest ED2 index in the validation of the segmentations (Table 4). The most accurate segmentations were those in 1977, 1984, and 1997. With spatial resolutions of 1 m, the scale parameter was lower, being higher with spatial resolutions of 0.5 m. The form and compactness parameters had no significant differences according to the spatial resolution of the image since they are characteristics of the objects that remain constant in the images. The PSE index indicated that in all segmentations processed there was a low degree of under-segmentation. The NSR index showed that in all the segmentations there was a good object-segment relationship and that almost all objects in the image corresponded to a segment. The ED2 index indicated a good segmentation fit, both geometrically (PSE) and arithmetically (NSR), in all images (Table 4).

3.2. Classification and Optimization of Image Classification

The separability value J indicated which characteristics of the classes provided a better classification of the objects generated in the segmentation. For the classification of the segments, the characteristics with J values closer to 2 were selected for each class (Table 5).
The characteristics derived from the texture (GLCM) and brightness were the most present in all classifications. The optimization of the first classification was performed using fuzzy logic, applying the T thresholds calculated by the SEaTH algorithm (Table 6).
In terms of overall classification accuracy, all the image classifications had high accuracy, with the lowest being the 1997 classification with an overall accuracy of 0.85. In addition, there was variation in the number of individuals classified in all years (Table 7). Based on these classifications, maps of J. communis were produced for each year (Figure 3).

3.3. Changes in Population Structure and Dynamics

The maps obtained were used to estimate the number of individuals and their surface canopy area for the four dates studied (Table 8). The number of individuals also decreased after the fire (1983) from 752 individuals in 1977 to 433 in 1984 (Figure 4a), then it decreased a little more in 1977, reaching a minimum of 420 individuals. Since 1997, there has been a slight recovery in the number of individuals, reaching 578 in 2008. Although the number of individuals decreased, the extent of total canopy cover first decreased after the fire (1983) by 12,505 m2 from 1977 to 1984, but then strongly recovered, being 1248 m2 greater in 2008 than 1977. Since 1984, there has been an increase of 7846 m2 in the surface canopy area of junipers at the study site (Figure 4b).
The predominant individuals in all the dates studied are those of smaller sizes (4 m2–66.5 m2). Larger individuals (122 m2–791 m2) are not abundant at any time. The distributions of the four dates studied appear skewed toward smaller population sizes. None of the populations studied appear uniformly distributed in size (Figure 5).
The division of the total number of individuals of J. communis according to the mean quartiles of the size their canopy covers in each year was as follows: small (G1), from 4 m2 to 39 m2; small-medium (G2), with individuals from 39 m2 to 66.5 m2; medium (G3), with individuals from 66.5 m2 to 122 m2; and large (G4), with individuals from 122 m2 to 791 m2. These classes showed different behaviors during the period studied (Figure 6), with the largest classes, G3 and G4, varying the least in number. Almost none of the largest shrubs (G4) were lost during the wildfire. The smallest class of shrubs, G1, experienced the greatest loss of individuals and did not recover to pre-fire levels, reducing its number by 156. All shrub size classes lost individuals in the 1977–1984 period.

4. Discussion

In this work, we developed a protocol for automatically monitoring persistent shrub populations (i.e., Juniperus communis L.) over several decades by a semi-automatic optimization of OBIA on very high-resolution aerial or satellite images. The semi-automatic extraction of the combination of parameters that provides the best segmentation of the images by OBIA is the main contribution to this article, being normally a very time-consuming process [48]. According to [46], determining the best segmentation parameters is a laborious process. Nevertheless, this work shows a method to determine the effect of the variation of the segmentation parameters (scale, shape, and compactness) highlighting the scale in this technique [44,58], as well as the effect of the variation of the other parameters on the result. The increasing use of OBIA in different fields of biodiversity conservation highlights its success in vegetation monitoring, having been used for multiple purposes, such as forest inventories [59,60], changes in vegetation cover [61], or studies of vegetation structure [22]. OBIA has been used for monitoring long-lived animal species [62] but not persistent plants after a fire, as we have performed in this work.
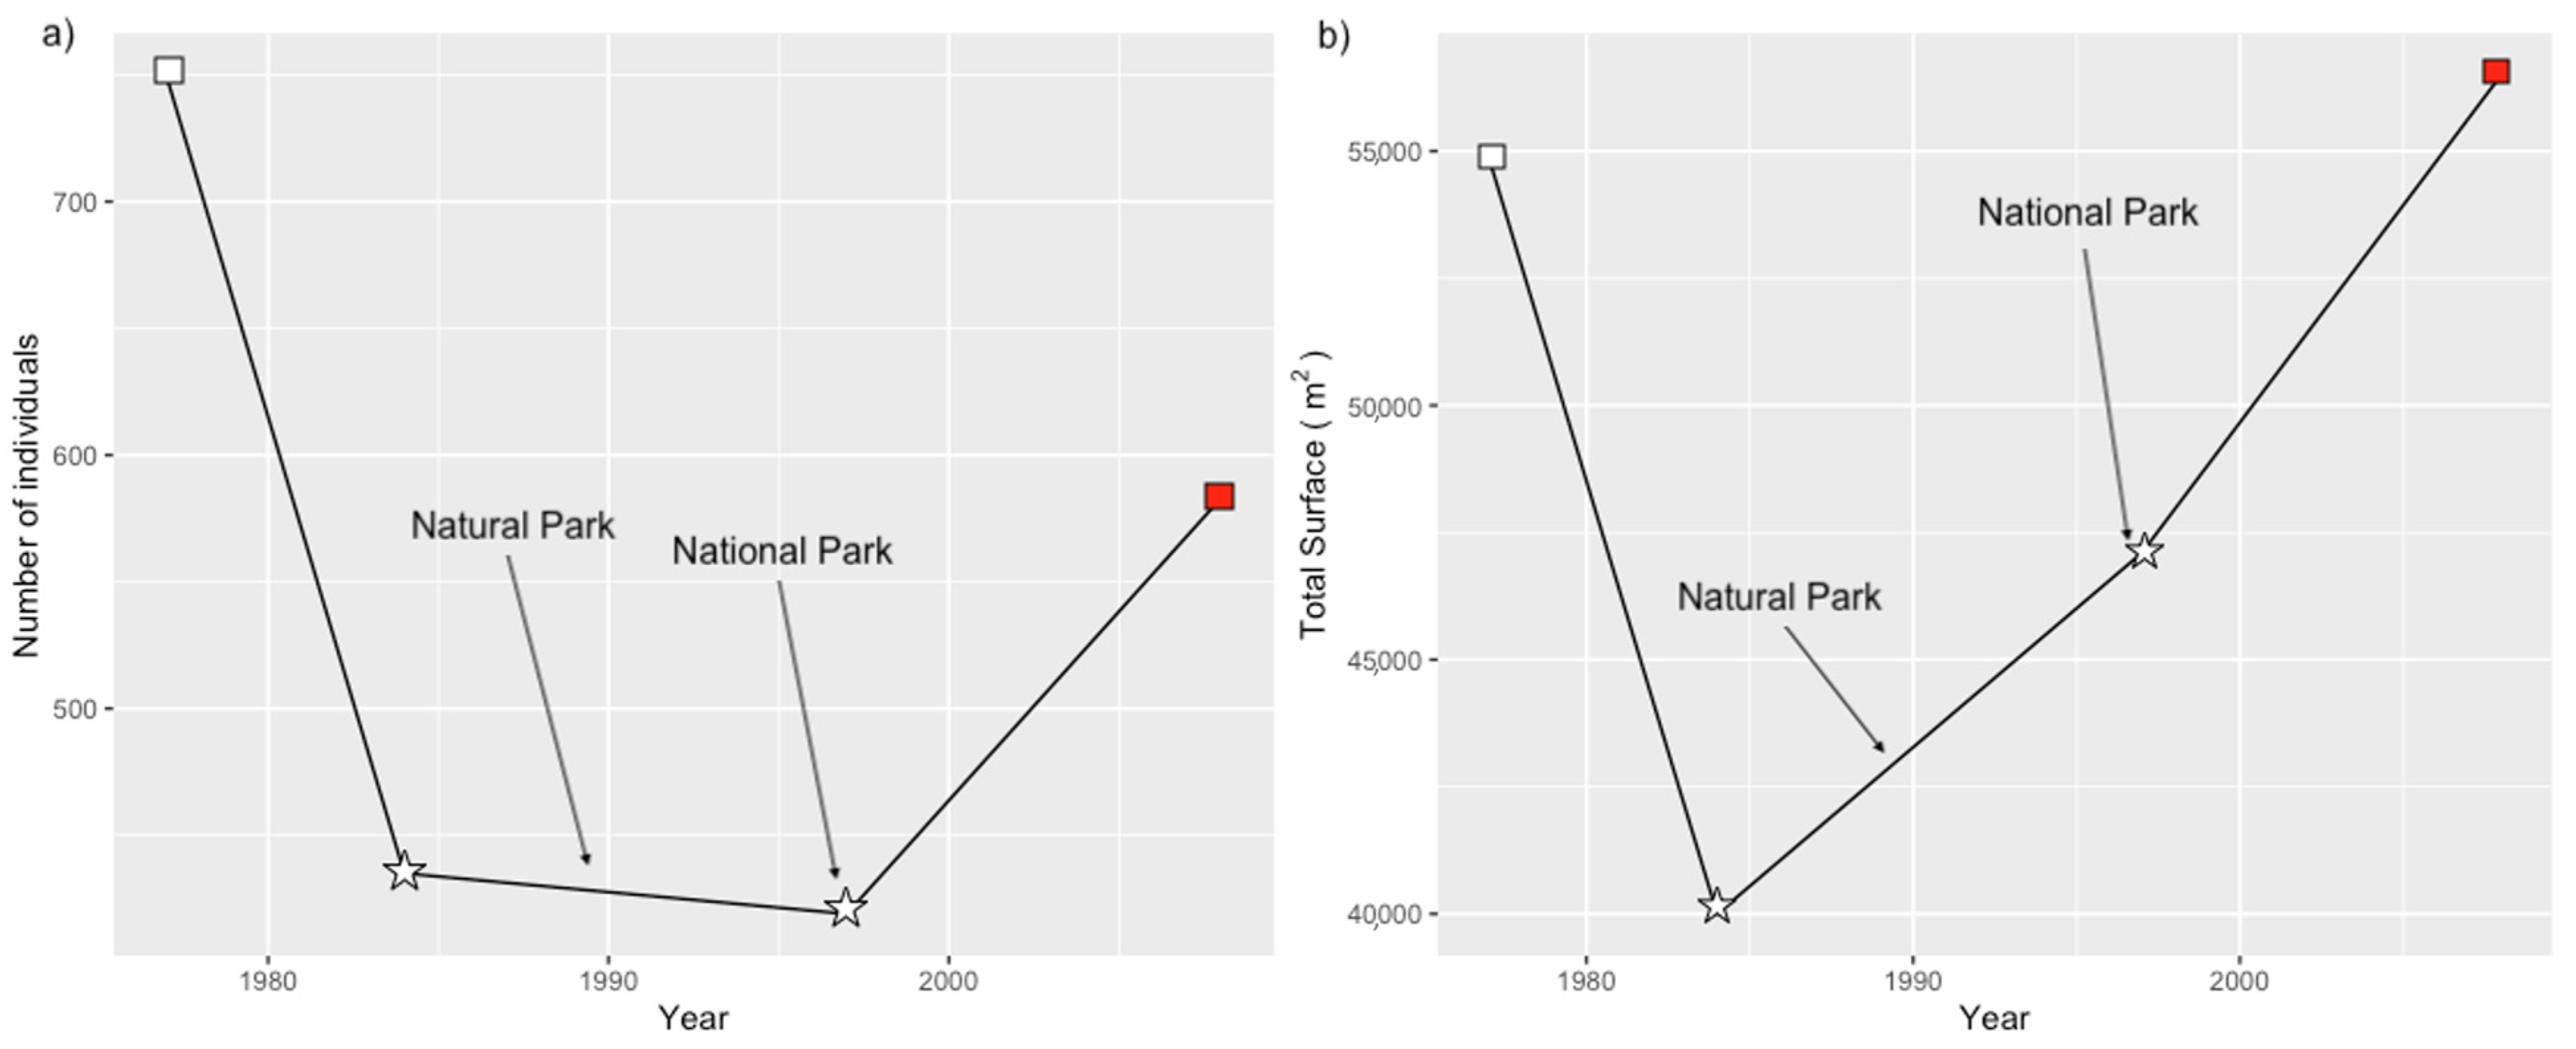
The positive effect on the population of J. communis of the designation of Sierra Nevada as a Natural Park in 1989 and as a National Park in 1999 can be observed. After Sierra Nevada acquired both protection statuses, the area occupied by J. communis increased, perhaps due to the increased protection of the individuals that were recovering and colonizing after the 1983 wildfire. Nevertheless, an increase in the number of individuals is only observed after the creation of the National Park in 1999, which may be due to this increased protection or to the slow growth of junipers, which may delay the moment of detection by aerial images due to the small size of the juveniles [
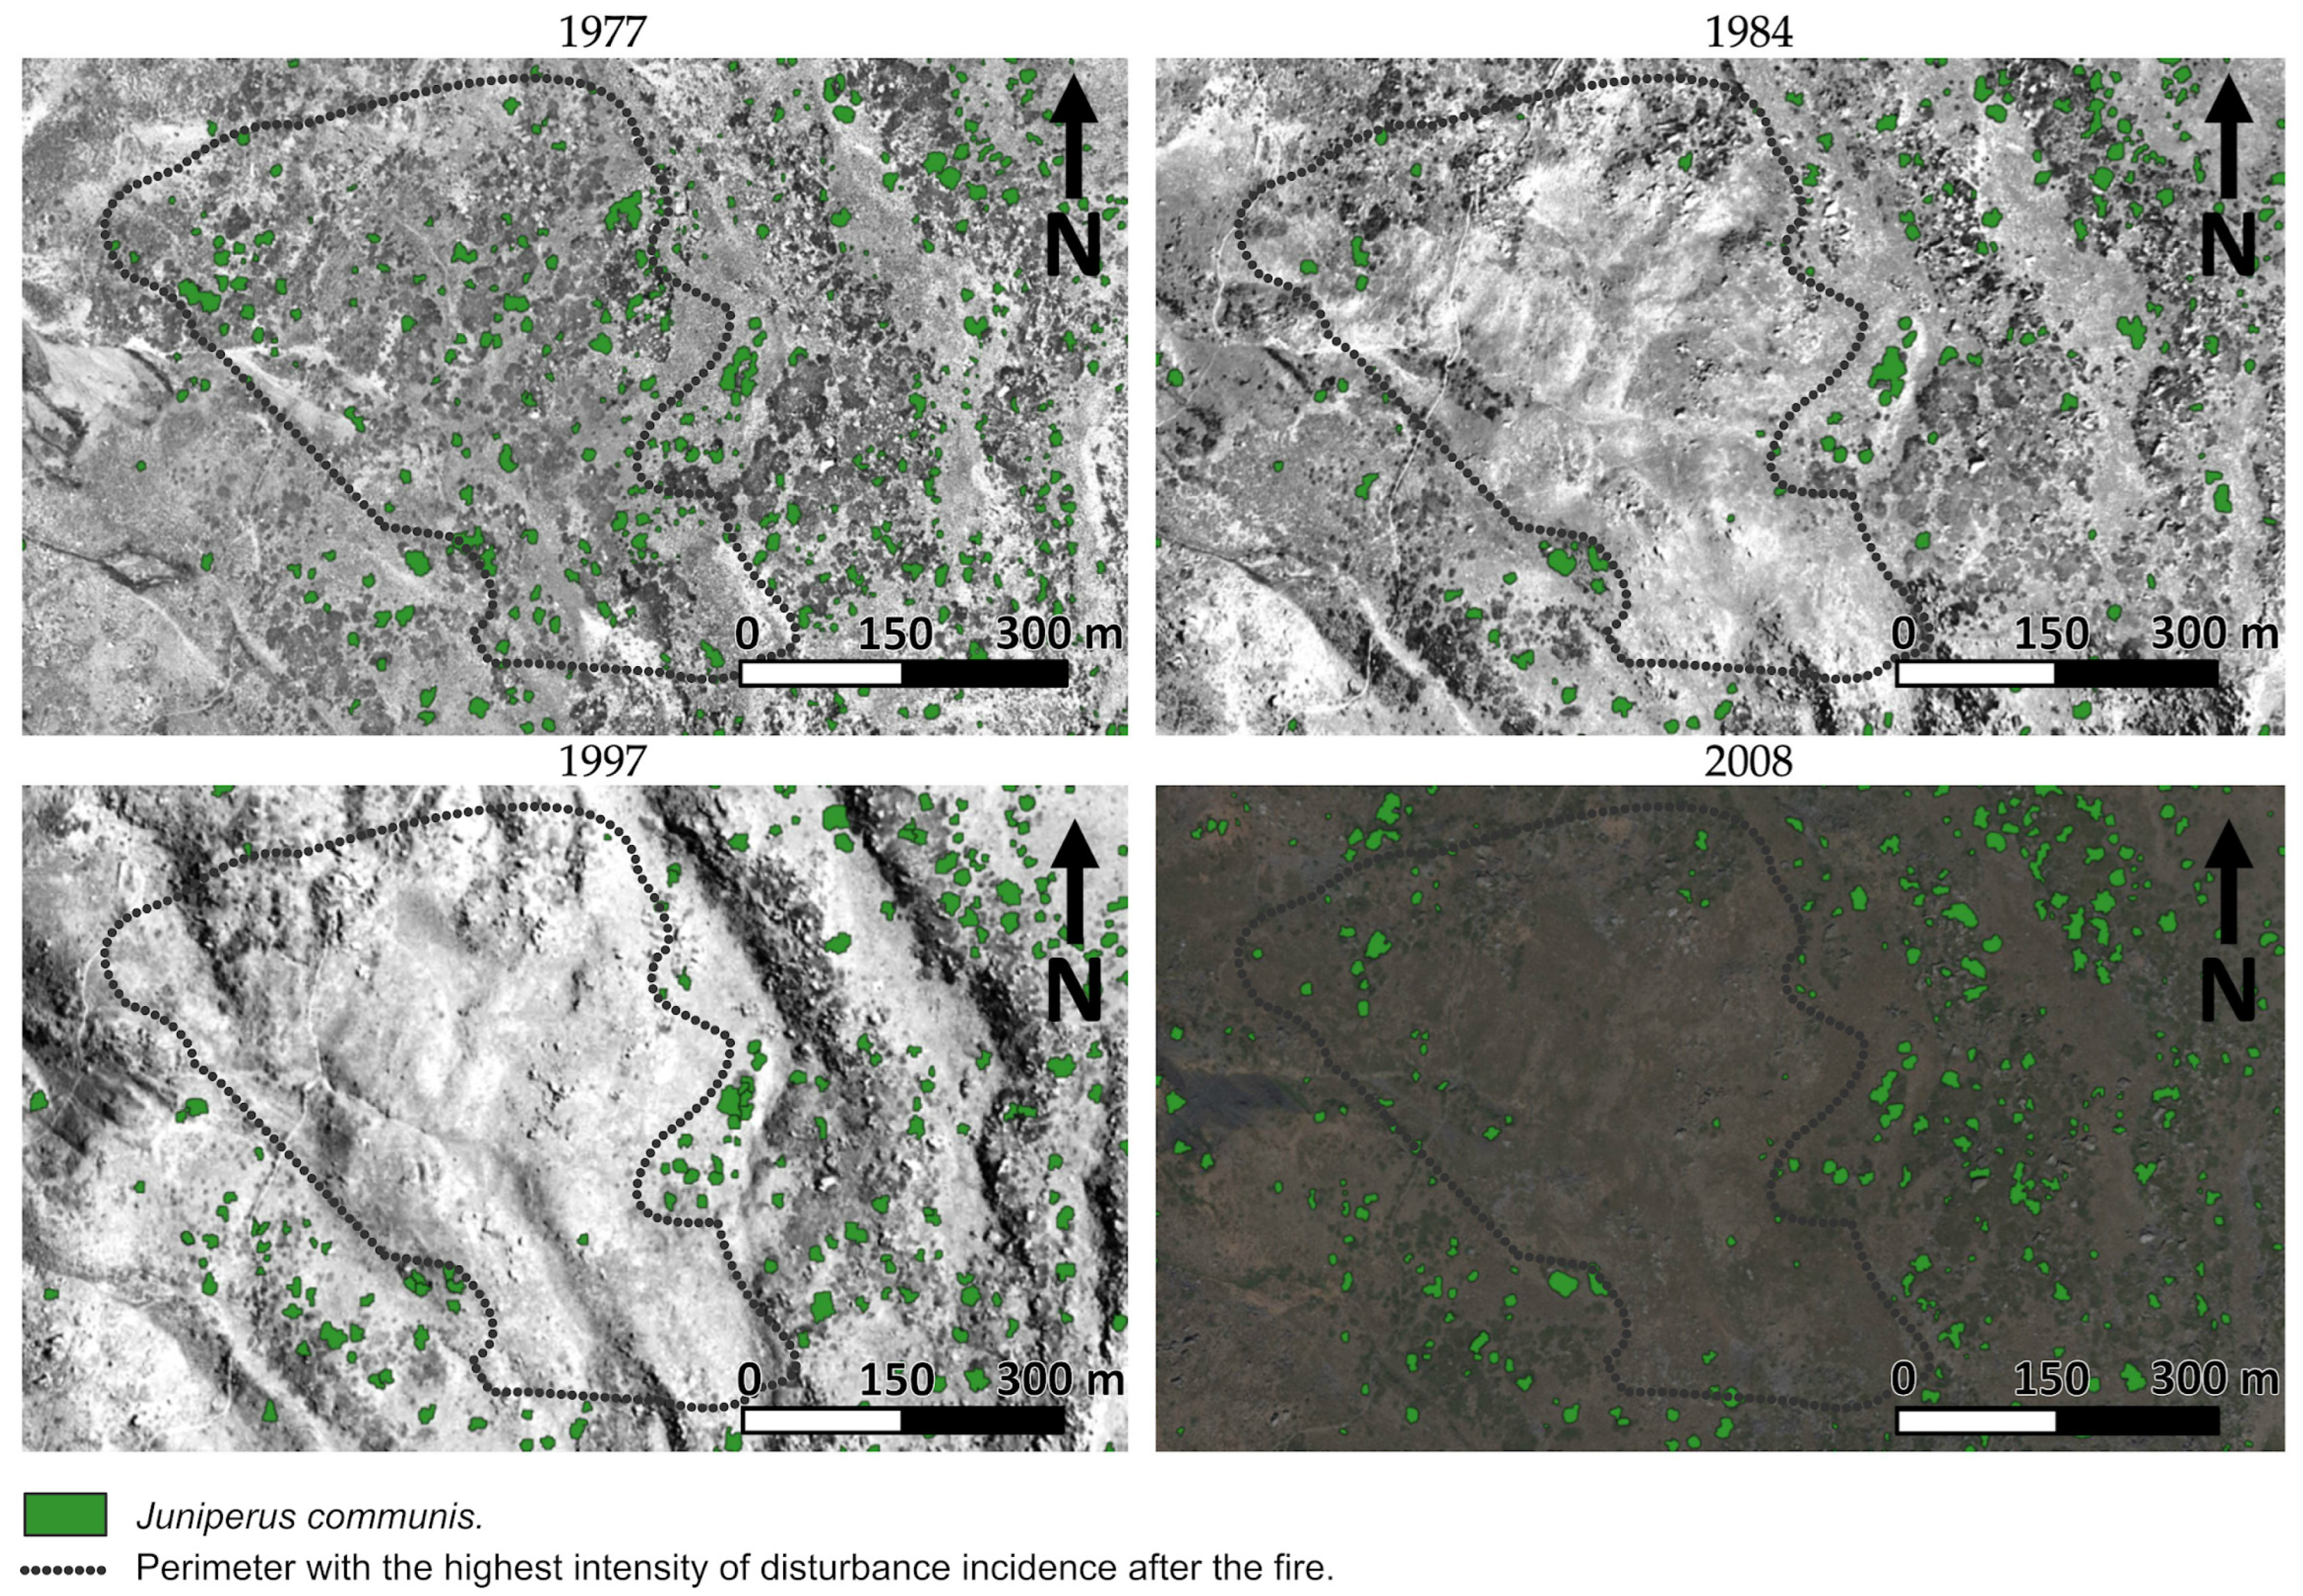
10]. In the period of 1977–1984, there was a great decrease in the number of individuals due to the fire that occurred in 1983. 
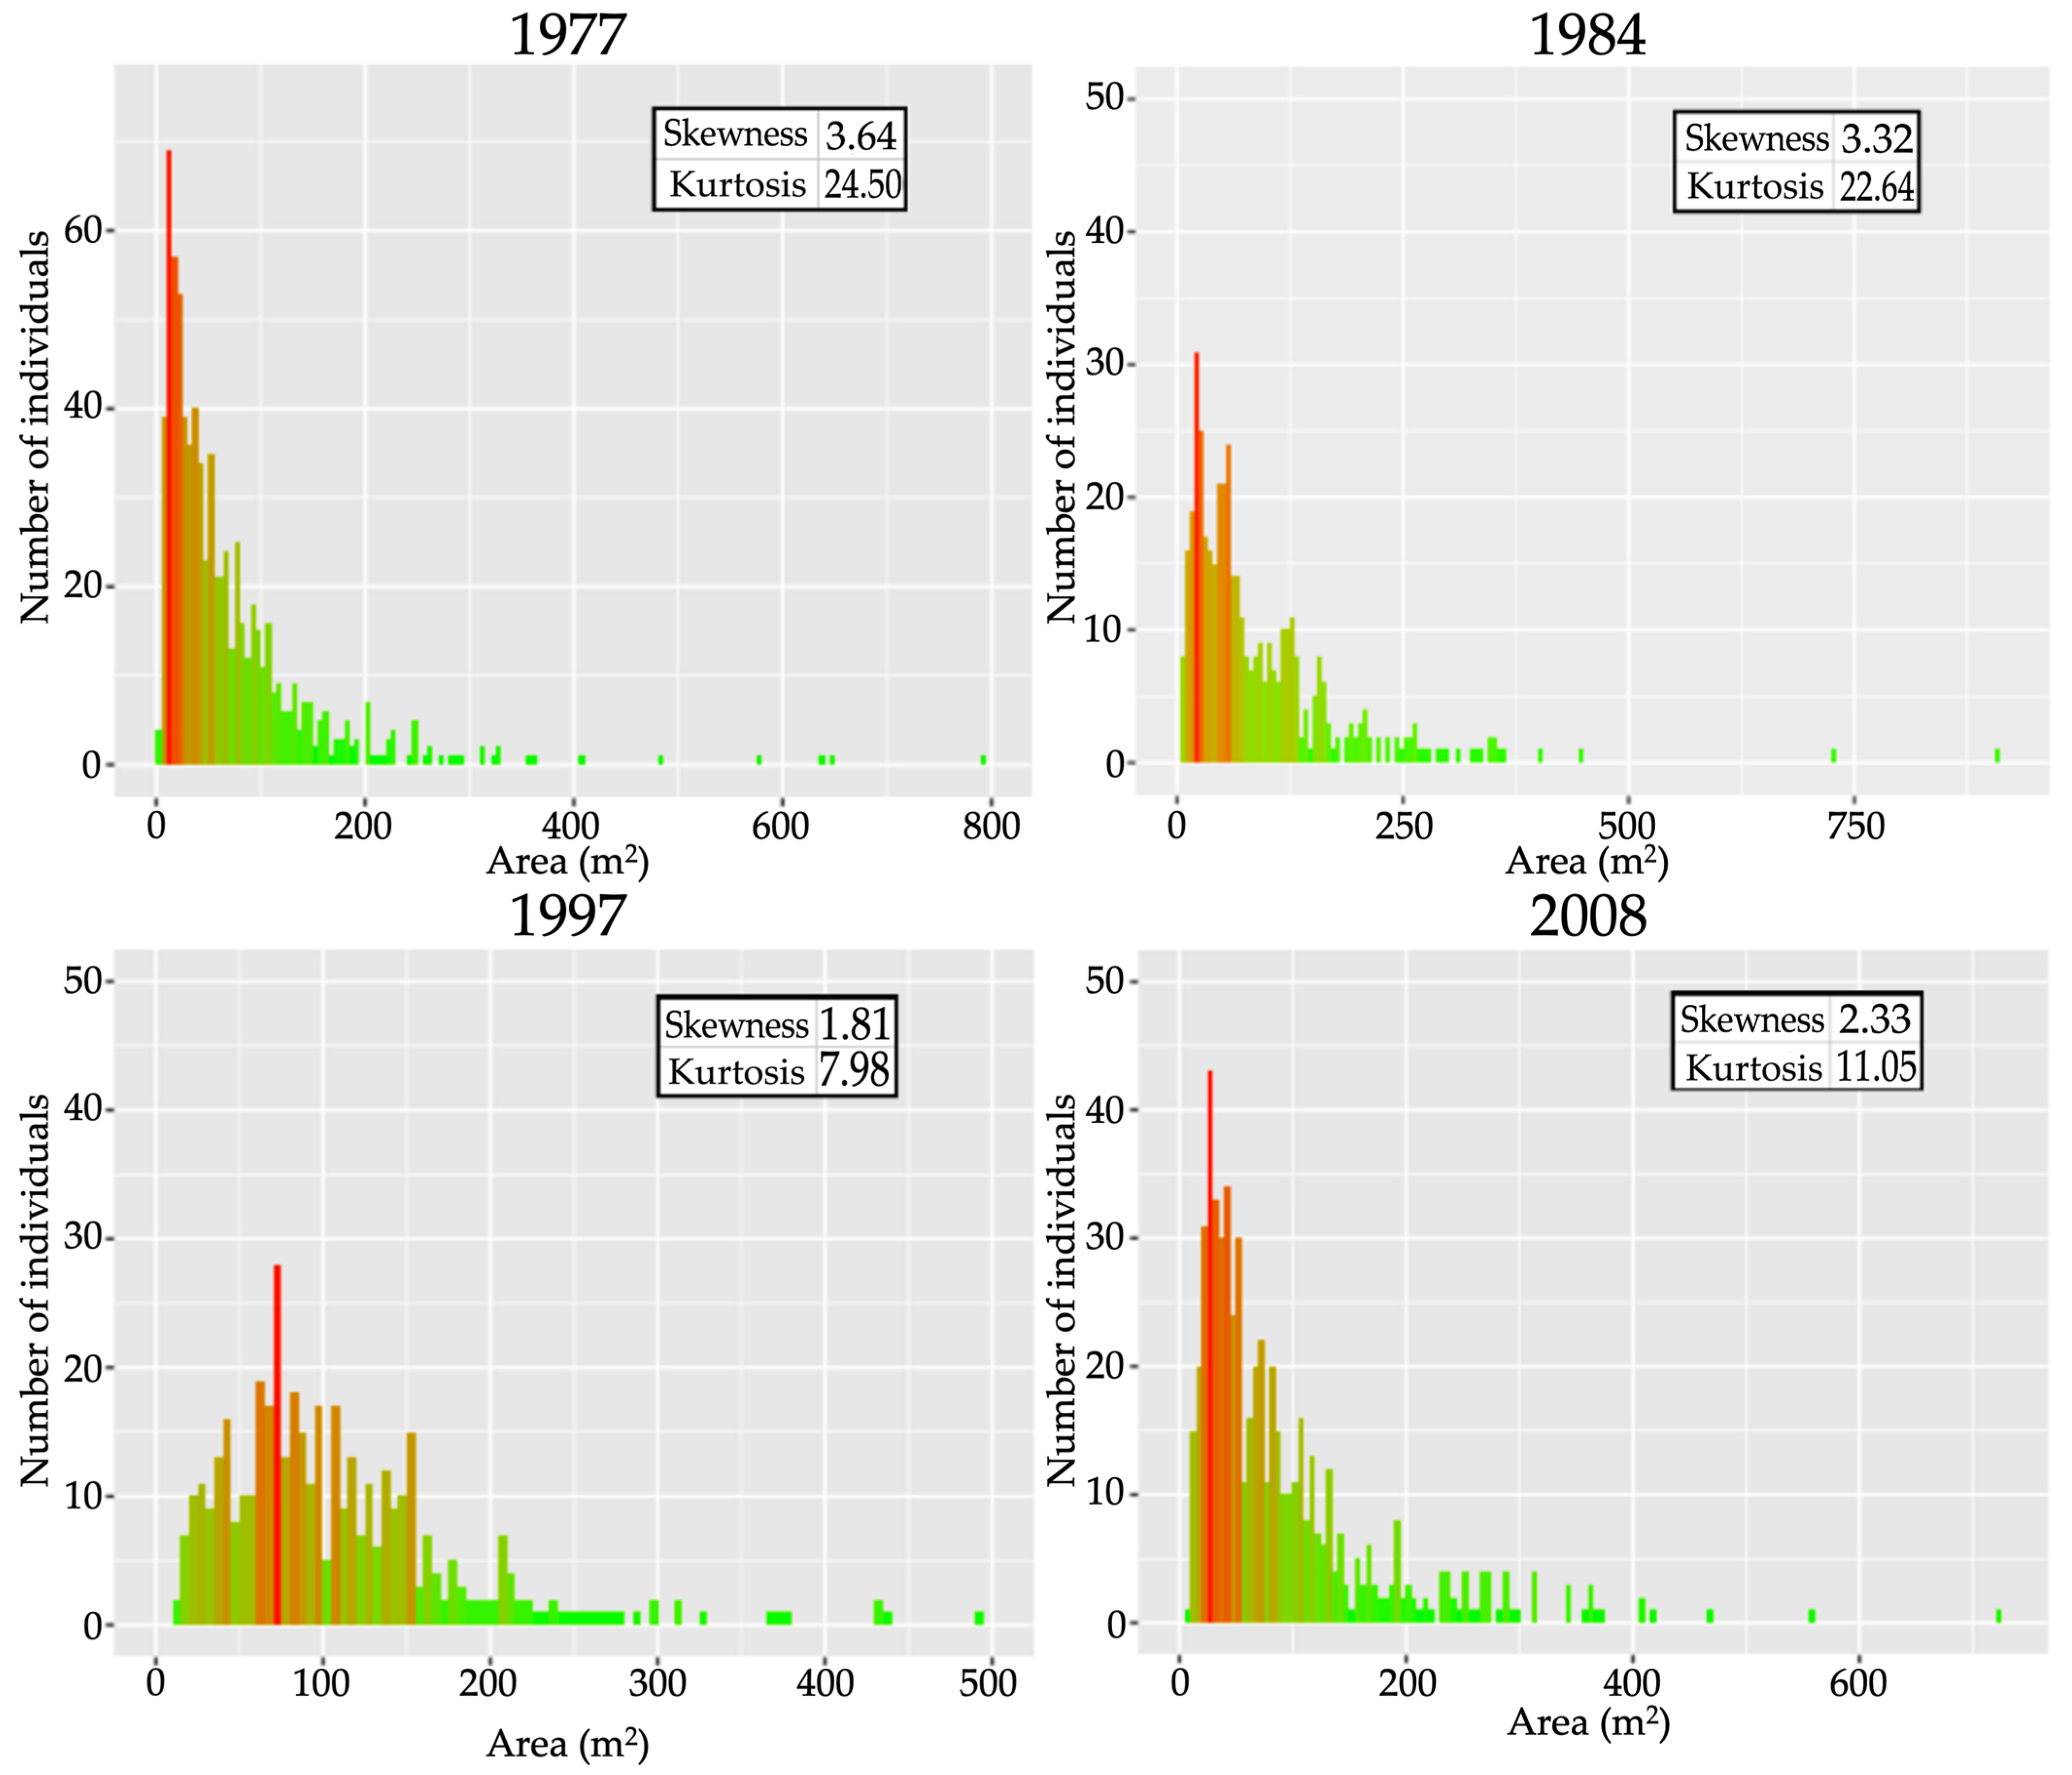
J. communis is a species whose seeds largely die after fires and has no ability to resprout [10,20]. The largest junipers were less affected by fire but smaller individuals were greatly affected (Figure 6), as occurs in other species [63]. Such homeostasis of the largest individuals may be due to the typical strategy observed in persistent species. This, together with the low success in the recruitment of the species in the study area and, therefore, the loss of colonization capacity of the burned areas [10,20,36], has led to a lack of juniper regeneration, so only the largest individuals remained, not reaching levels of canopy cover similar to those detected in 1977. In this area, there has also been strong pressure from livestock and irrigation channels, which have now been largely abandoned [40,41]. In this context, a decrease in human populations in the Sierra Nevada has been observed in recent decades, which may imply an improvement in Juniperus communis populations due to a decrease in human land use [41,64]. Nevertheless, the almost null recovery of J. communis after anthropic disturbances is remarkable [10,20]. The improvement of this population does not seem to be affected by the decrease in habitat quality [65], despite the fact that an increase in temperatures and a decrease in the protective snow cover has been observed in recent decades, with an increase in dryness in the area and an extreme drought in 2005 [66]. Although the populations of J. communis of Sierra Nevada have been reported to be highly resistant to snowfall, summer drought, browsing, and trampling by livestock [42,66], it is necessary to avoid further losses in these populations given the complexity of their restoration [42].
Although the method described in this work can provide high accuracy, the results should be analyzed with caution. Shadows from tall specimens can influence segmentation, delimiting areas of uncertainty [67,68]. In addition, the spatial resolution and contrast of the images are slightly variable, which can lead to an overestimation of individuals in some cases, especially in panchromatic or low-resolution images [46,69]. To minimize the effect of errors in image acquisition, which can affect the identification and classification of individuals [70], it is necessary to take into account the time of year, day, and time of image captures. Likewise, the large size observed in some shrubs may be due to the union of several individuals in the same patch of dense vegetation. This makes it practically impossible to differentiate them by OBIA due to their similar characteristics, or even to identify them in the field, which can lead to an underestimation of the number of individuals in some cases [61]. For better identification of individuals in future studies, it may be useful to use hyperspectral or multispectral images [71] together with deep learning [72] to facilitate the identification of individuals with similar characteristics.
The selection of an appropriate range of canopy sizes and shapes when applying examples for both segmentation and classification validation can affect image analysis [56]. The detection of small individuals may be conditioned by the spatial resolution of the images, which will generate more or less accurate segments with respect to reality depending on this resolution. Likewise, a classification may appear to be conditioned either by an excessive heterogeneity of the images, which may mean that, in some cases, an individual has been wrongly classified, or by an excessive homogeneity of the images, with insufficient differentiation between objects [73]. The use of a larger number of images, with shorter time intervals between them can lead to more accurate monitoring of populations [61].

5. Conclusions

Our findings highlight the high benefit and reduced cost of using OBIA on very high-resolution aerial or satellite images for monitoring persistent shrub plant communities after a fire. This implies a significant reduction in resources, both logistical and economic, in biodiversity management. The methodology developed in this work allows, quickly and economically, to know the size structure of long-lived shrub populations and their dynamics over time. In this way, it is possible to evaluate the regeneration process in which they are found and their conservation status. In addition, the behavior of these long-lived species with respect to the environment and disturbances, such as forest fires, can be determined [74,75,76]. This information not only allows us to know the past but also enables more effective management in the future [77], knowing how the populations studied react to certain environmental conditions and management. The possibility of annual monitoring of populations thanks to the availability of high-resolution images, from those taken by drones to satellite images [78,79,80], would make it possible to acquire information in short time frames. This would allow one to know not only the behavior of populations over long periods of time, but also their responses to disturbances, such as fires, over large areas of land. This work provides an additional example of how remote-sensing technologies can contribute to conservation in a biodiversity super-hotspot such as Sierra Nevada (Spain) [81].

Author Contributions

J.B.-S.: formal analysis, conceptualization, writing—original draft, methodology, visualization; E.G.: conceptualization, methodology, writing—revision and editing; J.L.M.-P.: conceptualization, writing—revision; J.C.: original conceptualization, revision; E.G.-L.: conceptualization, revision; D.A.-S.: original conceptualization, supervision, and revision. All authors have read and agreed to the published version of the manuscript.

Funding

This work has received funding from the European Research Council (ERC grant agreement 647038 [BIODESERT]), the ADAPTAMED LIFE14 CCA/ES/000612 project, the RH2O-ARID project (P18-RT-5130), and the RESISTE project (P18-RT-1927), funded by the Consejería de Economía, Conocimiento, Empresas y Universidad de la Junta de Andalucía; and by the A-TIC-458-UGR18 and DETECTOR (A-RNM-256-UGR18) projects, with the contribution of the European Funds for Regional Development. E.G. was supported by the Generalitat Valenciana and the European Social Fund (APOSTD/2021/188). This work is part of the “Thematic Center on Mountain Ecosystem & Remote sensing, Deep learning-AI e-Services University of Granada-Sierra Nevada” (LifeWatch-2019-10-UGR-01) project, which has been co-funded by the Ministry of Science and Innovation through the FEDER funds from the Spanish Pluriregional Operational Program 2014–2020 (POPE), LifeWatch-ERIC action line, within the Workpackages LifeWatch-2019-10-UGR-01_WP-8, LifeWatch-2019-10-UGR-01_WP-7, and LifeWatch-2019-10-UGR-01_WP-4.

Data Availability Statement

The data presented in this study are available on reasonable request from the corresponding author.

Acknowledgments

We thank the three anonymous reviewers that helped to improve this manuscript with their comments.

Conflicts of Interest

The authors declare no conflict of interest.

References

  1. Eriksson, O. Regional dynamics of plants: A review of evidence for remnant, source-sink and metapopulations. Oikos 1996, 77, 248–258. [Google Scholar] [CrossRef]
  2. Meffe, G.K.; Carroll, C.R. Principles of Conservation Biology; Sinauer: Sunderland, MA, USA, 1994. [Google Scholar]
  3. Kallio, P.; Laine, U.; Mäkinen, Y. Flora of Inari Lapland. 2. Pinaceae and Cupressaceae. Rep. Kevo Subarctic. Res. Stat. 1971, 8, 73–100. [Google Scholar]
  4. Everham, E.M.; Brokaw, N.V.L. Forest damage and recovery from catastrophic wind. Bot. Rev. 1996, 62, 113–185. [Google Scholar] [CrossRef]
  5. Hodgkinson, K.C. Sprouting success of shrubs after fire: Height-dependent relationships for different strategies. Oecologia 1998, 115, 64–72. [Google Scholar] [CrossRef]
  6. Bellingham, P.J.; Sparrow, A.D. Resprouting as a life history strategy in woody plant communities. Oikos 2000, 89, 409–416. [Google Scholar] [CrossRef]
  7. Garcia, D.; Zamora, R. Forum Persistence, multiple demographic strategies and conservation in long-lived Mediterranean plants. J. Veg. Sci. 2003, 14, 921–926. [Google Scholar] [CrossRef]
  8. Enright, N.J.; Lamont, B.B. Recruitment variability in the resprouting shrub Banksia attenuata and non-sprouting congeners in the northern sandplain heaths of southern Australia. Acta Oecol. 1992, 13, 727–741. [Google Scholar]
  9. Kruger, L.M.; Midgley, J.J.; Cowling, R.M. Resprouters vs. reseeders in South African forest trees; a model based on forest canopy height. Funct. Ecol. 1997, 11, 101–105. [Google Scholar] [CrossRef]
  10. García, D.; Zamora, R.; Hódar, J.A.; Gómez, J.M. Age structure of Juniperus communis L. in the Iberian Peninsula: Conservation of remnant populations in Mediterranean mountains. Biol. Conserv. 1999, 87, 215–220. [Google Scholar] [CrossRef]
  11. Dupuy, J.L.; Fargeon, H.; Martin-StPaul, N.; Pimont, F.; Ruffault, J.; Guijarro, M.; Hernando, C.; Madrigal, J.; Fernandes, P. Climate change impact on future wildfire danger and activity in southern Europe: A review. Ann. For. Sci. 2020, 77, 1–24. [Google Scholar] [CrossRef]
  12. He, T.; Lamont, B.B.; Pausas, J.G. Fire as a key driver of Earth’s biodiversity. Biol. Rev. 2019, 94, 1983–2010. [Google Scholar] [CrossRef] [PubMed]
  13. Kelly, L.T.; Giljohann, K.M.; Duane, A.; Aquilué, N.; Archibald, S.; Batllori, E.; Bennett, A.F.; Buckland, S.T.; Canelles, Q.; Clarke, M.F.; et al. Fire and Biodiversity in the Anthropocene. Science 2020, 80, 370. [Google Scholar] [CrossRef] [PubMed]
  14. Noss, R.F.; Franklin, J.F.; Baker, W.L.; Schoennagel, T.; Moyle, P.B. Managing fire-prone forests in the western United States. Front. Ecol. Environ. 2006, 4, 481–487. [Google Scholar] [CrossRef] [Green Version]
  15. Sankaran, M.; Hanan, N.P.; Scholes, R.J.; Ratnam, J.; Augustine, D.J.; Cade, B.S.; Gignoux, J.; Higgins, S.I.; le Roux, X.; Ludwig, F.; et al. Determinants of woody cover in African savannas. Nature 2005, 438, 846–849. [Google Scholar] [CrossRef] [PubMed]
  16. Pierce, J.L.; Meyer, G.A.; Timothy Jull, A.J. Fire-induced erosion and millennial-scale climate change in northern ponderosa pine forests. Nature 2004, 432, 87–90. [Google Scholar] [CrossRef] [PubMed]
  17. Lasslop, G.; Coppola, A.I.; Voulgarakis, A.; Yue, C.; Veraverbeke, S. Influence of fire on the carbon cycle and climate. Curr. Clim. Chang. Rep. 2019, 5, 112–123. [Google Scholar] [CrossRef]
  18. Russell-Smith, J.; Yates, C.P.; Whitehead, P.J.; Smith, R.; Craig, R.; Allan, G.E.; Gill, A.M. Bushfires ‘down under’: Patterns and implications of contemporary Australian landscape burning. Int. J. Wildland Fire 2007, 16, 361–377. [Google Scholar] [CrossRef]
  19. Clarke, P.J.; Lawes, M.J.; Midgley, J.J.; Lamont, B.B.; Ojeda, F.; Burrows, G.E.; Knox, K.J.E. Resprouting as a key functional trait: How buds, protection and resources drive persistence after fire. New Phytol. 2013, 197, 19–35. [Google Scholar] [CrossRef] [Green Version]
  20. Zamora, R.; Gómez, J.M.; García, D.; Hódar, J.A. Ecología reproductiva y regeneración del matorral de la alta montaña de Sierra Nevada: Capacidad de respuesta a las perturbaciones. In Sierra Nevada: Conservación y Desarrollo Sostenible (2); Chacón, J., Rosúa, J.L., Eds.; Universidad de Granada: Granada, Spain, 1996; pp. 407–422. [Google Scholar]
  21. Archibald, S. Managing the human component of fire regimes: Lessons from Africa. Philos. Trans. R. Soc. B Biol. Sci. 2016, 371, 20150346. [Google Scholar] [CrossRef]
  22. Johansen, K.; Coops, N.C.; Gergel, S.E.; Stange, J. Application of high spatial resolution satellite imagery for riparian and forest ecosystem classification. Remote Sens. Environ. 2007, 110, 29–44. [Google Scholar] [CrossRef]
  23. Pascual, C.; García-Abril, A.; García-Montero, L.G.; Martín-Fernández, S.; Cohen, W.B. Object-based semi-automatic approach for forest structure characterization using lidar data in heterogeneous Pinus sylvestris stands. For. Ecol. Manag. 2008, 255, 3677–3685. [Google Scholar] [CrossRef] [Green Version]
  24. Stow, D.; Hamada, Y.; Coulter, L.; Anguelova, Z. Monitoring shrubland habitat changes through object-based change identification with airborne multispectral imagery. Remote Sens. Environ. 2008, 112, 1051–1061. [Google Scholar] [CrossRef]
  25. Blaschke, T.; Johansen, K.; Tiede, D. Object-Based Image Analysis for Vegetation Mapping and Monitoring. In Advances in Environmental Remote Sensing; Wiley: Hoboken, NJ, USA, 2011; pp. 241–271. [Google Scholar]
  26. Cicala, L.; Angelino, C.V.; Parrilli, S.; Fiscante, N.; Ullo, S.L.; Addabbo, P. Unsupervised post-fire assessment of burned areas with free and open multispectral data using OBIA. In Proceedings of the GEOBIA 2018-From Pixels to Ecosystems and Global Sustainability, Montpellier, France, 18–22 June 2018. [Google Scholar]
  27. Carvajal-Ramírez, F.; Marques da Silva, J.R.; Agüera-Vega, F.; Martínez-Carricondo, P.; Serrano, J.; Moral, F.J. Evaluation of fire severity indices based on pre-and post-fire multispectral imagery sensed from UAV. Remote Sens. 2019, 11, 993. [Google Scholar] [CrossRef] [Green Version]
  28. Gao, Y.; Kerle, N.; Mas, J.F. Object-based image analysis for coal fire-related land cover mapping in coal mining areas. Geocarto Int. 2009, 24, 25–36. [Google Scholar] [CrossRef]
  29. Fernández-Manso, O.; Quintano, C.; Fernández-Manso, A. Combining spectral mixture analysis and object-based classification for fire severity mapping. For. Syst. 2009, 18, 296–313. [Google Scholar] [CrossRef]
  30. Scheiewe, J.; Tufte, L.; Ehlers, M. Potential and problems of multi-scale segmentation methods in remote sensing. GeoBIT/GIS 2001, 6, 34–39. [Google Scholar]
  31. Blaschke, T. Object-based contextual image classification built on image segmentation. In Advances in Techniques for Analysis of Remotely Sensed Data, 2003 IEEE Workshop; IEEE: Piscataway, NJ, USA, 2003; pp. 113–119. [Google Scholar]
  32. Weih, R.C.; Riggan, N.D. Object-based classification vs. pixel-based classification: Comparative importance of multi-resolution imagery. Int. Arch. Photogramm. Remote Sens. Spat. Inf. Sci. 2008, 38, C7. [Google Scholar]
  33. Blaschke, T. Object based image analysis for remote sensing. ISPRS J. Photogramm. Remote Sens. 2010, 65, 2–16. [Google Scholar] [CrossRef] [Green Version]
  34. Aksoy, S.; Tilton, J.C.; Tarabalka, Y. Image segmentation algorithms for land categorization. In Remote Sensing Handbook V.1 Remotely Sensed Data Characterization, Classification, and Accuracies; Taylor & Francis: Abingdon, UK, 2015; pp. 317–342. [Google Scholar]
  35. Zhan, Q.; Molenaar, M.; Tempfli, K.; Shi, W. Quality assessment for geo-spatial objects derived from remotely sensed data. Int. J. Remote Sens. 2005, 26, 2953–2974. [Google Scholar] [CrossRef]
  36. Rivas-Martínez, S. Memoria del Mapa de Series de Vegetación de España 1: 400.000; ICONA. Ministerio de Agricultura, Pesca y Alimentación: Madrid, Spain, 1987; 268p. [Google Scholar]
  37. Benito, B.; Lorite, J.; Peñas, J. Simulating potential effects of climatic warming on altitudinal patterns of key species in Mediterranean-alpine ecosystems. Clim. Chang. 2011, 108, 471–483. [Google Scholar] [CrossRef]
  38. García, D.; Zamora, R.; Gómez, J.M.; Jordano, P.; Hódar, J.A. Geographical variation in seed production, predation and abortion in Juniperus communis throughout its range in Europe. J. Ecol. 2000, 88, 436–446. [Google Scholar] [CrossRef]
  39. García, D.; Zamora, R.; Gomez, J.M.; Hodar, J.A. Frugivory at Juniperus communis depends more on population characteristics than on individual attributes. J. Ecol. 2001, 89, 639–647. [Google Scholar] [CrossRef] [Green Version]
  40. García, D.; Gómez, J.M.; Hódar, J.A.; y Zamora, R. Ecología reproductiva del enebro Juniperus communis L. en Sierra Nevada: Factores que determinan la regeneración natural de las poblaciones. In Sierra Nevada: Conservación y Desarrollo Sostenible; Chacón, J., Rosúa, J.L., Eds.; Universidad de Granada: Granada, Spain, 1996; Volume 2, pp. 441–453. [Google Scholar]
  41. Molero, J.; Pérez, F.; Valle, F. Parque Natural de Sierra Nevada; Ed. Rueda: Madrid, Spain, 1992. [Google Scholar]
  42. Zamora, R.J.; Barea Azcón, J.M.; Pérez Luque, A.J.; García García, D.; Aspízua, R.; Cano Manuel, F.J. Los Enebrales de la alta Montaña de Sierra Nevada: Conservación y Restauración; Consejería de Agricultura, Ganadería, Pesca y Desarrollo Sostenible, Junta de Andalucía/Universidad de Granada: Granada, Spain, 2022. [Google Scholar]
  43. Pérez-Luque, A.J.; Pérez-Pérez, R.; Bonet, F.J. Evolución del clima en los últimos 50 años en Sierra Nevada. In La Huella del Cambio Global en Sierra Nevada: Retos para la Conservación. Consejería de Medio Ambiente y Ordenación del Territorio; Zamora, R., Pérez-Luque, A.J., Bonet, F.J., Barea-Azcón, J.M., Aspizua, R., Eds.; Junta de Andalucía: Sevilla, Spain, 2015; pp. 22–24. [Google Scholar]
  44. Ryherd, S.; Woodcock, C. Combining Spectral and Texture Data in the Segmentation of Remotely Sensed Images. Photogramm. Eng. Remote Sens. 1996, 62, 181–194. [Google Scholar]
  45. Clinton, N.; Holt, A.; Scarborough, J.; Yan, L.; Gong, P. Accuracy assessment measures for object-based image segmentation goodness. Photogramm. Eng. Remote Sens. 2010, 76, 289–299. [Google Scholar] [CrossRef]
  46. Liu, Y.; Bian, L.; Meng, Y.; Wang, H.; Zhang, S.; Yang, Y.; Shao, X.; Wang, B. Discrepancy measures for selecting optimal combination of parameter values in object-based image analysis. ISPRS J. Photogramm. Remote Sens. 2012, 68, 144–156. [Google Scholar] [CrossRef]
  47. Kim, M.; Madden, M.; Warner, T. Estimation of optimal image object size for the segmentation of forest stands with multispectral IKONOS imagery. In Object-Based Image Analysis: Spatial Concepts for Knowledge-Driven Remote Sensing Applications; Blaschke, A.P., Lang, S., Hay, G.J., Eds.; Springer-Verlag: Berlin/Heidelberg, Germany, 2008; pp. 291–307. [Google Scholar]
  48. Castilla, G.; Hay, G.J. Image objects and geographic objects. In Object-Based Image Analysis: Spatial Concepts for Knowledge-Driven Remote Sensing Applications; Blaschke, T., Lang, S., Eds.; Springer-Verlag: Berling/Heidelberg, Germany, 2008; pp. 91–110. [Google Scholar]
  49. Meinel, G.; Neubert, M. A comparison of segmentation programs for high resolution remote sensing data. The International Archives of Photogrammetry. Remote Sens. Spat. Inf. Sci. 2004, 35, 1097–1102. [Google Scholar]
  50. Guirado, E.; Blanco-Sacristán, J.; Rigol-Sánchez, J.P.; Alcaraz-Segura, D.; Cabello, J. A multi-temporal object-based image analysis to detect long-lived shrub cover changes in drylands. Remote Sens. 2019, 11, 2649. [Google Scholar] [CrossRef] [Green Version]
  51. Nussbaum, S.; Niemeyer, I.; Canty, M. Feature recognition in the context of automated object-oriented analysis of remote sensing data monitoring the Iranian nuclear sites. In Proceedings of the SPIE Europe Symposium on Optics/Photonics in Security & Defence, Bruges, Belgium, 26–28 September 2005. [Google Scholar]
  52. Gao, Y.; Marpu, P.; Niemeyer, I.; Runfola, D.M.; Giner, N.M.; Hamill, T.; Pontius, R.G. Object-based classification with features extracted by a semi-automatic feature extraction algorithm—SEaTH. Geocarto Int. 2011, 26, 413. [Google Scholar] [CrossRef]
  53. Laliberte, A.S.; Browning, D.M.; Rango, A. A comparison of three feature selection methods for object-based classification of sub-decimeter resolution UltraCam-L imagery. Int. J. Appl. Earth Obs. Geoinf. 2012, 15, 70–78. [Google Scholar] [CrossRef]
  54. Gitas, I.Z.; Mitri, G.H.; Ventura, G. Object-based image classification for burned area mapping of Creus Cape, Spain, using NOAA-AVHRR imagery. Remote Sens. Environ. 2004, 92, 409–413. [Google Scholar] [CrossRef]
  55. Story, M.; Congalton, R. Accuracy assessment: A user’s perspective. Photogramm. Eng. Remote Sens. 1986, 52, 397–399. [Google Scholar]
  56. Congalton, R.G. A review of assessing the accuracy of classifications of remotely sensed data. Remote Sens. Environ. 1991, 37, 35–46. [Google Scholar] [CrossRef]
  57. Lunetta, R.S.; Congalton, R.G.; Fenstermaker, L.K.; Jensen, J.R.; McGwire, K.C.; Tinney, L.R. Remote sensing and geographic information system data integration: Error sources and research issues. Photogramm. Eng. Remote Sens. 1991, 57, 677–687. [Google Scholar]
  58. Addink, E.A.; de Jong, S.M.; Pebesma, E.J. The Importance of Scale in Object-based Mapping of Vegetation Parameters with Hyperspectral Imagery. Photogramm. Eng. Remote Sens. 2007, 73, 905–912. [Google Scholar] [CrossRef] [Green Version]
  59. Chubey, M.S.; Franklin, S.E.; Wulder, M.A. Object-based analysis of IKONOS- 2 imagery for extraction of forest inventory parameters. Photogramm. Eng. Remote Sens. 2006, 72, 383–394. [Google Scholar] [CrossRef]
  60. Mallinis, G.; Koutsias, N.; Tsakiri-Strati, M.; Karteris, M. Object-based classification using Quickbird imagery for delineating forest vegetation polygons in a Mediterranean test site. ISPRS J. Photogramm. Remote Sens. 2008, 63, 237–250. [Google Scholar] [CrossRef]
  61. Laliberte, A.S.; Rango, A.; Havstad, K.M.; Paris, J.F.; Beck, R.F.; McNeely, R.; Gonzalez, A.L. Object-oriented image analysis for mapping shrub encroachment from 1937 to 2003 in southern New Mexico. Remote Sens. Environ. 2004, 93, 198–210. [Google Scholar] [CrossRef]
  62. Maxwell, S.M.; Breed, G.A.; Nickel, B.A.; Makanga-Bahouna, J.; Pemo-Makaya, E.; Parnell, R.J.; Formia, A.; Ngouessono, S.; Godley, B.J.; Costa, D.P.; et al. Using satellite tracking to optimize protection of long-lived marine species: Olive ridley sea turtle conservation in central Africa. PLoS ONE 2011, 6, e19905. [Google Scholar] [CrossRef]
  63. Ainsworth, A.; & Boone Kauffman, J. Response of native Hawaiian woody species to lava-ignited wildfires in tropical forests and shrublands. In Forest Ecology; Springer: Dordrecht, The Netherlands, 2008; pp. 197–209. [Google Scholar]
  64. Gómez-Sal, A.; Álvarez, J.; Muñoz-Yanguas, M.A.; Rebollo, S. Patterns of change in the agrarian landscape in an area of the Cantabrian Mountains (Spain) assessments by transition probabilities. In Landscape Ecology and Agroecosystems; Bunce, R.G.H., Ryzskowski, L., Paoletti, M.G., Eds.; Lewis: Boca Ratón, FL, USA, 1993; pp. 141–152. [Google Scholar]
  65. Zamora, R.; Oliva, M. (Eds.) The Landscape of the Sierra Nevada: A Unique Laboratory of Global Processes in Spain; Springer: Berlin/Heidelberg, Germany, 2022. [Google Scholar]
  66. Herrero, A.; Zamora, R. Plant responses to extreme climatic events: A field test of resilience capacity at the southern range edge. PLoS ONE 2014, 9, e87842. [Google Scholar] [CrossRef]
  67. Asner, G.P.; Knapp, D.E.; Kennedy-Bowdoin, T.; Jones, M.O.; Martin, R.E.; Boardman, J.; Hughes, R.F. Invasive species detection in Hawaiian rainforests using airborne imaging spectroscopy and LiDAR. Remote Sens. Environ. 2008, 112, 1942–1955. [Google Scholar] [CrossRef]
  68. Walsh, S.J.; McCleary, A.L.; Mena, C.F.; Shao, Y.; Tuttle, J.P.; González, A.; Atkinson, R. QuickBird and Hyperion data analysis of an invasive plant species in the Galapagos Islands of Ecuador: Implications for control and land use management. Remote Sens. Environ. 2008, 112, 1927–1941. [Google Scholar] [CrossRef]
  69. Neubert, M.; Herold, H.; Meinel, G. Assessing image segmentation quality—concepts, methods and application. In Object-Based Image Analysis: Spatial Concepts for Knowledge-Driven Remote Sensing Applications; Blaschke, T., Lang, S., Eds.; Springer-Verlag: Berlin/Heidelberg, Germany, 2008; pp. 769–784. [Google Scholar]
  70. Cox, S.E.; Booth, D.T. Shadow attenuation with high dynamic range images. Environ. Monit. Assess. 2009, 158, 231–241. [Google Scholar] [CrossRef] [PubMed]
  71. Lewis, M.; Jooste, V.; De Gasparis, A. Hyperspectral Discrimination of Arid Vegetation. In Proceedings of the 28th International Symposium on Remote Sensing of Environment, Cape Town, South Africa, 27–31 March 2000; pp. 148–151. [Google Scholar]
  72. Guirado, E.; Tabik, S.; Alcaraz-Segura, D.; Cabello, J.; Herrera, F. Deep-learning versus OBIA for scattered shrub detection with Google Earth imagery: Ziziphus lotus as case study. Remote Sens. 2017, 9, 1220. [Google Scholar] [CrossRef] [Green Version]
  73. Syed, S.; Dare, P.; Jones, S. Automatic classification of land cover features with high resolution imagery and lidar data: An object-oriented approach. In Proceedings of the Spatial Intelligence, Innovation and Praxis: The National Biennial Conference of the Spatial Sciences Institute, Melbourne, Australia, 12–16 September 2005; Spatial Science Institute: Melbourne, Australia, 2005; pp. 512–522. [Google Scholar]
  74. Hutchings, M.J. The structure of plant populations. In Plant Ecology; Crawley, M.J., Ed.; Blackwell Scientific: Oxford, UK, 1986; pp. 97–136. [Google Scholar]
  75. Andrzejczyk, T.; Brzeziecki, B. The structure and dynamics of old-growth Pinus sylvestris (L.) stands in the Wigry National Park, north-eastern Poland. Vegetation 1995, 117, 81–94. [Google Scholar] [CrossRef]
  76. Primack, R.B. A Primer of Conservation Biology; Sinauer Associates Inc.: Sunderland, MA, USA, 1995. [Google Scholar]
  77. Alcaraz-Segura, D.; Baldi, G.; Durante, P.; Garbulsky, M.F. Análisis de la dinámica temporal del NDVI en áreas protegidas: Tres casos de estudio a distintas escalas espaciales, temporales y de gestión. Ecosistemas 2008, 17, 108–117. [Google Scholar]
  78. Laliberte, A.S.; Herrick, J.E.; Rango, A.; Winters, C. Acquisition, Orthorectification, and Object-based Classification of Unmanned Aerial Vehicle (UAV) Imagery for Rangeland Monitoring. Photogramm. Eng. Remote Sens. 2010, 6, 661–672. [Google Scholar] [CrossRef]
  79. Peña, J.M.; Torres-Sánchez, J.; de Castro, A.I.; Kelly, M.; López-Granados, F. Weed Mapping in Early-Season Maize Fields Using Object-Based Analysis of Unmanned Aerial Vehicle (UAV) Images. PLoS ONE 2013, 8, e77151. [Google Scholar] [CrossRef] [Green Version]
  80. Aguilar, M.A.; Montalbán, M.A.; Saldaña, M.M.; Aguilar, F.J.; Fernández, I.; García-Lorca, A.M. Detección remota de invernaderos a partir de estéreo pares del satélite WorldView-2. Rev. De Teledetección 2014, 41, 19–28. [Google Scholar] [CrossRef]
  81. Alcaraz-Segura, D.; Cabello, J.; Arenas-Castro, S.; Peñas, J.; Vaz, A.S. Remote Sensing in Sierra Nevada: From Abiotic Processes to Biodiversity and Ecosystem Functions and Services. In The Landscape of the Sierra Nevada: A Unique Laboratory of Global Processes in Spain; Zamora, R., Oliva, M., Eds.; Springer: Berlin/Heidelberg, Germany, 2022; pp. 315–327. [Google Scholar]
Figure 1. (a) Location of the study area in the Barranco de San Juan in the National Park of Sierra Nevada (Andalusia, Spain). (b) Traditional livestock grazing in the study area. (c) Ground truthing with a differential GPS of a Juniperus communis L. individual in the Sierra Nevada.
Fire 06 00004 g001
Figure 2. The two main steps of object-based image analysis (OBIA). (1) The segmentation consists of dividing groups of pixels with similar spectral properties and relationships to their context. (2) The classification of these objects into classes of interest is performed based on similarities in shape, spectral, and contextual information.
Fire 06 00004 g002
Figure 3. Detail of the mapping of Juniperus communis L. shrubs in Barranco de San Juan (Sierra Nevada, Spain) for the dates studied. The change in the size of the individuals over time can be seen, as well as the appearance or disappearance of some of the others. The area affected by the 1983 fire is seen mostly free of shrubs in the center (dotted-line polygon) of the 1984, 1997, and 2008 images.
Fire 06 00004 g003
Figure 4. (a) Decrease in the number of individuals and (b) changes in the shrub canopy area occupied by Juniperus communis L. in Barranco San Juan (Sierra Nevada, Spain) in the period of 1977–2008 following a wildfire that occurred in 1983. The years of the declaration of the Sierra Nevada as a Natural Park in 1989 and as a National Park in 1999 are indicated. The symbols used indicate the spatial and spectral resolution of the images used to estimate the individuals: Square: 0.5 m/pixel. Star: 1 m/pixel. White: panchromatic image. Red: RGB (red-green-blue) image. The number of individuals strongly decreased after the wildfire, continued with a slight decrease from 1984 to 1997, and then recovered by 2008. Canopy cover strongly decreased after the wildfire but recovered at a greater speed.
Fire 06 00004 g004
Figure 5. Distribution of population sizes of Juniperus communis L. individuals according to their canopy area during the four years studied. Skewness values greater than one show distributions skewed toward the smallest sizes. Kurtosis values greater than one show the non-uniformity of the distributions. The distributions of the four dates studied appear skewed toward smaller population sizes. None of the populations studied appear uniformly distributed in size.
Fire 06 00004 g005
Figure 6. Changes in the number of individuals per shrub size class Juniperus communis L. from 1977 to 2008 in Barranco de San Juan (Sierra Nevada, Spain). The largest shrub size classes (G4, G3, and G2) suffered the lowest declines after the fire, while the smallest size class (G1) lost the greatest number of individuals. The fire occurred in 1983, the Natural Park was declared in 1989, and the National Park was declared in 1999.
Fire 06 00004 g006
Table 1. Images used in the work. (PAN: panchromatic image; RGB: red-green-blue image).
YearSpatial Resolution (m)Spectral Resolution
19770.5PAN
19841PAN
19971PAN
20080.5RGB
Table 2. Classes used in the image classifications. Juniperus: individuals of Juniperus communis. Light soil: patches of soil with high brightness. Dark soil: patches of soil with low brightness. Vegetation soil: patches of soil with small vegetation.
YearClasses
1977Juniperus, Light Soil, Dark Soil
1984Juniperus, Light Soil, Dark Soil
1997Juniperus, Light Soil, Dark Soil
2008Juniperus, Soil, Soil Vegetation
Table 3. Working times of the segmentation and validation of the images.
YearResolution (m)SegmentationsSegmentation Time
19770.520259 h 30′
1984120253 h 17′
1997120252 h 56′
20080.5202512 h 20′
Table 4. Parameters of the final segmentations used in each. The segmentation accuracy indices are shown. PSE: potential segmentation error; NSR: number-of-segments ratio; ED2: Euclidean distance 2.
YearResolution (m)ScaleFormCompactnessPSENSRED2
19770.5250.70.80.100.010.10
19841150.80.80.110.010.11
19971150.70.90.100.030.11
20080.5150.80.50.140.070.16
Table 5. Features used in the classification and the separability value J in each image. The separability value J indicates the characteristics of the classes that give the highest separability between them. A value of J close to 2 indicates a maximum separability of the classes, giving the best possible classification of the objects. PAN: panchromatic image; RGB: red-green-blue image. GLCM: grey-level co-occurrence matrix.
YearResolution (m)TypeCharacteristicsJ
19770.5PANBrightness1.99
GLCM Mean (all directions) 1.98
Perimeter (polygon) 1.04
19841PANBrightness1.80
GLCM Mean (all directions) 1.77
Perimeter (polygon) 1.33
19971PANBrightness1.79
GLCM Mean (all directions) 1.78
GLCM StdDev (all directions) 1.20
20080.5RGBMean Layer 11.72
Mean Layer 31.69
GLCM Mean (all directions) 1.68
Brightness1.68
Table 6. Features and T-thresholds used by fuzzy logic in the images. The T-thresholds indicate the threshold values for each feature that produce the greatest differentiation between the classes. PAN: panchromatic image; RGB: red-green-blue image. GLCM: grey-level co-occurrence matrix.
YearResolution (m)TypeCharacteristicsT
19770.5PANBrightness<130
GLCM Mean (all directions) <130
Perimeter (polygon) >108
19841PANBrightness<100
GLCM Mean (all directions) <102
Perimeter (polygon) >55
19971PANBrightness<151
GLCM Mean (all directions) <149
GLCM StdDev (all directions) <149
20080.5RGBMean Layer 1<74
Mean Layer 3<67
GLCM Mean (all directions) <72
Brightness<72
Table 7. Accuracy of image classifications.
YearTotal AccuracyClassified Individuals
19770.96752
19840.91433
19970.85420
20080.97578
Table 8. Characteristics of the population for each evaluated date.
YearIndividualsMaximum Surface Area (m2)Minimum Surface Area (m2)Average Surface Area (m2)Surface Area Mode (m2)
1977750791469.9211
1984433910692.2346
199742049312109.1575
2008578723992.8944
Disclaimer/Publisher’s Note: The statements, opinions and data contained in all publications are solely those of the individual author(s) and contributor(s) and not of MDPI and/or the editor(s). MDPI and/or the editor(s) disclaim responsibility for any injury to people or property resulting from any ideas, methods, instructions or products referred to in the content.

