Article

The Ignition Frequency of Structural Fires in Australia from 2012 to 2019

Institute of Sustainable Industries and Liveable Cities, Victoria University, Melbourne, VIC 8001, Australia
*
Author to whom correspondence should be addressed.
Submission received: 21 November 2022 / Revised: 3 January 2023 / Accepted: 9 January 2023 / Published: 16 January 2023

Abstract

:
Appropriate estimates of ignition frequency derived from fire statistics are crucial for quantifying fire risks, given that ignition frequency underpins all probabilistic fire risk assessments for buildings. Rahikainen et al. (Fire Technol 2004; 40:335–53) utilized the generalized Barrois model to evaluate ignition frequencies for different buildings in Finland. The Barrois model provides a good prediction of the trend of the ignition frequency; however, it can underestimate the ignition frequency depending on the building type. In this study, an analysis of the Australian fire statistical data from 2012 to 2019 was performed and compared with studies from Finland. A new coefficient is proposed to improve the Barrois model for a better fit for buildings in Australia. Several categories, such as hotels and hospitals, which were absent in previous studies, have been included as separate categories in this study. Office and retail spaces in Finland have an ignition frequency one order of magnitude lower than in Australia. On the other hand, other buildings (retail and apartments in particular) are much more prone to fire ignition in Australia than in Finland. The improved generalized Barrois model based on the Australian fire statistical data will be useful for determining ignition frequency for risk quantification in the Australian context.

1. Introduction

Ignition frequency is a critical variable in probabilistic fire risk quantification in buildings. The expected value of the fire loss is the product of the ignition frequency and the consequences added to the distribution of burned buildings from the studied building stock. Ignition frequency is always a linear multiplying factor for different fire losses, such as life, economic, or societal [1]. Hence, adequate knowledge of the ignition frequency derived from fire statistics must be made available to quantify fire risks. The fire-starting probability is the most crucial factor in probabilistic fire risk analyses for performance-based fire engineering designs.
The Australian Building Codes Board (ABCB) has been moving towards the adoption of risk quantification in their National Construction Codes (NCC) [2]. It is envisaged that a Quantitative Probabilistic Risk Assessment (QPRA) will be adopted, which typically uses the Fault Tree (FT) [3] and Event Tree (ET) to quantify risk, and a critical input is fire ignition frequency which forms the first node of the ET. While statistical data is generally scarce, it will be useful to have a correlation to aid the quick determination of fire ignition frequency for QPRA. The generalized Barrois model developed by Rahikainen et al. [1,4,5,6] based on fire statistics from Finland is commonly adopted by fire researchers [7,8,9,10,11,12]. However, it has been shown in some studies that the Barrois model tends to underestimate fire ignition when applied to various contexts [13,14].
Rahikainen et al. [1,4,5,6] determined ignition frequencies and ignition frequencies per floor area for various building categories in Finland as combined groups and as a function of the building floor area. Their results show that differences between building categories or locations within the country are so minor that a universal curve for the whole country could be established. For small buildings, a strong dependence on size is observed for ignition frequency per floor area; however, it remained more or less constant for large buildings. In addition, periodic variations of building ignition frequency by month and week of the year, day of the week, and time of the day were calculated, and limited tests of the generality of the results were made on the theoretical models.
Ramachandran [15] studied the statistical methods typically used in the fire risk assessment of an industry. Ramachandran defined two primary components of the fire risk that include (i) the probability of a fire starting and (ii) the probability of damage reaching various levels in a fire event. The values of the distribution parameters and the fire-starting probability vary depending on factors that include ignition sources, property size, and the presence/absence of sprinklers. The results show that a set of similar properties could be altered for the risk evaluation in an individual property. He further proposed that a stochastic model be developed to predict the fire spread in a building and, in turn, outlined a model, specified the data required for estimation, and validated the parameters.
Sandberg [16] performed a comparative case study analysis to review and identify the existing models and data relevant to determining ignition frequencies. Sandberg underlined the factors that affect the frequency of ignition, which depends on the number of ignition sources and increases with the building size. The results showed that the ignition frequency varied with the total building floor area. Several other factors seemed to influence the ignition frequency, including building occupancy, equipment faults, human activity, and other natural causes. Furthermore, the author applied a different approach by analyzing the social, demographic, and economic variables. The first method is based on the maximum likelihood estimator and is used when data is available both for buildings exposed to fire and structures at risk. Although this method is more accurate, getting hold of the necessary data is challenging. Such detailed information is typically not collected at the national level. However, insurance companies may have collected this data but often keep it confidential.
The second method applied by Sandberg [16] was also based on the maximum likelihood estimator and is used when data is available only for buildings exposed to fire. Data for facilities at risk, which have not been involved in a fire incident, may not exist. The other methods the author studied were based on Bayesian data analysis. The Bayesian approach is suitable when there is little data or information available, such as in the case of the safety of nuclear power plants. The author suggested that these methods must be reserved for events with low probability and high consequences. An average ignition frequency was estimated in different occupancies in this study. The work collected data on various buildings in different categories and estimated their parameters. This data was then used to examine the ignition frequency and apply the developed models.
D’Este et al. [17] analyzed and compared climatic, topographic, anthropic, and landscape drivers to investigate the patterns of fire ignition in terms of frequency and fire occurrence in European regions. In order to achieve this, they mapped the probability of fire ignition occurrence and frequency using negative binomial hurdle models, while the performance of models was assessed using metrics such as AUC, prediction accuracy, RMSE, and the Pearson correlation coefficient. Their results revealed an inverse correlation between distance from infrastructures (e.g., urban roads and areas) and fire occurrence in all the study regions. Furthermore, a positive correlation was found between fire occurrence and landscape drivers relevant to regions. They concluded that anthropic activity, compared to the climatic, topographic, and landscape drivers, influences fire ignition and frequency more significantly in all the regions. The probability of fire ignition occurrence and frequency were found to increase when the distance from urban roads and areas decreased. One of the conclusions is that it is essential to implement long- to medium-term intervention plans to suppress the proximity between potential ignition points and fuels.
Traditionally, building fire probability analysis is performed based on either statistics or fire science. Hu et al. [18] combined the two approaches and improved the statistical method for determining building ignition probability. The factors that affect the probability of fire ignition are divided into humans, ignition sources, combustibles and environments. Given the factor classification, they developed a Bayesian network of the ignition probability of buildings and introduced the nodes and detailed conditional probability table in the Bayesian network, according to which the ignition probability of the building was quantified. Finally, they chose some typical buildings as examples to test the model’s applicability, estimated the posterior probability value by obtaining the relevant building data, and incorporated it into the Bayesian network. They demonstrated that ignition probability is dynamic, and the comparison with the statistical data of building fire is rational.
It is evident from the above literature review that the ignition frequency of a building is primarily affected by its floor area with a weak correlation to other factors. However, due to the limited data available, many other potential factors were not fully examined.
This study aims to further investigate ignition frequency using Australian historical fire data from 2012 to 2019. A modified Barrois model assisted in accurate calculations of the ignition frequency for the buildings, which will be described later. The results obtained are then compared with those from the study conducted by Tillander et al. [5,6] to determine any similarities and differences between the two jurisdictions. The current study covers building fires from 2012 to 2019. The data are drawn from the Australian Incident Reporting System (AIRS) Database managed by the Australasian Fire and Emergency Service Authorities Council (AFAC). The calculation of fire frequencies for Australia, based on historical data, is expected to fill an important gap in probabilistic fire risk analysis that is currently unavailable.
Finally, some internal data validations were conducted to estimate the influence of data deficiencies on the obtained ignition frequencies. The following sections present the materials and methods used in the analysis, followed by results, discussion, conclusion and recommendations in the final section.

2. Materials and Methods

2.1. Statistical Building Data

Quantitative Probabilistic Risk Assessment applications require high-quality statistical data sets related to fire ignitions in buildings [19]. ARUP and the University of Queensland [20] obtained raw data from the Australian Bureau of Statistics (ABS) for fires and other sources from 2012 to 2019 to determine the rate of fire starts for various building categories. The Australian Bureau of Statistics provided the total floor areas for residential buildings, while the Department of Climate Change and Energy Efficiency provided data for hotels, offices, retail spaces, hospitals, and schools. There is no data available for Class 4, 7b, and 8 buildings. It should be noted that the total number of parking spaces in Australia, as reported by Colliers, was also not included in the comparison as it was not included in the Finnish studies [4,5,6]. Results are presented in two forms: rate of ignition per square meter per year and rate per unit per year. The Australian National Construction Code (NCC) defines the following classes of buildings:
Class 1: Houses, standalone domestic, or residential dwellings.
Class 1a: Detached houses or attached dwellings such as townhomes or row houses.
Class 1b: Small boarding houses, guesthouses, or hostels with less than 12 residents or short-term holiday accommodation with four or more single dwellings on one allotment.
Class 2: Multi-unit residential buildings where people live above and below each other or single-storey attached dwellings with a common space below.
Class 3: Long-term or transient living for a number of unrelated people, including larger boarding houses, guest houses, hostels, or accommodation for backpackers; residential care buildings; and residential parts of hotels, motels, schools, or jails.
Class 4: Sole dwellings or residences within a non-residential building.
Class 5: Office buildings for professional or commercial purposes.
Class 6: Retail establishments such as shops, restaurants, and cafes.
Class 7: Storage-type buildings, divided into Class 7a (carparks) and Class 7b (warehouses, storage buildings, or wholesale display buildings).
Class 8: Buildings for production, assembly, alteration, repair, finishing, packing, or cleaning of goods or produce, including mechanic’s workshops and food processing buildings.
Class 9: Public buildings, divided into Class 9a (hospitals and clinics), Class 9b (assembly buildings such as schools, universities, sporting facilities, and public transport buildings), and Class 9c (residential care buildings with 10% or more residents needing physical assistance in daily activities and evacuation during an emergency, such as aged care facilities).
Data for Class 1 and 2 occupancies are available from the Australian Bureau of Statistics (ABS), and aggregate floor areas for Class 1 and Class 2 occupancies within Australia were obtained from their census reports (ABS—2019 Census, from https://quickstats.censusdata.abs.gov.au/census_services/getproduct/census/2019/quickstat/036?op, accessed on 28 December 2022).
The statistical floor areas of various building stocks in Australia between 2012 and 2019 are shown in Table 1. Structural fire incidents for various occupancies in Australia from 2012 to 2019 are presented in Table 2. The ignition frequency for each class between 2012 and 2019 derived from Table 1 and Table 2 are shown in Table 3, and a summary of the ignition frequency of structural fires in Australia from 2012 to 2019 is presented in Table 4. The percentage floor areas and fire ignitions are shown in Figure 1 as pie charts.

2.2. Barrois Model

For any reliable probabilistic fire risk assessment to be conducted, it is necessary to have reliable ignition frequency data which is largely based on the type of building (referred to as “class” in this study), while the ignition frequency within each building class is dependent on the floor area of the building. A practical method to model the dependence of the average annual probability of fire ignition in a building of a particular class on the floor area of the building was originally proposed by Barrois in 1835 [21]. The generalized Barrois model can be described as the sum of two power law functions. The equation for the Barrois curve is given below [5,6]:
f = c 1   A r + c 2   A s
where f is the ignition frequency of a building with a floor area A within 12 months, c1, c2, r, and s are coefficients. Table 5 presents the parameters of the generalized Barrois model for different building categories proposed by Tillander [6]. The parameter R2 represents the coefficient of determination—it indicates the proportion of variance of the dependent variable that is related to the independent variable. This statistical measure shows how well the regression model represents the data. Higher values of this indicator imply a better fit for the model. These parameters are useful for determining the ignition frequency of buildings with floor areas between 100 m2 and 20,000 m2. In the generalized Barrois model equation (Equation (1)), the coefficients r and s are both less than zero. This means that as the floor area A approaches 0, the limit of the equation produces an unreality. However, in the context of our study, the floor area A is always at least 100 square meters and typically falls within the range of 100 square meters to 20,000 square meters. Therefore, the values of r and s being less than zero do not significantly impact the accuracy or reliability of the statistical analysis, as the model is not being applied to very small values of A.
To further demonstrate the robustness of the statistical analysis, we performed additional analyses and simulations using a range of different values for r and s. We found that the fitted models remained accurate and reliable for building floor areas within the range of 100 square meters to 20,000 square meters, regardless of the specific values of r and s. This suggests that the values of r and s being less than zero do not significantly impact the results of the statistical evaluation within this range of building floor areas.
In order to improve the flexibility and applicability of the generalized Barrois model equation (Equation (1)) across all building categories, we have introduced a new coefficient, c3, that depends on the specific building being considered (see Equation (2)). Table 6 presents the values of coefficient c3 for different building categories. These values were computed by assigning different values to c3 and comparing the ignition frequencies predicted by the modified model with those obtained from the AIRS Database. When the data points fit the modified curve well, the value of c3 for the coefficient is considered a valid assumption.
f = c 1   A r + c 2   A s + c 3
It is important to note that these values of c3 are used to shift the original curve upwards so that the modified model curve fits the aggregated statistical data from the AIRS Database more accurately. This allows the model to more accurately represent the ignition frequencies of different building categories and to be more flexible and applicable across a wider range of building sizes and types in Australia. The coefficients c3 significantly impact the ignition frequencies of buildings with larger floor areas, while their impact is reduced considerably for buildings with small floor areas. One issue with this curve-fitting approach is that there are relatively few data points available, which can limit the accuracy and reliability of the model. To improve the outcomes of the analysis, it would be beneficial to have access to non-aggregated data from the statistics, such as records that include the floor area of each individual building [22]. This would allow for a more detailed and accurate evaluation of the model’s performance across a range of building sizes and types.

2.3. Limitations of the Study

The limitations of the study are as follows:
  • The correlations are limited by the statistical data available;
  • There is limited knowledge about the acceptable range of change for the parameters introduced into the model. Such knowledge would provide greater certainty in the Barrois model predictions;
  • There is an uncertainty in the model correlations due to inconsistencies in the AIRS database;
  • Some data are missing from the reported years and the database is cumbersome, which affects the accuracy of the model parameters.

3. Results and Discussion

3.1. Ignition Frequencies Based on Improved Barrois Model and Comparison between Australia and Finland

The average ignition frequency (1/m
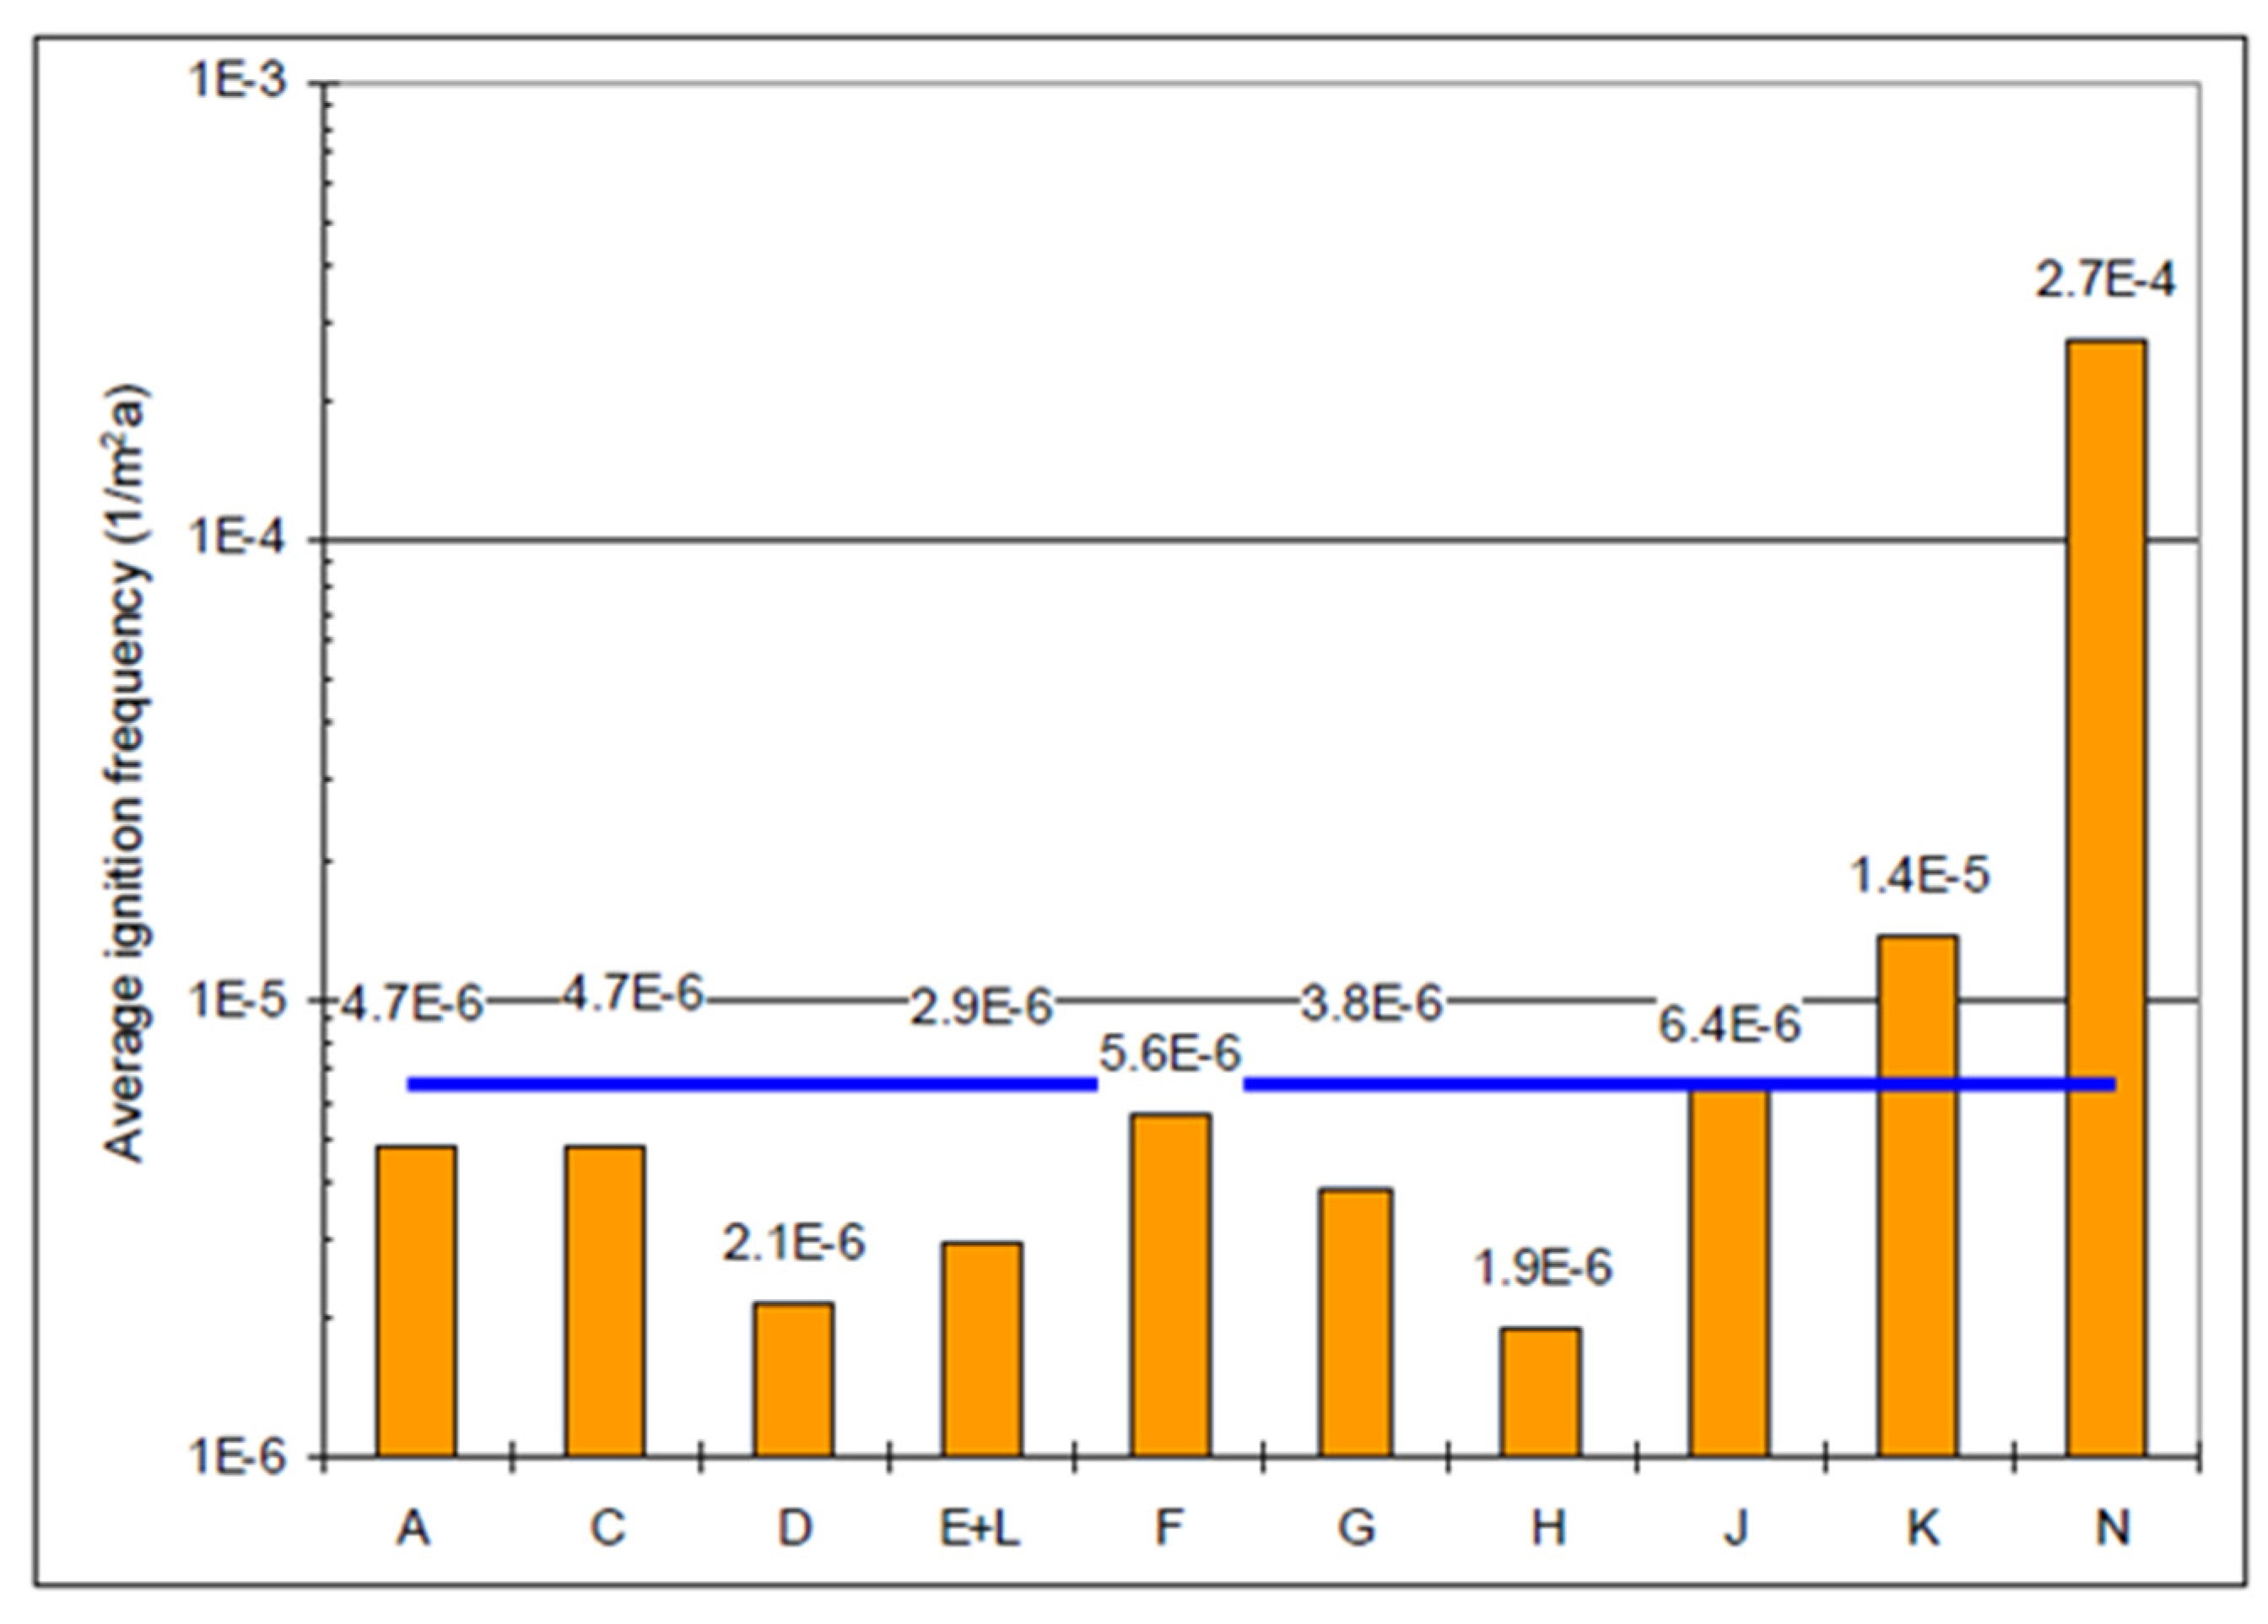
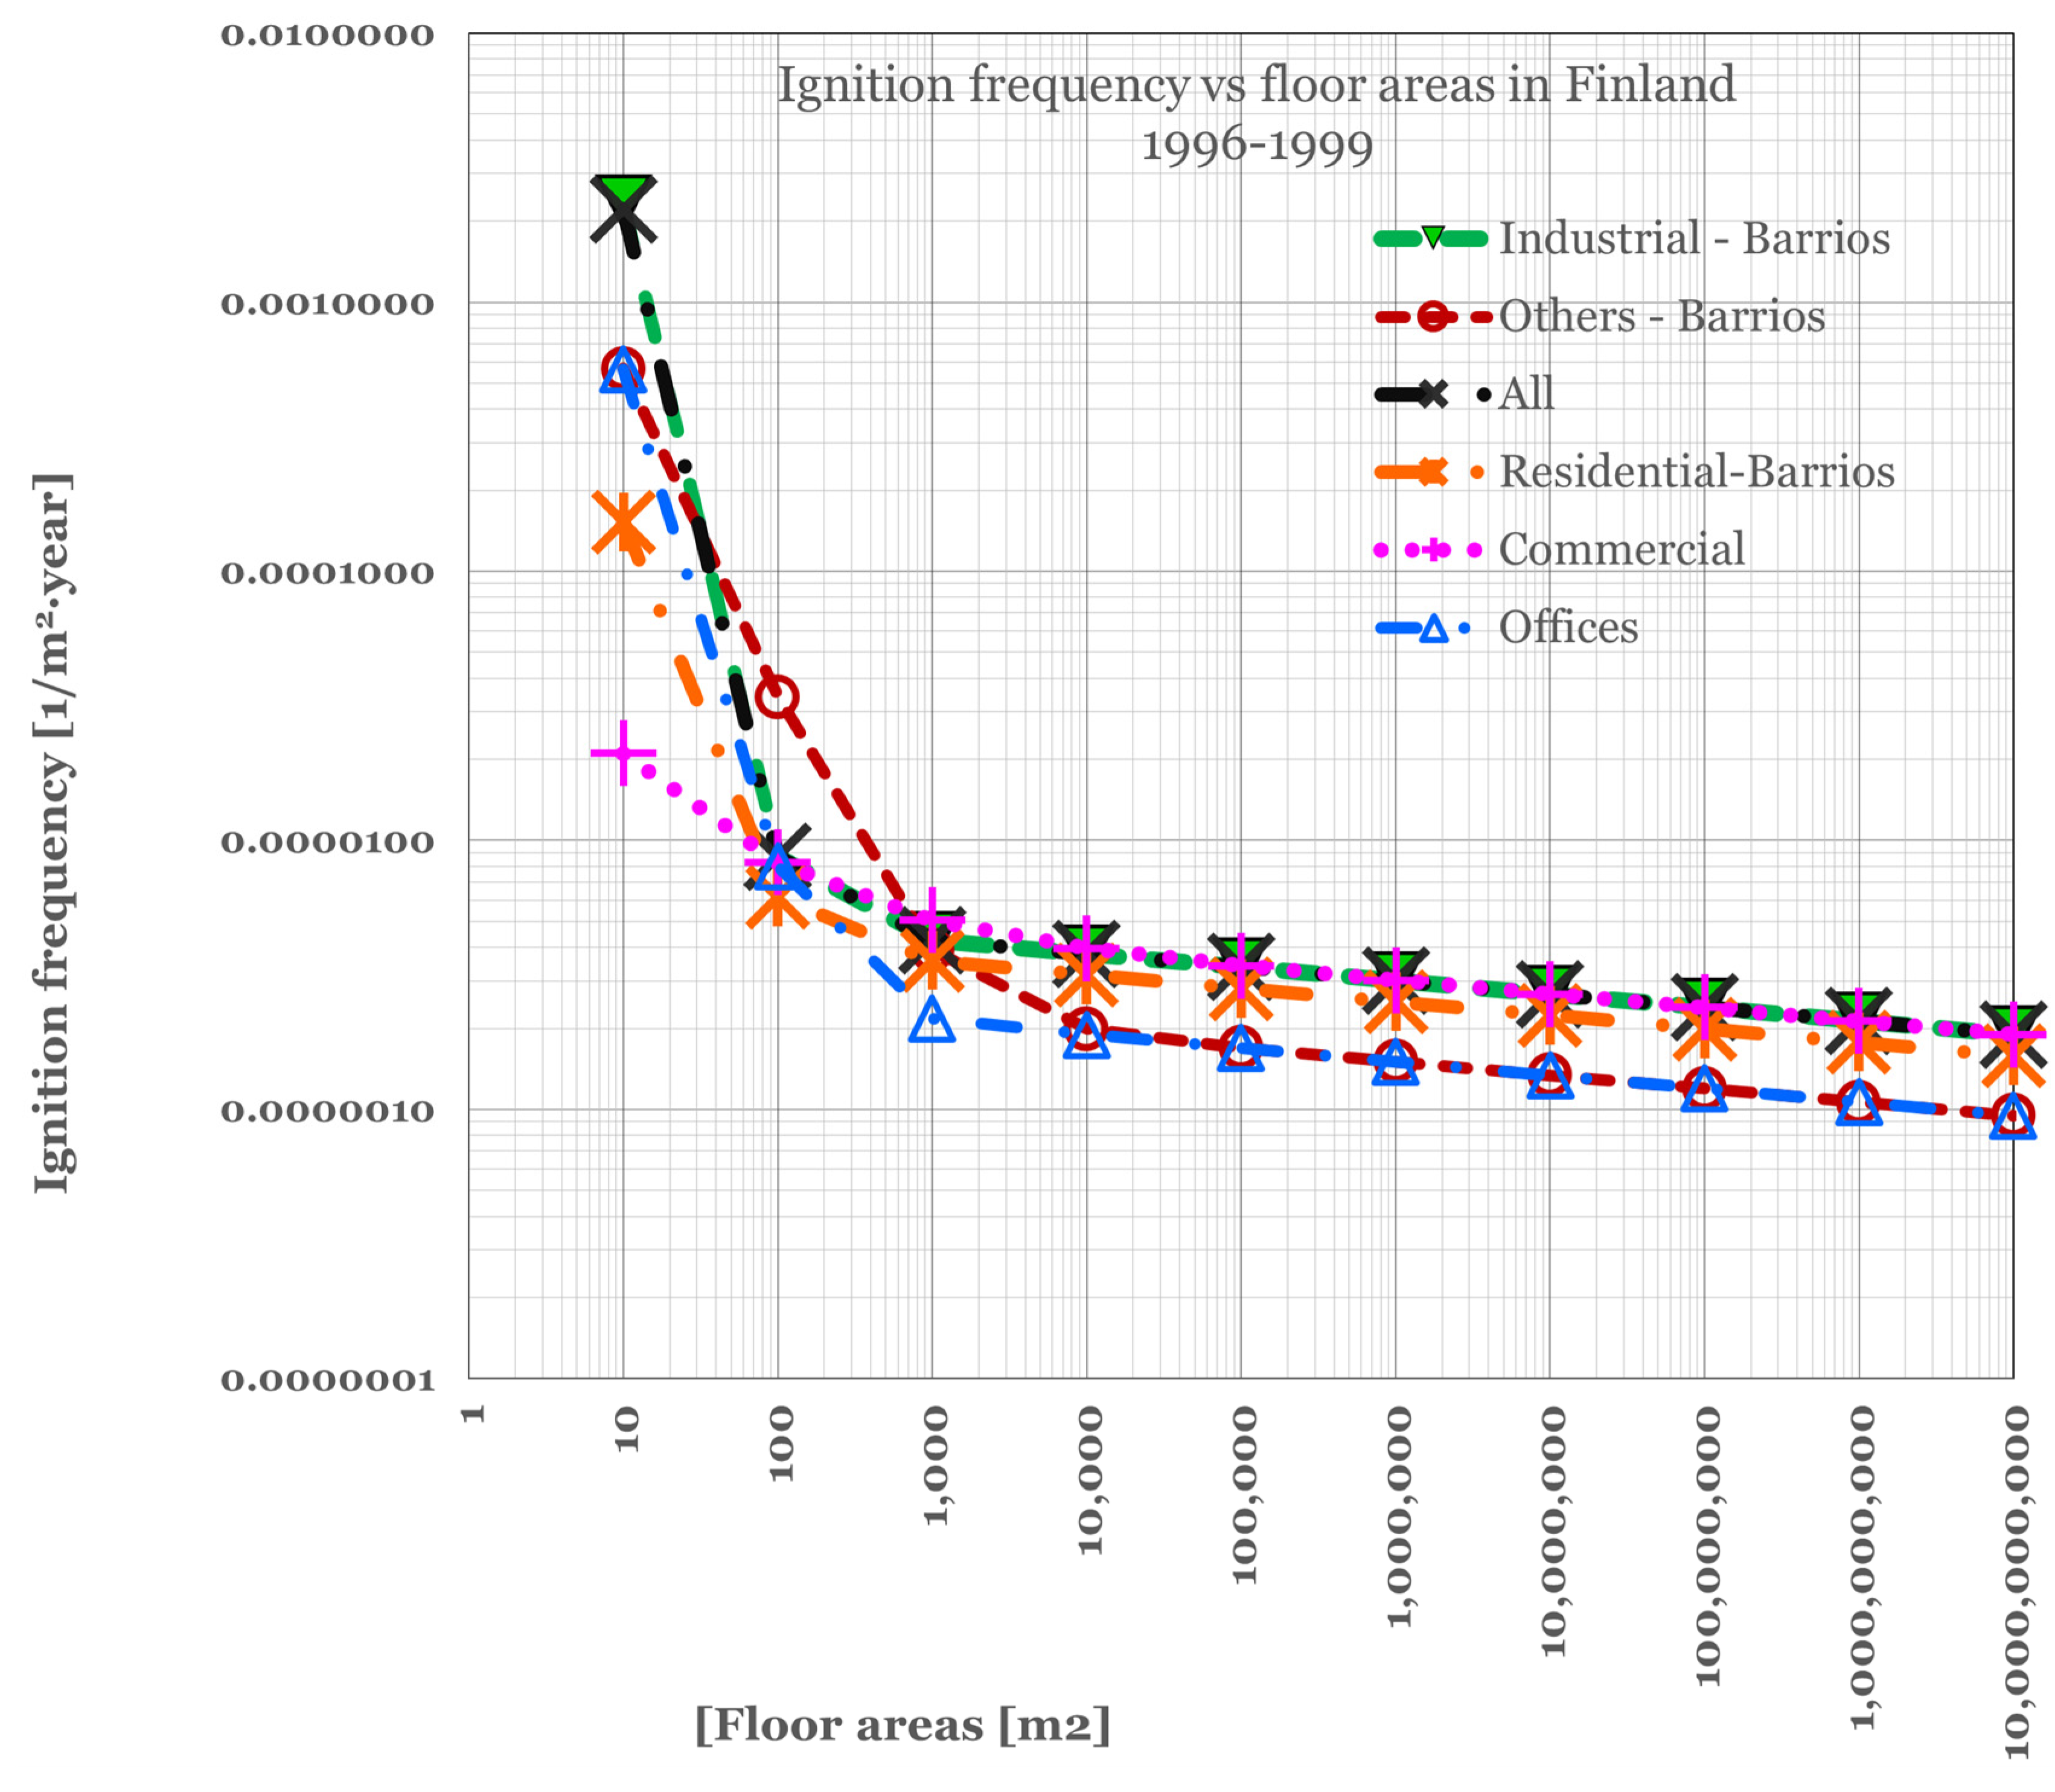
2/year), defined as the probability per floor area per unit time of a building exposed to fire, can be determined as the ratio of the number of fires in a specific building category during a year and its combined floor area. The results obtained by Tillander and Keski-Rahkonen [5] for Finland are presented in Figure 2 with the following categories: residential (A), commercial (C), office (D), transport and communication buildings, buildings for institutional care (F), assembly (G), educational (H), industrial (J), warehouses (K), firefighting and rescue service buildings (L), and other buildings (N). Following their methodology, the resulting data for Australia are represented in 
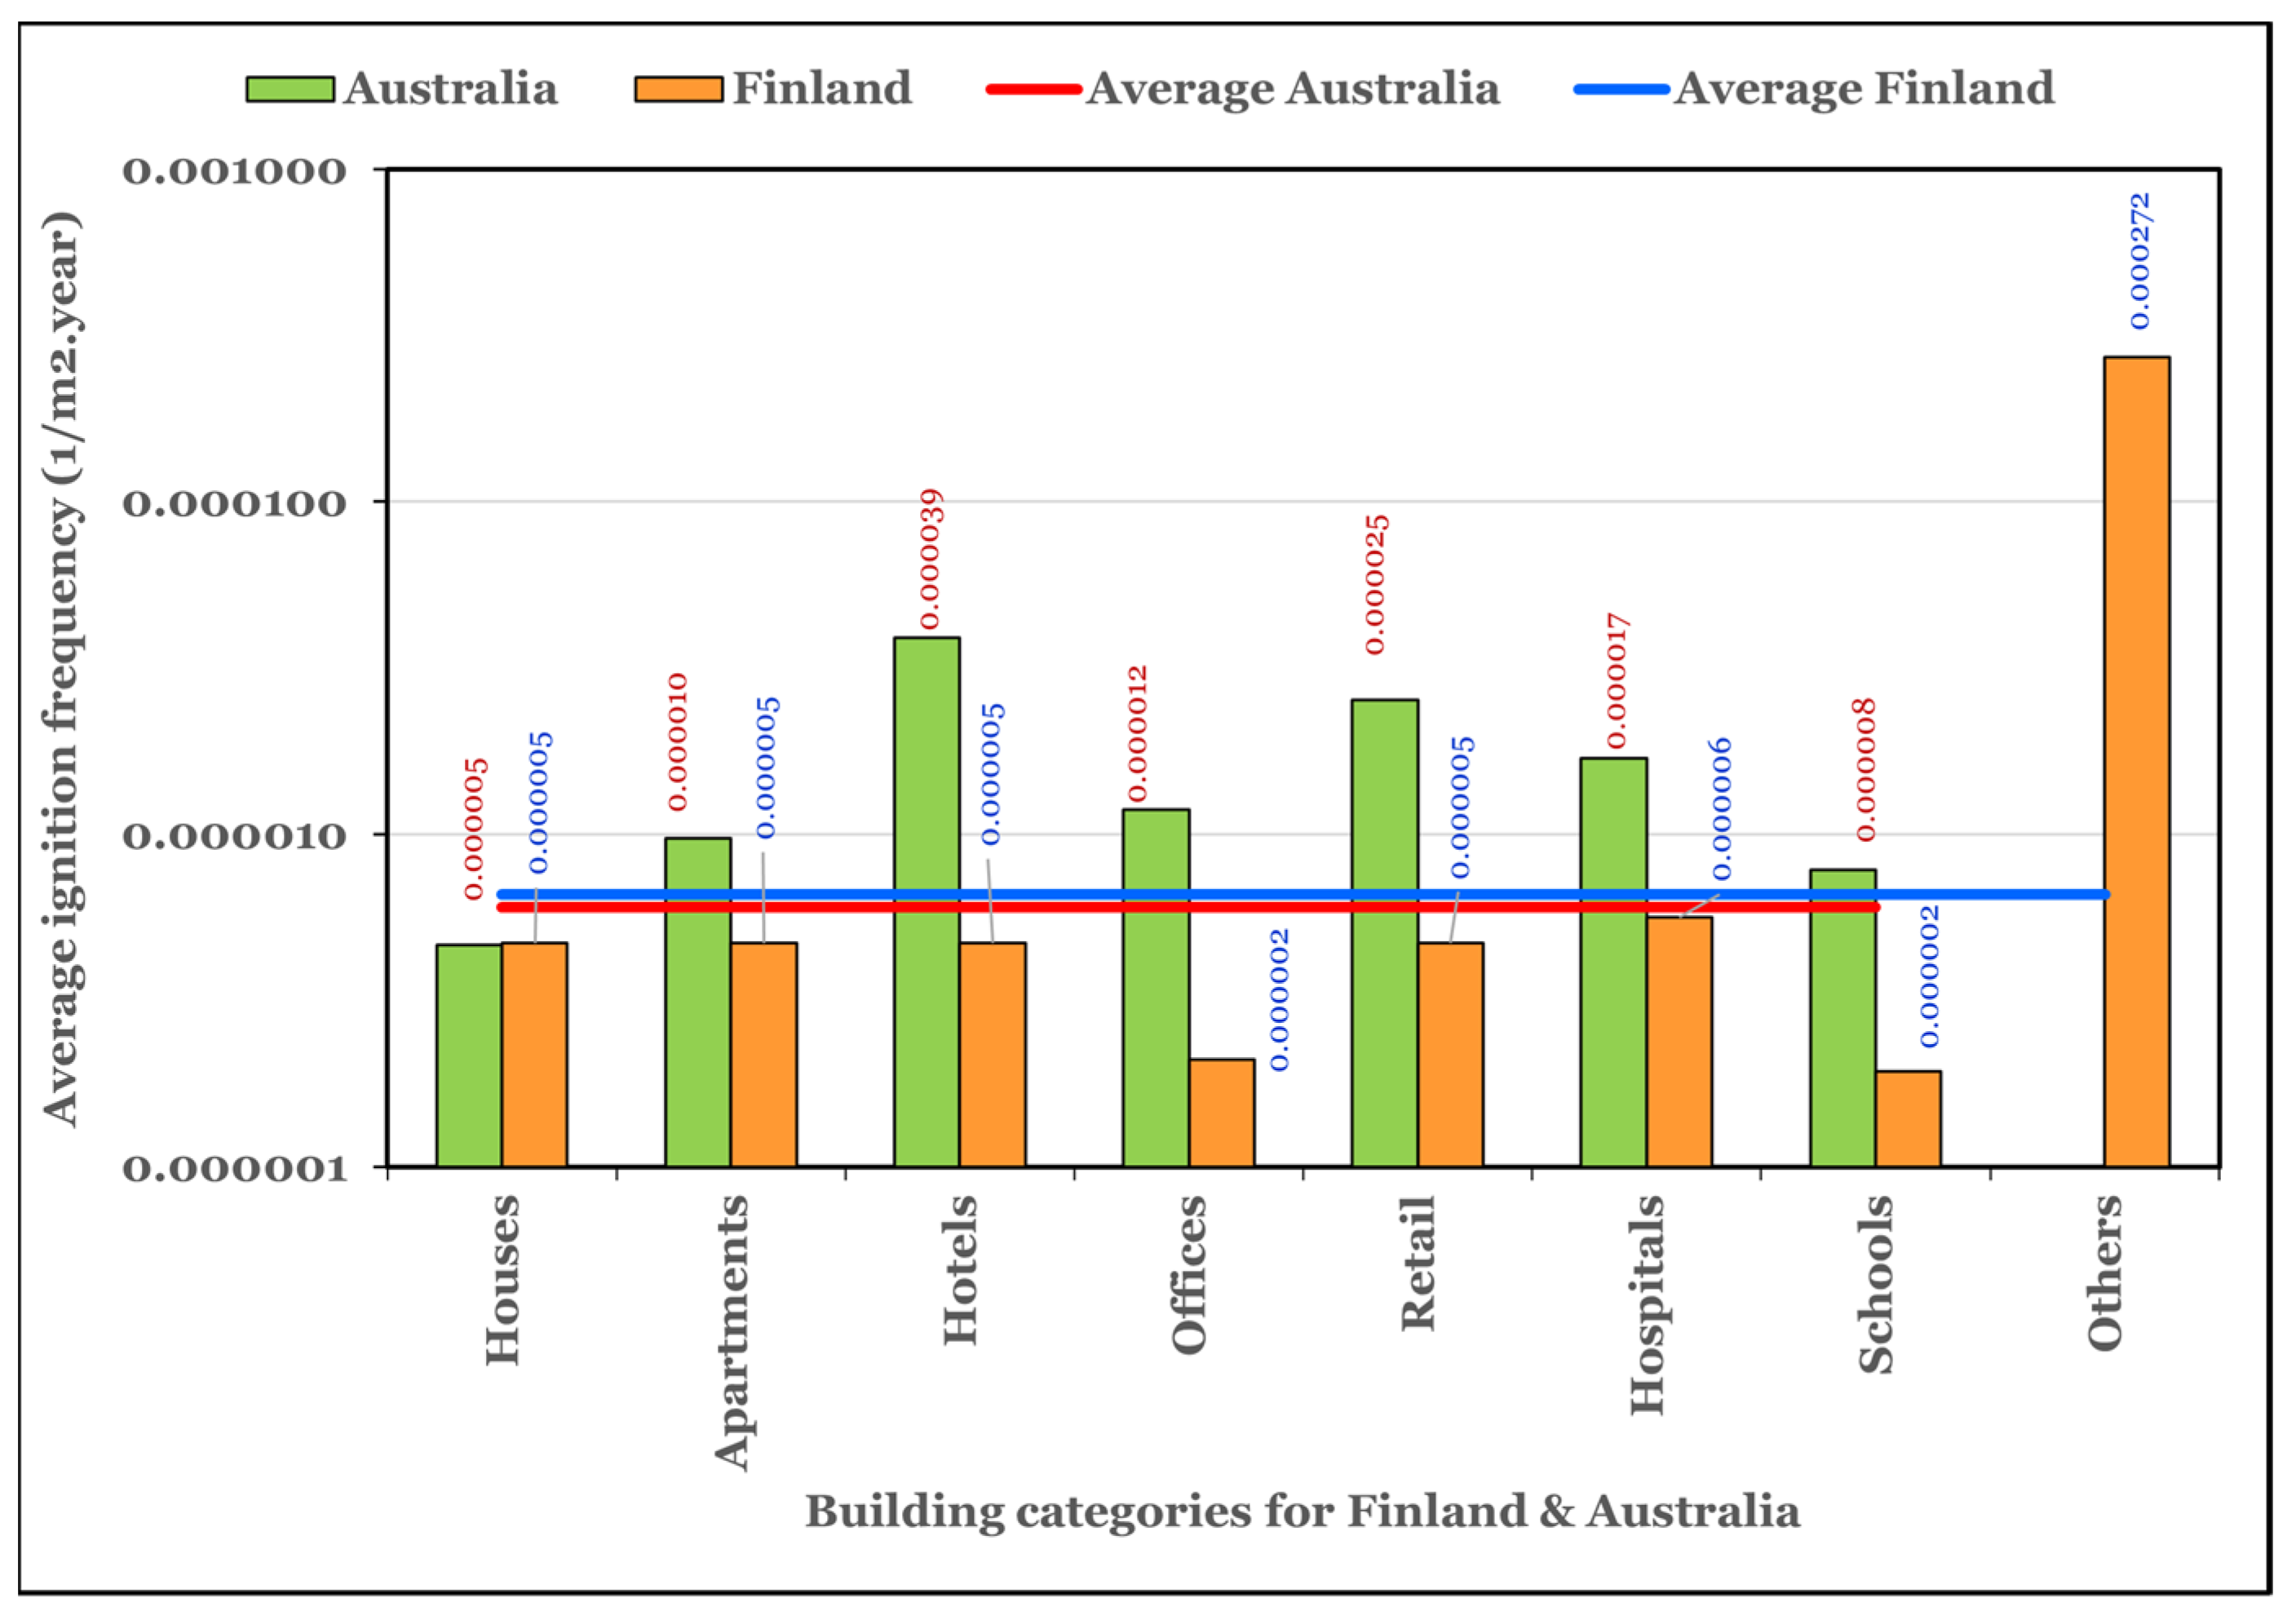
Figure 3 and compared to those from Finland. Data in both Figure 2 and Figure 3 are presented in logarithmic scale. The thick blue horizontal line represents the average of all categories for Finland. The comparison of the two graphs indicates that the ignition frequency for most categories is lower in Finland than in Australia. The average value is higher for Finland because its most impacting class (other buildings, N) with an ignition frequency of 2.7 × 10⁻⁴ shifts the average value upwards.
It can also be noted that there are some categories (hotels and hospitals) that have no specific fire frequency values for Finland. These data categories are included in the ‘Others’ group. Furthermore, it is not possible to distinguish between houses and apartments in the Finnish dataset, so the same ignition frequency is used in the graph, assuming there are no significant differences in risk between apartments and houses. Nevertheless, it is evident that apartment fires in Australia occur with a higher frequency (9.60 × 10⁻⁶) when compared with those in single houses (4.65 × 10⁻⁶), an increase of about 100%. This suggests that separating the two categories of buildings would make sense.
As a general observation, it can be said that the expected ignition frequency for all buildings is lower in Australia than in Finland. The opposite occurs when specific categories are considered; for example, office spaces have a fire frequency of 1.19 × 10⁻⁵ in Australia, while it is only 2.14 × 10⁻⁶ in Finland, almost five times lower. The same can be argued for retail spaces, with a 2.50 × 10⁻⁵ value for Australia against a fire frequency of 4.70 × 10⁻⁶ in Finland. The frequency of fires in school is higher in Australia, with a value of around 7.79 × 10⁻⁶ fire/m2·year compared to 1.93 × 10⁻⁶ in Finland.
The reasons for these can be many. Firstly, one can observe that in Finland, timber is primarily adopted as a building material, while in Australia, houses are constructed in either timber or concrete frames with internal plasterboard walls and external facing bricks. The widespread use of timber in Finland would lead to a greater probability of ignition, as timber is combustible, whereas concrete is not. On the other hand, specific categories of buildings (office, retail, and apartments in particular) are way more prone to fires in Australia; jurisdiction-specific rules about electrical installation, fire loads, fire alarm systems, and other factors can also influence the spreading of fires, as well as the differences in climatic conditions (relatively higher temperatures and frequent occurrence of droughts in Australia can act in favor of fire ignition in built environments).
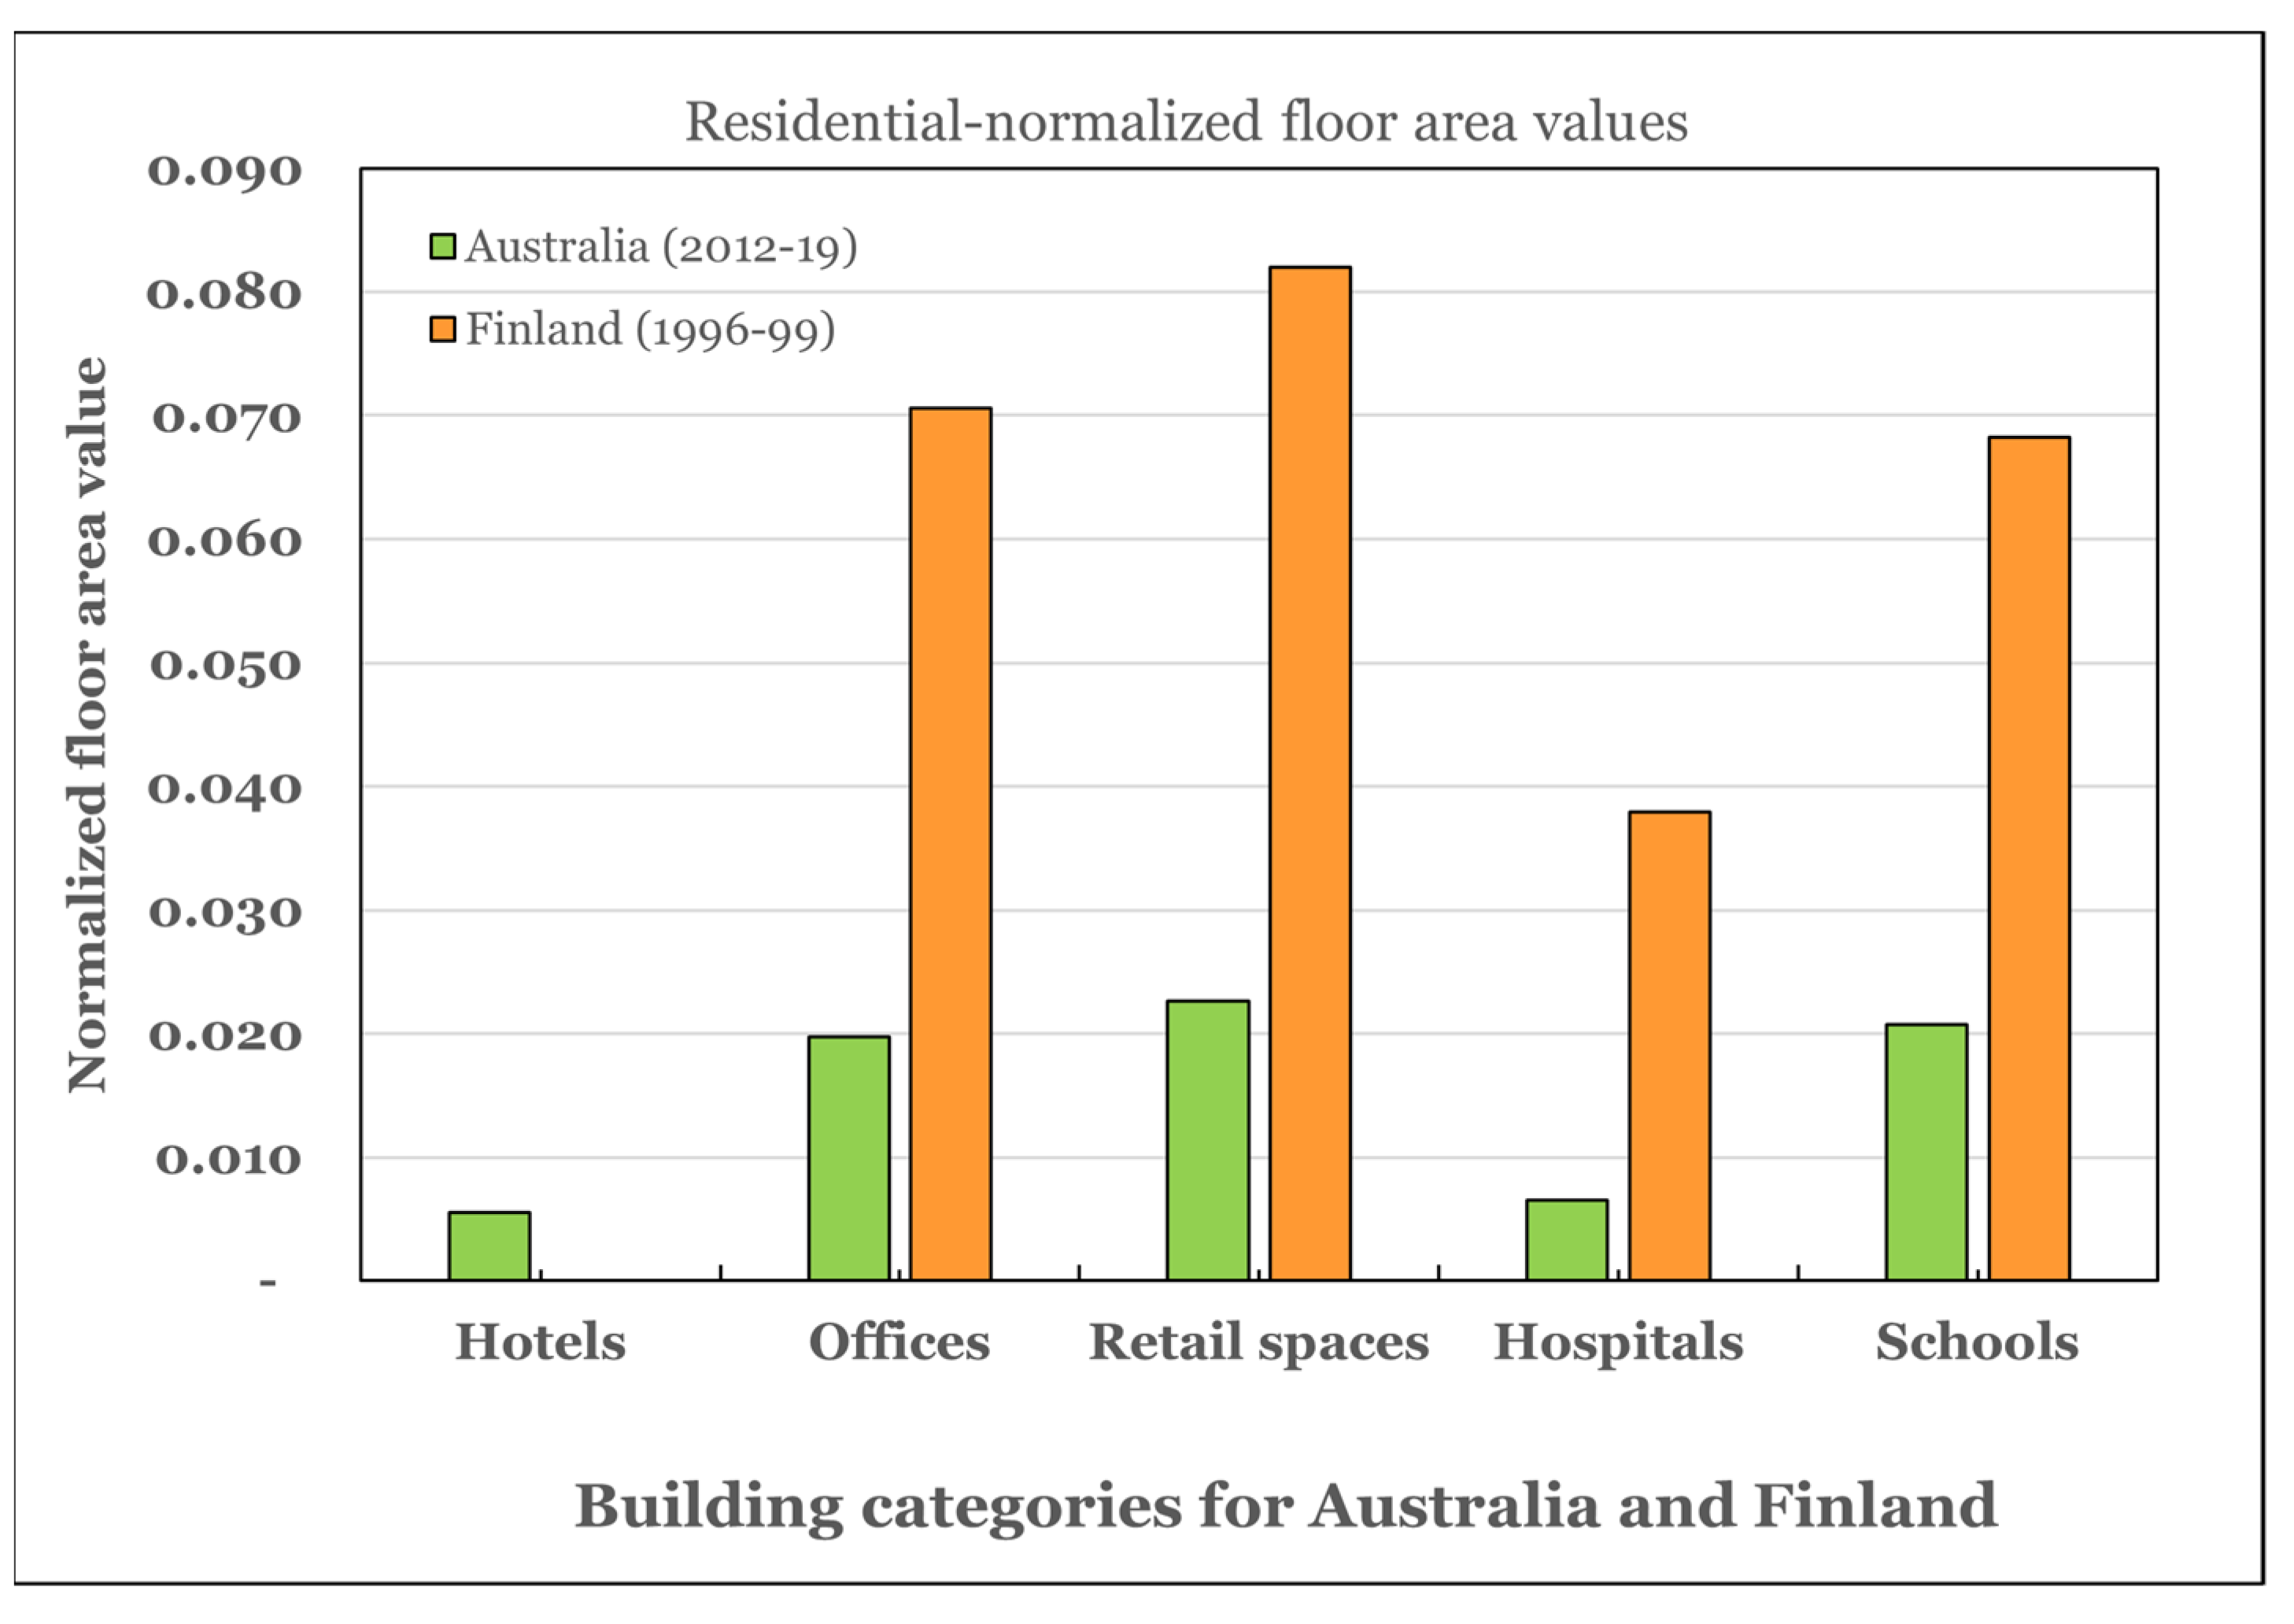
For the sake of a more reliable degree of comparison, Figure 4 presents the normalized floor area values for the two countries; it is evident that the most relevant category is residential in both jurisdictions.
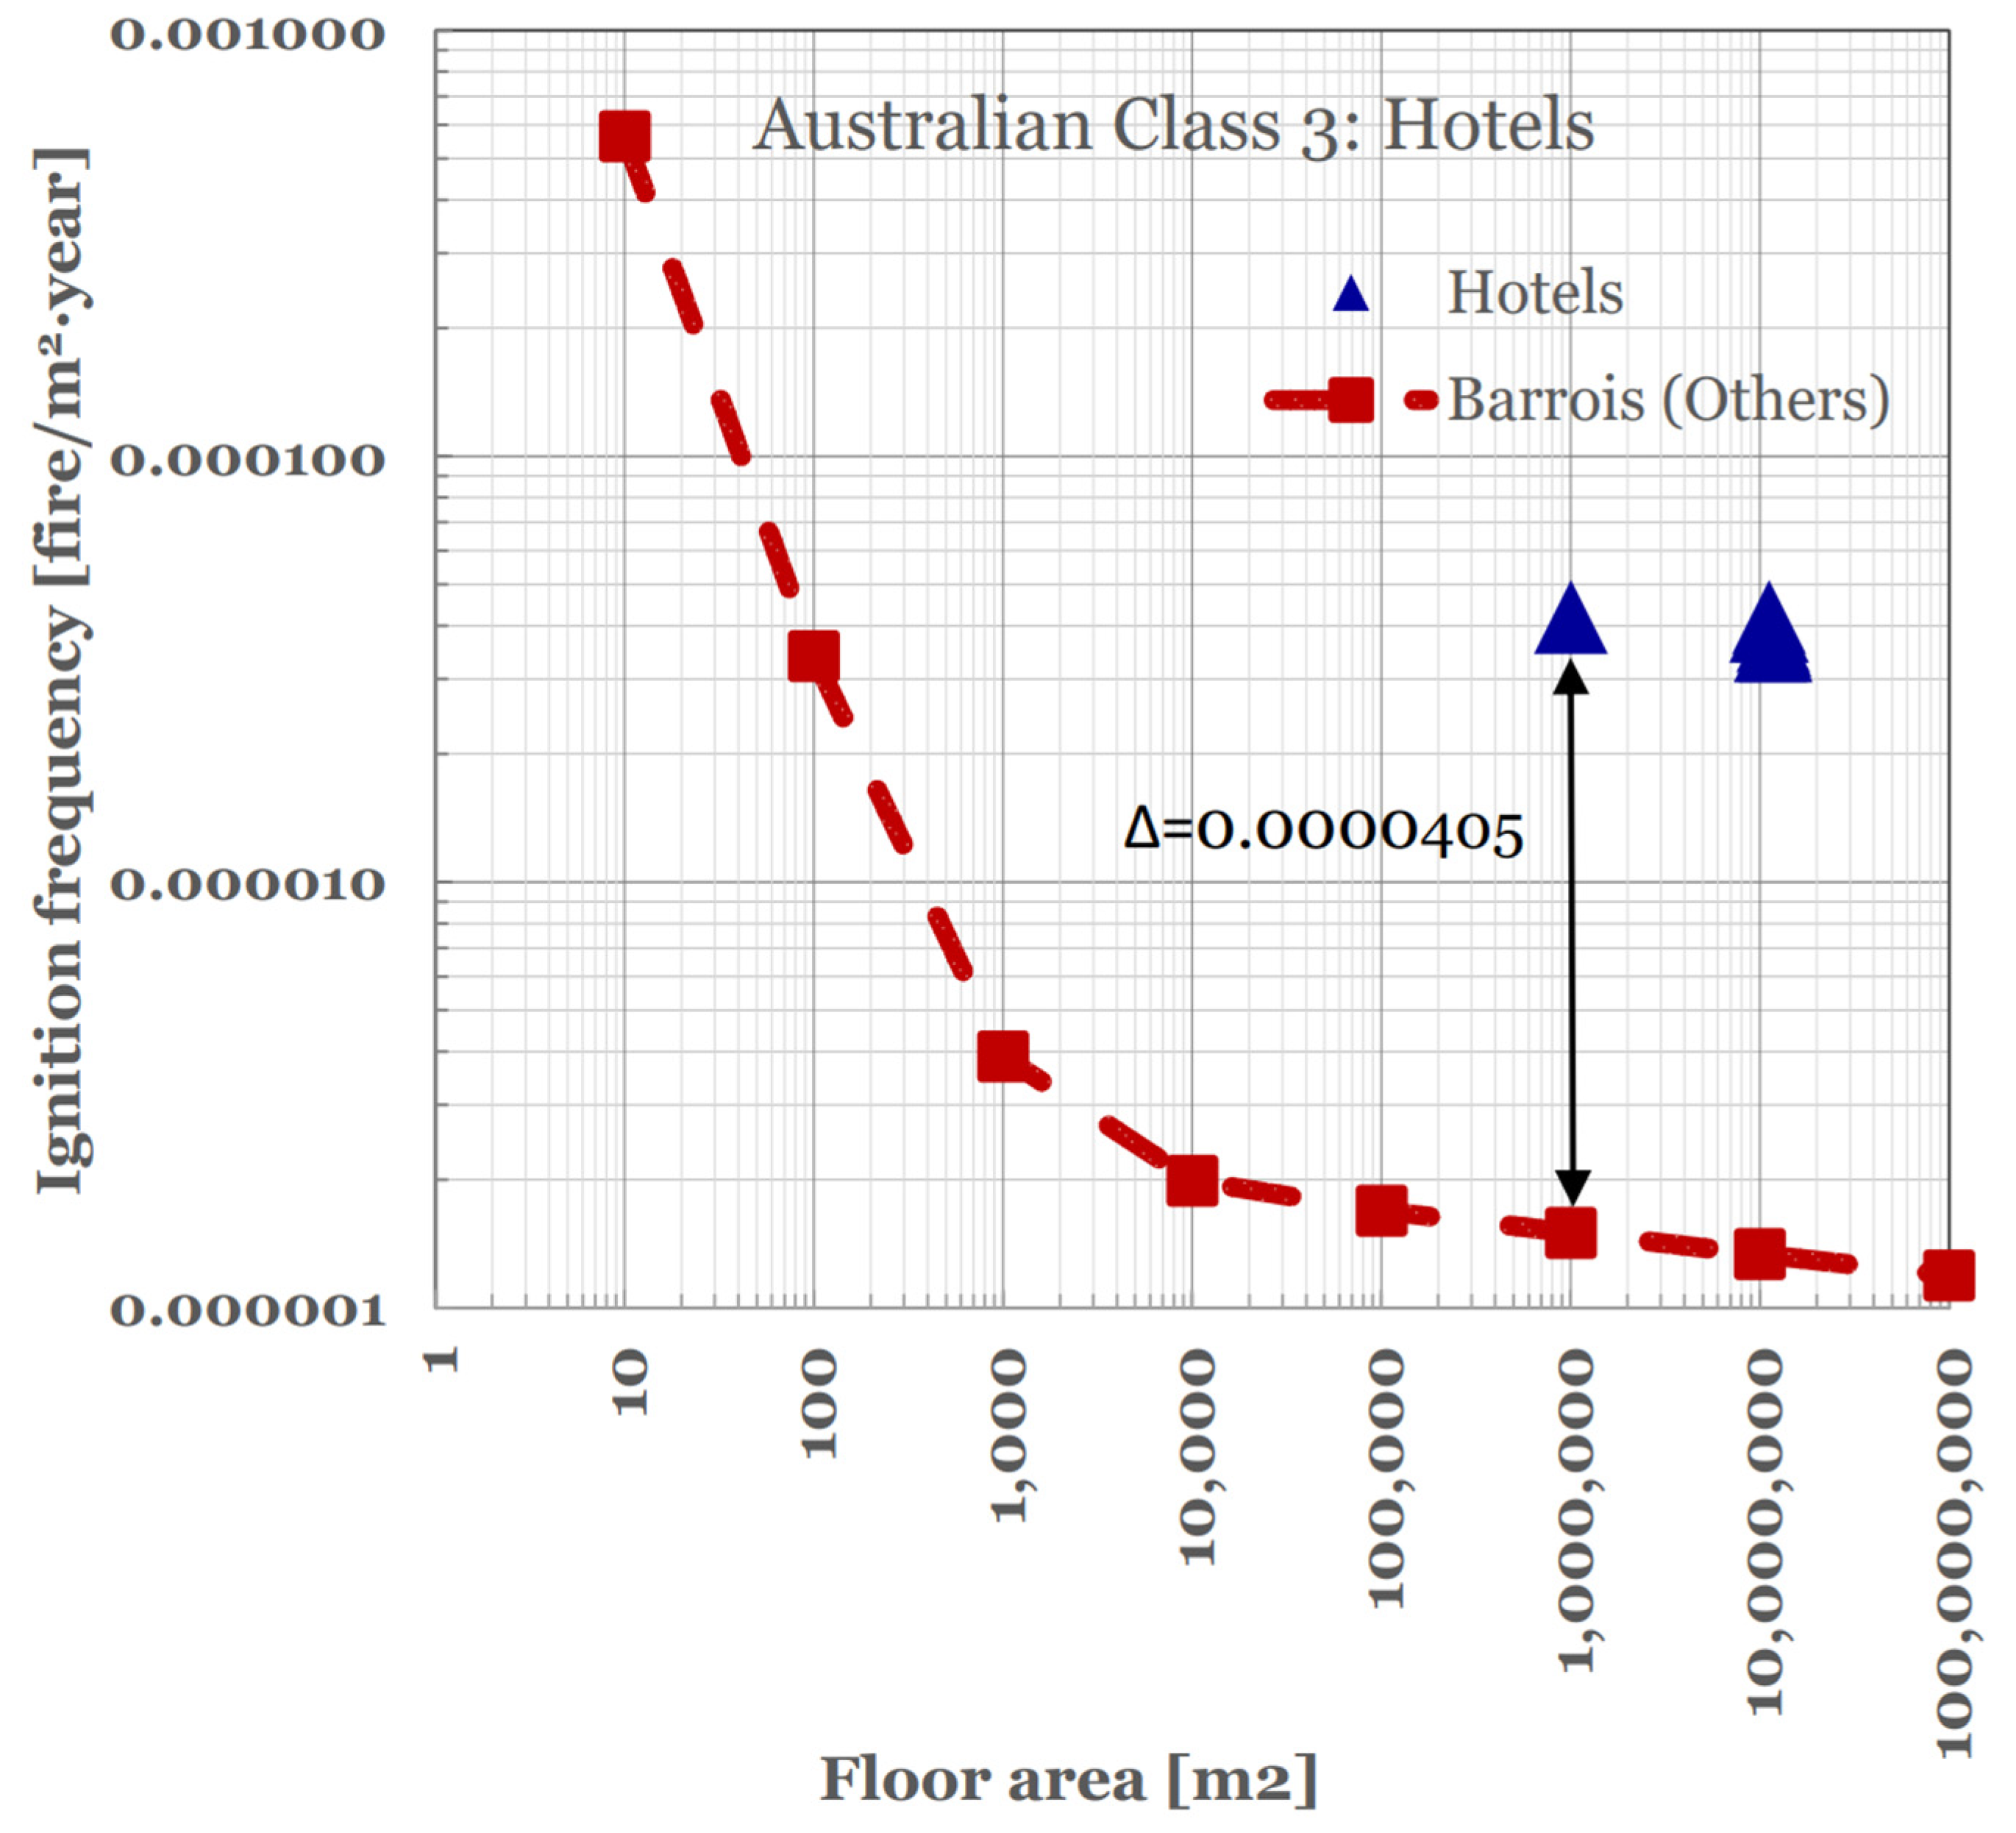
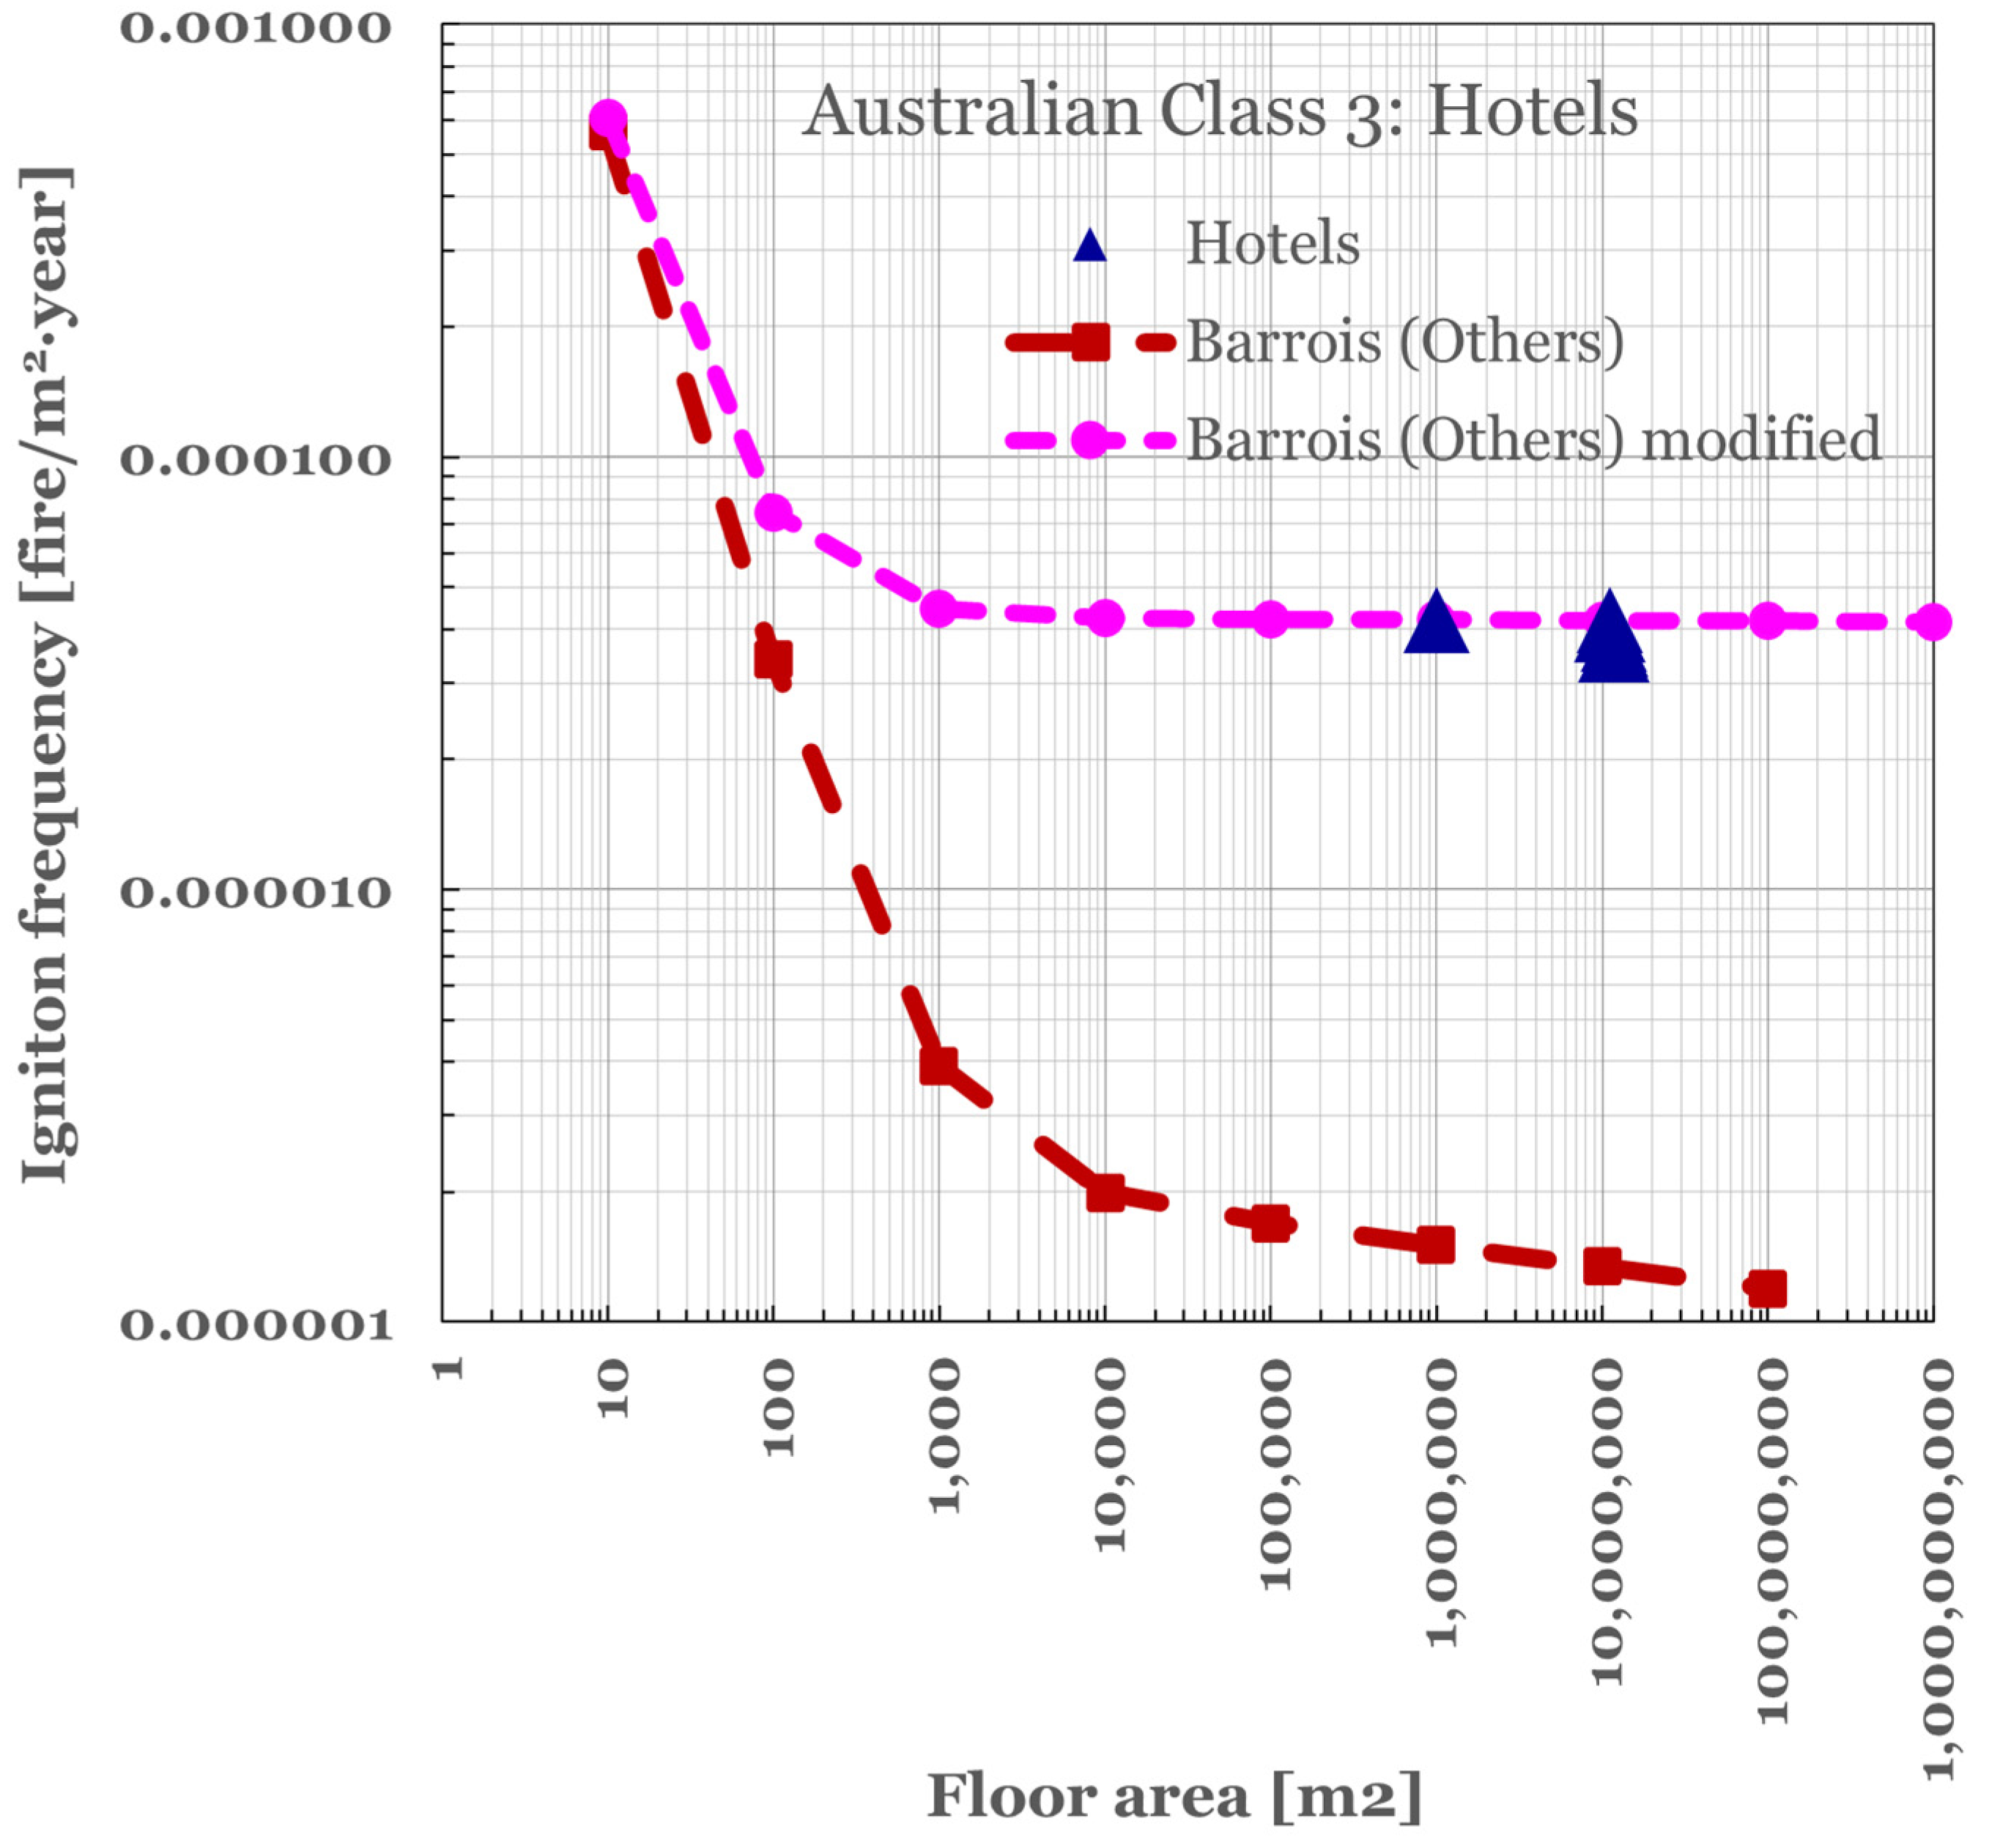
The ignition frequency curve in Figure 5 for Class 3 (Hotels) is derived using the generalized Barrois model (Equation (1)). The data follows the behavior of the Barrois model (fire frequency descending with the area), but the Barrois line (red) underestimates the frequencies from statistics (blue triangles).
The correlation between ignition frequency and building floor area was modified by adding a fixed term, or coefficient c3, to the original line (as described in Section 3.2). The value of c3 is 4.05 × 10⁻⁵, and the red line in Figure 6 represents the modified curve fitting that deviates from previous studies based on single building floor area statistics (<1.20 × 10⁵ m2), rather than the nationwide aggregate floor area of above 1.00 × 10⁷ m2. Unfortunately, we do not have specific data for hotels to verify the shape of the red curve for floor areas below 1.00 × 10⁶. However, we do have data for other building categories that shows that the ignition frequency follows the ‘inverted hockey stick’ fire trend phenomenon for building floor areas between 100 m2 and 20,000 m2, as demonstrated by Tillander [6]. This trend is statistically reliable and consistent with the data from both Finland and Australia.
Given this information, we believe that the constant shift by c3 is consistent with the ‘inverted hockey stick’ curve phenomenon for both jurisdictions. While we recognize that this may not be applicable to all building categories, particularly for smaller floor areas, it is a reasonable assumption based on the data we have available. The inclusion of the coefficient serves as a correction factor to account for the increased fire risk in areas with certain environmental and weather conditions, such as hot and dry climates, that may increase the probability of ignition.
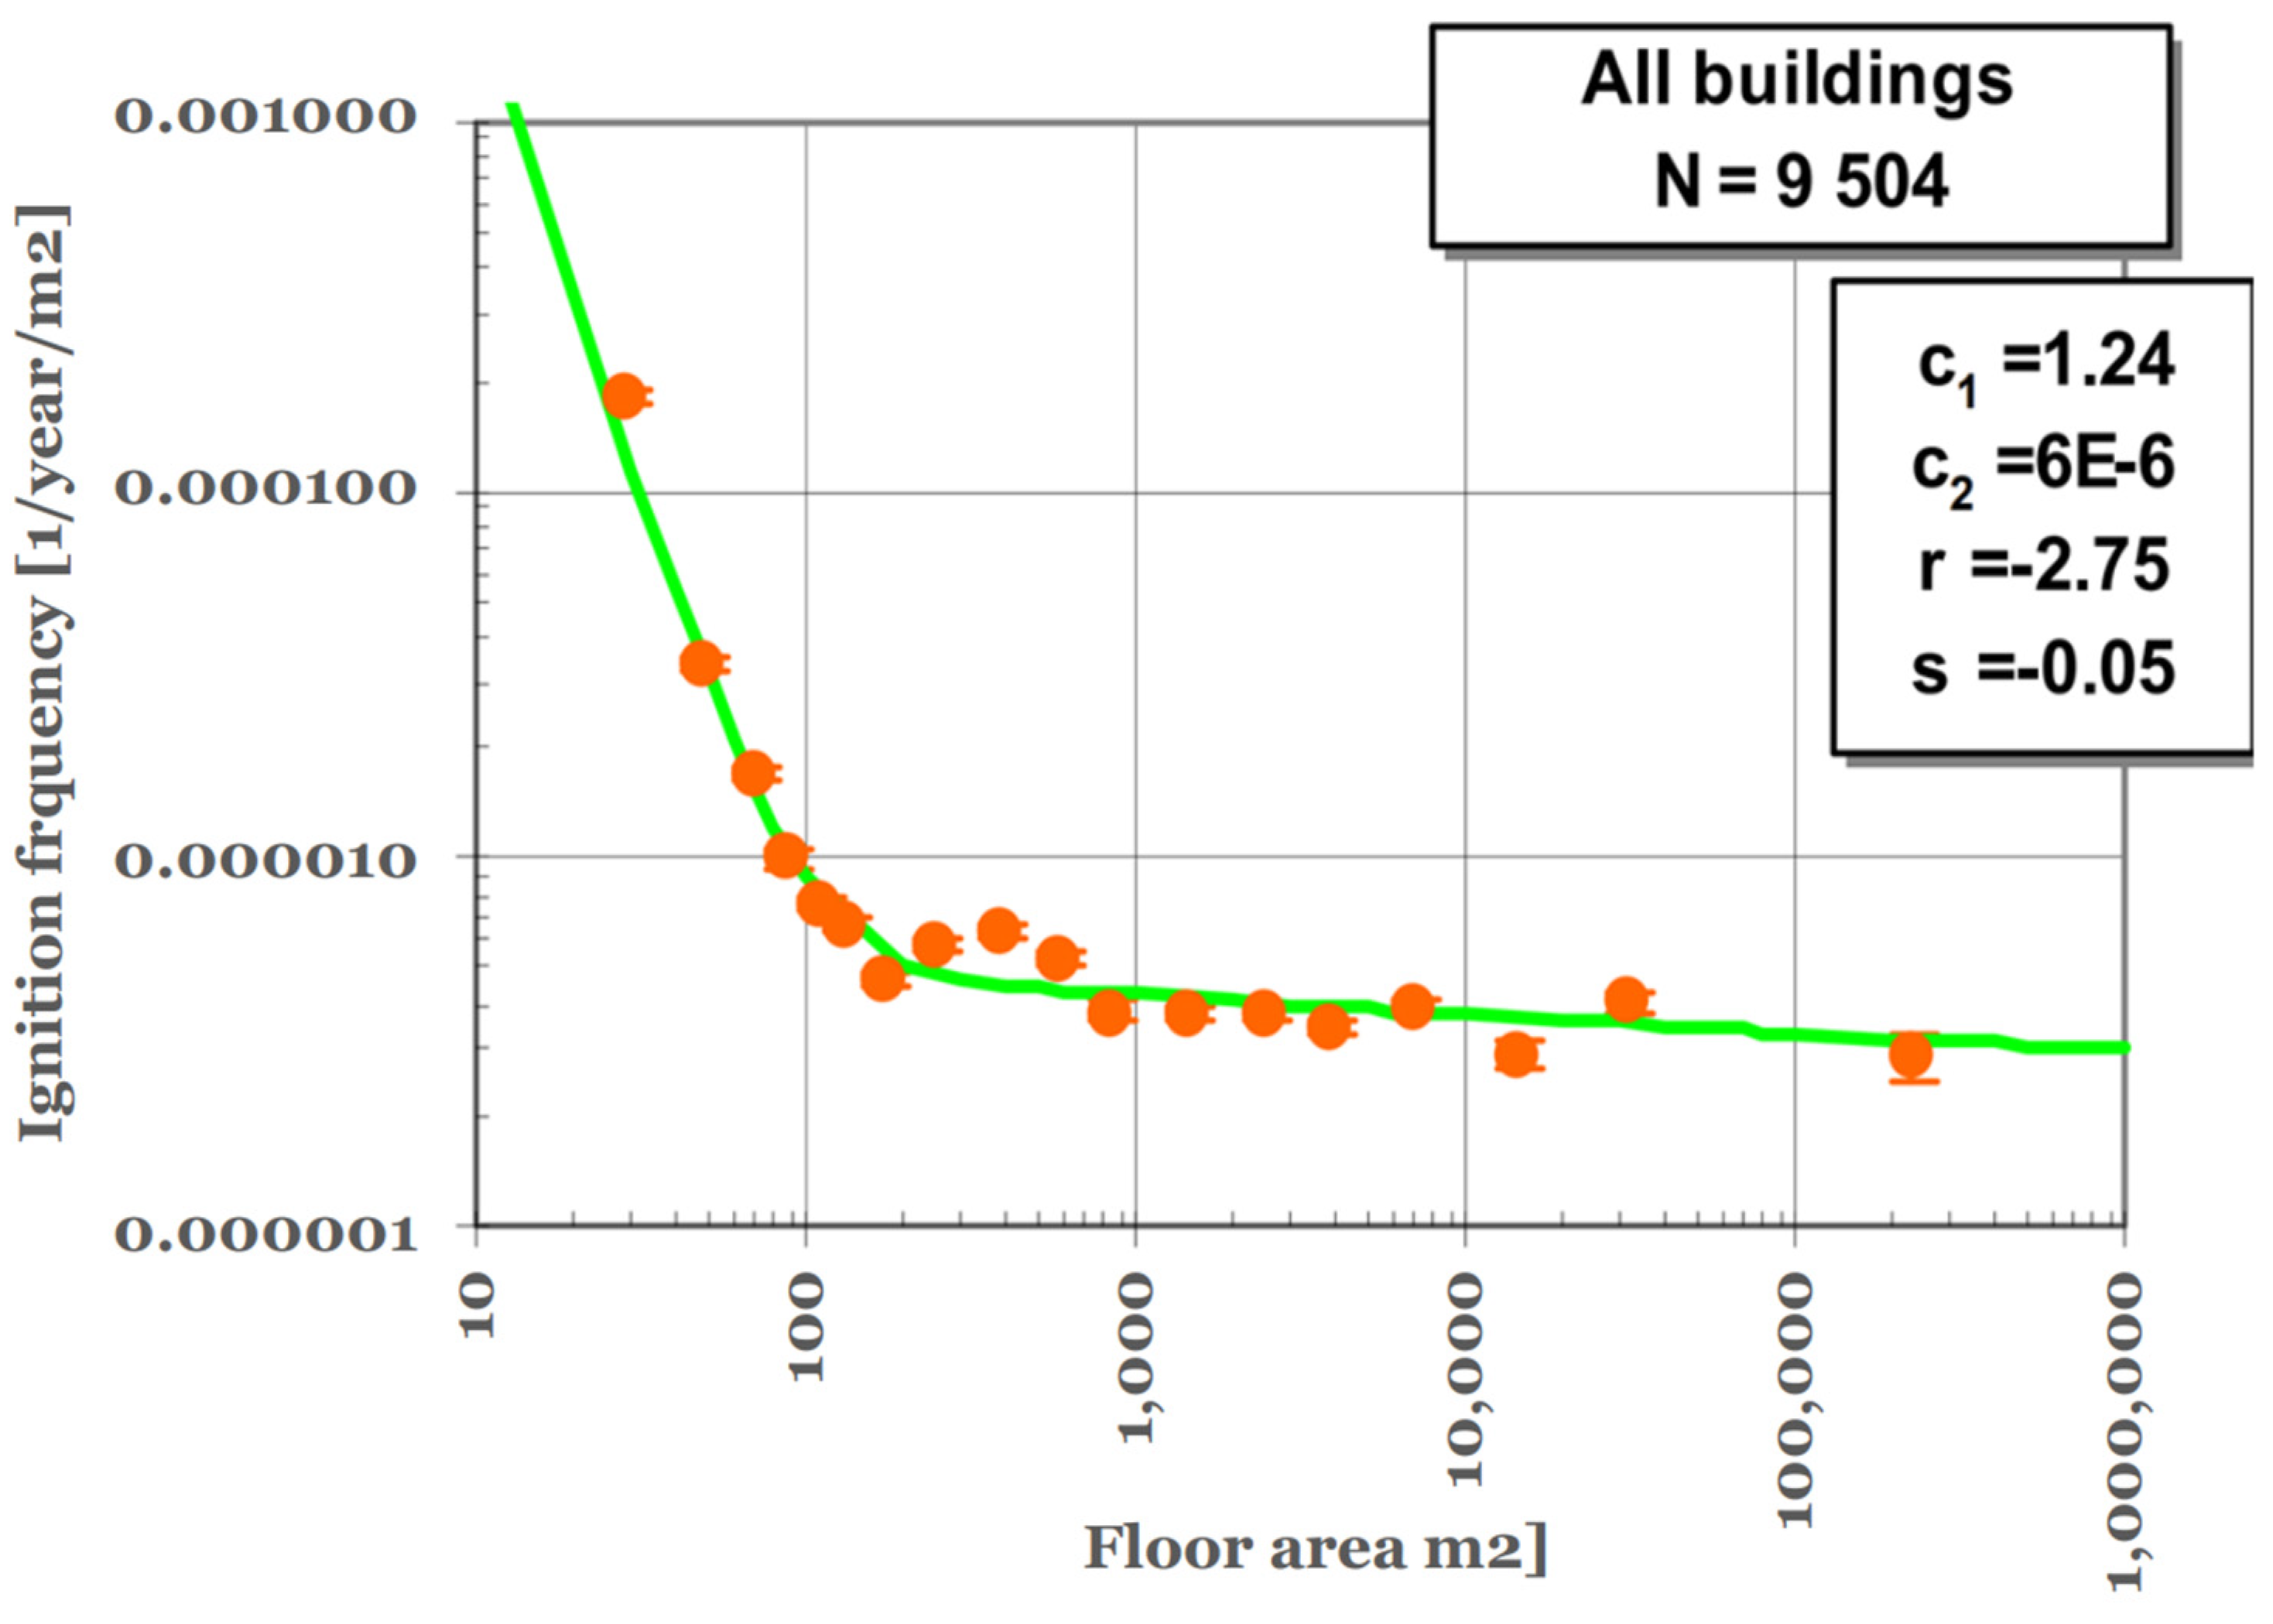
It should be noted that the curve behavior has already been observed in Tillander and Keski-Rahkonen’s study [5], where an underestimation of the ignition frequency for floor areas above 1.00 × 10⁻⁴ is given (see Figure 7). The error bars in the figure are an indication of statistical noise. The point value furthest from the blue curve in Figure 7 is not a result of statistical inaccuracy, as similar deviations were also observed for other building groups. However, due to the need for more sufficient observations in buildings with the largest floor area, it is impossible to establish the ignition frequency of buildings with a floor area exceeding 20,000 m2 based on this data.
Likewise, an underestimation of the ignition frequency emerges from the comparison between the Australian data and the Barrois model for office buildings, as depicted in Figure 8. Here again, a correction factor of 1.05 × 10⁻⁵ is used for the Barrois curve to fit the statistical data. The gap is now four times lower than in the previous case.
The revised curve is also presented in Figure 9. It can be noted that the curve for the ‘Others’ class of building has been updated for a better fit with the Australian data. The original line (in orange) underestimates the ignition frequency for that type of building, while the revised red line more accurately represents the actual data.
For the Class 2 (apartments) group, the comparison with the theoretical output from the Barrois model shows similar results to the previous case, with a slightly higher gap. The same correction factor is adopted here.

3.2. Comparison of the Generalized BARROIS Model with the Australian Historical Data

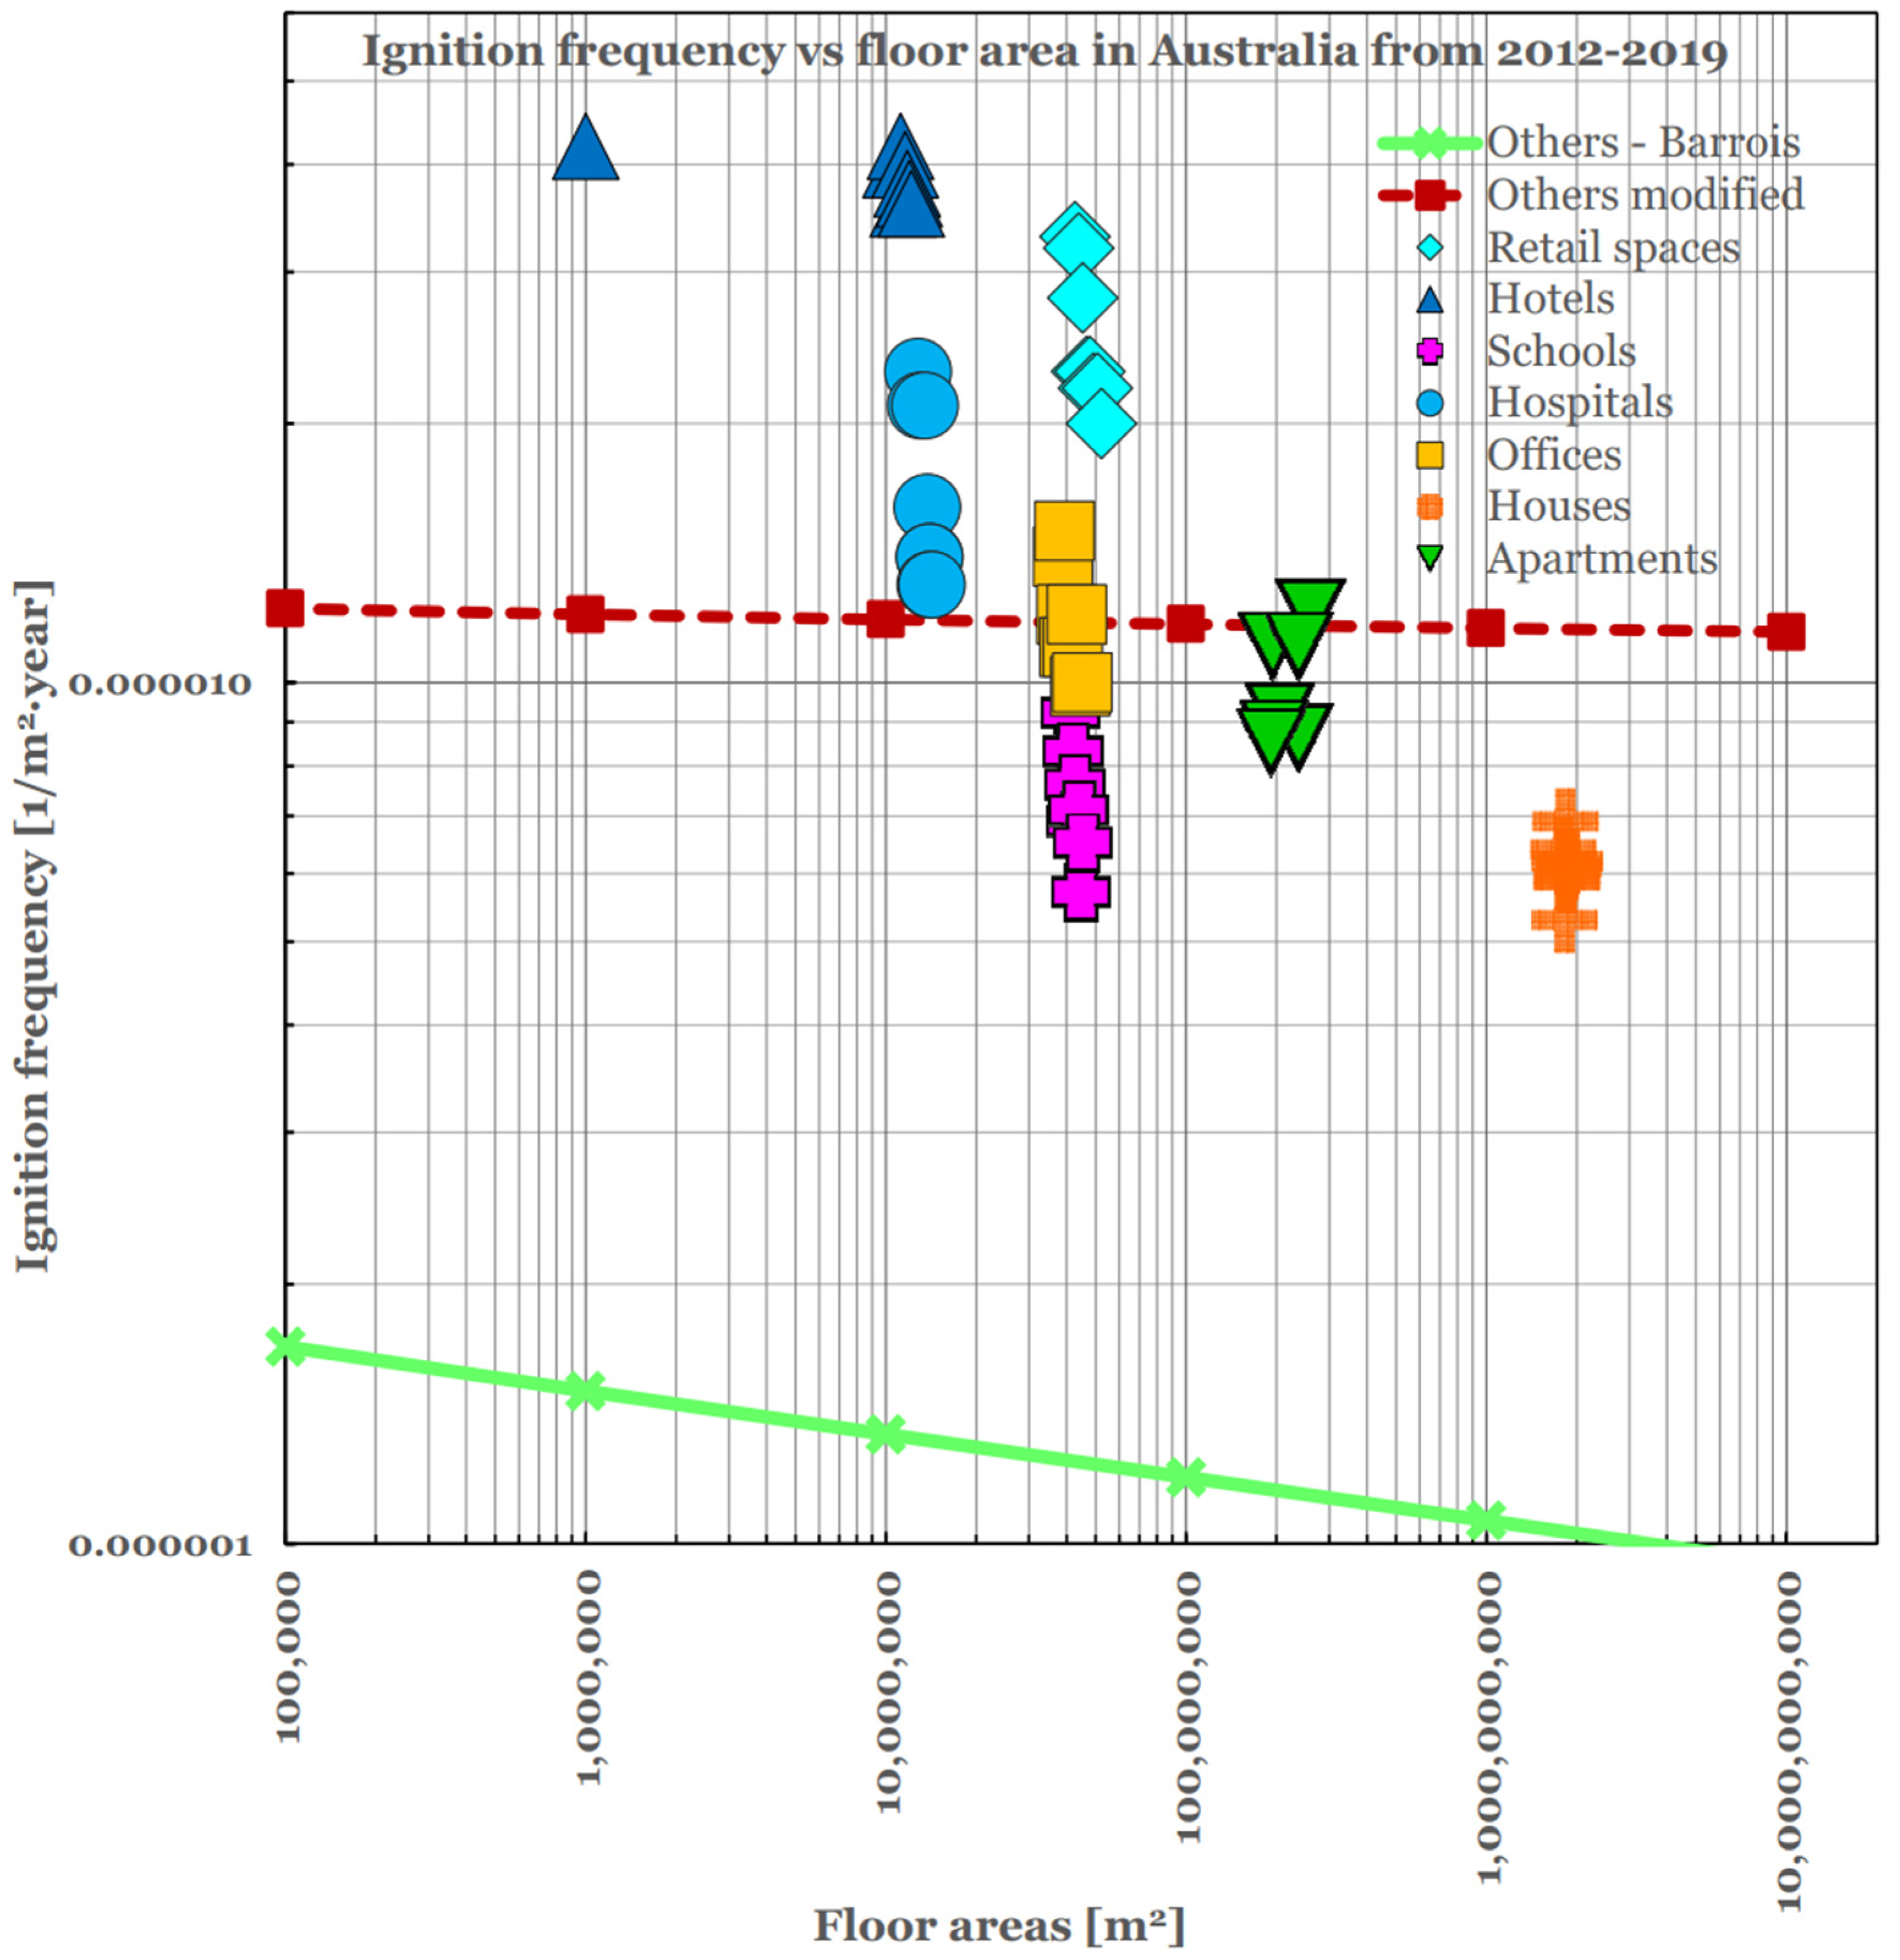
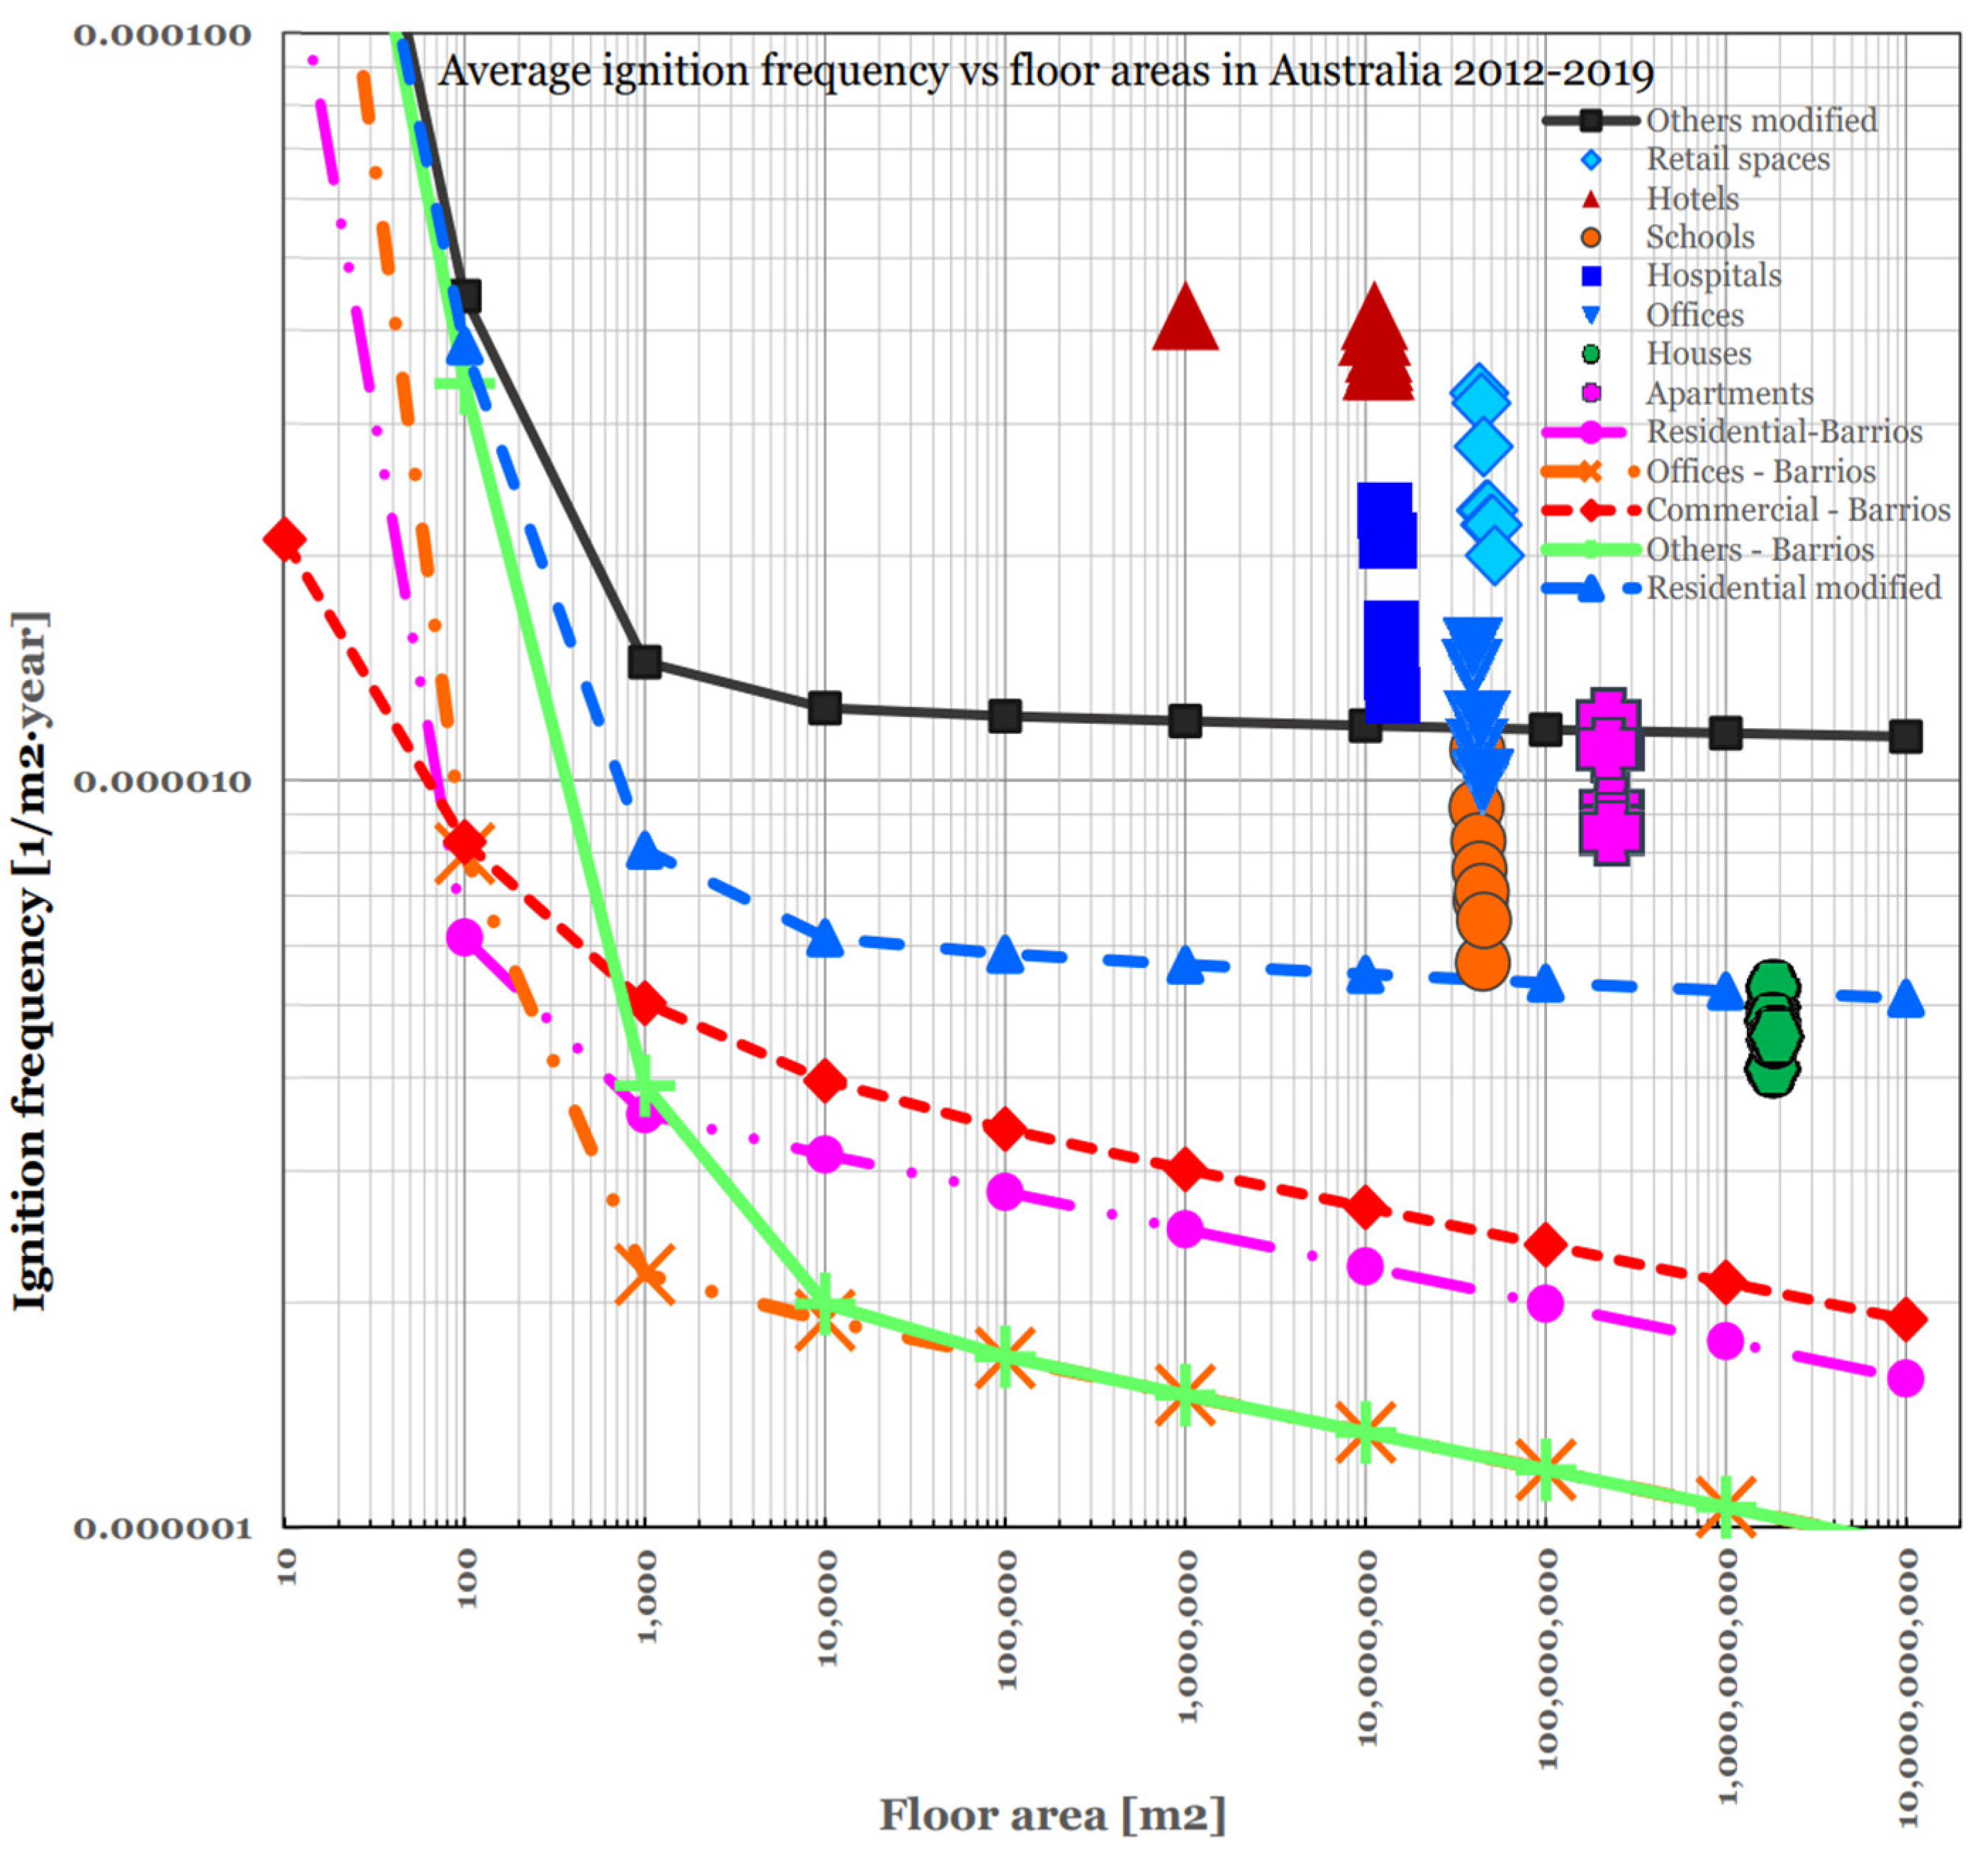
To compare the statistical data for the different building categories, it is necessary to collect the historical data from 2012 to 2019. This is performed for all categories, as shown in Figure 9. It can be seen that the highest ignition frequency is for ‘Hotels’, with an average value of 3.89 × 10⁻⁵ fire/m2·year, and the lowest fire frequency is for ‘Houses’, with a value of 4.65 × 10⁻⁶, followed by ‘Schools’ at 7.79 × 10⁻⁶ fire/m2·year. In general, the yearly variations have minimal impact on the average value for each category.
It is important to highlight that the average ignition frequency [fire/m2·year ], the probability per floor area and time unit in the year of fire incident in a building were obtained by dividing the annual number of fires in the specific building class by its combined floor area, which is similar to the methodology used by Rahikainen et al. [4,5,6]. Tillander [6] has shown that all building classes generally have high ignition frequency values for small buildings but level off to a much lower ignition frequency value for large buildings. This ‘inverse hockey stick’ phenomenon, where the trend line starts with a steep decrease, followed by a relatively flat trend line, is statistically reliable for all building classes with floor areas between 100 m2 and 20,000 m2 [6]. In our case, the average ignition frequency for hotels is 3.89 × 10⁻⁵ fire/m
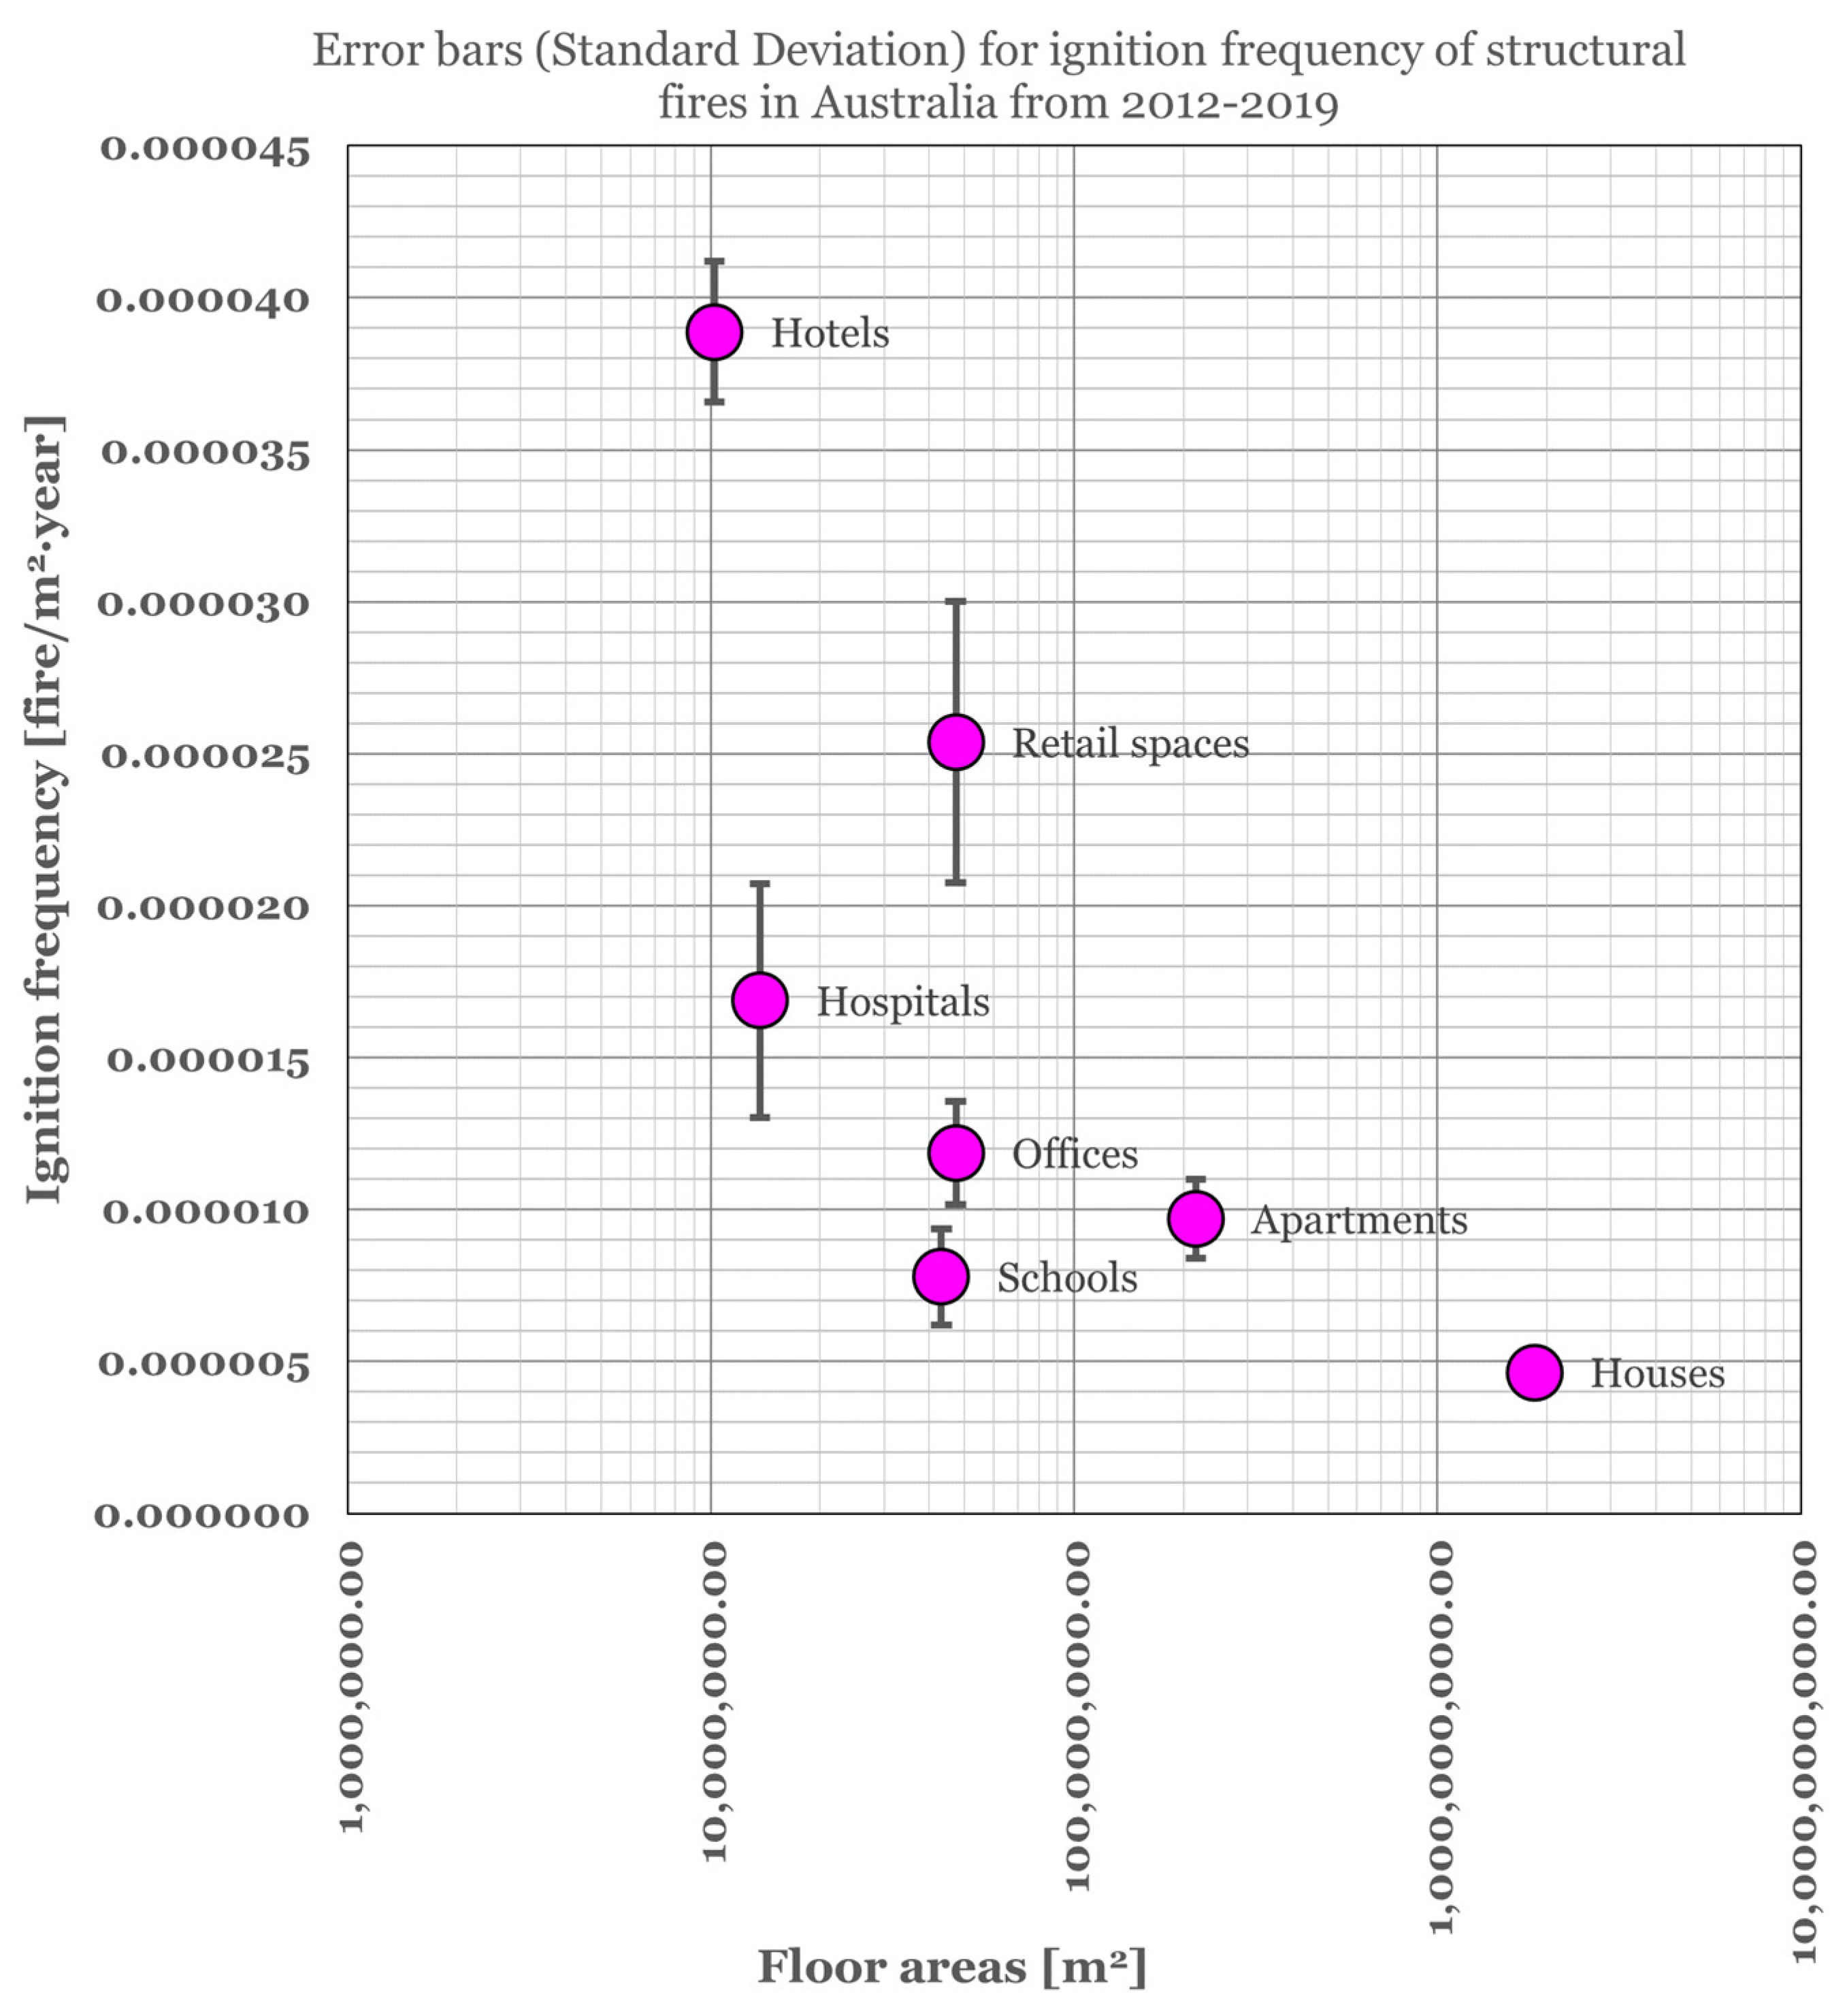
2·year. To compare the data for the single occupancy with the calculated values, the mean value of the calculated data is compared with the historical series, as shown in Figure 10. The ignition frequency is highest for hotels and lowest for houses, while the length of the error bars indicates that the frequencies for retail buildings vary the most, followed by hospitals, hotels, schools, offices and apartments.
A detailed comparison of the ignition frequency in each building category is presented below.
Hotels: The Barrois model underestimates the ignition frequency in the Australian context, with an average calculated value of 5.29 × 10⁻⁶ fire/m2·year against an average of 3.89 × 10⁻⁵ fire/m2·year resulting from statistics. For the curve to fit the Barrois data, it should be shifted upwards to about 4.05 × 10⁻⁵, as shown in Figure 11. From this perspective, it can be noted that fires in Australia are more frequent than those predicted by the Barrois model.

3.3. Comparison between Ignition Frequency of Structural Fires in Australia with Other Models/Statistics

Table 7 provides a comparison of the ignition frequency for hotels according to different models or statistics. It is clear that the average ignition frequency for hotels varies significantly among the different models and statistics. The Italian statistics show the lowest average ignition frequency at 1.84 × 10⁻⁶ fire/m2·year, while the Ramachandran model shows the highest average ignition frequency at 8.00 × 10⁻⁵ fire/m2·year. The generalized Barrois model and the Finnish statistics fall on the lower end of the spectrum, with average ignition frequencies of 4.20 × 10⁻⁶ and 4.70 × 10⁻⁶ fire/m2·year, respectively. The Australian statistics also show a relatively high average ignition frequency of 3.89 × 10⁻⁵ fire/m2·year. It should be noted that these values may be influenced by various factors such as the age and type of the building, fire protection measures in place, and jurisdictional fire codes and regulations.
The actual fire probability for different building categories can also be compared with the values provided in the British Standards BSI PD7974-7-2019 [23]. The BSI provides the value in fires/year per building; it is, therefore, necessary to have the total number of hotels in Australia. From Australian statistical data, the average number of hotels between 2011 and 2016 is 4337. In the same period, the average number of fires in hotels is 445. Therefore, the frequency of fire is 0.103 fires/year. This value can be compared with the value provided in BSI PD7974:2019, which is 0.046 fires/year. This indicates that the PD7974:2019 standard underestimates fire risk for this particular category. Or put simply, ignition frequency for hotels is lower in the UK than in Australia.
Houses: There are sixteen statistical observations for the residential occupancy (2012–2019 values for ‘Houses’ and ‘Apartments’). The average fire ignition frequency for Australia is 4.65 × 10⁻⁶ for ‘Houses’ and 9.60 × 10⁻⁶ for ‘Apartments’. For the residential category the average value of the Barrois model is 2.86 × 10⁻⁶, so again, the model underestimates the statistical values considerably. The comparison with the British Standard is based on the number of buildings in that category, given that the probability of fire is expressed in those terms and not floor area units. These values are reported in Table 8.
Compared to both 2011 and 2016 Australian data, BSI PD 7974:2019 largely overestimates the ignition frequency and hence, the fire risk for residential occupancy.
Offices: The average value for Barrois model calculations is far below the average value extracted from the Australian data, as shown in Figure 11; in fact, the average calculated value is 2.20 × 10⁻⁶ fire/m2·year against an average value of 1.19 × 10⁻⁵ fire/m2·year for the years between 2012 and 2019.
Retail spaces: Figure 11 shows that the generalized Barrois curve for ‘Commercial’ buildings is below the Australian data. This indicates that the methodology underestimates the ignition frequency in this particular case, and hence, the curve must be shifted upwards to match the statistical data. The average statistical value is 5.29 × 10⁻⁶, and the calculated value is around 2.54 × 10⁻⁵.
Hospitals and Schools: For ‘hospital’ buildings, the average value from the generalized Barrois (5.29 × 10⁻⁶) is lower than the Australian statistical data (1.69 × 10⁻⁵), indicating an underestimation of the ignition frequency value for the Australian context (1.53 × 10⁻⁵).
Also, in schools, the Barrois model underestimates the fire frequency, with an average value of 5.29 × 10⁻⁶ against the statistical value of 7.79 × 10⁻⁶. The difference is about 2.50 × 10⁻⁶.
The analysis above is summarized in Table 9.
Figure 11 shows the comparison between the generalized and improved Barrois curves for all building categories in Australia, while Figure 12 shows the generalized Barrois curves for building categories in Finland.

4. Main Conclusions

Historically, it has been shown that ignition frequency is dependent on the floor area of the building, with a weak dependency on other factors. This study examined the ignition frequency of structural fires in Australia between 2012 and 2019, using considerable statistical data drawn from the AIRS Database. The main conclusions are as follows:
1
The Barrois model, as found in the literature and used in other previous studies, cannot be fully applied to the Australian context; typically, the statistical data would have a reasonably good fit with the Barrois model, but in this case, the Barrois curve underestimates the ignition frequencies when compared with the Australian fire statistics;
2
Some categories, such as hotels and hospitals, were not dealt with as separate categories, resulting in deviations. In this study, both are treated as different categories;
3
When the fire ignition frequency for structural fires in Australia is compared with Finland, several conclusions can be made:
  • As a general observation, it can be said that the expected fire ignition frequency for all buildings is lower in Australia than in Finland;
  • The opposite occurs when specific categories are considered: for example, office spaces in Finland have an ignition frequency which is five times lower than in Australia. The same can be argued for retail spaces. The ignition frequency for schools is four times lower in Finland (1.93 × 10⁻⁶) than in Australia (7.79 × 10⁻⁶);
  • There are several reasons for this. First, one can observe that in Finland, timber is primarily adopted as a building material, while in Australia, houses are constructed with timber and/or concrete frames, internal plasterboard walls and external facing bricks. This would lead to a greater probability of fire ignition for homes in Finland, as timber is combustible, whereas concrete is not. On the other hand, specific categories of buildings (office, retail, and apartments, in particular) are way more prone to fire ignition in Australia; jurisdiction-specific rules about electrical installations, fire loads, and fire alarm systems, among others, can influence the spreading of fires, as well as climatic differences (higher temperature and droughts in Australia can act in favor of fire ignition). The most relevant category is residential in both regions.
4
In this study, we analyzed the aggregate national value for each building class in different years. For example, we found that the average fire frequency for hotels is 3.89 × 10⁻⁵ fire/m2·year, and it is assumed to remain constant for both small and large floor area values. We then compared the mean value of the calculated data with the historical series to determine the accuracy of the model. Our analysis showed that the ignition frequency is the highest for hotels and the lowest for houses. The error bars indicate that the frequencies vary the most for retail buildings, followed by hospitals, hotels, schools, offices, and apartments;
5
We found that the Barrois curve tends to underestimate the ignition frequency when compared with statistical data from Australia for a variety of building categories, including houses, hotels, offices, hospitals, and schools. By introducing an additional coefficient c3 to the generalized Barrois equation, we were able to obtain a better fit for these different categories. Our proposed improvements to the generalized Barrois model for calculating fire ignition frequency in Australia are an important contribution to the field. The improved model would be valuable for risk quantification in ABCB’s NCC and for quick determination of fire ignition frequency for QPRA. Overall, our results suggest that the generalized Barrois model with the additional coefficient c3 provides a more accurate and reliable tool for predicting fire ignition frequencies for various building categories in Australia;
6
This study updates and improves on the generalized Barrois model proposed by Rahikainen et al. [4,5,6] for a better fit to the Australian context with the inclusion of a new coefficient c3; for future research, this can be tested and validated in other jurisdictions and building categories.
More real AIRS data needs to be collected so that we can calibrate the model to a finer level of granularity.

Author Contributions

Conceptualization, S.T. and K.M.; methodology, S.T. and K.M.; software, S.T.; validation, S.T., K.M. and P.J.; formal analysis, S.T. and K.M.; resources, S.T. and K.M.; data curation, S.T. and K.M.; writing—original draft preparation, S.T.; writing—review and editing, S.T., K.M. and P.J.; visualization, S.T. and K.M.; project administration, K.M. and P.J.; funding acquisition, S.T. and K.M. All authors have read and agreed to the published version of the manuscript.

Funding

This research received no external funding.

Institutional Review Board Statement

Not applicable.

Informed Consent Statement

Not applicable.

Data Availability Statement

Not applicable.

Conflicts of Interest

The authors declare no conflict of interest.

References

  1. Rahikainen, J.; Keski-Rahkonen, O. Statistical determination of ignition frequency of structural fires in different premises in Finland. Fire Technol. 2004, 40, 335–353. [Google Scholar] [CrossRef]
  2. ABCB. Building Code of Australia Volume 2, Class 1 and Class 10 Buildings, Australia Building Codes Board; ABCB: Canberra, Australia, 2016. [Google Scholar]
  3. MacLeod, J.; Tan, S.; Moinuddin, K. Reliability of fire (point) detection system in office buildings in Australia—A fault tree analysis. Fire Saf. J. 2020, 115, 103150. [Google Scholar] [CrossRef]
  4. Rahikainen, J.; Keski-Rahkonen, O. Determination of ignition frequency of fires in different premises in Finland. Fire Eng. J. 1998, 58, 33–37. [Google Scholar]
  5. Tillander, K.; Keski-Rahkonen, O. The ignition frequency of structural fires in Finland 1996–1999. Fire Saf. Sci. 2003, 7, 1051–1062. [Google Scholar] [CrossRef] [Green Version]
  6. Tillander, K. Utilisation of Statistics to Assess Fire Risks in Buildings. Ph.D. Thesis, VTT Technical Research Centre of Finland, Espoo, Finland, 2004. [Google Scholar]
  7. Krasuski, A.; Hostikka, S. AAMKS—Integrated cloud-based application for probabilistic fire risk assessment. Fire Mater. 2021, 45, 744–756. [Google Scholar] [CrossRef]
  8. Xin, J.; Huang, C. Fire risk analysis of residential buildings based on scenario clusters and its application in fire risk management. Fire Saf. J. 2013, 62, 72–78. [Google Scholar] [CrossRef]
  9. Tan, S.; Weinert, D.; Joseph, P.; Moinuddin, K.A.M. Incorporation of technical, human and organizational risks in a dynamic probabilistic fire risk model for high-rise residential buildings. Fire Mater. 2021, 45, 779–810. [Google Scholar] [CrossRef]
  10. Tan, S.; Weinert, D.; Joseph, P.; Moinuddin, K. Impact of technical, human, and organizational risks on reliability of fire safety systems in high-rise residential buildings—Applications of an integrated probabilistic risk assessment model. Appl. Sci. 2020, 10, 8918. [Google Scholar] [CrossRef]
  11. Tan, S.; Weinert, D.; Joseph, P.; Moinuddin, K. Sensitivity and uncertainty analyses of human and organizational risks in fire safety systems for high-rise residential buildings with probabilistic T-H-O-risk methodology. Appl. Sci. 2021, 11, 2590. [Google Scholar] [CrossRef]
  12. Tan, S.; Weinert, D.; Joseph, P.; Moinuddin, K.A.M. A Dynamic Probabilistic Fire Risk Model Incorporating Technical, Human and Organizational Risks for High-Rise Residential Buildings. In Proceedings of the 2019 Interflam Fire Science and Engineering Conference, London, UK, 1–3 July 2019; Volume 1, pp. 937–950. [Google Scholar]
  13. Malagnino, A. Integrating Statistics based Fire Risk Assessment with Building Life-Cycle Management. Ph.D. Thesis, University of Salento, Lecce, Italy, 2020; pp. 1–251. [Google Scholar]
  14. Johansson, U.; Hui, M.C. Fire Safety of Early Childhood Centres in High Rise Buildings in Australia; ABCB: Canberra, Australia, 2019. [Google Scholar]
  15. Ramachandran, G. Statistical methods in risk evaluation. Fire Saf. J. 1980, 2, 125–415. [Google Scholar] [CrossRef]
  16. Sandberg, M. Statistical Determination of Ignition Frequency. Master’s Thesis, Lund University, Lund, Sweden, 2004. [Google Scholar]
  17. D’Este, M.; Ganga, A.; Elia, M.; Lovreglio, R.; Giannico, V.; Spano, G. Modeling fire ignition probability and frequency using Hurdle models: A cross-regional study in Southern Europe. Ecol. Process. 2020, 9, 54. [Google Scholar] [CrossRef]
  18. Hu, J.; Shu, X.; Shen, S.; Yan, J.; Tian, F.; He, S. A method to improve the determination of ignition probability in buildings based on Bayesian network. Fire Mater. 2021, 46, 666–676. [Google Scholar] [CrossRef]
  19. Tan, S.; Moinuddin, K. Systematic review of human and organizational risks for probabilistic risk analysis in high-rise buildings. Reliab. Eng. Syst. Saf. 2019, 188, 233–250. [Google Scholar] [CrossRef]
  20. Arup; The University of Queensland. Risk Metrics Data Study—Australian Building Codes Board; ABCB: Canberra, Australia, 2021. [Google Scholar]
  21. Barrois, T.J. Essai sur L’application du Calcul des Probabilités aux Assurances Contre les Incendies [A Proposition on the Application of Probability Theory on Fire Insurance]. In Mémoires de la Société Royale des Sciences, de L’agriculture et des Arts de Lille; 1834; Volume 11, pp. 85–282. (In French) [Google Scholar]
  22. Moinuddin, K.; Tan, S. Future Data Collection Strategy for the Quantification of Fire Safety Performance Requirement; Australian Building Codes Board: Canberra, Australia, 2020. [Google Scholar]
  23. BSI, PD 7974-7:2019; Application of Fire Safety Engineering Principles to the Design of Buildings—Part 7: Probabilistic Risk Assessment, British Standards Published Document. British Standards Institution: London, UK, 2019.
Figure 1. Percentage of ignitions from 2012 to 2019 and floor areas in different building categories in Australia.
Fire 06 00035 g001
Figure 2. Average ignition frequencies of different building categories in Finland from 1996 to 1999 (extracted from Tillander and Keski-Rahkonen [5]).
Fire 06 00035 g002
Figure 3. Ignition frequencies of different building categories in Australia compared to Finland.
Fire 06 00035 g003
Figure 4. Normalized values of floor area in Australia compared to Finland (reference value: residential area).
Fire 06 00035 g004
Figure 5. The ignition frequency curve for Class 3 (Hotels) in Australia from 2012 to 2019 was derived using the generalized Barrois model and the ignition frequency observations (blue triangles).
Fire 06 00035 g005
Figure 6. Ignition frequency curves for Class 3 (Hotels) in Australia from 2012 to 2019 derived using the generalized Barrois model and the modified Barrois version.
Fire 06 00035 g006
Figure 7. Ignition frequency observations (orange dots) in all building categories in Finland from 1996 to 1999 and a generalized Barrois model fitted to the data (solid green line) (extracted from [6]).
Fire 06 00035 g007
Figure 8. Ignition frequency curves for Australian Class 5—Offices derived from the Barrois model.
Fire 06 00035 g008
Figure 9. The average ignition frequency of different building classes as a function of floor areas in Australia between 2012 and 2019. (In Figure 9, only two Barrois curves are presented as the focus is on the ‘Others’ group of buildings).
Fire 06 00035 g009
Figure 10. Error bar graphs from the historical data series for ignition frequency of structural fires in Australia from 2012 to 2019.
Fire 06 00035 g010
Figure 11. Comparison of the statistical ignition frequency in hotels in Australia with generalized and improved Barrois models.
Fire 06 00035 g011
Figure 12. Generalized Barrois curves for building categories in Finland 1996–1999.
Fire 06 00035 g012
Table 1. Statistical floor areas of various building stocks in Australia from 2012 to 2019 extracted from the Australian Bureau of Statistics and [20].
ClassOccupancy20122013201420152016201720182019Average
[m2][m2][m2][m2][m2][m2][m2][m2][m2]
1aHouses1.81 × 1091.84 × 1091.86 × 1091.83 × 1091.85 × 1091.82 × 1091.88 × 1091.90 × 1091.85 × 109
2Apartments2.30 × 1082.23 × 1082.22 × 1082.32 × 1082.33 × 1082.31 × 1082.33 × 1082.33 × 1082.30 × 108
3Hotel1.10 × 1071.09 × 1071.13 × 1071.14 × 1071.15 × 1071.17 × 1071.19 × 1071.21 × 1071.15 × 107
5Offices3.83 × 1074.02 × 1074.06 × 1073.95 × 1074.25 × 1074.17 × 1074.06 × 1074.54 × 1074.11 × 107
6Retail spaces4.22 × 1074.46 × 1074.54 × 1074.68 × 1074.69 × 1074.88 × 1075.00 × 1075.15 × 1074.70 × 107
9aHospitals1.30 × 1071.30 × 1071.35 × 1071.34 × 1071.36 × 1071.41 × 1071.44 × 1071.42 × 1071.36 × 107
9bSchools4.13 × 1074.15 × 1074.20 × 1074.28 × 1074.32 × 1074.39 × 1074.46 × 1074.54 × 1074.31 × 107
Table 2. Structural fire incidents for NCC Classes in Australia from 2012 to 2019 [fires/year] extracted from [20].
ClassOccupancy20122013201420152016201720182019Average
1aHouses897796898332749483358668861386278592
2Apartments253126782445210920261986202319792222
3Hotels 438458476412459445441434445
5Offices 536603487434468500402454486
6Retail spaces139314271271107710781074110010291181
9aHospitals298273283215190198187184229
9bSchools380456349325298312254295334
Table 3. Ignition frequency of structural fires for NCC classes in Australia from 2012 to 2019 [fire/m2·year] taken from the Australian Bureau of Statistics, the Department of Climate Change and Energy Efficiency, and [20].
ClassOccupancy20122013201420152016201720182019Average
1aHouses4.96 × 10−65.27 × 10−64.48 × 10−64.11 × 10−64.49 × 10−64.76 × 10−64.58 × 10−64.53 × 10−64.65 × 10−6
2Apartments1.10 × 10−51.20 × 10−51.10 × 10−59.10 × 10−68.70 × 10−68.60 × 10−68.70 × 10−68.50 × 10−69.60 × 10−6
3Hotels4.00 × 10−54.20 × 10−54.20 × 10−53.60 × 10−54.00 × 10−53.80 × 10−53.70 × 10−53.60 × 10−53.90 × 10−5
5Offices1.40 × 10−51.50 × 10−51.20 × 10−51.10 × 10−51.10 × 10−51.20 × 10−59.90 × 10−61.00 × 10−51.20 × 10−5
6Retail spaces3.30 × 10−53.20 × 10−52.80 × 10−52.30 × 10−52.30 × 10−52.20 × 10−52.20 × 10−52.00 × 10−52.50 × 10−5
9aHospitals2.30 × 10−52.10 × 10−52.10 × 10−51.60 × 10−51.40 × 10−51.40 × 10−51.30 × 10−51.30 × 10−51.70 × 10−5
9bSchools9.20 × 10−61.10 × 10−58.30 × 10−67.60 × 10−66.90 × 10−67.10 × 10−65.70 × 10−66.50 × 10−67.79 × 10−6
Table 4. Statistical data for ignition frequency of structural fires in Australia from 2012 to 2019 from the Australian Bureau of Statistics and the Department of Climate Change and Energy Efficiency [20].
ClassOccupancyFloor Area (m2)Number of FiresFrequency (fires/m2·year)
1aHouses1,849,263,35185924.65 × 10−6
2Apartment229,555,57622229.60 × 10−6
3Hotels11,474,0684453.90 × 10−5
5Offices41,092,7224861.20 × 10−5
6Retail spaces47,020,32011812.50 × 10−5
9aHospital47,020,3202291.70 × 10−5
9bSchools43,081,041 3347.80 × 10−6
Table 5. Parameters of the generalized Barrois model extracted from Tillander [6].
Building Categoryc1c2rsR2 [%]
Residential buildings 1.00 × 10−025.00 × 10−06−1.83−0.0584
Commercial buildings 7.00 × 10−056.00 × 10−06−0.65−0.0526
Office buildings 5.60 × 10−023.00 × 10−06−2.00−0.0574
Transport and firefighting and rescue-service buildings7.00 × 10−051.00 × 10−06−0.65−0.0575
Buildings for institutional care 2.00 × 10−045.00 × 10−06−0.61−0.0568
Assembly buildings 3.00 × 10−032.00 × 10−06−1.14−0.0585
Educational buildings 3.00 × 10−033.00 × 10−06−1.26−0.0546
Industrial buildings3.00 × 10−045.00 × 10−06−0.61−0.0590
Warehouses3.822.00 × 10−06−2.08−0.0598
Other buildings 1.181.00 × 10−04−1.87−0.2095
Table 6. Values assumed for the new coefficient c3 in the improved Barrois model.
Building Categoryc3
Others (Hotels)4.05 × 10−05
Others (Offices)1.05 × 10−05
Residential (Houses)4.16 × 10−06
Residential (Apartments)1.05 × 10−05
Others (Schools)4.05 × 10−05
Others (Hospitals)4.05 × 10−05
Table 7. Hotel average ignition frequency according to different models or statistics.
Model/StatisticsIgnition Frequency 1 × 10−06 [fire/m2·year]Source
Italian statistics (hotels)1.84[13] Malagnino
Generalized Barrois model4.2[6] Tillander
Finnish statistics (commercial buildings)4.7[5] Tillander & Keshi-Rahkonen.
Australian statistics (hotel)38.9[20] Arup & UQ
Ramachandran model80[15] Ramachandran
Table 8. Comparison of ignition frequencies with the British standard.
YearNumber of Residential BuildingsNumber of FiresFrequencyPD 7974-7
20111,798,87811,6546.47 × 10−30.13 × 10⁻²
20162,206,87510,4424.73 × 10−30.13 × 10⁻²
Table 9. Summary of the ignition frequency comparison for different building stocks.
Type of OccupancyAverage Frequency from Barrois Model (fB)Average Frequency from Statistical Data (fs)Variations (fB − fs)
Residential2.86 × 10−65.20 × 10⁻⁶−2.33 × 10⁻⁵
Hotels (Others)5.29 × 10−63.89 × 10−5−3.36 × 10⁻⁵
Offices2.20 × 10−61.19 × 10⁻⁵−9.70 × 10⁻⁵
Retail spaces (Others)5.29 × 10−62.54 × 10−5−2.01 × 10⁻⁵
Hospitals (Others)5.29 × 10−61.69 × 10−5−1.16 × 10⁻⁵
Schools (Others)5.29 × 10−67.79 × 10−6−2.50 × 10⁻⁶
Disclaimer/Publisher’s Note: The statements, opinions and data contained in all publications are solely those of the individual author(s) and contributor(s) and not of MDPI and/or the editor(s). MDPI and/or the editor(s) disclaim responsibility for any injury to people or property resulting from any ideas, methods, instructions or products referred to in the content.

