


The Effect of Forest Fire Events on Air Quality: A Case Study of Northern Colombia
by
 , ,
, ,
Sindy Bolaño-Diaz
1,2,* ,
,
Yiniva Camargo-Caicedo
1,2,
Fredy Tovar Bernal
1,2 and
Tomás R. Bolaño-Ortiz
3
1
Programa de Ingeniería Ambiental y Sanitaria, Facultad de Ingeniería, Universidad del Magdalena, Santa Marta 470001, Colombia
2
Grupo de Investigación en Modelación de Sistemas Ambientales (GIMSA), Facultad de Ingeniería, Universidad del Magdalena, Santa Marta 470001, Colombia
3
Centre for Environmental Technologies (CETAM), Universidad Técnica Federico Santa María (UTFSM), Av. España 1680, Valparaíso 46383, Chile
*
Author to whom correspondence should be addressed.
Fire 2022, 5(6), 191; https://doi.org/10.3390/fire5060191
Submission received: 28 July 2022
/
Revised: 22 October 2022
/
Accepted: 23 October 2022
/
Published: 14 November 2022
(This article belongs to the Special Issue Vegetation Fires in South America)
Abstract
:This work presents an analysis of fire events recorded in Isla Salamanca Natural Park and their impact on the air quality in the district of Barranquilla, with an emphasis on 2020 due to the increase in the number of ha burned by forest fires that year. The analysis was based on the data provided by the environmental authority for 2015–2020. The average number of ha burned in 2020 was 50% (events recorded since 2015), with a total area of fires corresponding to 256.9 ha, which is of concern considering the ecological importance of the park and its proximity to the district of Barranquilla, Colombia. The study evaluated the spatial–temporal distributions of forest fires and their possible direct effects on air quality. For 2020, it was found that the maximum hourly measurements of the Tres Ave Marias station for particulate matter less than 2.5 (135.013 µg/m3) corresponded to the recorded event that occurred in June 2020, whereas those of the Móvil station for PM10 (263.98 µg/m3) and PM2.5 (278.7 µg/m3) corresponded to the events of 28 June 2020, and 9 August 2020. These concentrations were higher than the standard values of the average maximum limits for 24 h established in the current Colombian regulations, and both events coincided with fire events reported by the environmental authorities, where a total of 249 ha of Isla Salamanca Natural Park were burned. These things considered, it was evident that the Policía station had the highest concentrations of pollutants on average.
Keywords:
wildfires; Colombia; Barranquilla; Isla Salamanca Natural Park; air quality; fire season; hotspot; area burned1. Introduction
Air pollution is an environmental problem that must be addressed worldwide [1]. The main harmful pollutants to human health and well-being are considered as the following: particulate matter (PM) less than 10 microns (PM10) and PM less than 2.5 microns (PM2.5), nitrogen dioxide (NO2), sulfur dioxide (SO2), ozone (O3), and carbon monoxide (CO) [2,3,4,5].
The World Health Organization (WHO) showed in 2016 that air pollution had caused 4.2 million premature deaths per year in cities and in rural areas of low- and middle-income countries and that these deaths were due to exposure to PM2.5 [6]. World health statistics 2022 affirms that 99% of the world population breathes unhealthy levels of PM and NO2, and people in low- and middle-income countries are exposed to air pollution at levels exceeding WHO air quality limits [7]. Various studies indicate that PM generates a negative impact on human health [8,9] due to exposure to fine particles which increases the risk of cardiovascular, cerebrovascular, and respiratory complications [10,11,12,13,14,15], and further, that NO2 is associated with respiratory diseases (e.g., asthma) [16].
Forest fires produce a variety of compounds such as carbon monoxide, nitrogen oxides, particulate matter, hydrocarbons, and other organic compounds [4,5] which are present in smoke caused by intentional burning and agricultural activities, and are considered a severe problem in many regions, especially in developing countries [17,18]. Biomass burning generates a mixture of PM10 and PM2.5 and other compounds (NOX and VOCs) [19]. Biomass burning in South America represents 30% of the total overall contribution [20,21]. This is a pollution source related to the events of burning in the Amazon region in particular [22], and those that have occurred in the savannah of northern South America, with substantial contributions to pollution levels in the tropical Northern Hemisphere [21,23]. Air masses with pollutants from biomass burning can be transported long distances, affecting air quality in urban areas that are broadly influenced by local anthropogenic activities [24]. Nevertheless, this long-range transport can cause high levels of pollutants in urban areas [24,25,26], as in the case of the observations at a station in Venezuela, where smoke layers were transported from the Andes towards the Pacific Ocean to the Galapagos Islands [22], with the consequence of health risks for populations distant from the source of pollution [27,28]. Some authors evaluated the influence of long-term transport of smoke aerosols and their impact on air quality in the state of New York, United States, recording an increase in average concentrations of PM2.5 which exceeded the permissible limits after a fire event [25]. Therefore, studies related to biomass burning have stated that PM is the pollutant that is most harmful to public health [24,29], and the impact of long-range transport PM2.5 from forest fires has been associated with hospital admissions and cardiovascular mortality [30]; further, research indicates that vulnerable populations (children, the disabled, or the elderly, etc.) are the most affected from fire exposure [31].
Large pollution events due to biomass burning are expected to be more recurrent as climate change progresses, owing to high greenhouse gas concentrations [31,32,33,34]. Previous studies have shown that under the scenarios of climate change, the frequency and intensity of air pollution would rise with increases in PM2.5 concentrations [26]. However, the intensity of some forest fires has anthropogenic causes due to human direct or indirect disturbance to fire regimes as a result of changes in land use, agricultural expansion, deforestation, use of resources, and waste management [21,32,35,36], which increases for communities located at the wildland–urban interface [32].
In Latin America, in 2019, approximately six million hectares were burned in Bolivia, Brazil, Colombia, Paraguay, and Peru, in regions mostly located within protected areas of native vegetation [32,37], and in 2020, other episodes of wildfire in this area occurred during the dry season. The burn area patterns between 2000 and early 2021 show the following: forest fires in Bolivia were associated with the impact of extreme events and cover land loss; fires in the Brazilian savannah (Cerrado) in the dry season have increased in frequency and intensity, with a tendency for forest fires to occur every 2 or 3 years; wildfires in Paraguay have been linked with an increase in deforestation; forest fires in Mexico have been related to drought periods; and changes in land-cover and land-use and extreme drought events in central Chile accelerated large fires during 2016–2017 [32].
Northern Colombia belongs to the Caribbean Region, where the Isla Salamanca Natural Park is located, which is a protected area with three types of forest: mangrove (red, salty, and yellow mangrove), tropical dry, and riparian forest. The park was declared an Area of Importance for the Conservation of Birds (AICA), and together with the Sanctuary of Fauna and Flora of the Ciénaga Grande de Santa Marta, was declared a Ramsar site and a biosphere reserve by UNESCO [38]. Currently, the Isla Salamanca Natural Park is subject to recurrent forest fires due to the illegal extraction of resources by inhabitants of the park or its surroundings, who build wire fences to catch animals faster, commercialize them, and in this way, obtain income for their sustenance [39]. Despite these episodes of fires, there are few studies on their impact on air quality in the surrounding area, especially Barranquilla.
However, a recent investigation carried out in the district of Barranquilla evaluated the variations in the concentrations of PM10, PM2.5, and ozone O3 between the dry and rainy seasons and the contribution of local sources such as the burning of biomass through the Isla Salamanca Natural Park [40]. Moreover, another study carried out in Barranquilla identifies the contributions of marine sea spray, re-suspended soil, and vehicular traffic as the main sources of air pollution by particulate matter. Also, PM2.5 included two mixed sources were found to be fuel oil combustion with fertilizer industry emissions, and secondary aerosol sources with building construction emissions [41]. The impact of forest fires on air quality has been the subject of various investigations, and previous studies conducted by researchers who evaluated the contribution of forest fires to fine particles during burning episodes, and how these emissions affect health and contribute to the climate change [42,43], the latter since fine particles have an important impact on the climate and are responsible for a positive radiative formation [44,45,46]. A study in the Colombian Caribbean for the period 2003–2015 concluded that the burned area and fire emissions will be increased as result of land-cover change in the region [47]. On the other hands, the average contribution of biomass burning to PM2.5 was of 20–30% for Soledad and Malambo located in the Colombian Caribbean [48]. Also, the contribution of a biomass burning episode by 2020 in Colombian Caribbean region (La Guajira department) was 52% above the daily average to PM10, and on 45% above the daily average to PM2.5 [49]. In Colombia during 2018 were evaluated the health impacts associated to biomass burning PM2.5, with about 52 mortality cases between related to cardiovascular affections and respiratory disease [50].
Barranquilla is characterized by being one of the cities that has had the most economic growth in the Colombian Caribbean, especially in relation to fertilizer factories; cement, iron ore, and steel industries; waste incineration; civil works projects; and increase vehicular traffic [41,51,52]. Therefore, emissions produced from these activities are added to those from forest fires, complicating the situation in terms of the impact on air quality and its consequent effect on public health of the population in general.
The objective of this study was to evaluate the dynamics of air pollutants in the district of Barranquilla, Colombia, during the most significant forest fire events in 2020 in the Isla Salamanca Natural Park and thus establish the frequency of incidents that reduce air quality.
2. Materials and Methods
2.1. Study Area
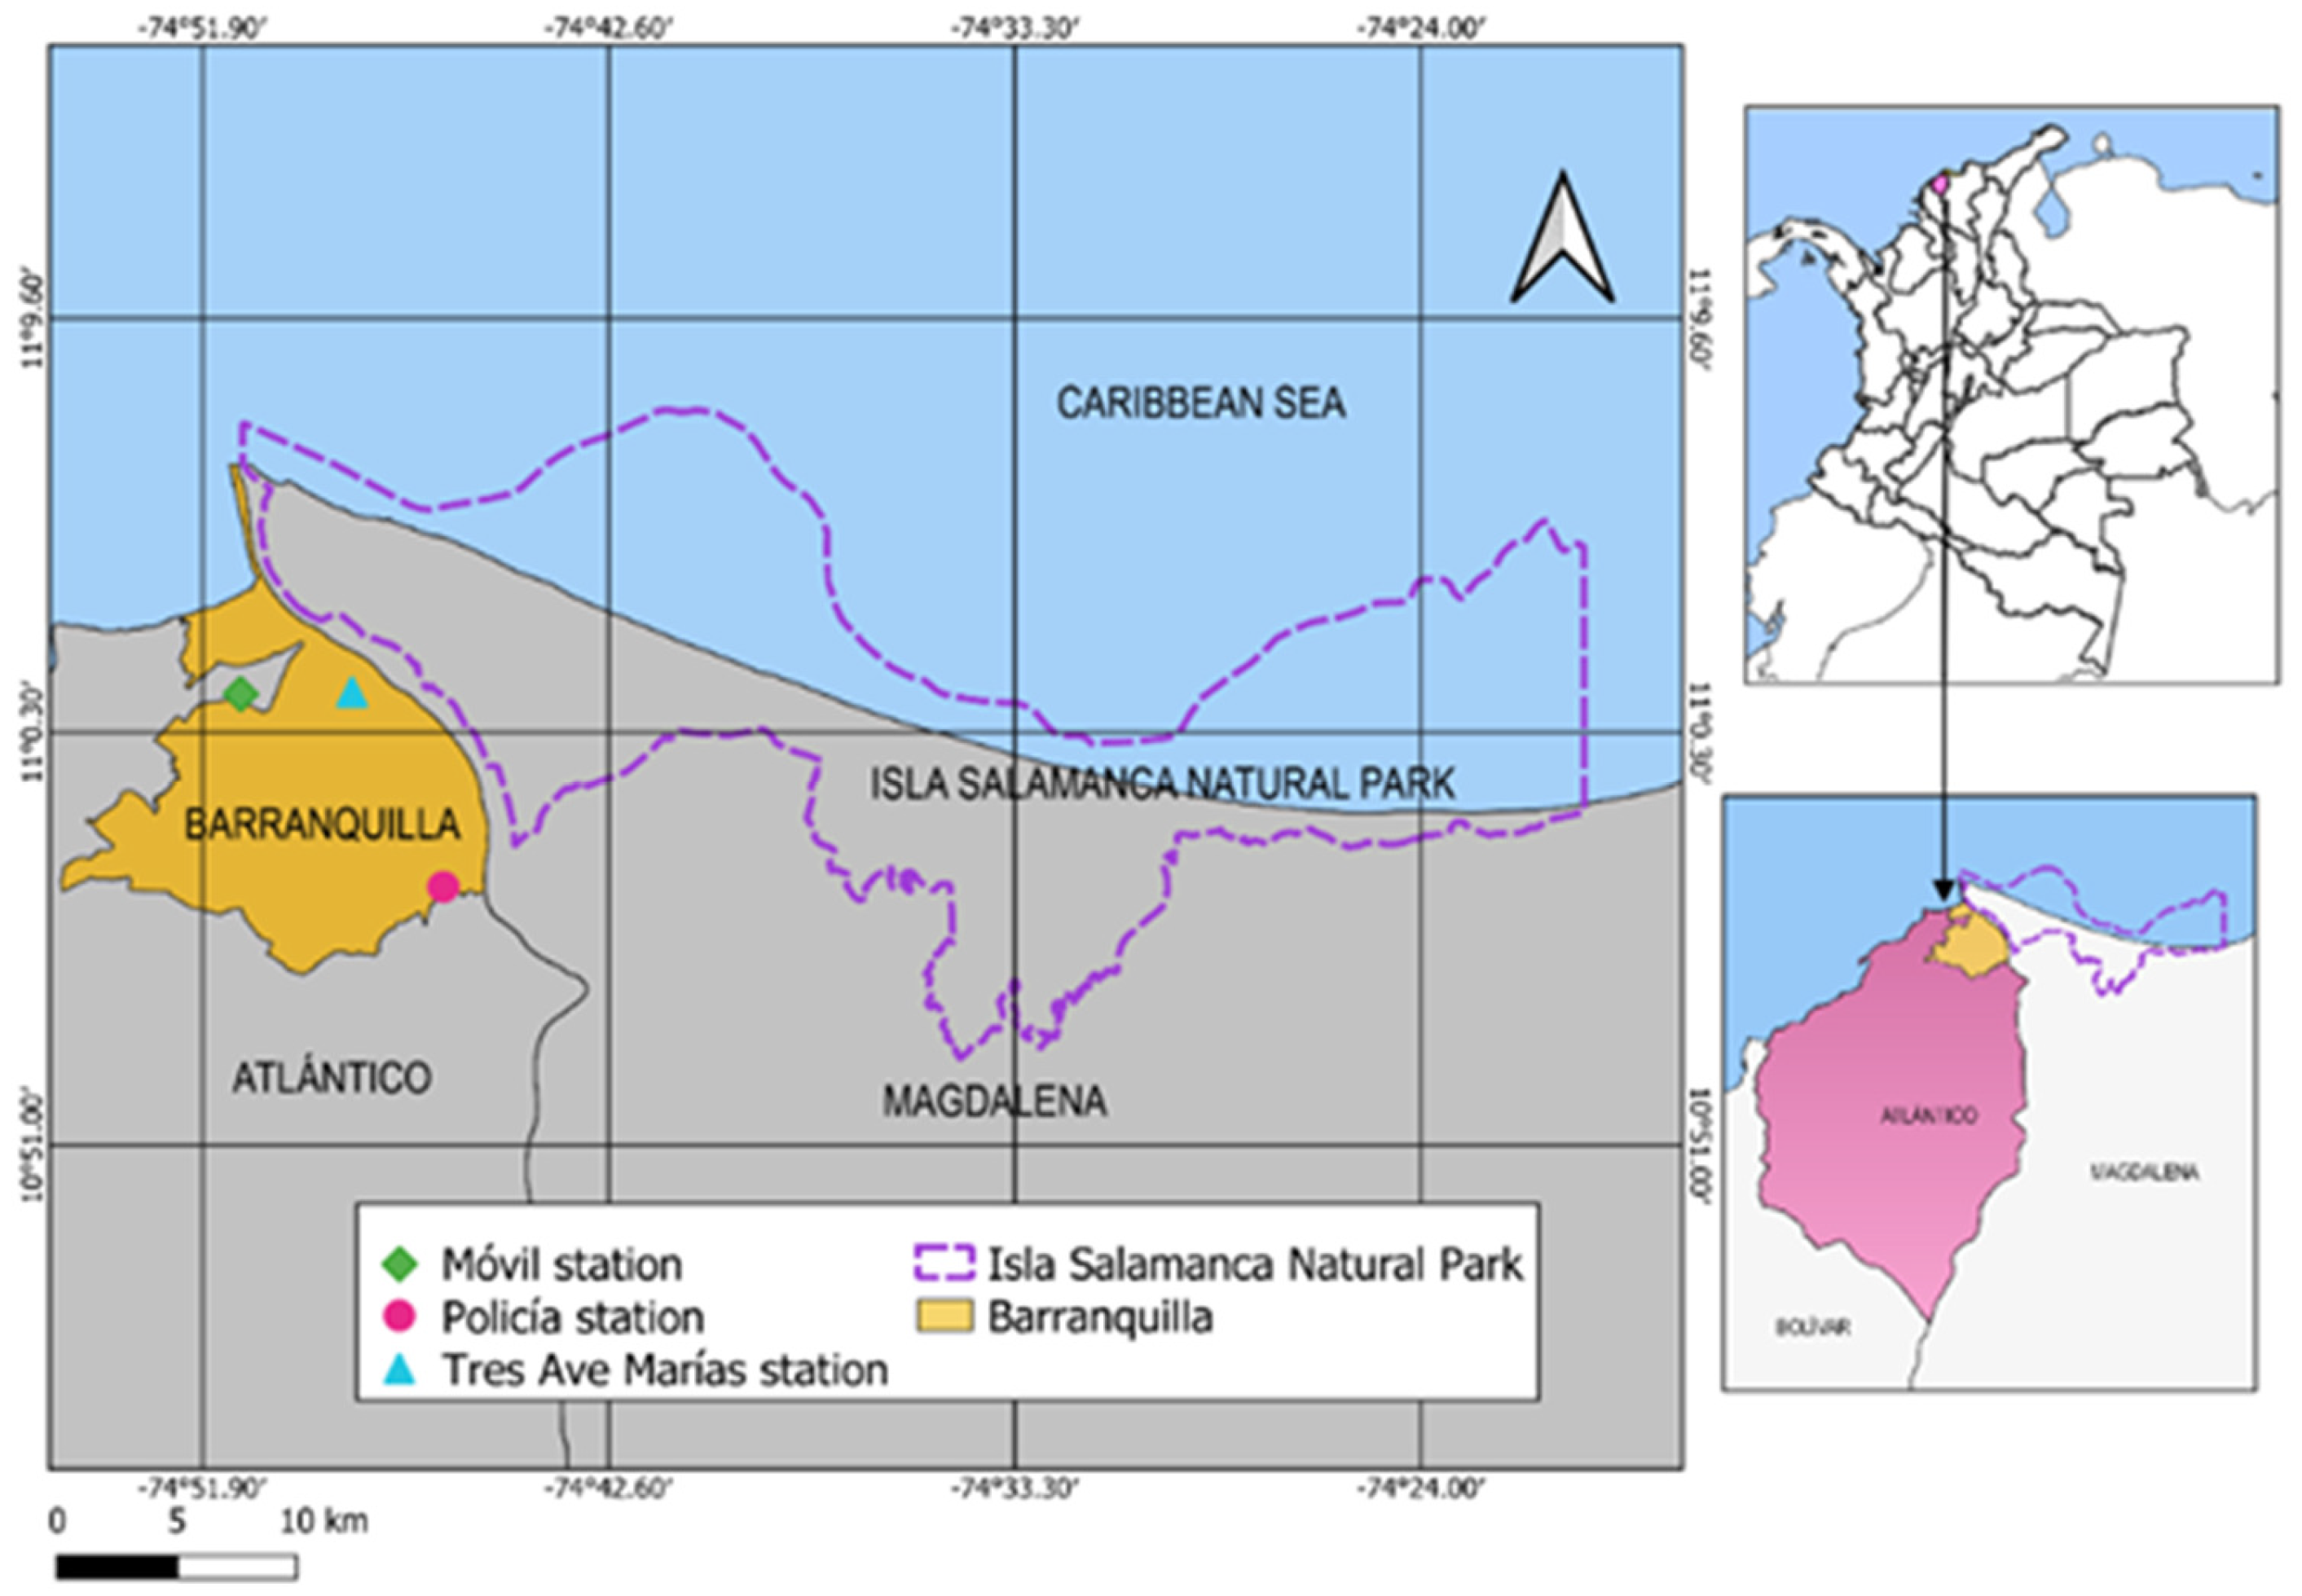
The district of Barranquilla is considered one of the most important cities in the Colombian Caribbean Region, with an estimated population of 1.2 million inhabitants, which represents 11% of the population of this region. It is located between the intersection of the Caribbean Sea shore and the Magdalena River in northern Colombia (Figure 1). The district has an area of approximately 166 km2 and accounts for 29% of the region’s GDP as a result of commercial, industrial, and port-related economic activities [53].
The region is characterized by two climatic seasons, namely, wet and dry. The wet season occurs between April and November, and the dry period occurs from December to March. The temperature oscillates between 23 °C and 31 °C, and its annual average relative humidity is 80%. Rain occurs from May to October with 70 to 178 mm/month; annually, the average duration of rainfall events is approximately 14 days [54].
Isla Salamanca Natural Park is located 40 km from of Barranquilla (10°56′ N and 74°27′ W), and its altitude varies between 0 and 6 m.a.s.l. It has a warm climate with temperatures that fluctuate between 28 °C and 30 °C, and it has an area of approximately 56,200 ha. Its main ecosystems are dry mangrove forest, semidry tropical forest, mixed forest, and thorn bush forest. The study area provides ecosystem services such as (i) Preserve samples of estuarine and marine ecosystem mosaics of the Ciénaga Grande de Santa Marta such as mangroves, coastal lagoons, dry forest, sub-xerophytic forest and sedimentary bottoms, as specialized habitats for hydrobiological resources, migratory, resident, endemic and/or fauna. in some degree of threat. (ii) Contribute to the generation, protection and maintenance of environmental goods and services such as fishing, recreation, collection and filtration of sediments and nutrient cycling, to support sustainable human development in the area of influence [38].
2.2. Air Quality and Meteorological Data
To analyze, the influence of fires on the air quality in the district of Barranquilla, the hourly concentrations of four criteria pollutants (PM10, PM2.5, CO, and O3), temperature (°C), relative humidity (%), wind direction, wind speed (m/s), and precipitation (mm) were obtained from three monitoring stations located in the area of interest, namely, Policía (10°58′55.89″ N, 74°47′17.73″ W), Tres Ave Marías (11°01′12.95″ N, 74°48′28.54″ W), and Móvil (11°01′09.61″ N, 74°51′01.61″ W). The three monitoring stations used Beta Gauge monitors for PM (model MP101M from Environment S.A.), Photometric UV monitors for O3 (model O342M from Environment S.A), and Non-dispersive Infrared Photometer for CO (model CO12M). Calibration and data validation are developed by EPA Barranquilla Verde, following USEPA method: EQPM-0404-151 for PM10, EQPM-1013-211 for PM2.5, EQOA 0206-148 for O3, and RFCA 0206-147 for CO [55]. The data were supplied by EPA Barranquilla Verde [56], the entity in charge of monitoring air quality data, and meteorological variables for the study area. It is important to mention that the Policía, Tres Ave Marías, and, Móvil stations have data for pollutants (PM10, PM2.5, O3, CO), since 1 January 2018 and for meteorological data since 1 January 2019, for which an adjustment of the study periods was made, according to the availability of data [40,57]. The 95% confidence interval of measured concentration of each pollutant was estimated as the statistic given by a Student’s t-distribution with n−1 degrees of freedom, which considers the sample size, the sample mean, the expected mean value, and the sample standard deviation [58,59,60].
The records of fire events were extracted from the database of National Natural Parks of Colombia [61]. Episodes of forest fires in Isla Salamanca Natural Park have been frequent in recent years. Between 2017 and 2020, there were approximately 24 fires that burned an average of 389.64 ha of cattails, mangroves, and semidry forest. In 2020, there were multiple severe episodes that were characterized by being the most frequent and intense fires that have occurred: one fire started on May 6 and was active for 9 days, and then, on June 18, another fire occurred that lasted approximately 11 days, followed by an episode on August 8 that burned the greatest area of the park [61]. These records have led to states of alert due to the increase in concentrations of PM2.5 in the district of Barranquilla, as occurred during the June 18 event [62].
2.3. Processing and Statistical Analysis of the Data
To ensure homogeneity of the data, the multiple imputation method was applied to obtain the missing data using MICE package for R [63] (see Appendix A, Table A1 which shows percentage of missing data), and the daily average concentrations of atmospheric pollutants were calculated. It is important to specify that the imputation missing data affected mainly PM10 and PM2.5 values from the year 2020. In addition to the analysis of the spatiotemporal distribution was performed using the conditional probability function (CPF) and bivariate polar graphs for the concentrations of PM10 and PM2.5 of each of the monitoring stations to evaluate the behavior and dynamics of the pollutants in the study area using the Openair package [64] of the R statistical software [65].
To link the fire episodes with the concentrations of the pollutants, the exceedance index of normed values was applied during the burning period, to calculate the exceedance of the standards, the arithmetic mean is taken of concentrations measures by the stations of monitoring and these averages are compared with the maximum permissible level [66], according to Colombia environmental regulations (see Table 1).
To estimate the relationship between the concentrations of pollutants and the meteorological variables at the three monitoring stations, and the Spearman correlation coefficient was applied. These statistical analyses were performed using Rstudio software.
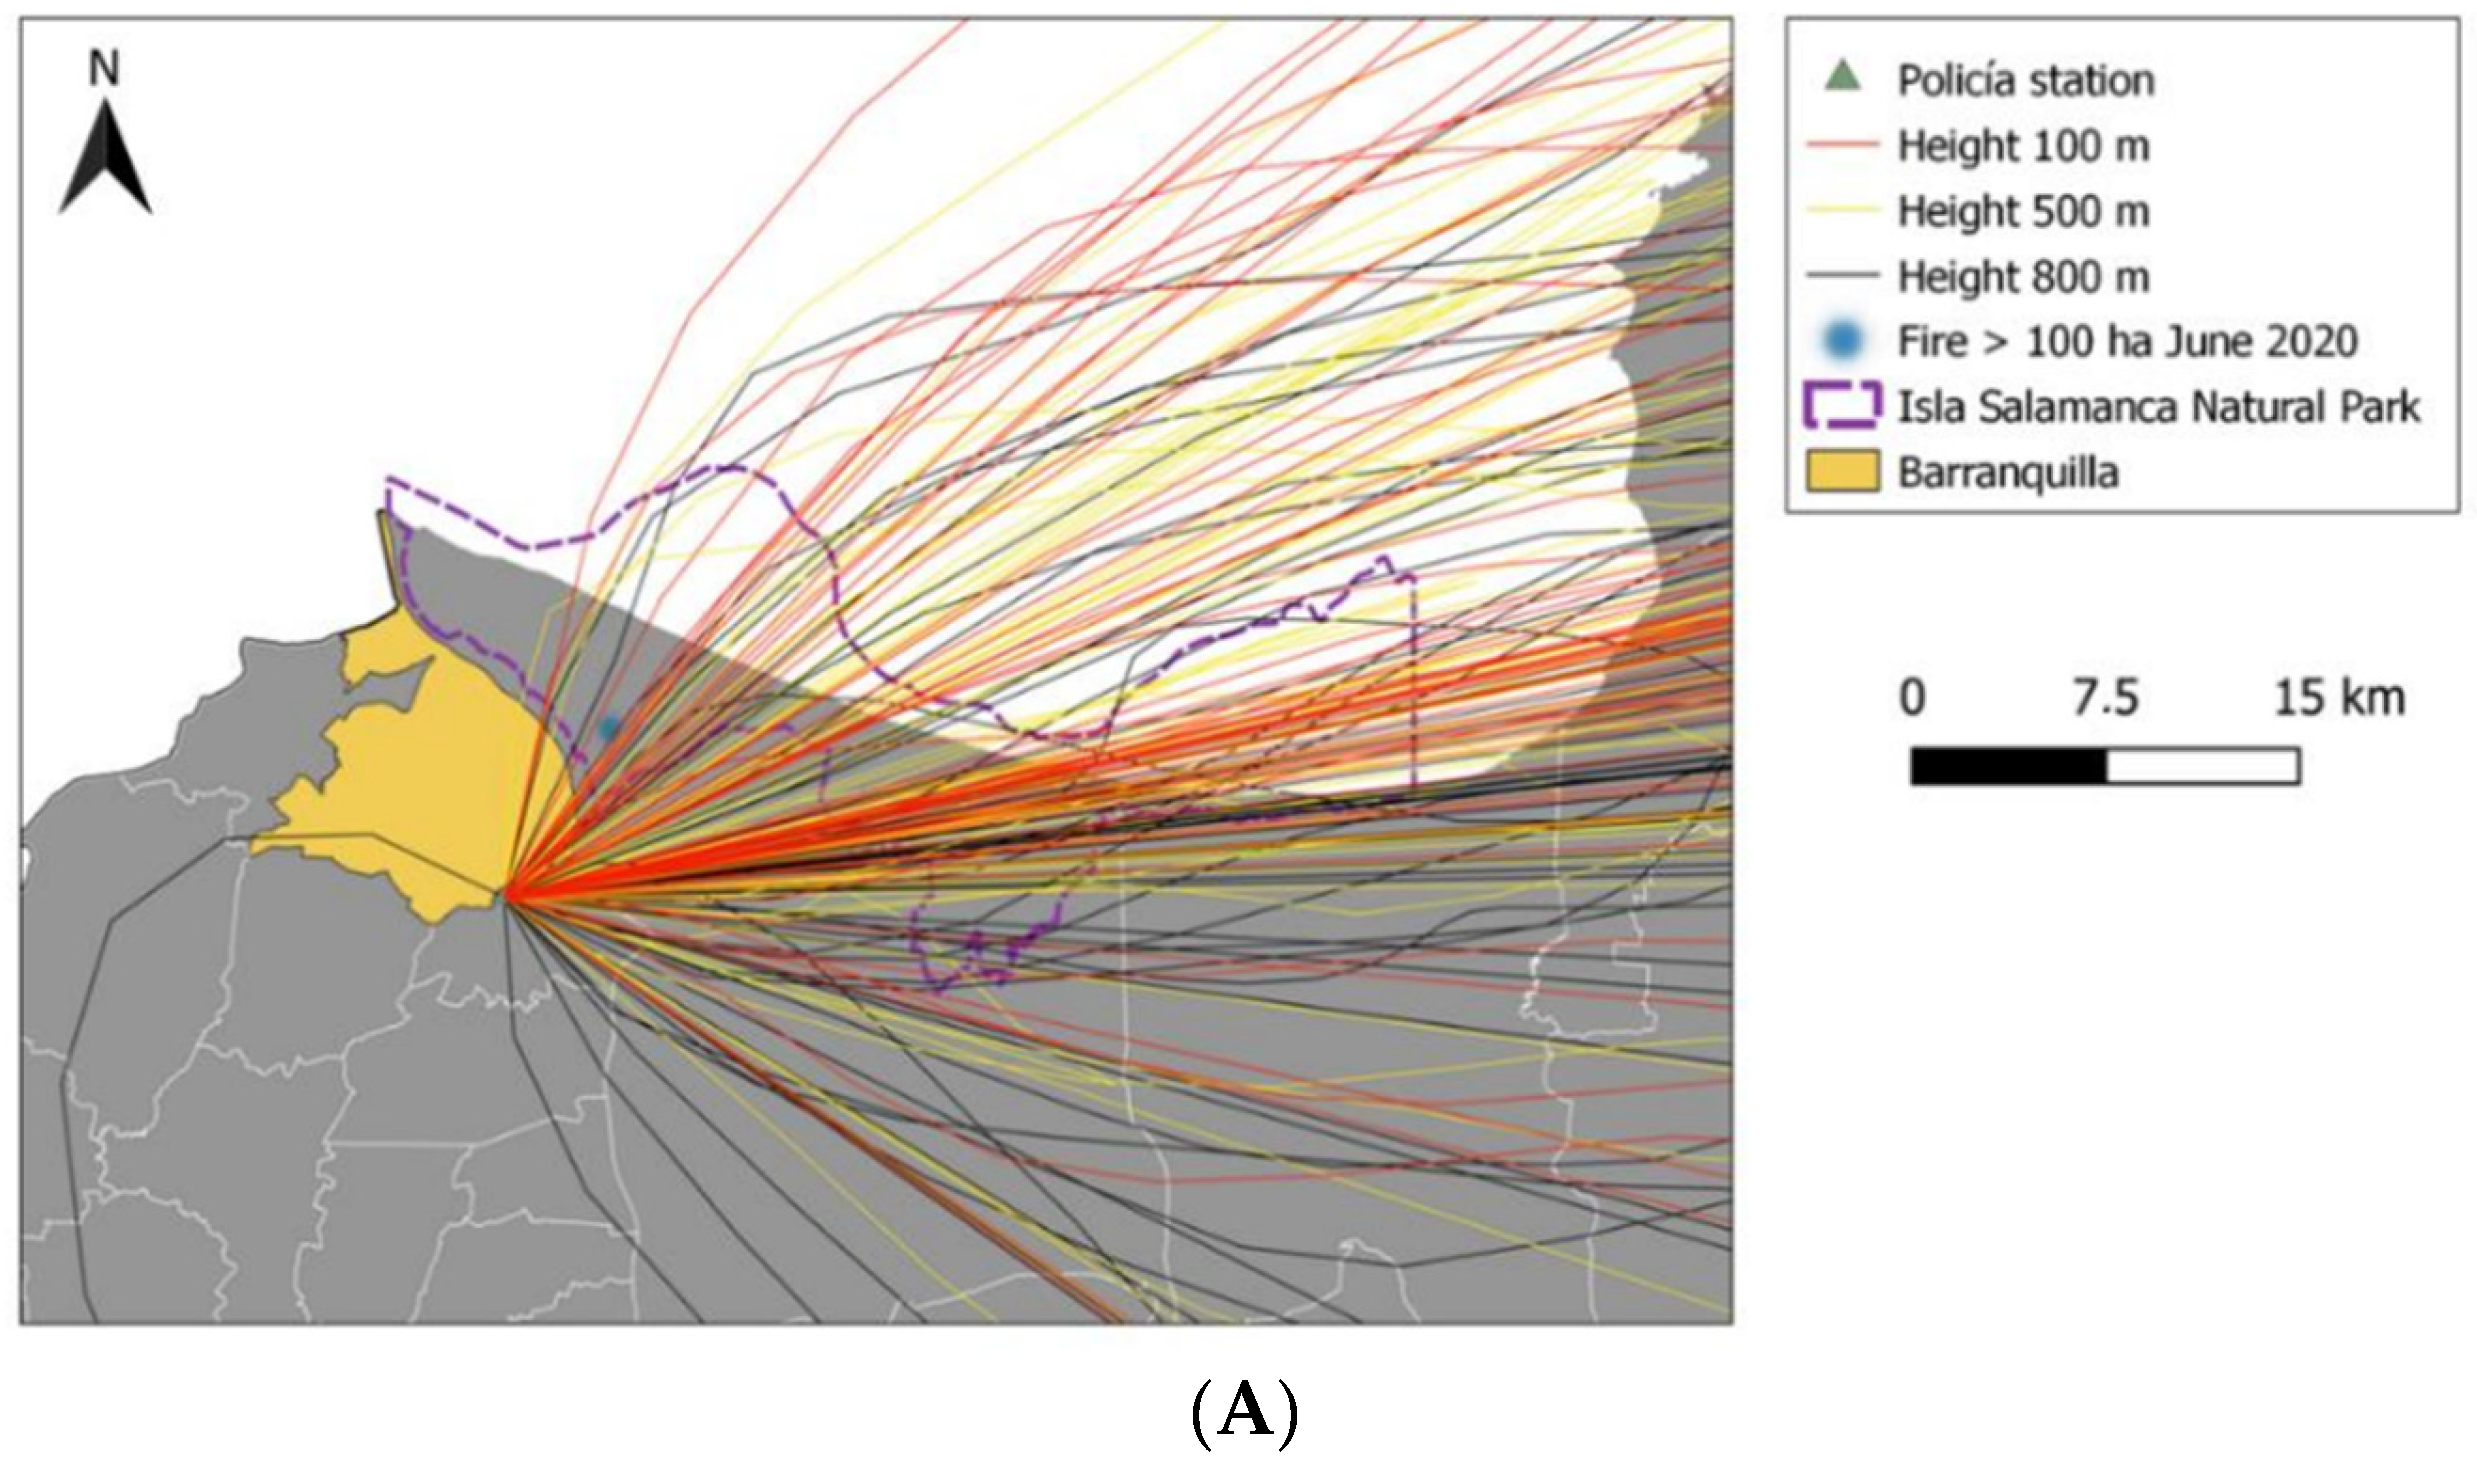
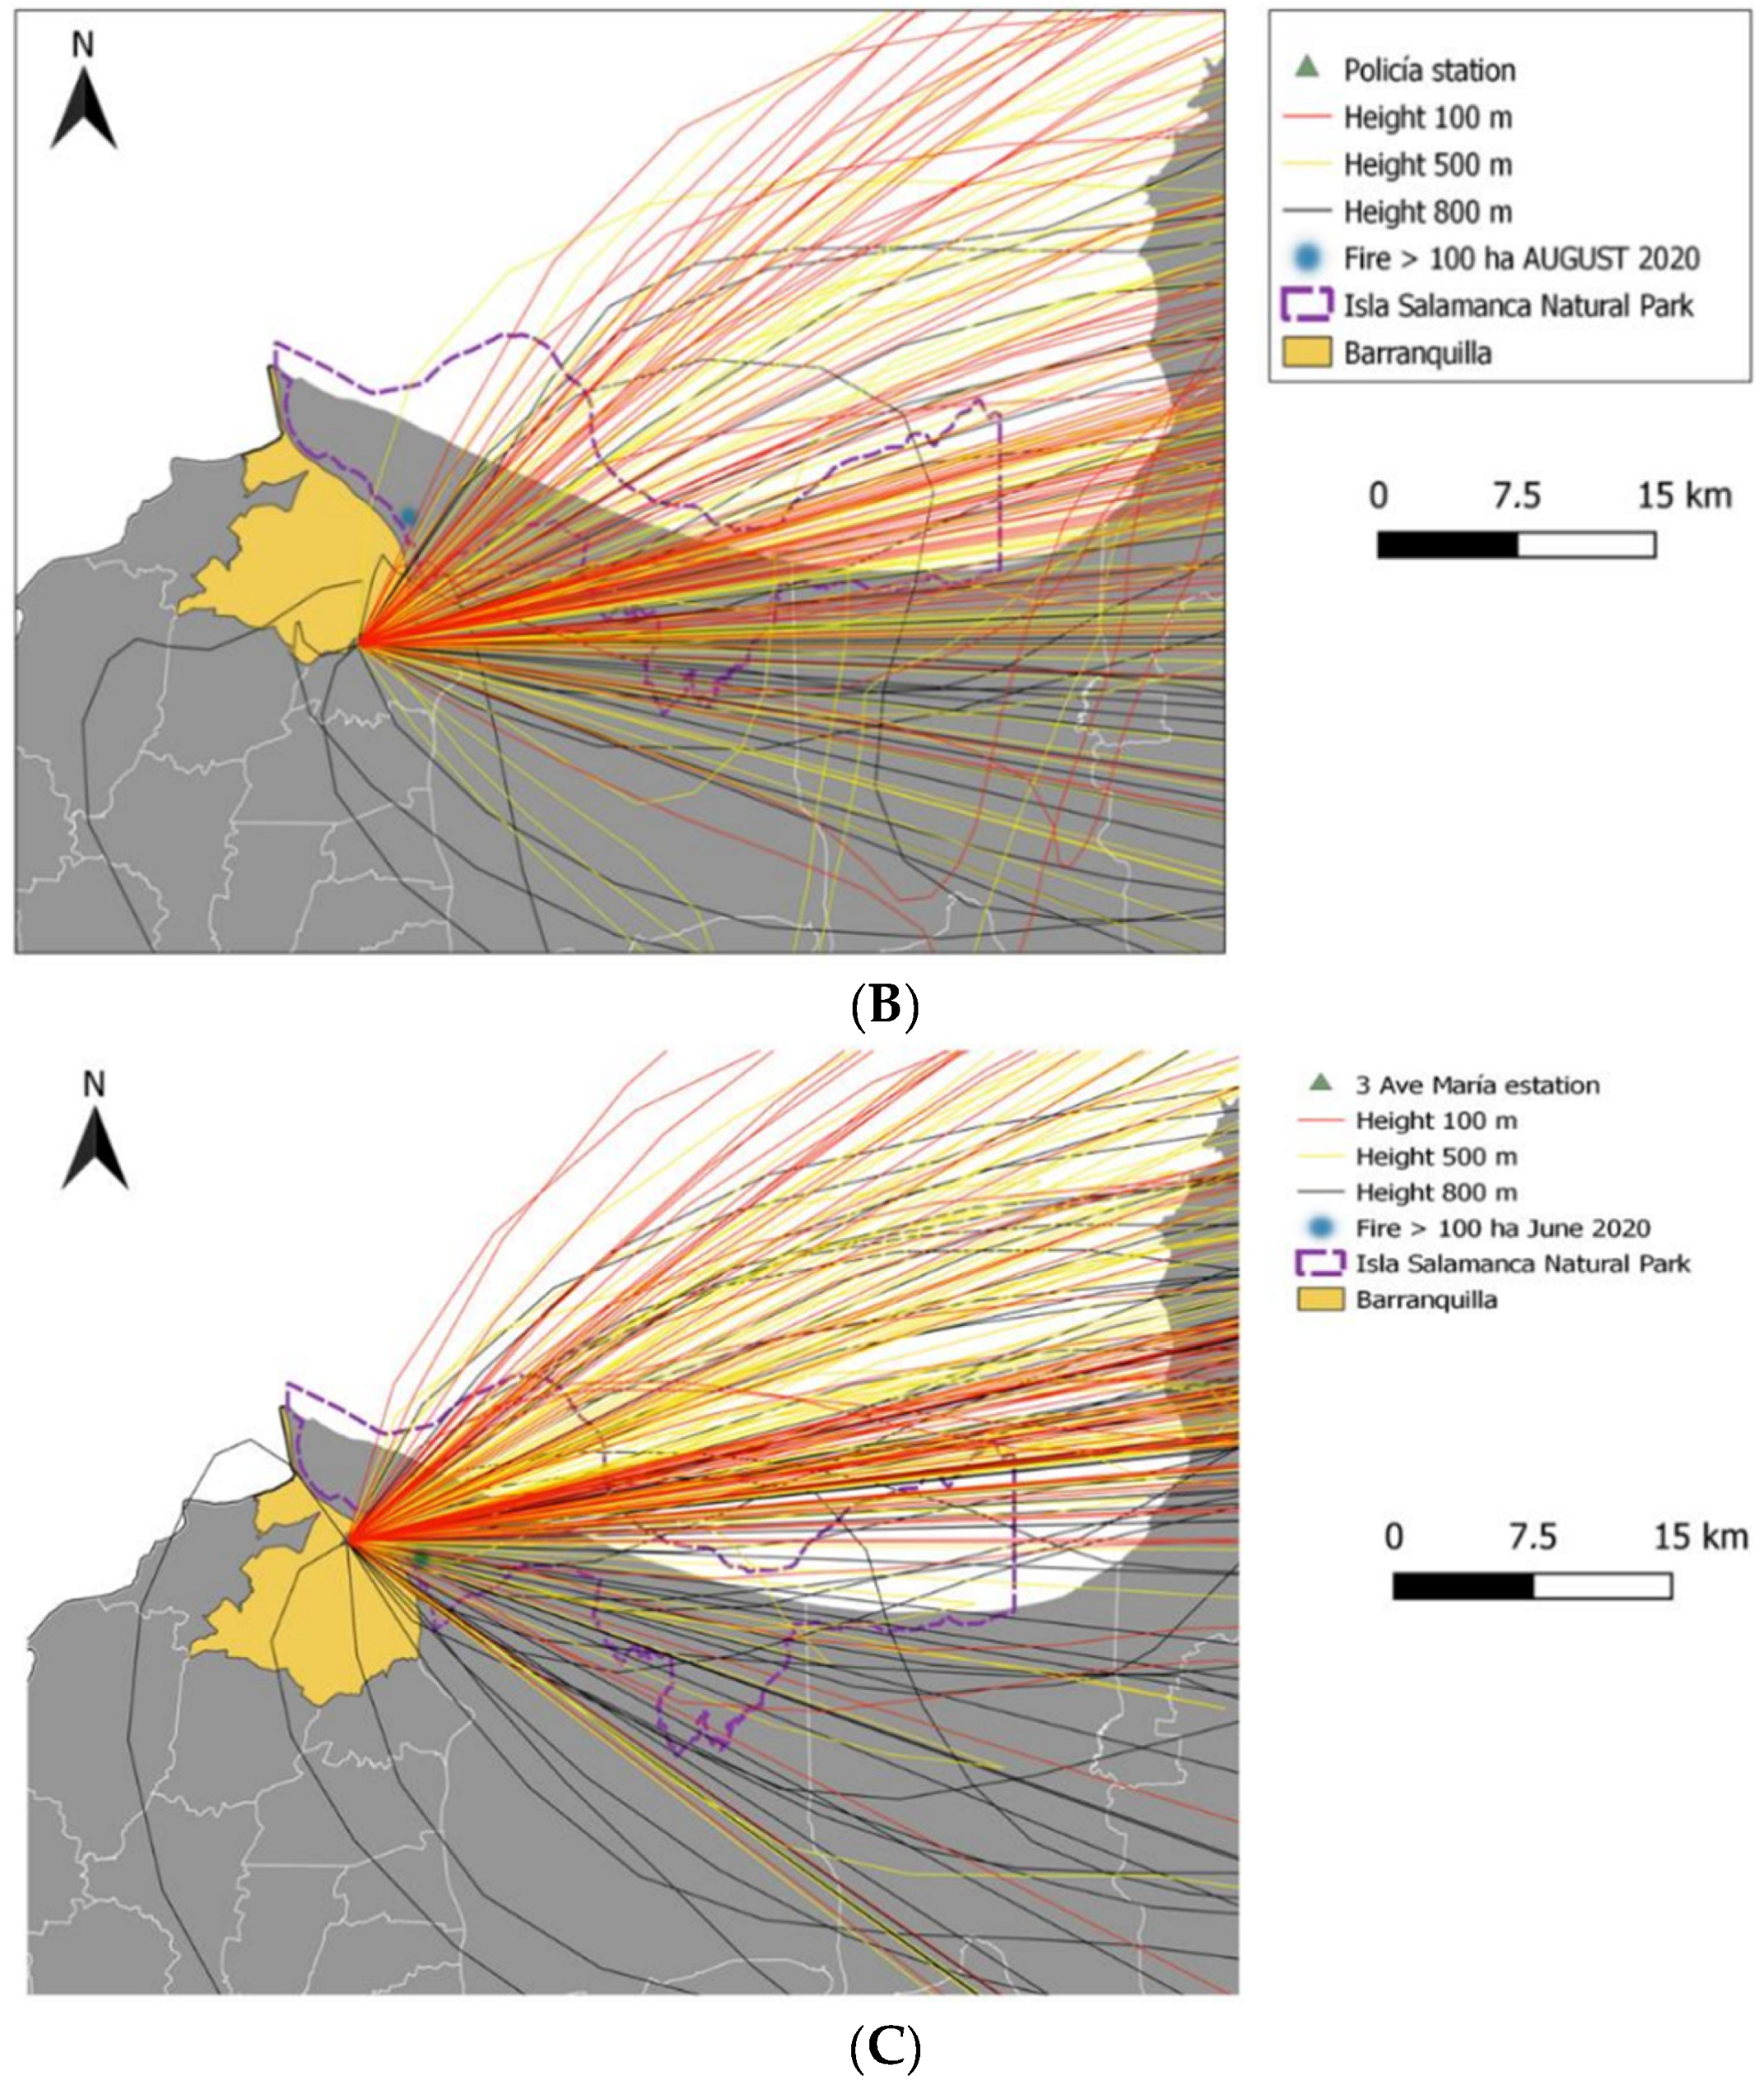
2.4. Backward during Wildfires
To perform the analysis of the back trajectory of particulate matter pollution sources per hour recorded by the stations for the June and August 2020 fire episodes, the Hysplit model was implemented, using the web version of the NOAA HYSPLIT trajectory model. This was achieved with meteorological reanalysis data from the Global Data Assimilation System (GDAS, https://www.ready.noaa.gov/HYSPLIT_traj.php, accessed on 13 September 2022) like has been done in other studies [67,68]. The parameters established for the calculation were: heights above ground level (agl) for the analysis 100 m, 500 m and 800 m; Total analysis time was the duration of the fire episodes; start time midnight and multiple backward trajectories were simulated starting every 2 h. Taking into account that the use of trajectory models during prolonged events can achieve better results than analyzing individual trajectories [69,70].
3. Results
3.1. Spatial-Temporal Distribution of Fires in Isla Salamanca Natural Park
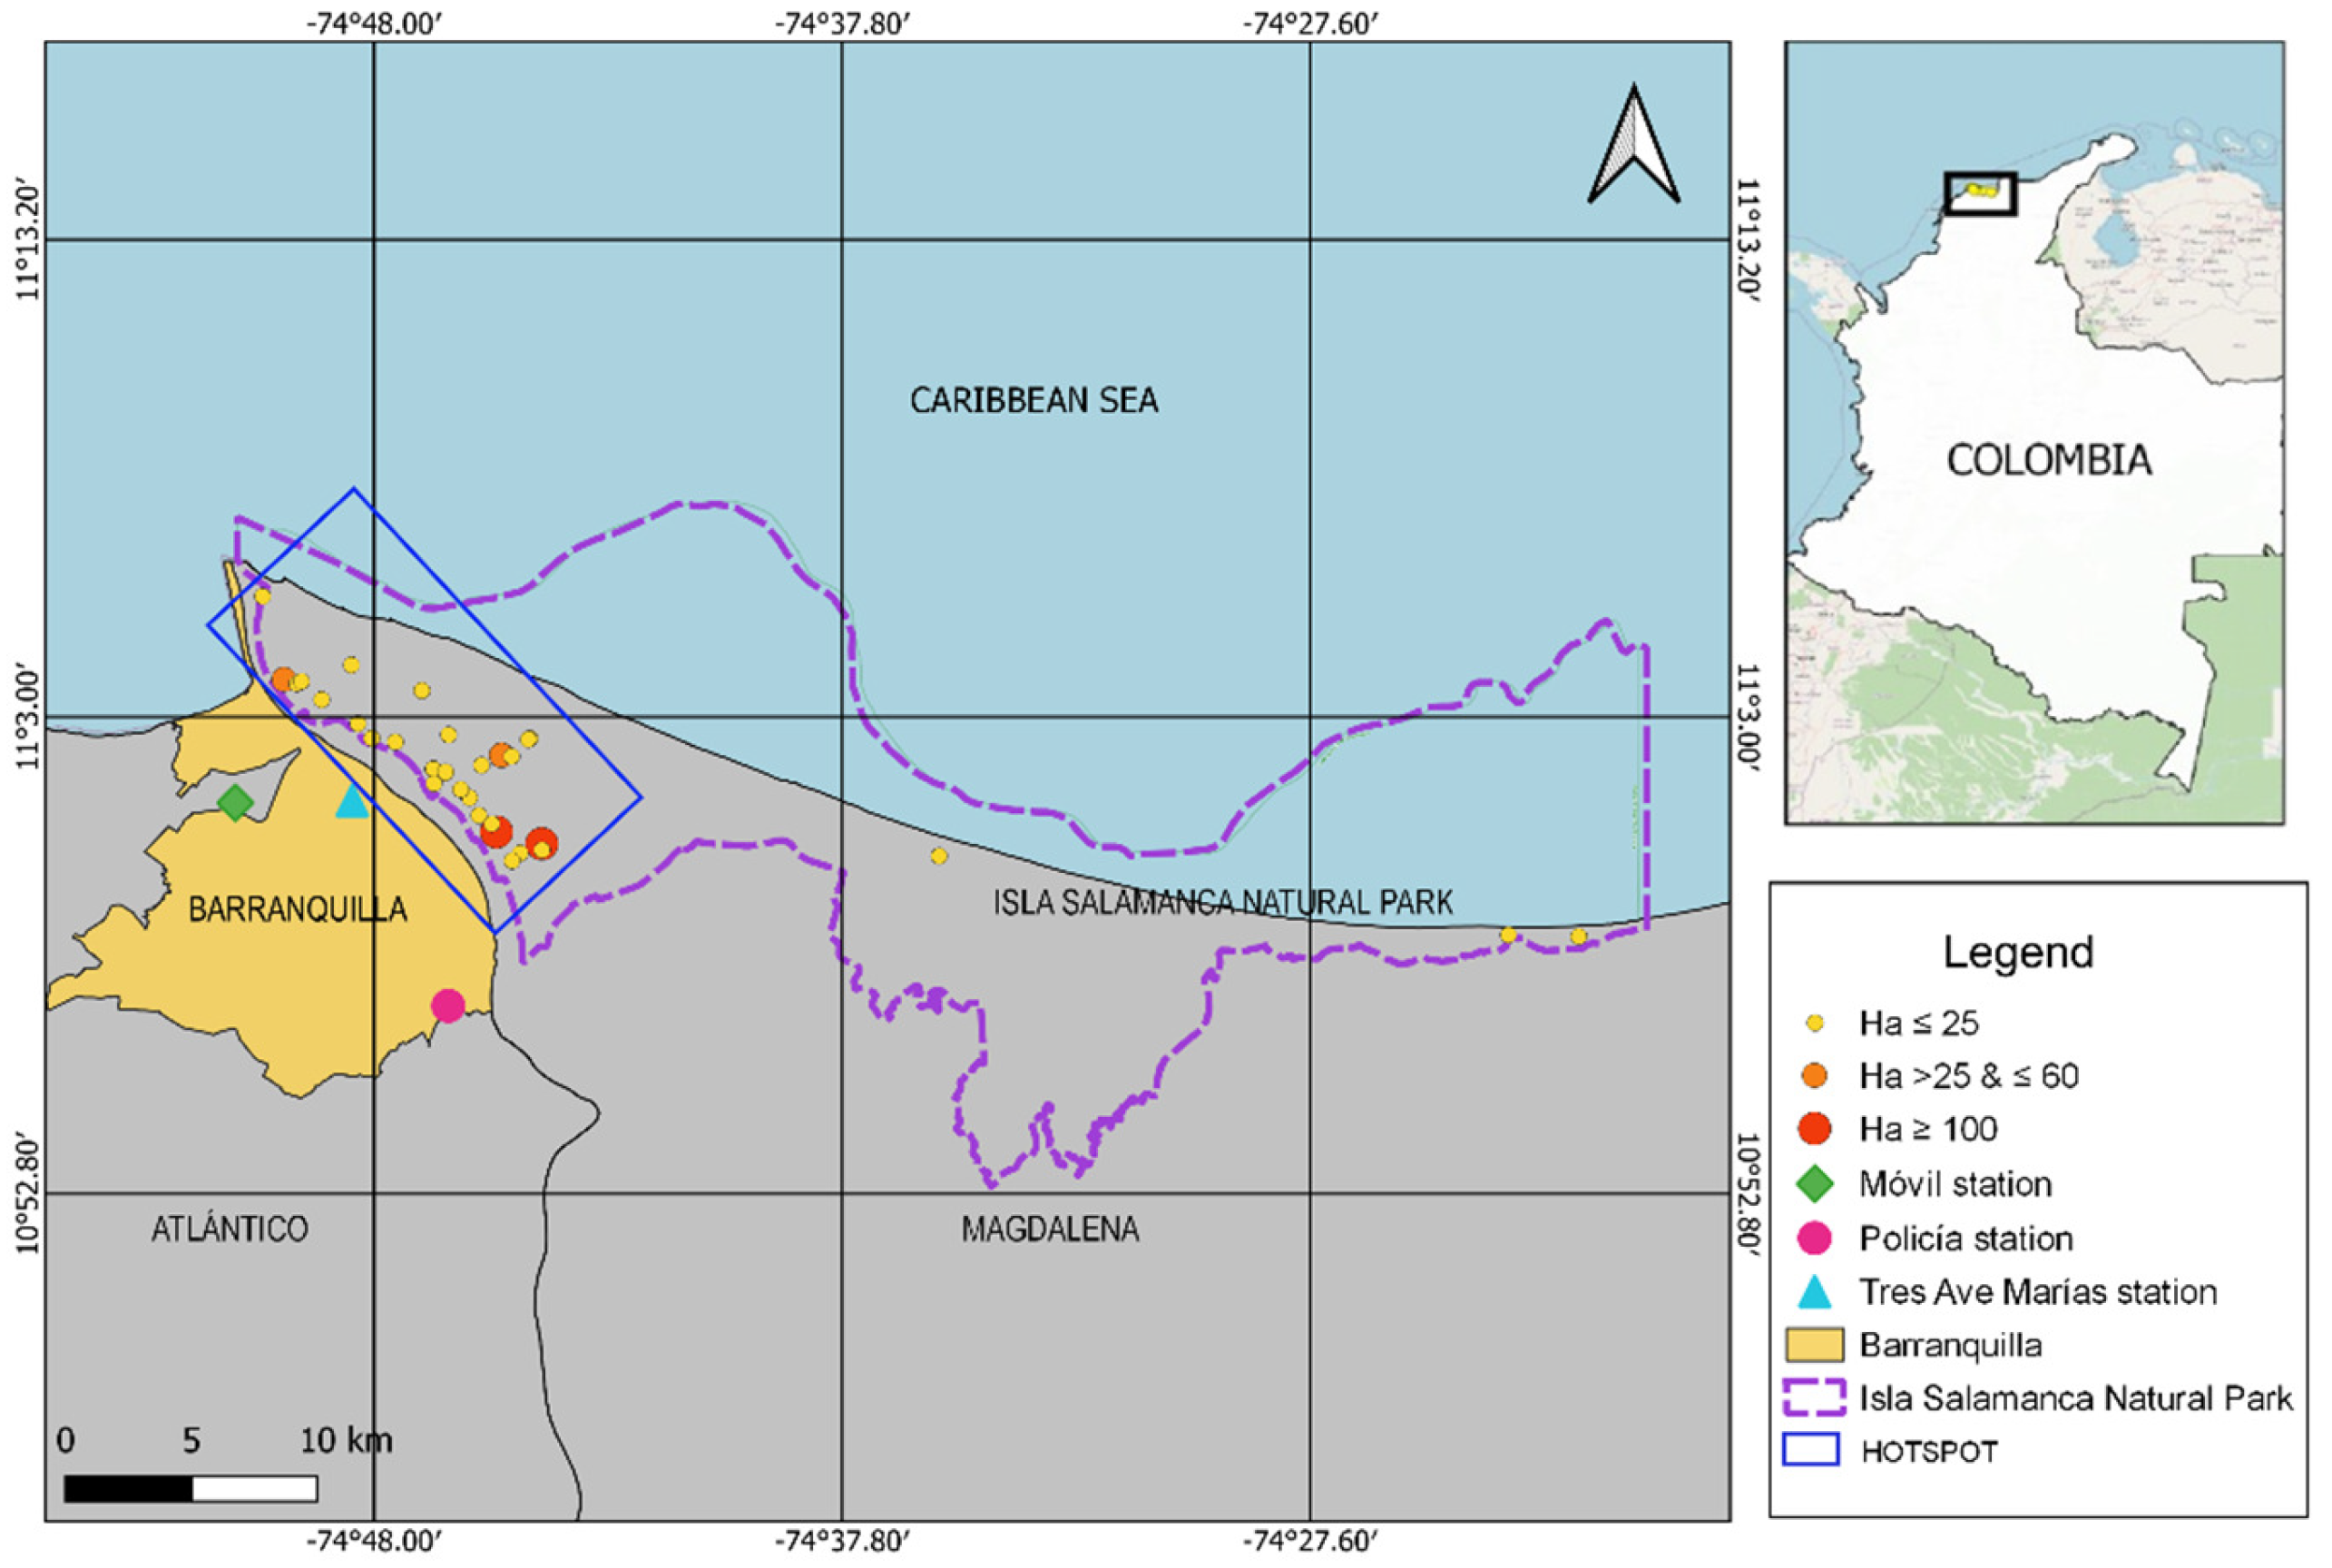
Based on the information provided by the National Parks, the entity in charge of monitoring fires in the area of interest, for 2015 to 2020, 35 forest fires were recorded, of which 46% were intentionally caused and 54% were attributed negligence. Additionally, in the annual fire data set, the largest number and total area of fires occurred in 2020 with a cumulative area of 256.9 ha burned (Table 2).
As shown in Figure 2, the fires were mostly concentrated in the western zone of Isla Salamanca Natural Park, located near the district of Barranquilla. The two largest fire episodes with an affected area greater than 100 ha occurred within the hotspot zone identified in the study due to the high incidence of fires. The Hotspot was obtained according to the number of fires, in the study the fire-prone areas were identified. A ‘fire-prone’ area is defined as a region with above-average fires during the study period [71,72].
3.2. Overview
Table 3 shows in terms of correlations between pollutants, the statistical analysis of the data showed a positive correlation between PM10 and PM2,5 (Rho = 0.67, p = <0.001) at all stations. For CO and O3, a significant and negative correlation was observed at the Móvil (Rho = −0.53, p = <0.0001) and Policía (Rho = −0.25, p = <0.0001) stations. On the other hand, O3 had a significant and negative correlation with the PM at the Móvil station; this station also presented the highest values of O3. The data were analyzed for the period from 2019 to 2020.
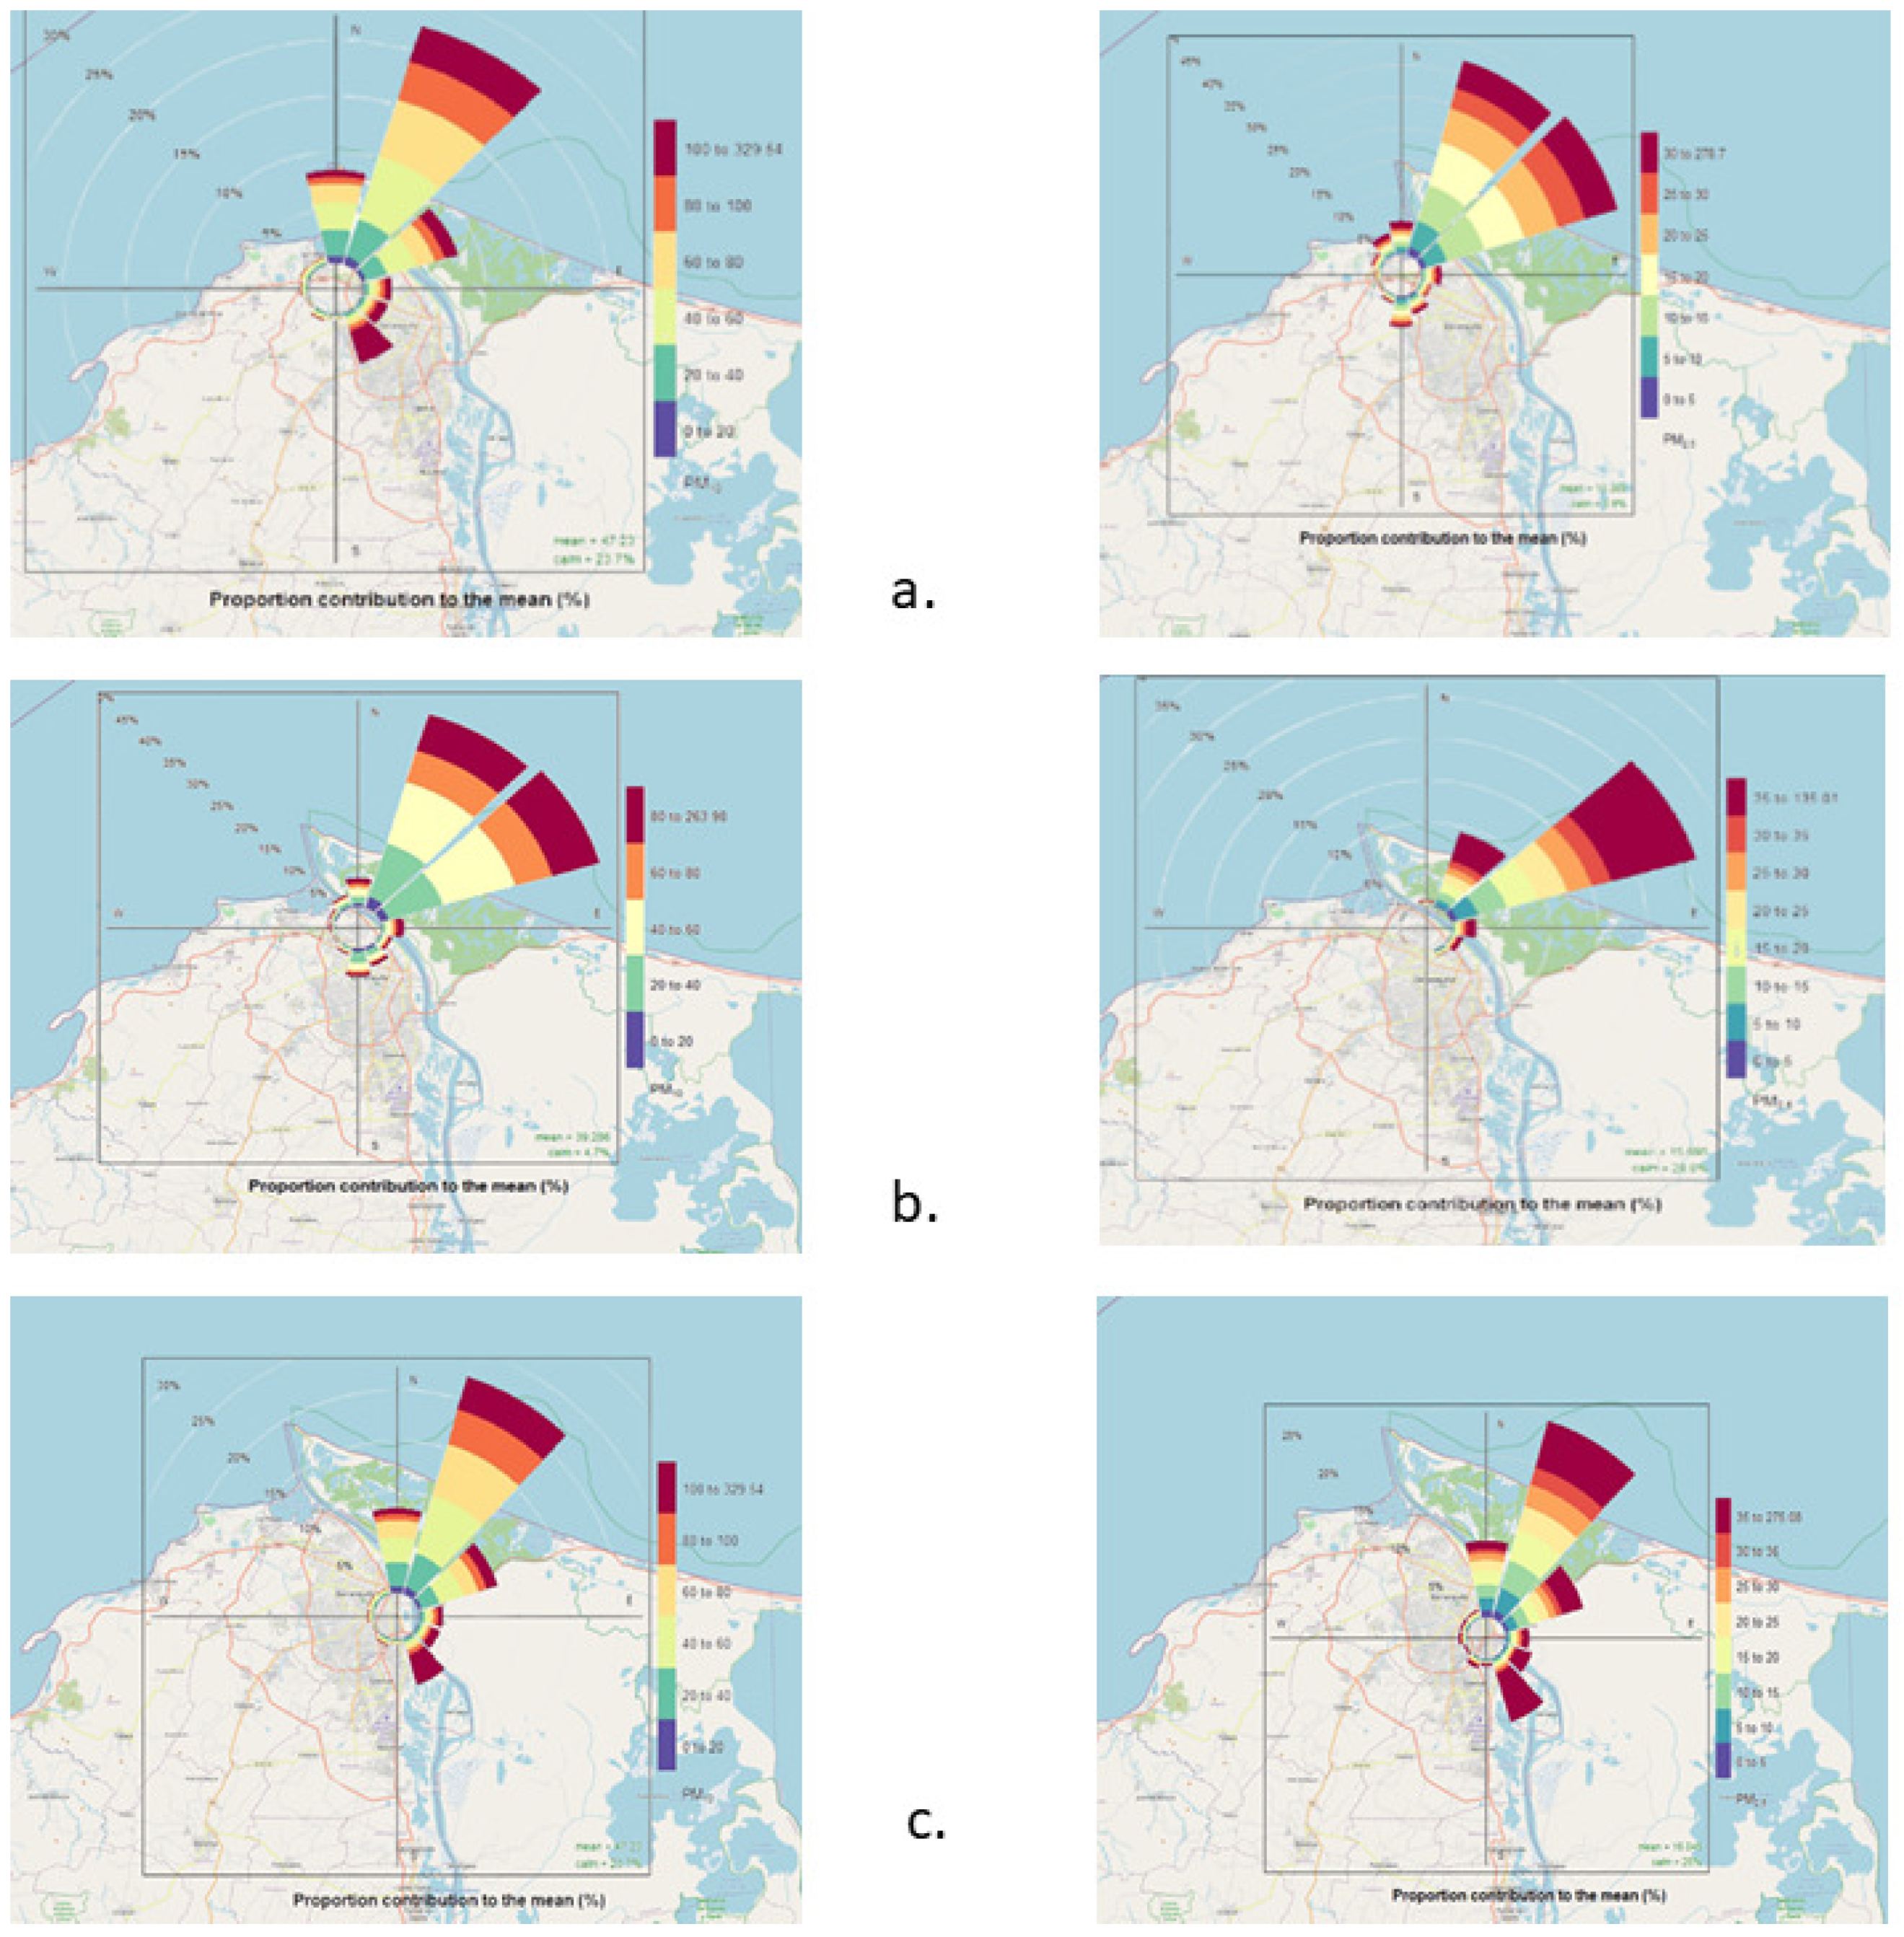
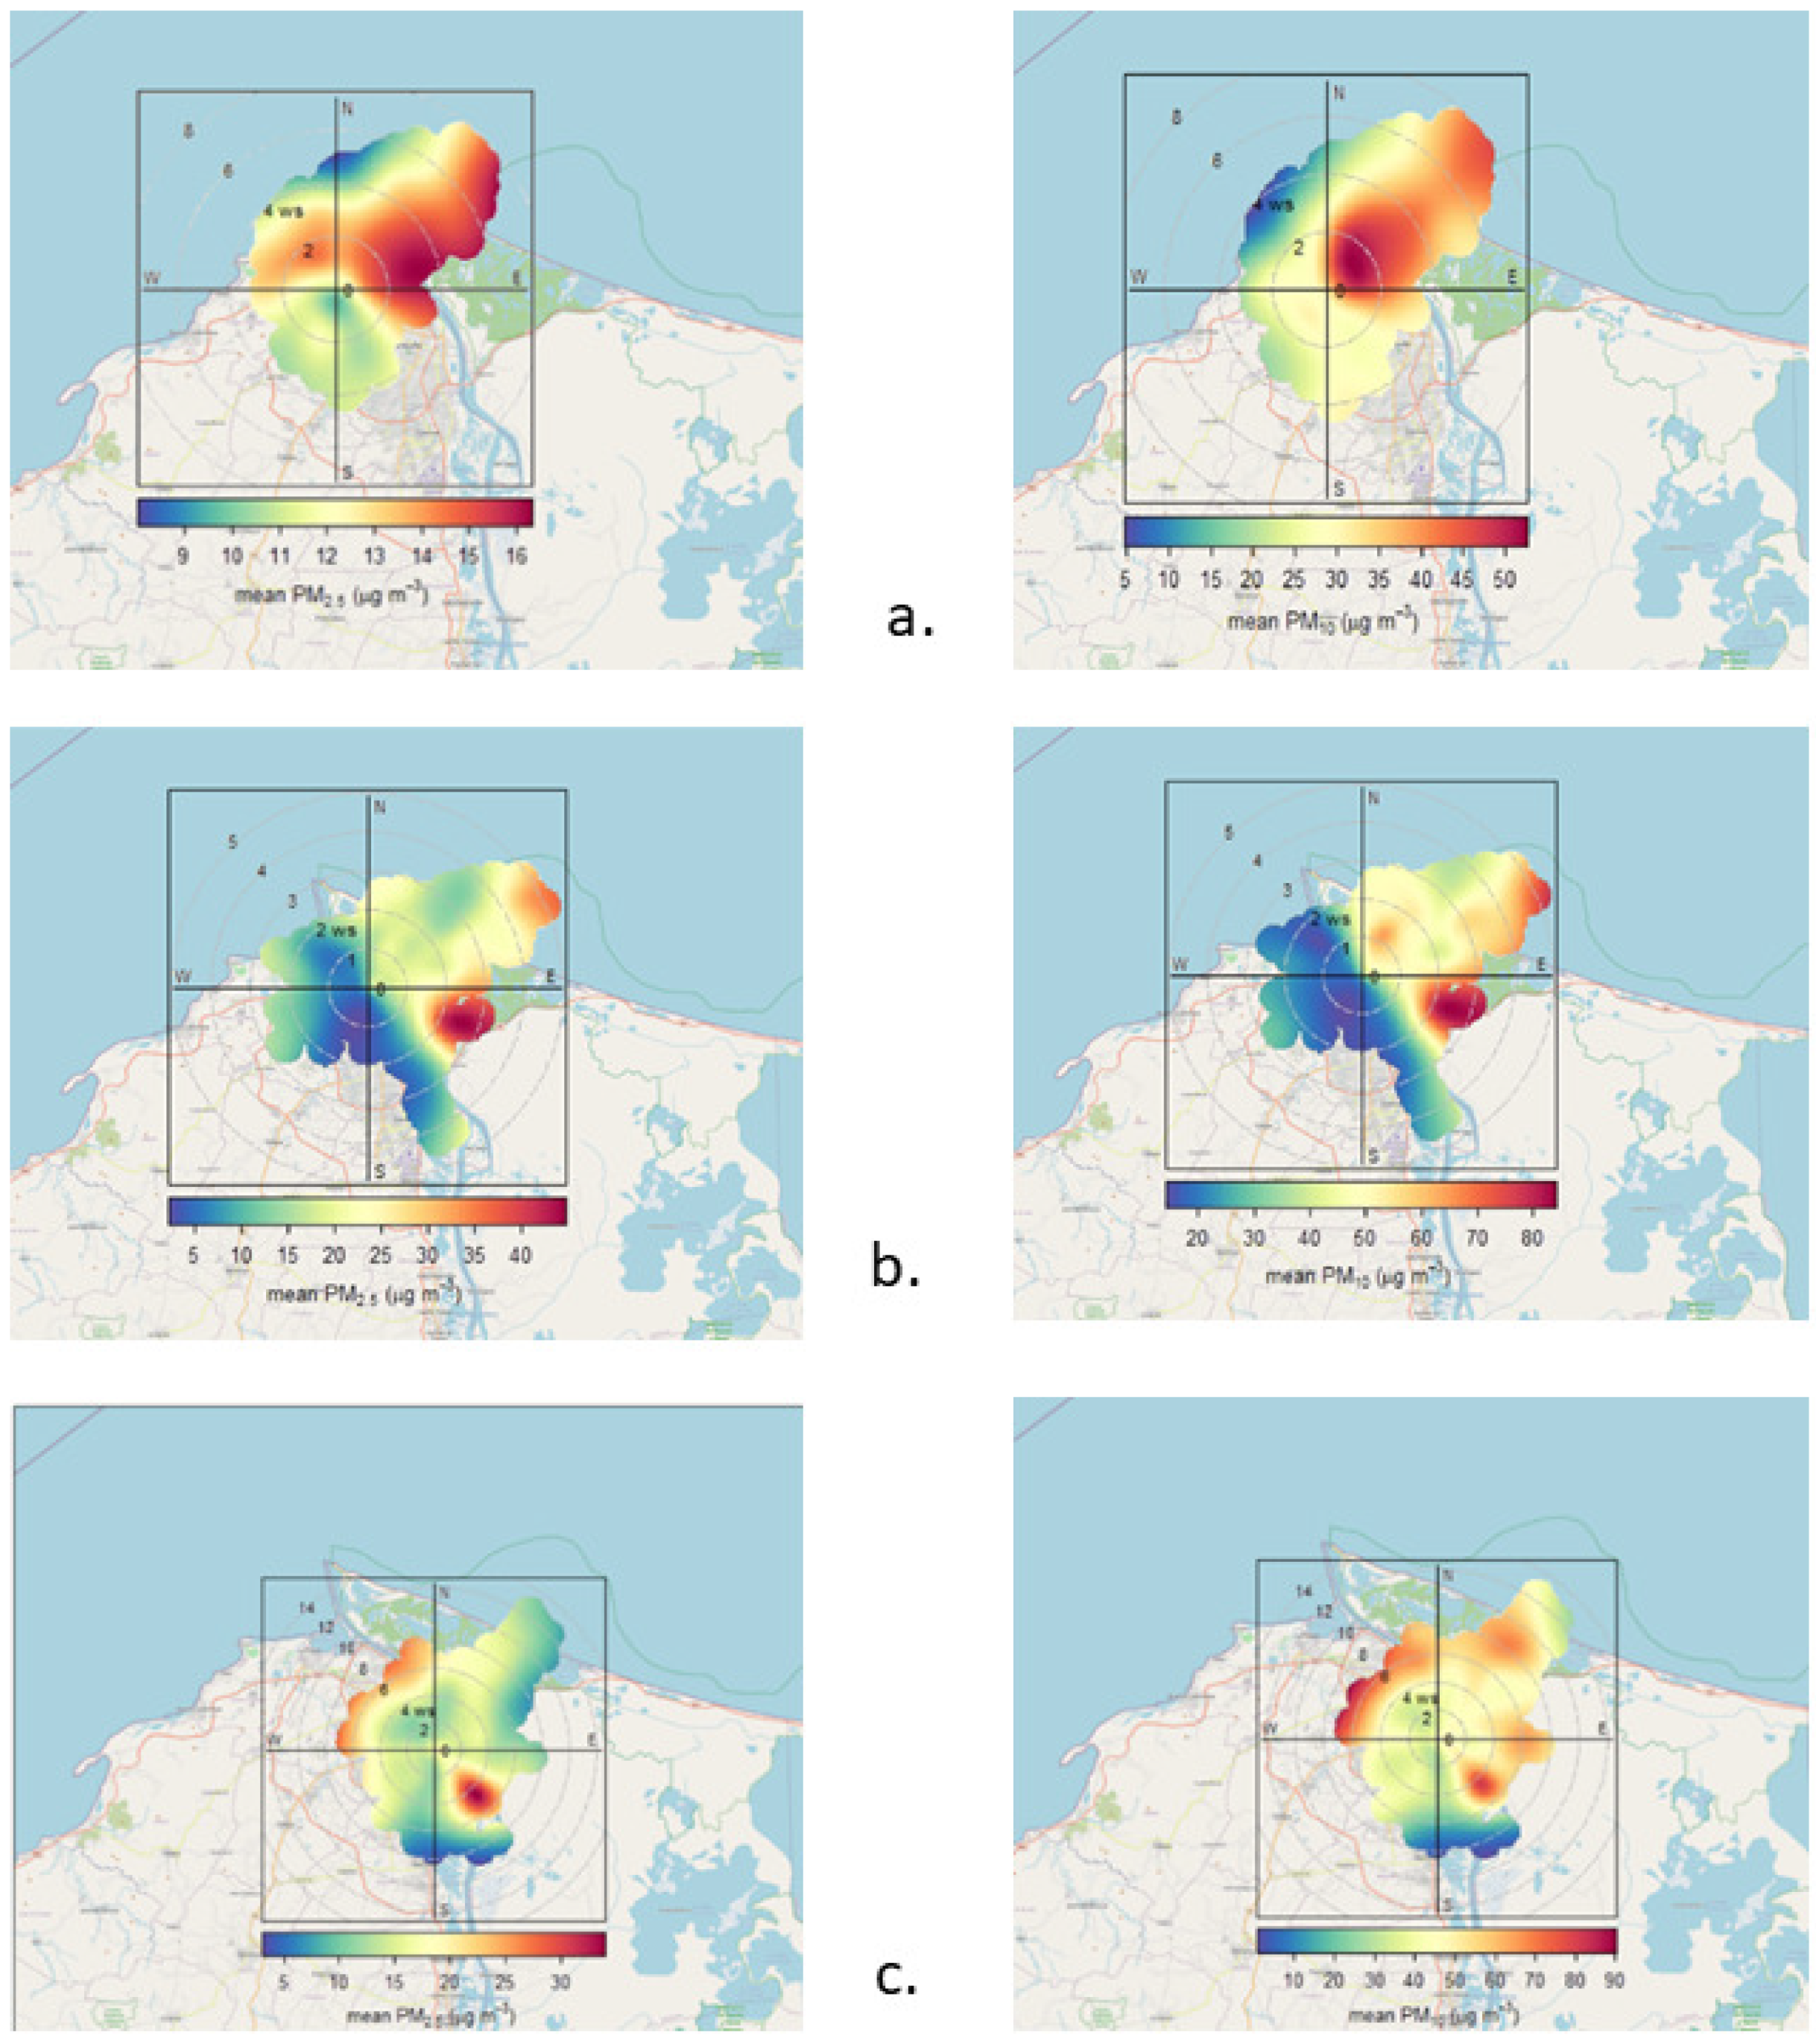
3.3. Circulation and Regional Transport
During 2020, when the most significant episodes were recorded, the distribution of pollutants was analyzed considering the direction and speed of the wind. The pink graph of contaminants. The results also indicate that the concentrations of pollutants were generally higher when the air pockets of the northeast (selected pollutants) reached velocities of approximately 3 m/s.
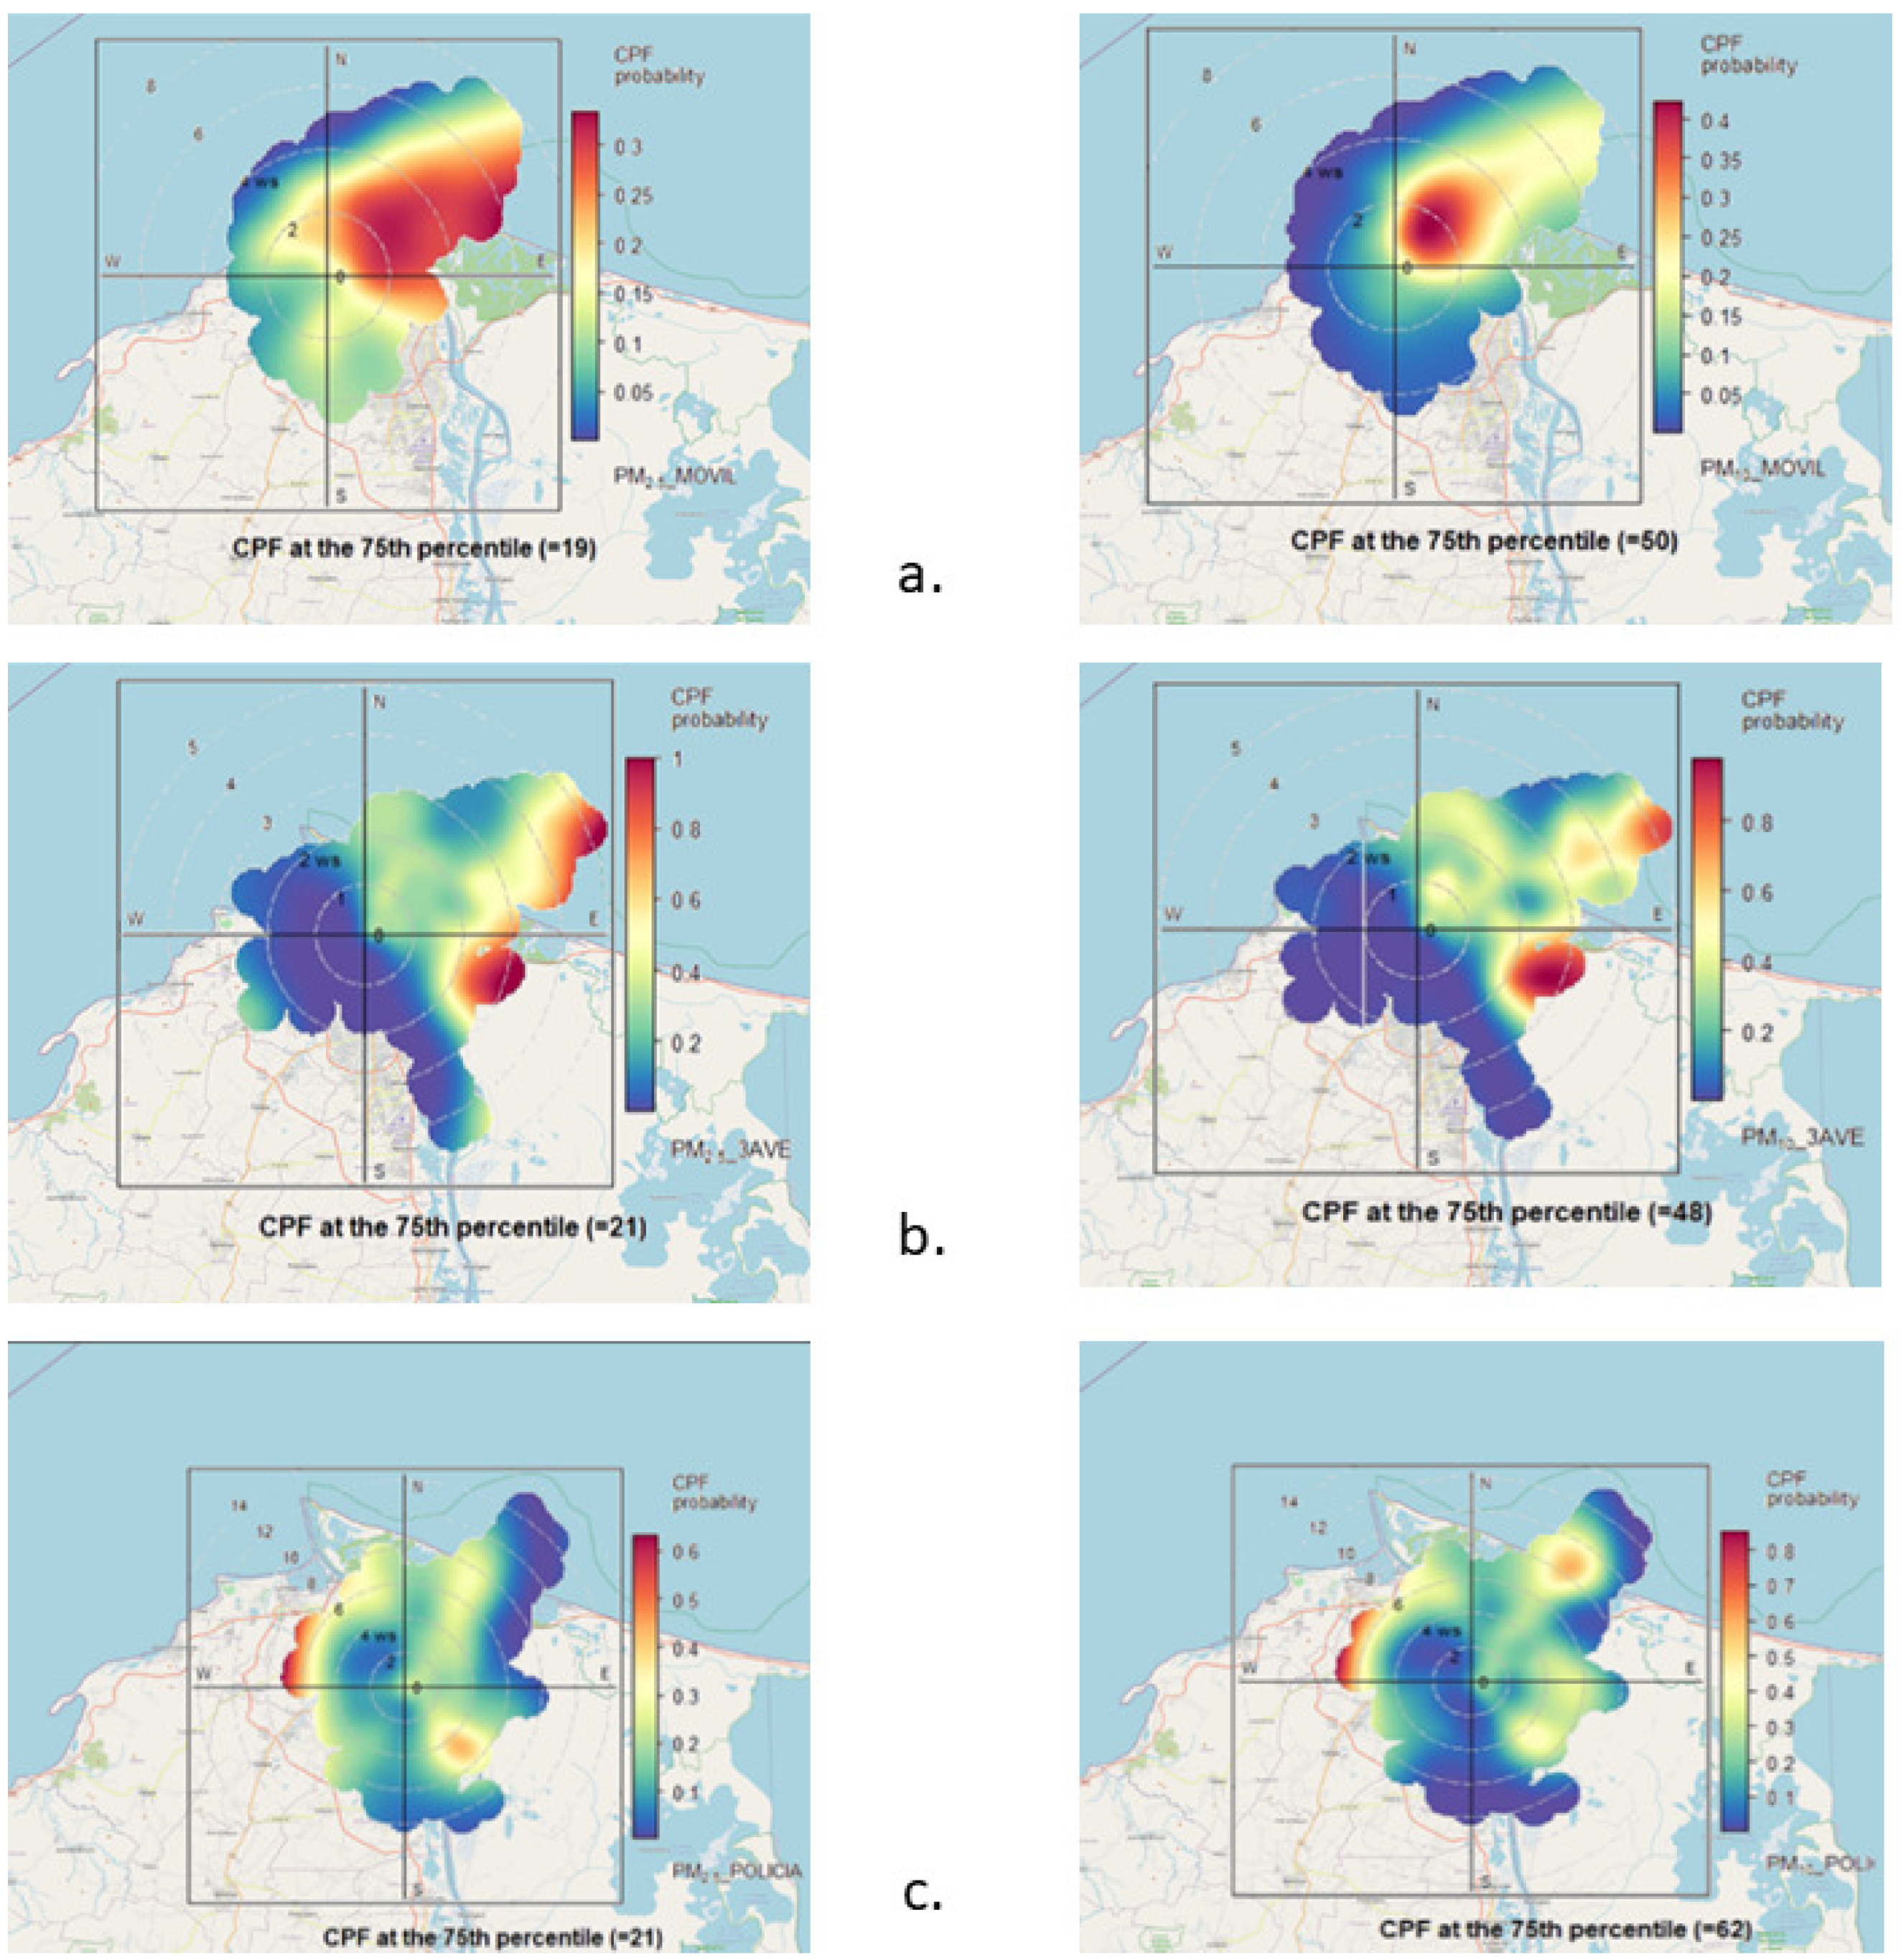
Figure 3 presents the effect of the regional transport of pollutants such as PM, measured at the Tres Ave Marías and Móvil stations. In general, the predominant direction was northeast with a significant influence from the south for some pollutants. These trends are consistent with the graphs of the CPF (Figure 4) and bivariate polar graphs (Figure 5). CPF graphs indicate the probability of a selected concentration of each wind direction, while the bivariate polar graphs used a generalized additive model to interpolate between averaged data points for the wind direction and speed [73].
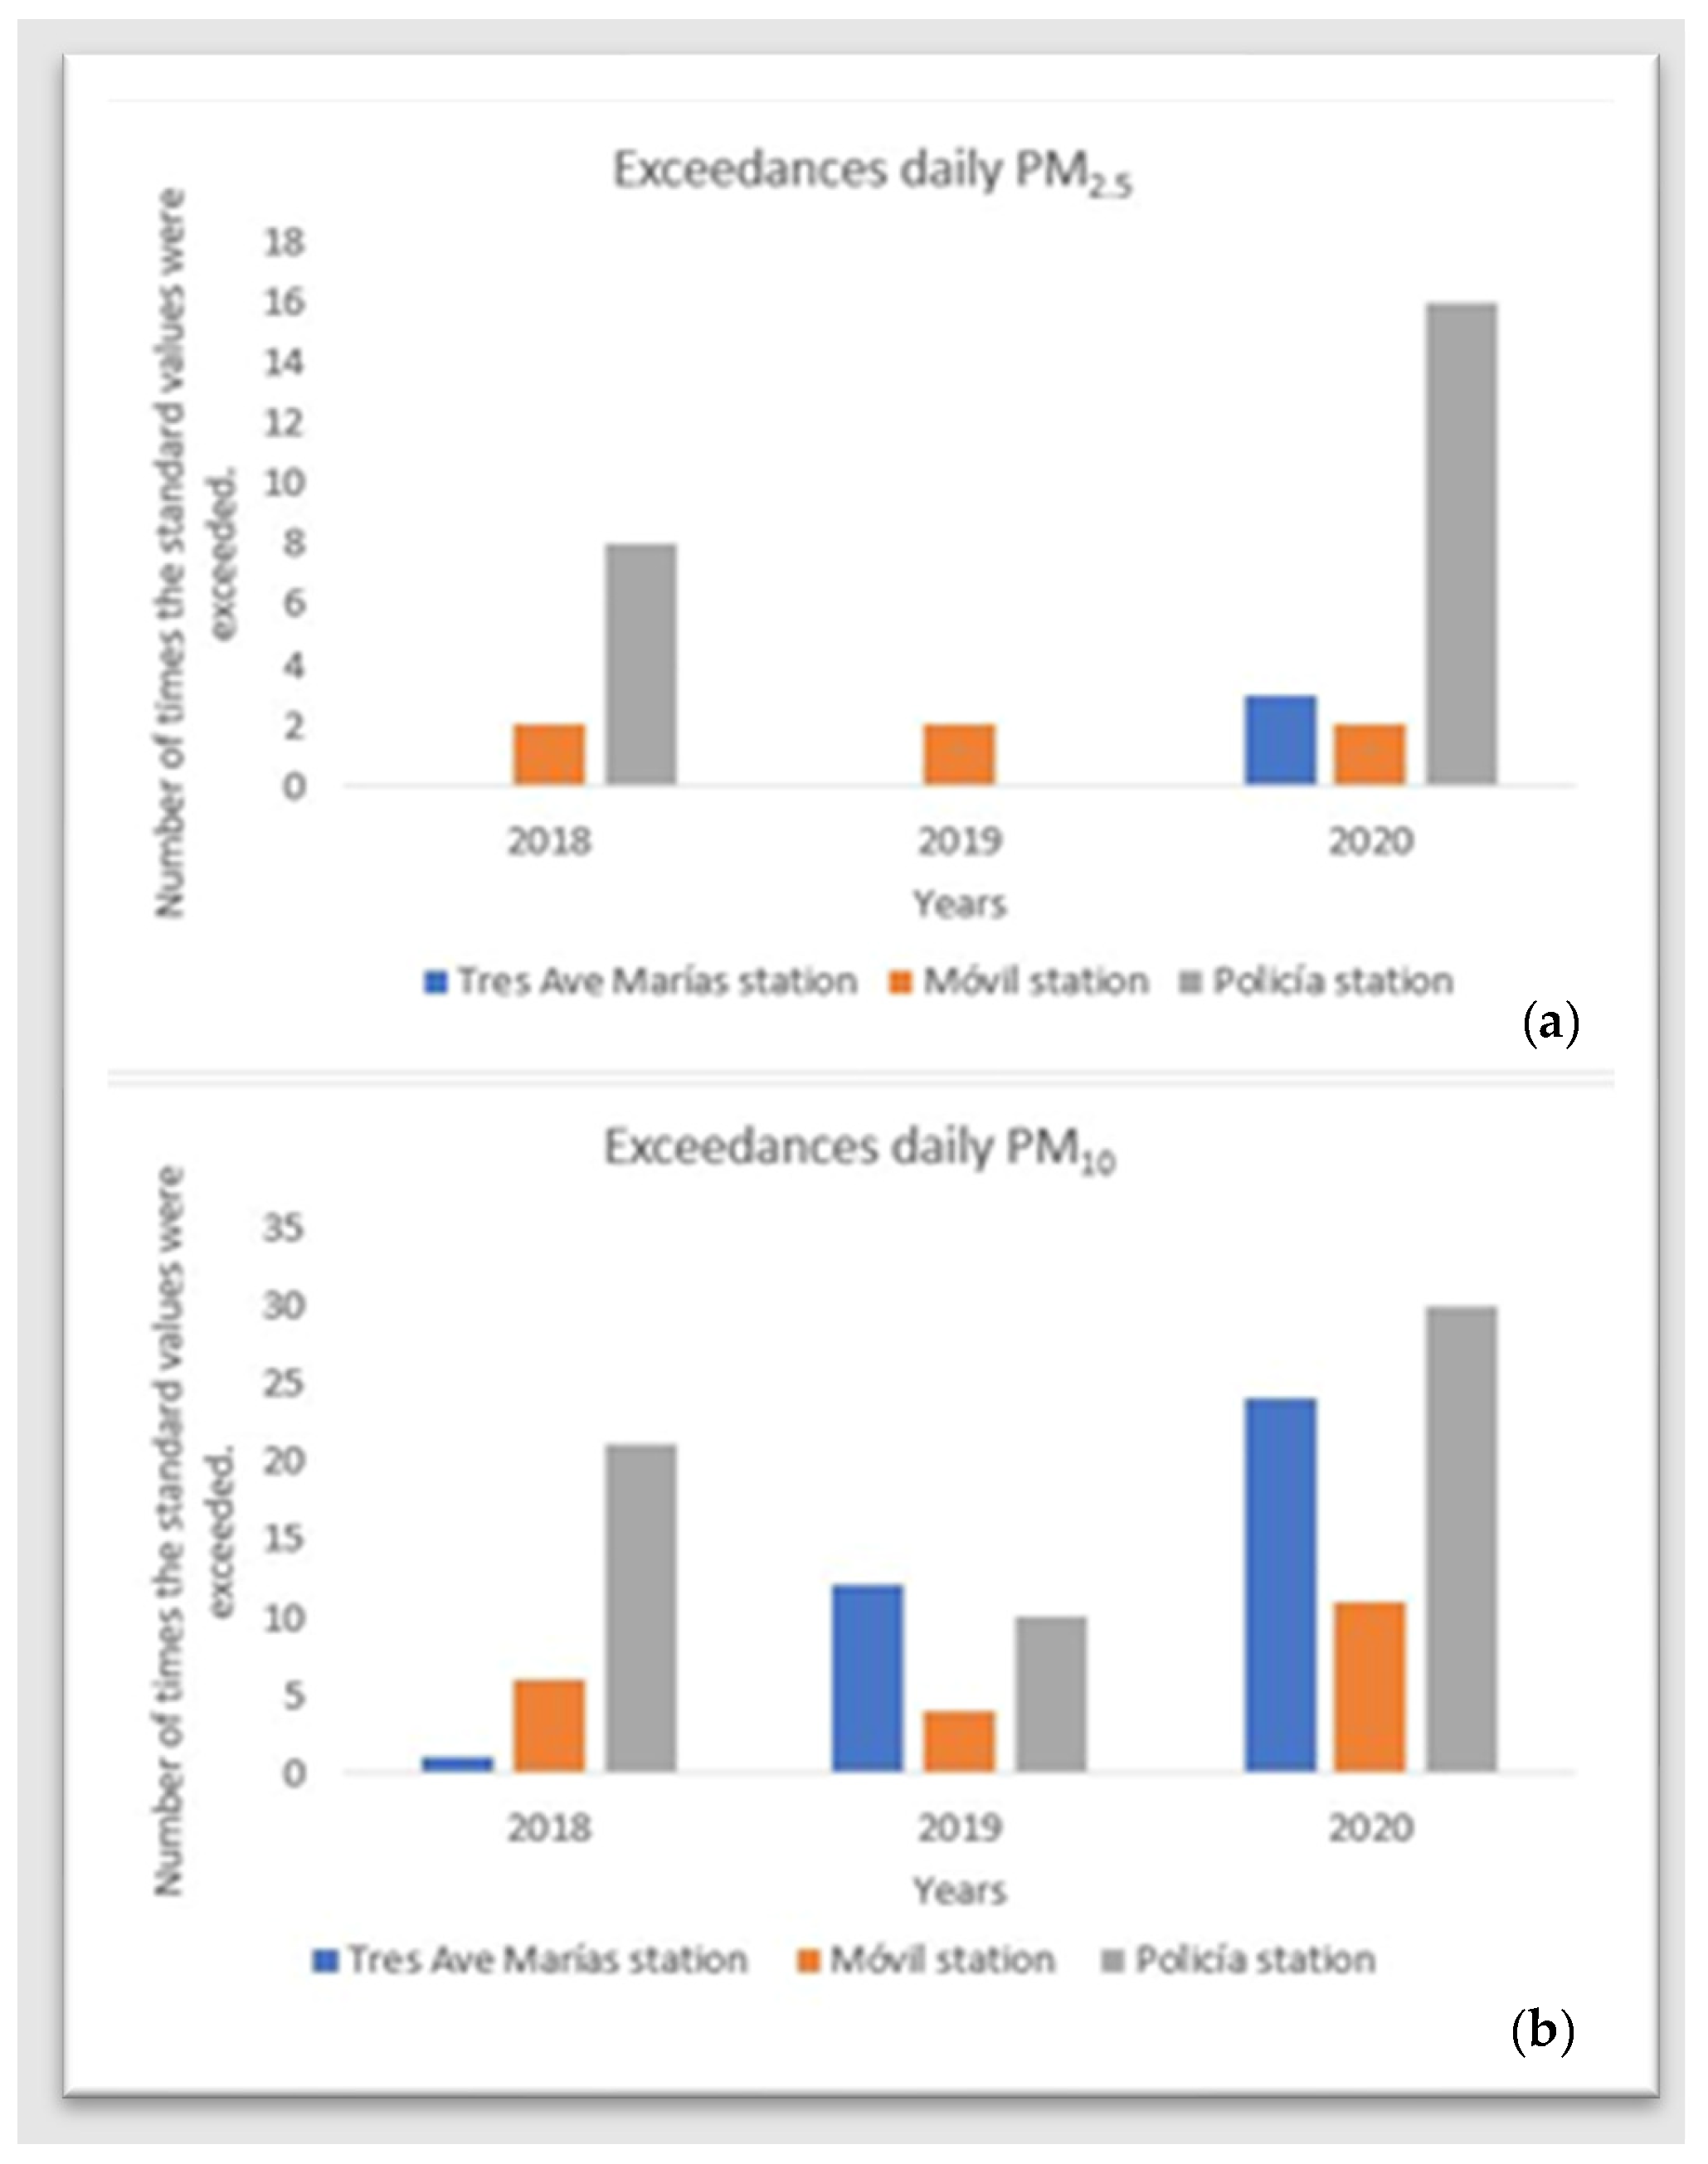
3.4. Cases of Exceeding the Regulated Values
The analysis of exceeding the standards for PM10, PM2.5, O3 and CO aimed to compare the maximum permissible values of the data obtained from the stations with the national standard (Resolution 2254 of 2017). Among the results, the levels of PM at the stations mostly complied with the regulations (Figure 6). For PM10, a total of 119 cases exceeded the mean concentration limit of 24 h (75 µg/m3), with 2020 being the year that recorded the highest number compared to those in 2018 and 2019. For PM2.5, the higher percentage of exceeding the average national limit of 24 h (37 µg/m3) was equivalent to 4% in the records for 2020. On some days, the concentrations of O3 also exceeded this limit.
Table 4, the maximum hourly measurements at Tres Ave Marias station for PM10 (1424.33 μg/m3) and PM2.5 (135.013 μg/m3) corresponded to events on 14 May 2020, and 23 June 2020, while those at the Móvil station for PM10 (263.98 μg/m3) and PM2.5 (278.7 μg/m3) corresponded to events on June 28, 2020, and August 9, 2020; these levels exceeded the average maximum limits of 24 h. Both events coincided with fire events denounced by the environmental authorities that results in a total of 249 ha of the Isla Salamanca Natural Park being burned. At the time, the average wind direction was northeast with a speed of 3 m/s.
These results indicate that there is a considerable level of affectation in the air quality of the city of Barranquilla when large-scale fires occur (>100 Ha burned) and with wind speed conditions greater than 3 m/s, since with Fires of minor characteristics did not show any exceedance of the normed values. It is important to highlight that these results are subject to improvement when more data is available to be able to analyze a significant period of years.
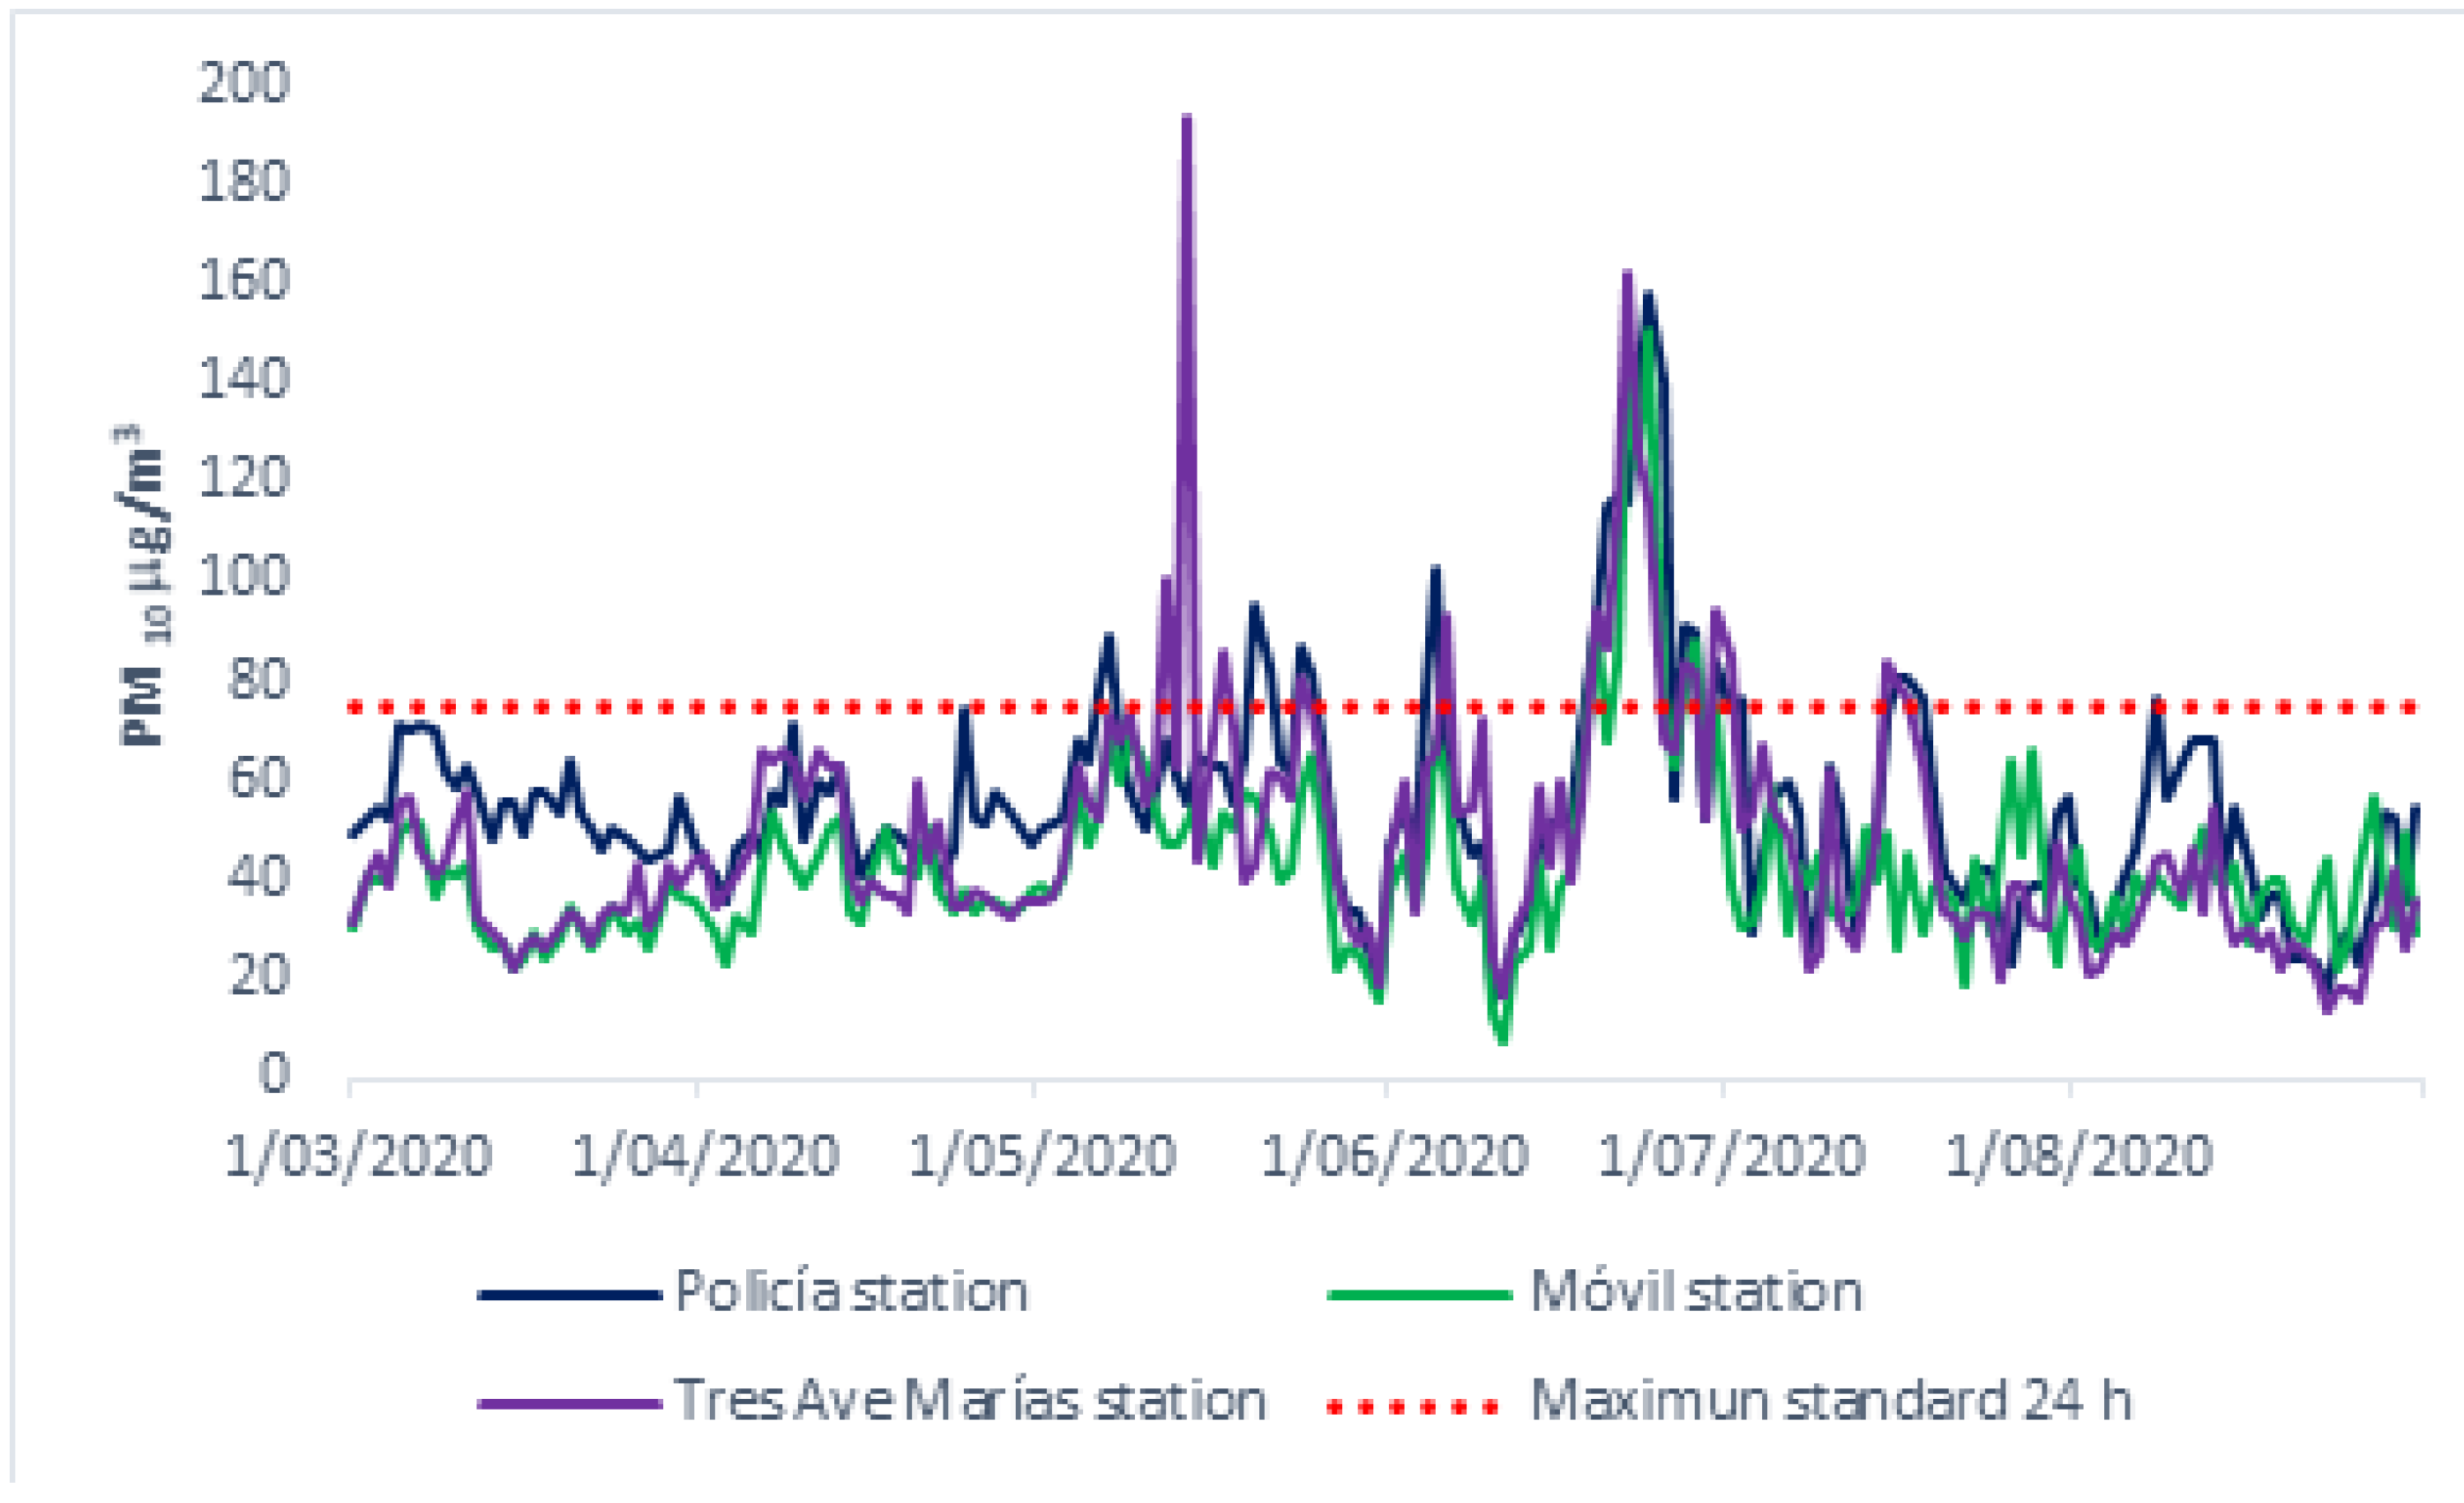
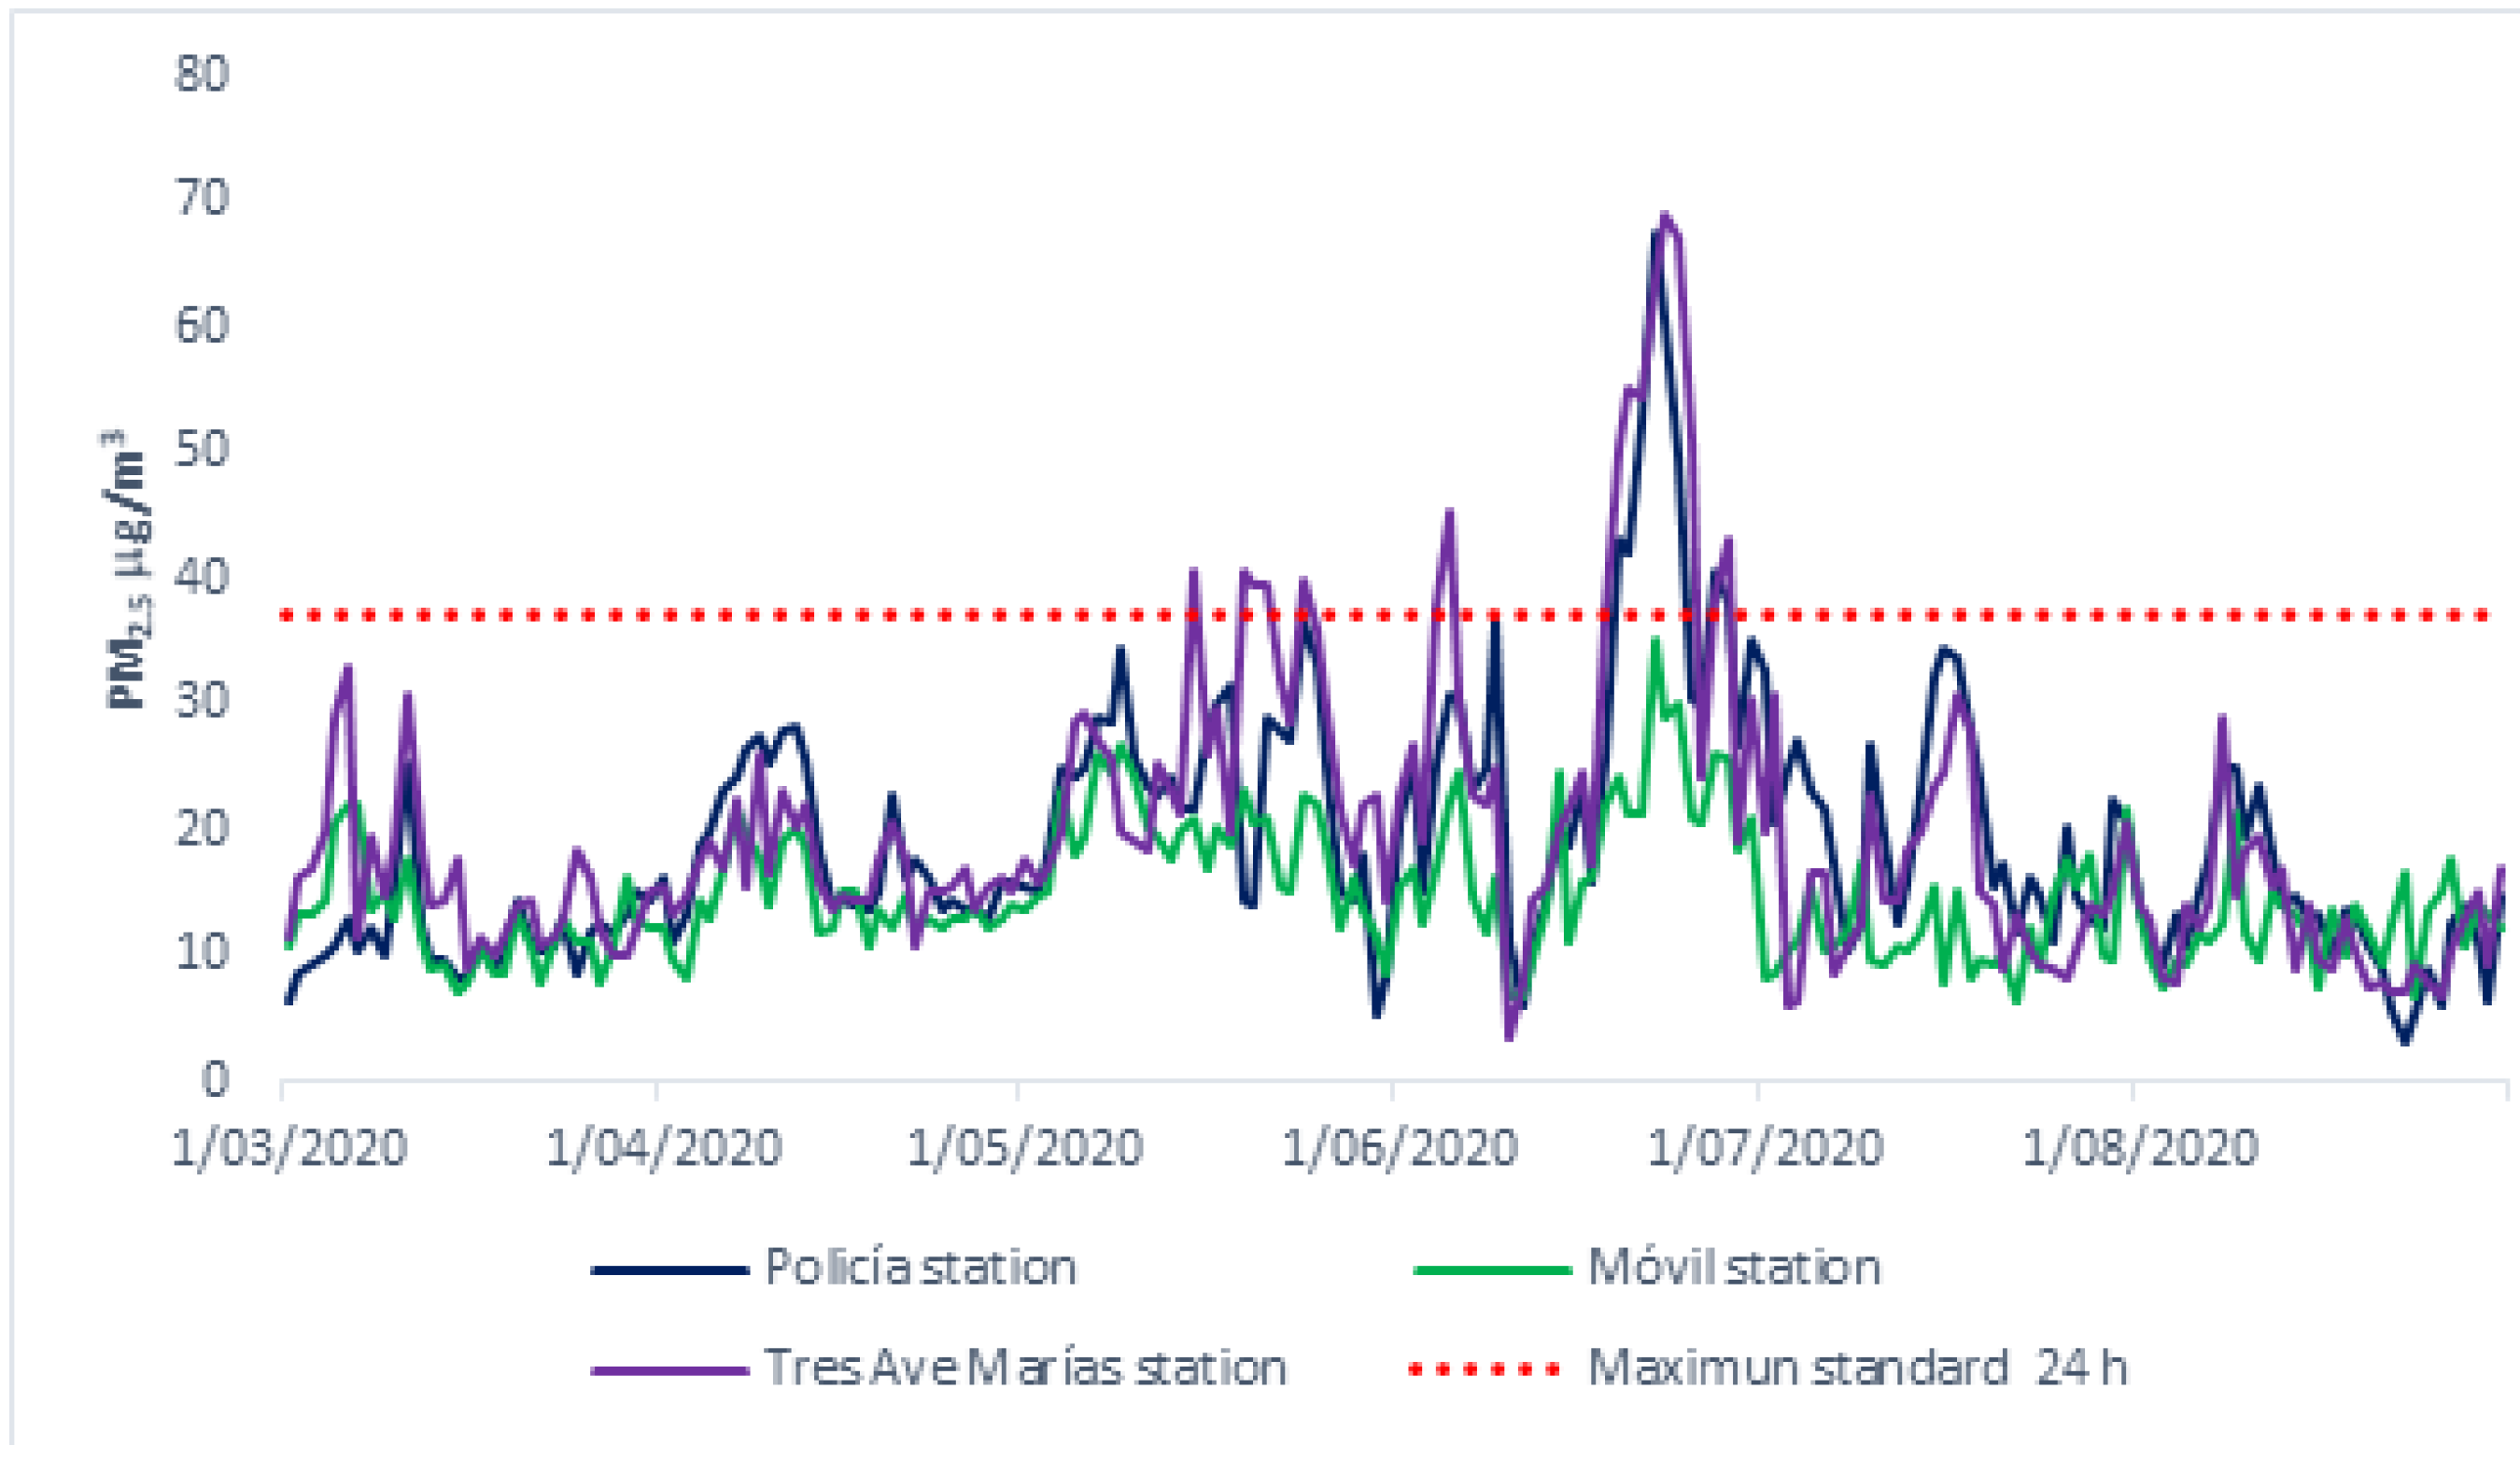
On the other hand, Figure 7 show the data reports an increase in PM10 concentrations during the episode of 12 May 2020 of approximately 100.70 µg/m3 at the Tres Aves Marías station. During the biomass burning event of 18 June 2020, PM10 registered an increase in its maximum permissible levels at the three monitoring stations, this being the most representative at the Tres Ave Marías station with a daily concentration of 163.32 µg/m3. PM2.5 reports an increase in the permissible limits of 40.65 µg/m3 at the Policía station after the fire event on 5 May 2020 (Figure 8), this case is consistent with studies carried where the increases in PM2.5 concentrations occur after the fire event [25].
3.5. Backward during Wildfires 2020
The analysis of the backward was carried out during the most shocking fire episodes that developed during the year 2020 (18–28 June and 8–15 August) in which more than 200 hectares of the Isla de Salamanca natural park were burned. For the analysis, The Hybrid Single-Particle Lagrangian Integrated Trajectory model (HYSPLIT) was implemented. According to multiple studies, this model is one of the most used for the calculation of atmospheric dispersion and backward [74,75]. For the reanalysis data, GDAS1 (1° resolution) was used, which has been used successfully for trajectory calculations regardless of topography and diversified land-use areas [76]. For this analysis, we worked with heights of 100 m, 500 m and 800 m.
Figure 9 analyzed the Policía and Tres Ave Marías station because it was the station that registered an increase in the regulated values according to Colombian legislation for June 2020, coinciding with one of the fire episodes.
4. Discussion
Although government policies have improved the monitoring of pollutants and fire records in urban areas of Colombia, there is a scarcity of data and little record on these air pollutant measurements inside and outside urban areas, which makes it difficult to study air quality and its relationship with prolonged fires registered in the area of interest. The results obtained in the present study help to understand the behavior of the atmospheric regime of the study area and how it can impact the air quality of the district of Barranquilla as a result of the forest fires that occur in the Isla Salamanca Natural Park. Although the Isla Salamanca Park it is a protected area, it has a predominance of forest fires, mostly caused by anthropogenic activities.
The results of the correlations are consistent with the results obtained in Duarte et al. (2021) [40], which indicates that O3 concentration may be associated with meteorological conditions related to the formation of sea breeze circulations that favor the improvement of O3 production. In addition, a significant and positive correlation between O3 and temperature is observed since this has a greater influence on the generation of O3 [77,78]. While the Policía station recorded the highest average values in terms of pollutant concentrations.
Instead, the correlations of particulate matter with meteorological variables are weaker than those recorded by ozone. According to Jacob and Winner (2009) [79], this occurs due to the diversity of particulate matter components, the complex coupling of particulate matter to the hydrological cycle, and various compensatory effects.
Regional atmospheric biomass burning events can increase the particulate matter concentrations according Rojano et al., 2021 [49], and can be seen in Figure 6, which shows 4% of exceedance percentage for PM2.5 in the year 2020. Overall, the pollutant data showed an increase in the concentrations of PM10 and PM2.5, coinciding with the largest fire episodes that occurred in 2020, and this information allowed the identification of a relationship between the magnitude of the fire and the increase in the pollutant concentrations measured by the stations because fires with smaller burned areas did not differ among the observers located in the field. It is important to note that the alterations in the air quality for the episodes were not constant; that is, every day that the fires occurred, there were no high levels due to the dynamics of the area. Although the concentrations of particulate matter during the study are not extreme, it can generate a future risk to the health of the nearby population, especially the susceptible population [80,81].
In addition, the results showed a good correlation among the different sampling sites for the two groups of correlations: concentration data compared with environmental conditions and concentration data between different pollutants. Taking into account the magnitude of the recorded fire episodes and the predominance of northeasterly winds in the district of Barranquilla, in some cases, the fires affected the air quality in Salamanca Island Park, with greater impacts at the Tres Ave Marías and Móvil stations.
Backward of the air masses for the fire episodes show an alteration in air quality, for the Tres Ave Marías station, for prolonged fires and with burning areas greater than 100 ha and if the directions of the air masses direct the air masses to the area. For the Policía station, alteration was evidenced during the June 2020 fire but not for the August fire, which shows that there is no direct relationship for that specific area. This episode can be attributed to the mineral dust from African deserts that in June 2020, took place in the Caribbean [82,83].
It is important to note that a large amount of the pollutants detected by the stations are generated from productive processes carried out in the city, as evidenced in recent studies conducted for the city [40,41,51]. This result is consistent with the results of the analysis of the climatological variables since they showed that most of the pollutants move in the opposite direction of Barranquilla, so the impact during prolonged fires is not visible.
A limitation of our study is the lack of information on the concentrations of pollutants over a long period, as there are only data from 2018 to 2020, despite having available reports by National Parks about Isla Salamanca Park fire events between 2015–2020, that so it was not possible to analyze the dynamics of a longer time series.
5. Conclusions
In this study, the OpenAir package of the Rstudio program was used to analyze the impact of events recorded in the Isla Salamanca Natural Park, and these events had a great impact due to the magnitude of the burns (>100 ha). Through numerical analysis, we found a relationship between the generation of PM and large-scale fire episodes recorded between June and August 2020.
It is important to indicate that the area of interest does not have enough stations to adequately evaluate fire episodes since the observations in the field do not cover a large portion of the area of interest. In that sense, remote sensing is a tool that facilitate monitoring (i.e., to identify land us change that could cause a forest fire event), predicting of disaster risk, and managing wildfires.
The results of this study allow us to present a systematic analysis of the impact of forest fires in Isla Salamanca Natural Park and the direct effect that these fires have on the air quality of the district of Barranquilla. The results were consistent with those of other studies regarding the finding at the Móvil station regarding the increase in the O3 and decrease in CO. It is important to note that meteorological variables, especially wind direction and speed, strongly affect the concentration and dispersion of pollutants.
Finally, the absence of fire management policies hinders the protection and conservation of natural ecosystems such as mangroves, grasslands and scrub in natural protected areas, also implementation of doings to prevent wildfires spreading in susceptible areas. Therefore, inter-institutional and communities work are required to advance in more effective actions to control of these events and their implications in terms of air quality and consequent affect to health.
Author Contributions
Conceptualization, S.B.-D., Y.C.-C. and T.R.B.-O.; formal analysis, S.B.-D.; methodology, S.B.-D., Y.C.-C. and T.R.B.-O.; supervision, Y.C.-C.; writing—original draft, S.B.-D.; writing—review & editing, S.B.-D., F.T.B. and T.R.B.-O. All authors have read and agreed to the published version of the manuscript.
Funding
This research was funded by Universidad del Magdalena, Santa Marta, Colombia.
Data Availability Statement
The data in this study could be available to individuals upon request.
Acknowledgments
The authors appreciate the technical support of Laura Mantilla Romo, Jelaine Constante Ballestas.
Conflicts of Interest
The authors declare no conflict of interest.
Appendix A

Table A1.
Percentage of missing data for each air quality monitoring stations.
| Parameter/ Variable | Policía Station | Tres Ave Marías Station | Móvil Station | ||||||
|---|---|---|---|---|---|---|---|---|---|
| 2018 | 2019 | 2020 | 2018 | 2019 | 2020 | 2018 | 2019 | 2020 | |
| CO | 8% | 7% | 19% | 9% | 10% | 7% | 8% | 4% | 3% |
| O3 | 7% | 40% | 16% | 11% | 10% | 18% | 8% | 3% | 38% |
| PM2.5 | 21% | 22% | 21% | 24% | 18% | 39% | 36% | 16% | 69% |
| PM10 | 22% | 12% | 19% | 22% | 16% | 39% | 25% | 10% | 56% |
| Dir. Wind | 9% | 17% | 11% | 3% | 8% | 0.05% | |||
| Wind speed | 8% | 17% | 11% | 3% | 8% | 0.05% | |||
| Temp. | 9% | 17% | 11% | 3% | 7% | 0.32% | |||
| Rel. Hum | 9% | 18% | 11% | 4% | 12% | 0.40% | |||
| Precip. | 4% | 15% | 12% | 3% | 20% | 0.03% | |||
References
- Rovira, J.; Domingo, J.L.; Schuhmacher, M. Air Quality, Health Impacts and Burden of Disease due to Air Pollution (PM10, PM2.5, NO2 and O3): Application of AirQ+ Model to the Camp de Tarragona County (Catalonia, Spain). Sci. Total Environ. 2020, 703, 135538. [Google Scholar] [CrossRef] [PubMed]
- Instituto de Hidrología, Meteorología y Estudios Ambientales (IDEAM). Informe del Estado de la Calidad del Aire en Colombia; IDEAM: Bogotá, Columbia, 2019; Volume 18. [Google Scholar]
- WHO. WHO Global Air Quality Guidelines: Particulate Matter (PM2.5 and PM10), Ozone, Nitrogen Dioxide, Sulfur Dioxide and Carbon Monoxide; World Health Organization: Geneva, Switzerland, 2021; Volume 1302.
- Meo, S.A.; Abukhalaf, A.A.; Alomar, A.A.; Alessa, O.M.; Sami, W.; Klonoff, D.C. Effect of Environmental Pollutants PM-2.5, Carbon Monoxide, and Ozone on the Incidence and Mortality of SARS-COV-2 Infection in Ten Wildfire Affected Counties in California. Sci. Total Environ. 2021, 757, 143948. [Google Scholar] [CrossRef] [PubMed]
- Balmes, J.R. Where There’s Wildfire, There’s Smoke. N. Engl. J. Med. 2018, 378, 881–883. [Google Scholar] [CrossRef] [PubMed]
- Organización Mundial de la Salud (OMS). Contaminación del Aire Ambiental (Exterior). Available online: https://www.who.int/news-room/fact-sheets/detail/ambient-(outdoor)-air-quality-and-health (accessed on 10 August 2022).
- Organización Mundial de la Salud (OMS). Miles de Millones de Personas Siguen Respirando Aire Insalubre: Nuevos Datos de la OMS. Available online: https://www.who.int/news/item/04-04-2022-billions-of-people-still-breathe-unhealthy-air-new-who-data (accessed on 13 September 2022).
- Scerri, M.M.; Kandler, K.; Weinbruch, S. Disentangling the Contribution of Saharan Dust and Marine Aerosol to PM10 Levels in the Central Mediterranean. Atmos. Environ. 2016, 147, 395–408. [Google Scholar] [CrossRef]
- Donaldson, K.; Paul, B. Particle Toxicology; CRC Press: Boca Raton, FL, USA, 2006. [Google Scholar]
- Tsangari, H.; Paschalidou, A.K.; Kassomenos, A.P.; Vardoulakis, S.; Heaviside, C.; Georgiou, K.E.; Yamasaki, E.N. Extreme Weather and Air Pollution Effects on Cardiovascular and Respiratory Hospital Admissions in Cyprus. Sci. Total Environ. 2016, 542, 247–253. [Google Scholar] [CrossRef]
- Ge, E.; Lai, K.; Xiao, X.; Luo, M.; Fang, Z.; Zeng, Y.; Ju, H.; Zhong, N. Differential Effects of Size-Specific Particulate Matter on Emergency Department Visits for Respiratory and Cardiovascular Diseases in Guangzhou, China. Environ. Pollut. 2018, 243, 336–345. [Google Scholar] [CrossRef]
- Renzi, M.; Scortichini, M.; Forastiere, F.; de’ Donato, F.; Michelozzi, P.; Davoli, M.; Gariazzo, C.; Viegi, G.; Stafoggia, M.; Ancona, C.; et al. A Nationwide Study of Air Pollution from Particulate Matter and Daily Hospitalizations for Respiratory Diseases in Italy. Sci. Total Environ. 2021, 807, 151034. [Google Scholar] [CrossRef]
- Chai, G.; He, H.; Sha, Y.; Zhai, G.; Zong, S. Effect of PM2.5 on Daily Outpatient Visits for Respiratory Diseases in Lanzhou, China. Sci. Total Environ. 2019, 649, 1563–1572. [Google Scholar] [CrossRef]
- Shikwambana, L.; Kganyago, M. Observations of Emissions and the Influence of Meteorological Conditions during Wildfires: A Case Study in the USA, Brazil, and Australia during the 2018/19 Period. Atmosphere 2020, 12, 11. [Google Scholar] [CrossRef]
- Seposo, X.; Ueda, K.; Sugata, S.; Yoshino, A.; Takami, A. Short-Term Effects of Air Pollution on Daily Single- and Co-Morbidity Cardiorespiratory Outpatient Visits. Sci. Total Environ. 2020, 729, 138934. [Google Scholar] [CrossRef]
- World Health Organitation. World Health Statistics 2022: Monitoring Health for the SDGs, Sustainable Development Goals. Available online: https://www.who.int/publications/i/item/9789240051157 (accessed on 13 September 2022).
- Kollanus, V.; Tiittanen, P.; Niemi, J.V.; Lanki, T. Effects of Long-Range Transported Air Pollution from Vegetation Fires on Daily Mortality and Hospital Admissions in the Helsinki Metropolitan Area, Finland. Environ. Res. 2016, 151, 351–358. [Google Scholar] [CrossRef]
- Beig, G.; Sahu, S.K.; Singh, V.; Tikle, S.; Sobhana, S.B.; Gargeva, P.; Ramakrishna, K.; Rathod, A.; Murthy, B.S. Objective Evaluation of Stubble Emission of North India and Quantifying Its Impact on Air Quality of Delhi. Sci. Total Environ. 2020, 709, 136126. [Google Scholar] [CrossRef]
- Nadal, M.; Rovira, J.; Díaz-Ferrero, J.; Schuhmacher, M.; Domingo, J.L. Human Exposure to Environmental Pollutants after a Tire Landfill Fire in Spain: Health Risks. Environ. Int. 2016, 97, 37–44. [Google Scholar] [CrossRef]
- Rissler, J.; Vestin, A.; Swietlicki, E.; Fisch, G.; Zhou, J.; Artaxo, P.; Andreae, M.O. Size Distribution and Hygroscopic Properties of Aerosol Particles from Dry-Season Biomass Burning in Amazonia. Atmos. Chem. Phys. 2006, 6, 471–491. [Google Scholar] [CrossRef] [Green Version]
- Hamburger, T.; Matisans, M.; Tunved, P.; Ström, J.; Calderon, S.; Hoffmann, P.; Hochschild, G.; Gross, J.; Schmeissner, T.; Wiedensohler, A.; et al. Long-Term in Situ Observations of Biomass Burning Aerosol at a High Altitude Station in Venezuela – Sources, Impacts and Interannual Variability. Atmos. Chem. Phys. 2013, 13, 9837–9853. [Google Scholar] [CrossRef] [Green Version]
- Edwards, D.P.; Emmons, L.K.; Gille, J.C.; Chu, A.; Attié, J.L.; Giglio, L.; Wood, S.W.; Haywood, J.; Deeter, M.N.; Massie, S.T.; et al. Satellite-Observed Pollution from Southern Hemisphere Biomass Burning. J. Geophys. Res. Atmos. 2006, 111, D14312. [Google Scholar] [CrossRef]
- Hao, W.M.; Liu, M.-H. Spatial and Temporal Distribution of Tropical Biomass Burning. Glob. Biogeochem. Cycles 1994, 8, 495–503. [Google Scholar] [CrossRef]
- Martins, L.D.; Hallak, R.; Alves, R.C.; de Almeida, D.S.; Squizzato, R.; Moreira, C.A.B.; Beal, A.; da Silva, I.; Rudke, A.; Martins, J.A. Long-Range Transport of Aerosols from Biomass Burning over Southeastern South America and Their Implications on Air Quality. Aerosol Air Qual. Res. 2018, 18, 1734–1745. [Google Scholar] [CrossRef] [Green Version]
- Hung, W.-T.; Lu, C.-H.; Shrestha, B.; Lin, H.-C.; Lin, C.-A.; Grogan, D.; Hong, J.; Ahmadov, R.; James, E.; Joseph, E. The Impacts of Transported Wildfire Smoke Aerosols on Surface Air Quality in New York State: A Case Study in Summer 2018. Atmos. Environ. 2020, 227, 117415. [Google Scholar] [CrossRef]
- Liu, J.C.; Mickley, L.J.; Sulprizio, M.P.; Dominici, F.; Yue, X.; Ebisu, K.; Anderson, G.B.; Khan, R.F.A.; Bravo, M.A.; Bell, M.L. Particulate Air Pollution from Wildfires in the Western US under Climate Change. Clim. Change 2016, 138, 655–666. [Google Scholar] [CrossRef]
- Chen, G.; Guo, Y.; Yue, X.; Tong, S.; Gasparrini, A.; Bell, M.L.; Armstrong, B.; Schwartz, J.; Jaakkola, J.J.K.; Hashizume, M.; et al. Articles Mortality Risk Attributable to Wildfire-Related PM 2·5 Pollution: A Global Time Series Study in 749 Locations. Lancet Planet. Health 2021, 5, 579–587. [Google Scholar] [CrossRef]
- Rodríguez-Villamizar, L.A.; Rojas-Roa, N.Y.; Fernández-Niño, J.A. Short-Term Joint Effects of Ambient Air Pollutants on Emergency Department Visits for Respiratory and Circulatory Diseases in Colombia, 2011–2014. Environ. Pollut. 2019, 248, 380–387. [Google Scholar] [CrossRef] [PubMed]
- Naeher, L.P.; Brauer, M.; Lipsett, M.; Zelikoff, J.T.; Simpson, C.D.; Koenig, J.Q.; Smith, K.R. Woodsmoke Health Effects: A Review. Inhal. Toxicol. 2010, 19, 67–106. [Google Scholar] [CrossRef] [PubMed]
- Jaffe, D.A.; O’Neill, S.M.; Larkin, N.K.; Holder, A.L.; Peterson, D.L.; Halofsky, J.E.; Rappold, A.G. Wildfire and Prescribed Burning Impacts on Air Quality in the United States. J. Air Waste Manag. Assoc. 2020, 70, 583–615. [Google Scholar] [CrossRef] [PubMed]
- Machado-Silva, F.; Libonati, R.; Melo de Lima, T.F.; Bittencourt Peixoto, R.; de Almeida França, J.R.; de Avelar Figueiredo Mafra Magalhães, M.; Lemos Maia Santos, F.; Abrantes Rodrigues, J.; DaCamara, C.C. Drought and Fires Influence the Respiratory Diseases Hospitalizations in the Amazon. Ecol. Indic. 2020, 109, 105817. [Google Scholar] [CrossRef]
- United Nations Environment Programme (UNEP). Frontiers 2022: Noise, Blazes and Mismatches; UNEP: Nairobi, Kenya, 2022; ISBN 9789280739176. [Google Scholar]
- Dowdy, A.J.; Ye, H.; Pepler, A.; Thatcher, M.; Osbrough, S.L.; Evans, J.P.; Di Virgilio, G.; McCarthy, N. Future Changes in Extreme Weather and Pyroconvection Risk Factors for Australian Wildfires. Sci. Rep. 2019, 9, 10073. [Google Scholar] [CrossRef] [Green Version]
- Canadell, J.G.; Meyer, C.P.; Cook, G.D.; Dowdy, A.; Briggs, P.R.; Knauer, J.; Pepler, A.; Haverd, V. Multi-Decadal Increase of Forest Burned Area in Australia Is Linked to Climate Change. Nat. Commun. 2021, 12, 6921. [Google Scholar] [CrossRef]
- Bowman, D.M.J.S.; Kolden, C.A.; Abatzoglou, J.T.; Johnston, F.H.; van der Werf, G.R.; Flannigan, M. Vegetation Fires in the Anthropocene. Nat. Rev. Earth Environ. 2020, 1, 500–515. [Google Scholar] [CrossRef]
- Myers, R.L. Living with Fire—Sustaining Ecosystems & Livelihoods through Integrated Fire Management; Global Fire Initiative; The Nature Conservancy: Tallahassee, FL, USA, 2006; 28p. [Google Scholar]
- Vargas-Cuentas, N.I.; Roman-Gonzalez, A. Satellite-Based Analysis of Forest Fires in the Bolivian Chiquitania and Amazon Region: Case 2019. IEEE Aerosp. Electron. Syst. Mag. 2021, 36, 38–54. [Google Scholar] [CrossRef]
- Parques Nacionales Naturales de Colombia vía Parque Isla de Salamanca. Available online: https://www.parquesnacionales.gov.co/portal/es/ecoturismo/parques/region-caribe/via-parque-isla-de-salamanca/ (accessed on 18 August 2022).
- El Espectador Incendios y Deforestación: Perdiendo un Paraíso en Isla Salamanca, Frente a Barranquilla. Available online: https://www.connectas.org/especiales/colombia-sentencias-ambientales-incumplidas/isla-de-salamanca.html (accessed on 11 October 2022).
- Duarte, A.L.; Schneider, I.L.; Artaxo, P.; Oliveira, M.L.S. Spatiotemporal Assessment of Particulate Matter (PM10 and PM2.5) and Ozone in a Caribbean Urban Coastal City. Geosci. Front. 2021, 13, 101168. [Google Scholar] [CrossRef]
- Silva, L.F.O.; Schneider, I.L.; Artaxo, P.; Núñez-Blanco, Y.; Pinto, D.; Flores, É.M.M.; Gómez-Plata, L.; Ramírez, O.; Dotto, G.L. Particulate Matter Geochemistry of a Highly Industrialized Region in the Caribbean: Basis for Future Toxicological Studies. Geosci. Front. 2021, 13, 101115. [Google Scholar] [CrossRef]
- Guan, S.; Wong, D.C.; Gao, Y.; Zhang, T.; Pouliot, G. Impact of Wildfire on Particulate Matter in the Southeastern United States in November 2016. Sci. Total Environ. 2020, 724, 138354. [Google Scholar] [CrossRef]
- Vergara, E.E.G.; Molina, M.A.C. Análisis Espacial de Incendios Forestales en la Provincia Del Azuay. Polo Conoc. Rev. Científico-Prof. 2020, 5, 337–361. [Google Scholar] [CrossRef]
- Blanco-Donado, E.P.; Schneider, I.L.; Artaxo, P.; Lozano-Osorio, J.; Portz, L.; Oliveira, M.L.S. Source Identification and Global Implications of Black Carbon. Geosci. Front. 2021, 13, 101149. [Google Scholar] [CrossRef]
- Boucher, O.; Randall, D. Clouds and Aerosols. In Climate Change 2013: The Physical Science Basis. Contribution of Working Group I to the Fifth Assessment Report of the Intergovernmental Panel on Climate Change; Cambridge University Press: Cambridge, UK, 2013. [Google Scholar]
- Forster, P.; Ramaswamy, V.; Artaxo, P.; Berntsen, T.; Betts, R.; Fahey, D.W.; Haywood, J.; Lean, J.; Lowe, D.C.; Myhre, G.; et al. Changes in Atmospheric Constituents and in Radiative Forcing. Chapter 2. In Climate Change 2007: The Physical Science Basis. Contribution of Working Group I to the Fourth Assessment Report of the Intergovernmental Panel on Climate Change; Cambridge University Press: Cambridge, UK, 2007; pp. 19–92. ISBN 978-0521-70596-7. [Google Scholar]
- Hoyos, N.; Correa-Metrio, A.; Sisa, A.; Ramos-Fabiel, M.A.; Espinosa, J.M.; Restrepo, J.C.; Escobar, J. The Environmental Envelope of Fires in the Colombian Caribbean. Appl. Geogr. 2017, 84, 42–54. [Google Scholar] [CrossRef]
- Bolaño-Truyol, J.; Schneider, I.L.; Cuadro, H.C.; Bolaño-Truyol, J.D.; Oliveira, M.L.S. Estimation of the Impact of Biomass Burning Based on Regional Transport of PM2.5 in the Colombian Caribbean. Geosci. Front. 2022, 13, 101152. [Google Scholar] [CrossRef]
- Rojano, R.; Arregocés, H.; Gámez Frías, E. Changes in Ambient Particulate Matter during the COVID-19 and Associations with Biomass Burning and Sahara Dust in Northern Colombia. Heliyon 2021, 7, e08595. [Google Scholar] [CrossRef]
- Ballesteros-González, K.; Sullivan, A.P.; Morales-Betancourt, R. Estimating the Air Quality and Health Impacts of Biomass Burning in Northern South America Using a Chemical Transport Model. Sci. Total Environ. 2020, 739, 139755. [Google Scholar] [CrossRef]
- Silva, L.F.O.; Milanes, C.; Pinto, D.; Ramirez, O.; Lima, B.D. Multiple Hazardous Elements in Nanoparticulate Matter from a Caribbean Industrialized Atmosphere. Chemosphere 2020, 239, 124776. [Google Scholar] [CrossRef]
- Castillo-Ramirez, M.; Berdejo, J.; Saltarín, M. Informe Anual de Calidad de Aire de Barranquilla; Establecimiento Público Ambiental Barranquilla Verde: Barranquilla, Colombia, 2018.
- de Barranquilla, A. Plan de Desarrollo Distrital de Barranquilla 2020–2023. Gac. Dist. 2020, 665, 569. [Google Scholar]
- Centro de Investigaciones Oceanográficas e Hidrográficas (CIOH). Climatología de Los Principales Puestos Del Caribe Colombiano, Barranquilla; CIOH: Cartagena, Colombia, 2010; Volume 12. [Google Scholar]
- U.S. Environmental Protection Agency (US EPA). Measurement Quality Objectives and Validation Templates; US EPA: Washington, DC, USA, 2017; Volume II, pp. 1–54.
- Barranquilla Verde Inicio Barranquilla Verde—Establecimiento Público Ambiental. Available online: http://barranquillaverde.gov.co/ (accessed on 12 October 2022).
- Domínguez-López, D.; Adame, J.A.; Hernández-Ceballos, M.A.; Vaca, F.; De la Morena, B.A.; Bolívar, J.P. Spatial and Temporal Variation of Surface Ozone, NO and NO2 at Urban, Suburban, Rural and Industrial Sites in the Southwest of the Iberian Peninsula. Environ. Monit. Assess. 2014, 186, 5337–5351. [Google Scholar] [CrossRef] [PubMed]
- Hoaglin, D.C.; Mosteller, F.; Tukey, J.W. Understanding Robust and Exploratory Data Analysis; Wiley: Hoboken, NJ, USA, 1983; ISBN 978-0-471-38491-5. [Google Scholar]
- Wilcox, R.R. Introduction to Robust Estimation and Hypothesis Testing; Academic Press: Cambridge, MA, USA, 2012; ISBN 9780123870155. [Google Scholar]
- Maronna, R.A.; Martin, R.D.; Yohai, V.J. Robust Statistics: Theory and Methods; John Wiley & Sons: Hoboken, NJ, USA, 2006; Volume 403, ISBN 978-0-470-01092-1. [Google Scholar]
- Parques Nacionales Naturales de Colombia Liquidado Incendio Forestal en el vía Parque Isla de Salamanca. Available online: https://www.parquesnacionales.gov.co/portal/es/liquidado-incendio-forestal-en-el-via-parque-isla-de-salamanca/ (accessed on 19 August 2022).
- Barranquilla Verde Barranquilla en Estado de Alerta Por Quemas del vía Parque Isla Salamanca. Available online: http://www.barranquillaverde.gov.co/noticias-detalle/barranquilla-en-estado-de-alerta-por-quemas-del-parque-isla-salamanca (accessed on 20 August 2022).
- van Buuren, S.; Groothuis-Oudshoorn, K. Mice: Multivariate Imputation by Chained Equations in R. J. Stat. Softw. 2011, 45, 1–67. [Google Scholar] [CrossRef] [Green Version]
- Carslaw, D.C. The Openair Manual—Open-Source Tools for Analysing Airpollution Data; Manual for Version 2.6-6; University of York: York, UK, 2019. [Google Scholar]
- RStudio R: El Proyecto R Para Computación Estadística. Available online: https://www.r-project.org/ (accessed on 7 September 2022).
- Li-Ramírez, J.A.; Pérez-Zapata, Á.M.; Duque-Méndez, N.D.; Aristizábal-Zuluaga, B.H. Generación y Representación de Indicadores de Calidad de Aire: Caso de Estudio Aplicado a Manizales. Iteckne 2016, 13, 174–184. [Google Scholar] [CrossRef] [Green Version]
- Bolaño-Ortiz, T.R.; Diaz-Gutiérrez, V.L.; Camargo-Caicedo, Y. ENSO and Light-Absorbing Impurities and Their Impact on Snow Albedo in the Sierra Nevada de Santa Marta, Colombia. Geosciences 2020, 10, 437. [Google Scholar] [CrossRef]
- Zheng, H.; Kong, S.; Chen, N.; Yan, Y.; Liu, D.; Zhu, B.; Xu, K.; Cao, W.; Ding, Q.; Lan, B.; et al. Significant Changes in the Chemical Compositions and Sources of PM2.5 in Wuhan since the City Lockdown as COVID-19. Sci. Total Environ. 2020, 739, 140000. [Google Scholar] [CrossRef] [PubMed]
- Cesari, D.; De Benedetto, G.E.; Bonasoni, P.; Busetto, M.; Dinoi, A.; Merico, E.; Chirizzi, D.; Cristofanelli, P.; Donateo, A.; Grasso, F.M.; et al. Seasonal Variability of PM2.5 and PM10 Composition and Sources in an Urban Background Site in Southern Italy. Sci. Total Environ. 2018, 612, 202–213. [Google Scholar] [CrossRef]
- Squizzato, S.; Masiol, M. Application of Meteorology-Based Methods to Determine Local and External Contributions to Particulate Matter Pollution: A Case Study in Venice (Italy). Atmos. Environ. 2015, 119, 69–81. [Google Scholar] [CrossRef]
- Bolaño-Díaz, S.; Camargo-Caicedo, Y.; Soro, T.D.; N’Dri, A.B.; Bolaño-Ortiz, T.R. Spatio-Temporal Characterization of Fire Using MODIS Data (2000–2020) in Colombia. Fire 2022, 5, 134. [Google Scholar] [CrossRef]
- Soro, T.D.; Koné, M.; N’Dri, A.B.; N’Datchoh, E.T. Identified Main Fire Hotspots and Seasons in Côte d’Ivoire (West Africa) Using MODIS Fire Data. S. Afr. J. Sci. 2021, 117, 1–13. [Google Scholar] [CrossRef]
- Squizzato, R.; Nogueira, T.; Martins, L.D.; Martins, J.A.; Astolfo, R.; Machado, C.B.; de Andrade, M.F.; de Freitas, E.D. Beyond Megacities: Tracking Air Pollution from Urban Areas and Biomass Burning in Brazil. NPJ Clim. Atmos. Sci. 2021, 4, 17. [Google Scholar] [CrossRef]
- Rolph, G.; Stein, A.; Stunder, B. Real-Time Environmental Applications and Display SYstem: READY. Environ. Model. Softw. 2017, 95, 210–228. [Google Scholar] [CrossRef]
- Stein, A.F.; Draxler, R.R.; Rolph, G.D.; Stunder, B.J.B.; Cohen, M.D.; Ngan, F. NOAA’s HYSPLIT Atmospheric Transport and Dispersion Modeling System. Bull. Am. Meteorol. Soc. 2015, 96, 2059–2077. [Google Scholar] [CrossRef]
- Mendez-Espinosa, J.F.; Belalcazar, L.C.; Morales Betancourt, R. Regional Air Quality Impact of Northern South America Biomass Burning Emissions. Atmos. Environ. 2019, 203, 131–140. [Google Scholar] [CrossRef]
- Rivera, N.; Mata, C.; Lalangui, J.; Bermeo, A.; Valdez, L.; Morocho, J. Análisis de Emisiones Contaminantes Originados por el Parque Automotor En Cuenca. Rev. Ibérica Sist. Tecnol. Inf. 2020, 30, 376–392. [Google Scholar]
- Ordónez, C.; Mathis, H.; Furger, M.; Henne, S.; Hüglin, C.; Staehelin, J.; Prévǒt, A.S.H. Changes of Daily Surface Ozone Maxima in Switzerland in All Seasons from 1992 to 2002 and Discussion of Summer 2003. Atmos. Chem. Phys. 2005, 5, 1187–1203. [Google Scholar] [CrossRef] [Green Version]
- Jacob, D.J.; Winner, D.A. Effect of Climate Change on Air Quality. Atmos. Environ. 2009, 43, 51–63. [Google Scholar] [CrossRef] [Green Version]
- Augusto, S.; Ratola, N.; Tarín-Carrasco, P.; Jiménez-Guerrero, P.; Turco, M.; Schuhmacher, M.; Costa, S.; Teixeira, J.P.; Costa, C. Population Exposure to Particulate-Matter and Related Mortality Due to the Portuguese Wildfires in October 2017 Driven by Storm Ophelia. Environ. Int. 2020, 144, 106056. [Google Scholar] [CrossRef]
- Reid, C.E.; Brauer, M.; Johnston, F.H.; Jerrett, M.; Balmes, J.R.; Elliott, C.T. Critical Review of Health Impacts of Wildfire Smoke Exposure. Environ. Health Perspect. 2016, 124, 1334–1343. [Google Scholar] [CrossRef] [Green Version]
- Euphrasie-Clotilde, L.; Plocoste, T.; Brute, F.N. Particle Size Analysis of African Dust Haze over the Last 20 Years: A Focus on the Extreme Event of June 2020. Atmosphere 2021, 12, 502. [Google Scholar] [CrossRef]
- Mayol-Bracero, O.L.; Prospero, J.M.; Ogren, J.A.; Sheridan, P.J.; Colarco, P.R.; Holben, B.; Yu, H.; Mendez-Lazaro, P.; Muller-Karger, F.E.; Otis, D.B.; et al. “Godzilla” African Dust Event of June 2020: Impacts of Air Quality in the Greater Caribbean Basin, the Gulf of Mexico and the United States. In AGU Fall Meeting Abstracts; American Geophysical Union: Washington, DC, USA, 2020; Volume 2020, p. A016-02. [Google Scholar]
Figure 1.
Map of the study area.

Figure 2.
Spatial-temporal distribution of fire events in Isla Salamanca Natural Park.

Figure 3.
Pollutants rose for particulate matter (PM10 and PM2.5) (2020). (a) Móvil station. (b) Tres Ave Marías Station. (c) Policía station.
Figure 3.
Pollutants rose for particulate matter (PM10 and PM2.5) (2020). (a) Móvil station. (b) Tres Ave Marías Station. (c) Policía station.

Figure 4.
Graph of the conditional probability function (CPF) of concentrations of PM10 and PM2.5 (2020); (a) Móvil station, (b) Tres Ave Marias station; (c) Policía station.
Figure 4.
Graph of the conditional probability function (CPF) of concentrations of PM10 and PM2.5 (2020); (a) Móvil station, (b) Tres Ave Marias station; (c) Policía station.

Figure 5.
Bivariate polar graph of concentrations of PM10 and PM2.5 (2020); (a) Móvil station, (b) Tres Ave Marias station; (c) Policía station.
Figure 5.
Bivariate polar graph of concentrations of PM10 and PM2.5 (2020); (a) Móvil station, (b) Tres Ave Marias station; (c) Policía station.

Figure 6.
(a) Number of times the PM2.5 standard values were exceeded (2018–2020); (b) number of times the PM10 standard values were exceeded.
Figure 6.
(a) Number of times the PM2.5 standard values were exceeded (2018–2020); (b) number of times the PM10 standard values were exceeded.

Figure 7.
Daily concentrations of particulate matter (PM10) In the fire period from 1 March 2020 to 31 August 2020. Dashed lines identify the allowed number of exceedances per 24 h.
Figure 7.
Daily concentrations of particulate matter (PM10) In the fire period from 1 March 2020 to 31 August 2020. Dashed lines identify the allowed number of exceedances per 24 h.

Figure 8.
Record of daily concentrations of particulate matter at three monitoring stations a. PM2.5. In the fire period from 1 March 2020 to 31 August 2020. Dashed lines identify the allowed number of exceedances per 24 h.
Figure 8.
Record of daily concentrations of particulate matter at three monitoring stations a. PM2.5. In the fire period from 1 March 2020 to 31 August 2020. Dashed lines identify the allowed number of exceedances per 24 h.

Figure 9.
Backward of the air masses arriving in the stations (A) Policía station June 2020. (B) Policía station august 2020. (C) Tres Ave Marías Station June 2020.
Figure 9.
Backward of the air masses arriving in the stations (A) Policía station June 2020. (B) Policía station august 2020. (C) Tres Ave Marías Station June 2020.


Table 1.
Criteria pollutants maximum permissible level.
| Pollutant | Maximum Permissible Level (µg/m3) | Averaging Time |
|---|---|---|
| PM10 | 50 | Annual |
| 75 | 24 h | |
| PM2.5 | 25 | Annual |
| 37 | 24 h | |
| SO2 | 50 | 24 h |
| 100 | 1 h | |
| NO2 | 60 | Annual |
| 200 | 1 h | |
| O3 | 100 | 8 h |
| CO | 5000 | 8 h |
| 35,000 | 1 h |
Table 2.
Data on fires recorded in Isla Salamanca Natural Park.
| Year | Number of Fires | Total Hectares Burned |
|---|---|---|
| 2015 | 7 | 115.97 |
| 2016 | 4 | 10.2 |
| 2017 | 7 | 101.84 |
| 2018 | 3 | 9.9 |
| 2019 | 5 | 21 |
| 2020 | 9 | 256.9 |
Table 3.
Spearman correlations between pollutants and meteorological variables for all monitoring stations (2019–2020).
Table 3.
Spearman correlations between pollutants and meteorological variables for all monitoring stations (2019–2020).
| Station | O3 | PM10 | PM2.5 | Dir. Wind | Vel. from the Wind | Temp. | Rel. Hum. | Precip. | |
|---|---|---|---|---|---|---|---|---|---|
| Policía | CO | −0.197 | 0.157 | 0.224 | 0.013 | 0.011 | −0.037 | 0.174 | −0.024 |
| O3 | 1 | 0.005 | −0.058 | −0.053 | 0.26 | 0.549 | −0.686 | −0.034 | |
| PM10 | 0.005 | 1 | 0.671 | −0.037 | 0.15 | −0.078 | 0.145 | −0.085 | |
| PM2.5 | −0.058 | 0.671 | N/A | 0.076 | 0.054 | −0.132 | 0.234 | −0.062 | |
| Móvil | CO | −0.537 | 0.093 | 0.169 | −0.093 | 0.112 | 0.082 | −0.076 | 0.197 |
| O3 | 1 | −0.235 | −0.255 | 0.069 | −0.114 | 0.189 | −0.062 | −0.211 | |
| PM10 | −0.235 | 1 | 0.714 | −0.109 | 0.061 | −0.106 | 0.15 | −0.105 | |
| PM2.5 | −0.255 | 0.714 | 1 | −0.039 | 0.092 | −0.055 | 0.066 | −0.095 | |
| Tres Ave Marias | CO | 0.076 | 0.266 | −0.367 | 0.426 | −0.357 | −0.366 | −0.358 | −0.576 |
| O3 | 1 | 0.185 | −0.205 | −0.034 | 0.058 | 0.157 | −0.457 | −0.189 | |
| PM10 | 0.185 | 1 | 0.199 | 0.142 | −0.128 | −0.331 | −0.141 | −0.426 | |
| PM2.5 | −0.205 | 0.199 | 1 | −0.471 | 0.46 | 0.297 | 0.575 | 0.538 | |
Table 4.
Descriptive statistical analysis and stations of interest (2018–2020).
| Station | Pollutant | N | Minimum | Maximum | Average | Standard Deviation | 95% Confidence Interval | |
|---|---|---|---|---|---|---|---|---|
| Lower | Upper | |||||||
| Policía | CO | 26,304 | 0 | 7030.28 | 445.92 | 563.45 | 439.11 | 452.73 |
| O3 | 26,304 | 0 | 228.936 | 27.21 | 15.2 | 27.03 | 27.39 | |
| PM10 | 26,304 | 0 | 329.54 | 49.37 | 28.96 | 49.02 | 49.72 | |
| PM2.5 | 26,304 | 0 | 275.08 | 16.82 | 14.41 | 16.65 | 16.99 | |
| Tres Ave Marias | CO | 26,304 | 0 | 7411.93 | 391.42 | 344.92 | 387.25 | 395.59 |
| O3 | 26,304 | 0 | 172.09 | 34.98 | 14.22 | 34.81 | 35.15 | |
| PM10 | 26,304 | 0 | 1424.33 | 38.06 | 28.94 | 37.71 | 38.41 | |
| PM2.5 | 26,304 | 0 | 135.01 | 14.25 | 12.09 | 14.10 | 14.40 | |
| Móvil | CO | 26,304 | 0 | 221.00 | 312.06 | 200.46 | 309.64 | 314.48 |
| O3 | 26,304 | 0 | 2627.24 | 88.44 | 142.25 | 86.72 | 90.16 | |
| PM10 | 26,304 | 0 | 263.98 | 42.11 | 27.45 | 41.78 | 42.44 | |
| PM2.5 | 26,304 | 0 | 278.70 | 14.76 | 11.32 | 14.62 | 14.90 | |
Publisher’s Note: MDPI stays neutral with regard to jurisdictional claims in published maps and institutional affiliations. |
© 2022 by the authors. Licensee MDPI, Basel, Switzerland. This article is an open access article distributed under the terms and conditions of the Creative Commons Attribution (CC BY) license (https://creativecommons.org/licenses/by/4.0/).
Share and Cite
MDPI and ACS Style
Bolaño-Diaz, S.; Camargo-Caicedo, Y.; Tovar Bernal, F.; Bolaño-Ortiz, T.R. The Effect of Forest Fire Events on Air Quality: A Case Study of Northern Colombia. Fire 2022, 5, 191. https://doi.org/10.3390/fire5060191
AMA Style
Bolaño-Diaz S, Camargo-Caicedo Y, Tovar Bernal F, Bolaño-Ortiz TR. The Effect of Forest Fire Events on Air Quality: A Case Study of Northern Colombia. Fire. 2022; 5(6):191. https://doi.org/10.3390/fire5060191
Chicago/Turabian StyleBolaño-Diaz, Sindy, Yiniva Camargo-Caicedo, Fredy Tovar Bernal, and Tomás R. Bolaño-Ortiz. 2022. "The Effect of Forest Fire Events on Air Quality: A Case Study of Northern Colombia" Fire 5, no. 6: 191. https://doi.org/10.3390/fire5060191