
Study on Pyrolysis Characteristics of Chinese Fir under Different Natural Aging Times
School of Safety Engineering, China University of Mining and Technology, Xuzhou 221116, China
*
Author to whom correspondence should be addressed.
Fire 2022, 5(5), 161; https://doi.org/10.3390/fire5050161
Submission received: 20 September 2022
/
Revised: 1 October 2022
/
Accepted: 3 October 2022
/
Published: 6 October 2022
(This article belongs to the Special Issue Unusual Fire in Open and Confined Space)
Abstract
:The thermal degradation behavior of naturally aging Chinese fir was investigated using a STA 449 thermal analyzer. The Chinese fir with different natural aging times showed different pyrolysis behaviors. The longer the natural aging time, the lower the initial pyrolysis temperature of Chinese fir. The results of activation energy estimated by Kissinger–Akahira–Sunose (KAS) method and Flynn–Wall–Ozawa (FWO) method are almost the same. However, with the increase in natural aging time, the activation energy of fir is increasing. The suitable pyrolysis reaction model of nature aging—10 Chinese fir was attributed to the ‘‘diffusion-Jander’’ (D3) model. Furthermore, a nth order reaction model serves for nature aging—70 and nature aging—100 Chinese fir reaction mechanism.
1. Introduction
Chinese fir is not easy to moth, and the wood itself is light and not easy to deform, so it is an ideal building material. It is widely used in ancient buildings in China. However, fir as a fuel, and more easily to be ignited, resulting in the use of fir as the main building material of Chinese ancient buildings, have a high fire load and fire risk. There are many fire accidents in ancient buildings every year [1], such as the 2019 Notre Dame fire in Paris and the 2022 Wuyishan Millennium Temple fire. Pyrolysis is the first step in fire and ignition [2,3]. It is the product of the material being heated and pyrolyzed in an inert or air atmosphere to form different phases [4]. Therefore, it is very important to study the pyrolysis process of Chinese fir.
Many studies on the pyrolysis characteristics of biomass uses the thermogravimetric analysis (TGA) technique. Liu et al. [5] used KAS and FWO methods to estimate the activation energy of the Artemisia apiacea stem. The activation energy of the Artemisia apiacea stem was calculated by FWO method and KAS method, and the average values were 174.79 and 174.41 kJ mol−1, respectively. There are also many studies on the pyrolysis characteristics of woody biomass. Ding et al. [3] studied the pyrolysis behavior of cork and hardwood. The activation energy of softwood and hardwood at different conversion rates was estimated by FWO method. The reaction mechanism was predicted by CR method. The best model to predict is the diffusion mechanism, or reaction order (2nd to 3rd). Huang et al. [6] calculated the activation energy of sapwood and heartwood of eight kinds of wood. The activation energy of heartwood and sapwood of eight kinds of wood is between 120~140 kJ mol−1. Yao et al. [7] estimated the average activation energy of hardwood (maple) and cork (pine) during pyrolysis, which is about 150 kJ/mol for hardwood and about 160 kJ/mol for cork. There are also many studies on the effect of material aging on its pyrolysis behavior. The effect of thermal aging on the pyrolysis characteristics of LDPE insulation fine wires was studied by Wang et al. [8], who found that the longer the thermal aging time, the higher the activation energy of the LDPE insulation fine wires. However, the change in activation energy and reaction mechanism function of wood with different natural aging times have not been studied.
In this paper, the simultaneous thermal analyzer was used to analyze the mass loss and mass loss rate of Chinese fir samples with natural aging time of 10 years, 70 years, and 100 years at four different heating rates of 5 K/min, 10 K/min, 20 K/min, and 40 K/min. The FWO method and KAS method were selected to estimate the activation energy of Chinese fir at different natural aging times, and the reaction mechanism function of Chinese fir at different natural aging times was determined by the CR method.
2. Materials and Experimental Procedure
2.1. Materials
The Chinese firs with different natural aging times used in this experiment were taken from ancient dwellings built in different years during the Sichuan Province. The natural aging time was determined by an accelerator mass spectrometer (AMS) 14C for 10 years, 70 years, and 100 years, respectively. Before the thermogravimetric experiment begins, the sample is ground to a particle size of less than 0.2 mm. The samples are placed in a drying case and kept at 80 °C for 24 h to remove moisture [9,10]. Figure 1 shows Chinese fir samples with different natural aging times. Under the influence of the external environment, such as sunlight and rainwater, the longer the natural aging time of Chinese fir, the more hemicellulose is degraded. The decrease in hemicellulose content in wood will lead to the deepening of wood color [11].
2.2. Experimental
The thermogravimetric experiment was carried out by an STA 449 thermal analyzer (as shown in Figure 2) with TA instrument. When the temperature reaches 1000 K, the mass of the fir sample does not change, and all components of the fir have been pyrolyzed into charcoal. Therefore, the temperature range selected in the experiment is 300 K–1000 K. In order to study the effect of different heating rates on the pyrolysis characteristics of Chinese fir, four different heating rates of 5, 10, 20, and 40 K/min were selected. In each experiment, about 6 mg samples were evenly distributed in an aluminum crucible, and 100 mL min−1 nitrogen was continuously introduced to ensure that the entire experimental process was in a nitrogen environment [12,13]. The temperature of the laboratory is 30 °C and the atmospheric pressure is 100.07 kPa. Repeat each experiment three times.
3. Results and Discussion
3.1. Thermal Degradation
Figure 3a–c shows the mass loss (left) and mass loss rate (right) of Chinese fir in nitrogen atmosphere at heating rates of 5 K/min, 10 K/min, 20 K/min, and 40 K/min. When the temperature is less than 500 K, wood pyrolysis with moisture evaporation, structural shrinkage, and material stiffness hardening, which is preparing for subsequent pyrolysis into carbon, and the overall quality changes by little. This stage is called “glass transition” [14]. As the mass and mass loss curve shows, the mass change is the largest and the mass loss rate reaches its peak in the 500 to 700 K range, so the main pyrolysis stage of fir is 500 to 700 K. After 700 K, the mass loss becomes smaller, and a small amount of lignin is pyrolyzed slowly.
Since the chemical bonds in the composition and molecular structure of Chinese fir are the same, the mass loss curves and the mass loss rate curve at different heating rates have the same trend with temperature. However, when the heating rate increases, the whole pyrolysis curve gradually moves to the high temperature side, showing a higher initial pyrolysis temperature for Tonset, 5% conversion corresponding temperature T5%, 50% conversion corresponding temperature T50%, and pyrolysis termination temperature Tfinal. This may be due to the increase in heating rate, and the reaction mechanism has changed, yet it may also be due to the high heating rate between the furnace and the sample heat transfer efficiency is low, which is caused by thermal lag [15,16,17].
Figure 4a–d show the mass loss and mass loss rate of samples with different natural aging degrees under four heating rates in the nitrogen atmosphere. The mass loss curve of Chinese fir with different natural aging times has a similar trend. The mass loss rate curve has only one peak, because the main decomposition or transformation component of Chinese fir is hemicellulose before 600 K [17]; whereas, the content of hemicellulose in Chinese fir is less, with only 12% on average, so only one peak can be observed on the mass loss curve. Regardless of the heating rate, the thermogravimetric curve has a similar trend, but the onset temperature of the sample thermal weight loss and the temperature T5% corresponding to the 5% conversion rate decrease with the increase in natural aging time. There is also a slight difference between the temperature Tpeak corresponding to the peak mass loss rate and the peak mass loss rate MLRpeak. This indicated that the pyrolysis difficulty of Chinese fir decreased after natural aging, and the chemical composition and structure of Chinese fir were decomposed and released during natural aging, which changed the pyrolysis characteristics [18]. Table 1 lists the pyrolysis parameters of Chinese fir with different natural aging degrees.
3.2. Estimation of Activation Energy
In this paper, FWO [19,20,21] method and KAS [22,23] method were used to solve the activation energy. The KAS method as follows:
In the equation, stands for heating rate (K s−1); stands for common gas constant (8.314 J mol−1 K−1); represents the pre-exponential factor (s−1); which can be expressed as the following equation is the transformed integral function; stands for reactive activation energy (J mol−1); represents absolute temperature (K).
In equation , as the conversion rate means (mi − mt)/(mi − mf). Under a different heating rate with step 0.1, was chosen from 0.1 to 0.8. Where mi, mf are the initial and post-reaction mass, respectively, and mt represents the mass at time t. stands for conversion function.
Figure 5a–c shows the relationship between ln(β/[T]2) and 1000/T under a different natural aging time. The slope of ln(β/[T]2) and 1000/T is Eα. The Eα values of Chinese fir estimated by the KAS method under different natural aging times are shown in Table 2. It was found that Eα increases with the increase in α. At the same heating rate, the activation energy of natural aging—10 is the highest and that of natural aging—100 is the lowest. The mean values of Eα were187, 182, and177 kJ mol−1 for natural ageing—10, natural ageing—70, and natural ageing—100, respectively.
Derived from conversion methods such as integration, the FWO based on the Doyle approximation can be indicated as:
The reaction activation energy can be estimated from the slope of to 1/T. Figure 6a–c shows the relationship between lnβ and 1000/T under different natural aging times. Table 2 shows the activation energy values calculated using the FWO method, for natural ageing—10, natural ageing—70, and natural ageing—100. For natural ageing—10, Eα with an average value of 187 kJ mol−1 ranges from 176 to 204 kJ mol−1; for natural ageing—70, Eα with an average value of 182 kJ mol−1 ranges from 176 to198 kJ mol−1; for natural ageing—100, Eα with an average value of 177 kJ mol−1 ranges from 162 to 189 kJ mol−1.
The activation energy values of natural aging—10, natural aging—70, and natural aging—100 estimated using the FWO and KAS methods which are summarized in Figure 7. The values of the activation energy estimated by KAS and FWO methods are almost the same. However, with the increase in natural aging time, the activation energy of fir decreases. It must be emphasized that since the activation energy of fir decreases with the increase in natural aging time, and the lower the activation energy of fir, the less heat is required for pyrolysis of fir, which means fir is easier to pyrolysis. This parameter indicates that the longer the natural aging time of fir, the more easily it is ignited (Table 2).
3.3. Determination of Reaction Mechanism
Reaction mechanism of Chinese Fir by Coats-Redfern (CR) method [24]. The expression is as follows:
When the mechanism function G(α) is selected, the value of the activation energy can be obtained from the slope—Eα/R. CR method by taking a straight line between ln G(α)/T and 1/T. The various forms of G(α) are shown in Table 3. By comparing the activation energy estimated by the FWO method and the KAS method with the activation energy estimated by the CR method, the optimal reaction mechanism function is determined [5,25]. Table 4, Table 5 and Table 6 list the values of activation energy and pre-exponential factor of Chinese fir with different natural aging times. Each reaction mechanism has good reliability (R2 = 0.95–0.99).
For the natural aging—10 Chinese fir, the activation energy value estimated by the D3 (170.03 kJ mol−1) model is the closest to the activation energy value obtained by the FWO method (187.63 kJ mol−1) and the KAS method (187.66 kJ mol−1). Therefore, the reaction mechanism function of natural aging—10 fir is the diffusion-Jander model. The results are consistent with Ding’s study of fresh hardwood and softwood [3]. Table 5 and Table 6 list the activation energy values estimated based on the 16 reaction models recommended by the ICTAC Kinetic Committee for natural aging—70 Chinese fir and natural aging—100 Chinese fir. Among all reaction models, the activation energy predicted by the D3 model of natural aging—70 Chinese fir and natural aging—100 Chinese fir was the largest, which was 150.05 to 155.00 kJ mol−1 and 138.16 to 146.26 kJ mol−1, respectively, far less than the activation energy predicted by the FWO and KAS methods [26,27,28].
In previous studies on biomass pyrolysis, researchers used the nth order reaction model, and the mechanism function is:
where ,
Martín-Lara et al. [29] found that the fifth order reaction model was more suitable for the pyrolysis process of olive trees. Damartzis et al. [30] studied the kinetic model for stems and leaves of carnation. The results showed that the reaction order of stems was 8.39~9.21 and the reaction order for leaves was 13.65~14.85 at different heating rates.
Hence, natural aging—70 Chinese fir and natural aging—100 Chinese fir, according to the nth order reaction model. When n = 3.8, the activation energy ranges from 182.15 to 182.32 kJ mol−1 for natural aging—70 Chinese fir, which is similar to those from FWO (176–198 kJ mol−1) or KAS (177–198 kJ mol−1) methods. When n = 3.7, the activation energy is 177.25 to 177.55 kJ mol−1 for natural aging—100 Chinese fir, which is similar to those from FWO (162–189 kJ mol−1) and KAS (162–190 kJ mol−1) methods.
4. Conclusions
In this study, the simultaneous thermal analyzer was used to analyze the mass loss and mass loss rate of Chinese fir samples with a natural aging time of 10 years, 70 years, and 100 years at four different heating rates of 5 K/min, 10 K/min, 20 K/min, and 40 K/min. The FWO method and KAS method were selected to estimate the activation energy of Chinese fir, and the reaction mechanism function of Chinese fir was determined by CR method.
No matter how the heating rate changes, the onset temperature of the sample thermal weight loss and the temperature T5% corresponding to the 5% conversion rate decreases with the increase in the Chinese fir’s natural aging time. A slight difference between the temperature Tpeak corresponding to the peak mass loss rate and the peak mass loss rate MLRpeak. The activation energy results of Chinese fir under different natural aging times estimated by the KAS method and FWO method have little difference. However, with the increase in natural aging time, the activation energy of Chinese fir is increasing. The best model of natural aging—10 Chinese fir is the diffusion-Varance model. The nth order reaction model was derived, and the predicted activation energies were in good agreement with those estimated by FWO and KAS methods for natural aging—70 and natural aging—100. The reaction orders of natural aging—70 Chinese fir and natural aging—100 Chinese fir are 3.8 and 3.7, respectively. In addition, it can be inferred that the longer the natural aging time of fir, the more easily pyrolysis occurs and thus the easier it is to ignite.
Author Contributions
Investigation, G.Z. and Y.Z.; Methodology, H.Y. and G.Z.; Writing—review & editing, G.Z. and Y.Z. All authors have read and agreed to the published version of the manuscript.
Funding
This research received no external funding.
Institutional Review Board Statement
Not applicable.
Informed Consent Statement
Not applicable.
Data Availability Statement
Not applicable.
Conflicts of Interest
The authors declare no conflict of interest.
Nomenclature
| Flame growth factor (kW/s²) | |
| A | Refers to prefactor |
| C | Empirical constants, |
| Material thickness (m) | |
| Flame diameter (m) | |
| Reaction activation energy (kJ/mol) | |
| EHC | Effective heat of combustion, ratio of heat release rate to mass loss rate (MJ/kg) |
| Gravitational acceleration (m/s2) | |
| HRR | Heat release rate, combustion release rate per unit area of material (kW/m2) |
| MLR | Mass loss rate (%/K) |
| MLRpeak | Peak mass loss rate (%/K) |
| n | Number of Reaction Levels |
| Power of combustion source (kW) | |
| R | Universal gas contants 8.314 × 10⁻³ J/(K·mol) |
| Flame spread duration (s) | |
| T5% | 5%Conversion rate corresponding to temperature (K) |
| T | Time (s) |
| Tpeak | Temperature corresponding to peak mass loss rate (K) |
References
- Li, H.Q.; Yu, Y.; Yu, X. On Fire Protection Problems and its Countermeasures about Chinese Ancient Architecture. Appl. Mech. Mater. 2012, 204–208, 3365–3368. [Google Scholar] [CrossRef]
- Wang, G.; Li, W.; Li, B.; Chen, H. TG study on pyrolysis of biomass and its three components under syngas. Fuel 2008, 87, 552–558. [Google Scholar] [CrossRef]
- Ding, Y.; Ezekoye, O.A.; Lu, S.; Wang, C.; Zhou, R. Comparative pyrolysis behaviors and reaction mechanisms of hardwood and softwood. Energy Convers. Manag. 2016, 132, 102–109. [Google Scholar] [CrossRef]
- Martin-Gullon, I.; Esperanza, M.; Font, R. Kinetic model for the pyrolysis and combustion of poly-(ethylene terephthalate) (PET). J. Anal. Appl. Pyrolysis 2001, 58–59, 635–650. [Google Scholar] [CrossRef]
- Liu, H.; Wang, C.; Zhao, W.; Yang, S.; Hou, X. Pyrolysis characteristics and kinetic modeling of Artemisia apiacea by thermogravimetric analysis. J. Therm. Anal. 2017, 131, 1783–1792. [Google Scholar] [CrossRef]
- Huang, R.; Teng, Z.; Li, S. Gaussian model analysis and thermal decomposition kinetics of nature fibers. J. Clean. Prod. 2022, 357, 131784. [Google Scholar] [CrossRef]
- Yao, F.; Wu, Q.; Lei, Y.; Guo, W.; Xu, Y. Thermal decomposition kinetics of natural fibers: Activation energy with dynamic thermogravimetric analysis. Polym. Degrad. Stab. 2008, 93, 90–98. [Google Scholar] [CrossRef]
- Wang, Z.; Wei, R.; Ning, X.; Xie, T.; Wang, J. Thermal degradation properties of LDPE insulation for new and aged fine wires. J. Therm. Anal. 2018, 137, 461–471. [Google Scholar] [CrossRef]
- Liu, H.-P.; Liang, W.-X.; Qin, H.; Wang, Q. Synergy in co-combustion of oil shale semi-coke with torrefied cornstalk. Appl. Therm. Eng. 2016, 109, 653–662. [Google Scholar] [CrossRef]
- Duan, L.; Chen, J.; Jiang, Y.; Li, X.; Longhurst, P.; Lei, M. Experimental and kinetic study of thermal decomposition behaviour of phytoremediation derived Pteris vittata. J. Therm. Anal. 2016, 128, 1207–1216. [Google Scholar] [CrossRef]
- Kránitz, K.; Sonderegger, W.; Bues, C.-T.; Niemz, P. Effects of aging on wood: A literature review. Wood Sci. Technol. 2015, 50, 7–22. [Google Scholar] [CrossRef]
- Wadhwani, R.; Sutherland, D.; Moinuddin, K.A.M.; Joseph, P. Kinetics of pyrolysis of litter materials from pine and eucalyptus forests. J. Therm. Anal. 2017, 130, 2035–2046. [Google Scholar] [CrossRef] [Green Version]
- Yang, P.; He, X.; Zhang, W.; Qiao, Y.; Wang, F.; Tang, K. Study on thermal degradation of cattlehide collagen fibers by simultaneous TG–MS–FTIR. J. Therm. Anal. 2016, 127, 2005–2012. [Google Scholar] [CrossRef]
- Lenth, C.A.; Kamke, F.A. Moisture dependent softening behavior of wood. Wood Fiber Sci. 2001, 33, 492–507. [Google Scholar]
- Conesa, J.A.; Marcilla, A.; Font, R.; Caballero, J. Thermogravimetric studies on the thermal decomposition of polyethylene. J. Anal. Appl. Pyrolysis 1996, 36, 1–15. [Google Scholar] [CrossRef]
- Park, J.W.; Oh, S.C.; Lee, H.P.; Kim, H.T.; Yoo, K.O. A kinetic analysis of thermal degradation of polymers using a dynamic method. Polym. Degrad. Stab. 2000, 67, 535–540. [Google Scholar] [CrossRef]
- Yang, J.; Miranda, R.; Roy, C. Using the DTG curve fitting method to determine the apparent kinetic parameters of thermal decomposition of polymers. Polym. Degrad. Stab. 2001, 73, 455–461. [Google Scholar] [CrossRef]
- Yang, H.; Yan, R.; Chen, H.; Lee, D.H.; Zheng, C. Characteristics of hemicellulose, cellulose and lignin pyrolysis. Fuel 2007, 86, 1781–1788. [Google Scholar] [CrossRef]
- Flynn, J.H.; Wall, L.A. General treatment of the thermogravimetry of polymers, Journal of research of the National Bureau of Standards. Section A. Phys. Chem. 1966, 70, 487. [Google Scholar]
- Flynn, J.H.; Wall, L.A. A quick, direct method for the determination of activation energy from thermogravimetric data. J. Polym. Sci. Part B Polym. Lett. 1966, 4, 323–328. [Google Scholar] [CrossRef]
- Ozawa, T. A new method of analyzing thermogravimetric data. Bull. Chem. Soc. Jan. 1965, 38, 1881–1886. [Google Scholar] [CrossRef] [Green Version]
- Kissinger, H.E. Variation of peak temperature with heating rate in differential thermal analysis. J. Res. Natl. Bur. Stand. 1956, 57, 217. [Google Scholar] [CrossRef]
- Kissinger, H.E. Reaction Kinetics in Differential Thermal Analysis. Anal. Chem. 1957, 29, 1702–1706. [Google Scholar] [CrossRef]
- Oh, S.C.; Jun, H.C.; Kim, H.T. Thermogravimetric Evaluation for Pyrolysis Kinetics of Styrene-Butadiene Rubber. J. Chem. Eng. Jpn. 2003, 36, 1016–1022. [Google Scholar] [CrossRef]
- Chen, J.; Fan, X.; Jiang, B.; Mu, L.; Yao, P.; Yin, H.; Song, X. Pyrolysis of oil-plant wastes in a TGA and a fixed-bed reactor: Thermochemical behaviors, kinetics, and products characterization. Bioresour. Technol. 2015, 192, 592–602. [Google Scholar] [CrossRef]
- Maurya, R.; Ghosh, T.; Saravaia, H.; Paliwal, C.; Ghosh, A.; Mishra, S. Non-isothermal pyrolysis of de-oiled microalgal biomass: Kinetics and evolved gas analysis. Bioresour. Technol. 2016, 221, 251–261. [Google Scholar] [CrossRef]
- Vyazovkin, S.; Sbirrazzuoli, N. Isoconversional Kinetic Analysis of Thermally Stimulated Processes in Polymers. Macromol. Rapid Commun. 2006, 27, 1515–1532. [Google Scholar] [CrossRef]
- Naktiyok, J.; Bayrakçeken, H.; Özer, A.K.; Gülaboğlu, M.Ş. Investigation of combustion kinetics of Umutbaca-lignite by thermal analysis technique. J. Therm. Anal. Calorim. 2017, 129, 531–539. [Google Scholar] [CrossRef]
- Martín-Lara, M.A.; Blázquez, G.; Zamora, M.C.; Calero, M. Kinetic modelling of torrefaction of olive tree pruning. Appl. Therm. Eng. 2017, 113, 1410–1418. [Google Scholar] [CrossRef]
- Damartzis, T.; Vamvuka, D.; Sfakiotakis, S.; Zabaniotou, A. Thermal degradation studies and kinetic modeling of cardoon (Cynara cardunculus) pyrolysis using thermogravimetric analysis (TGA). Bioresour. Technol. 2011, 102, 6230–6238. [Google Scholar] [CrossRef]
Figure 1.
Chinese fir samples with different natural aging times: (a) Natural aging—10; (b) Natural aging—70; (c) Natural aging—100.
Figure 1.
Chinese fir samples with different natural aging times: (a) Natural aging—10; (b) Natural aging—70; (c) Natural aging—100.

Figure 2.
The picture of STA 449Thermal analyzer.
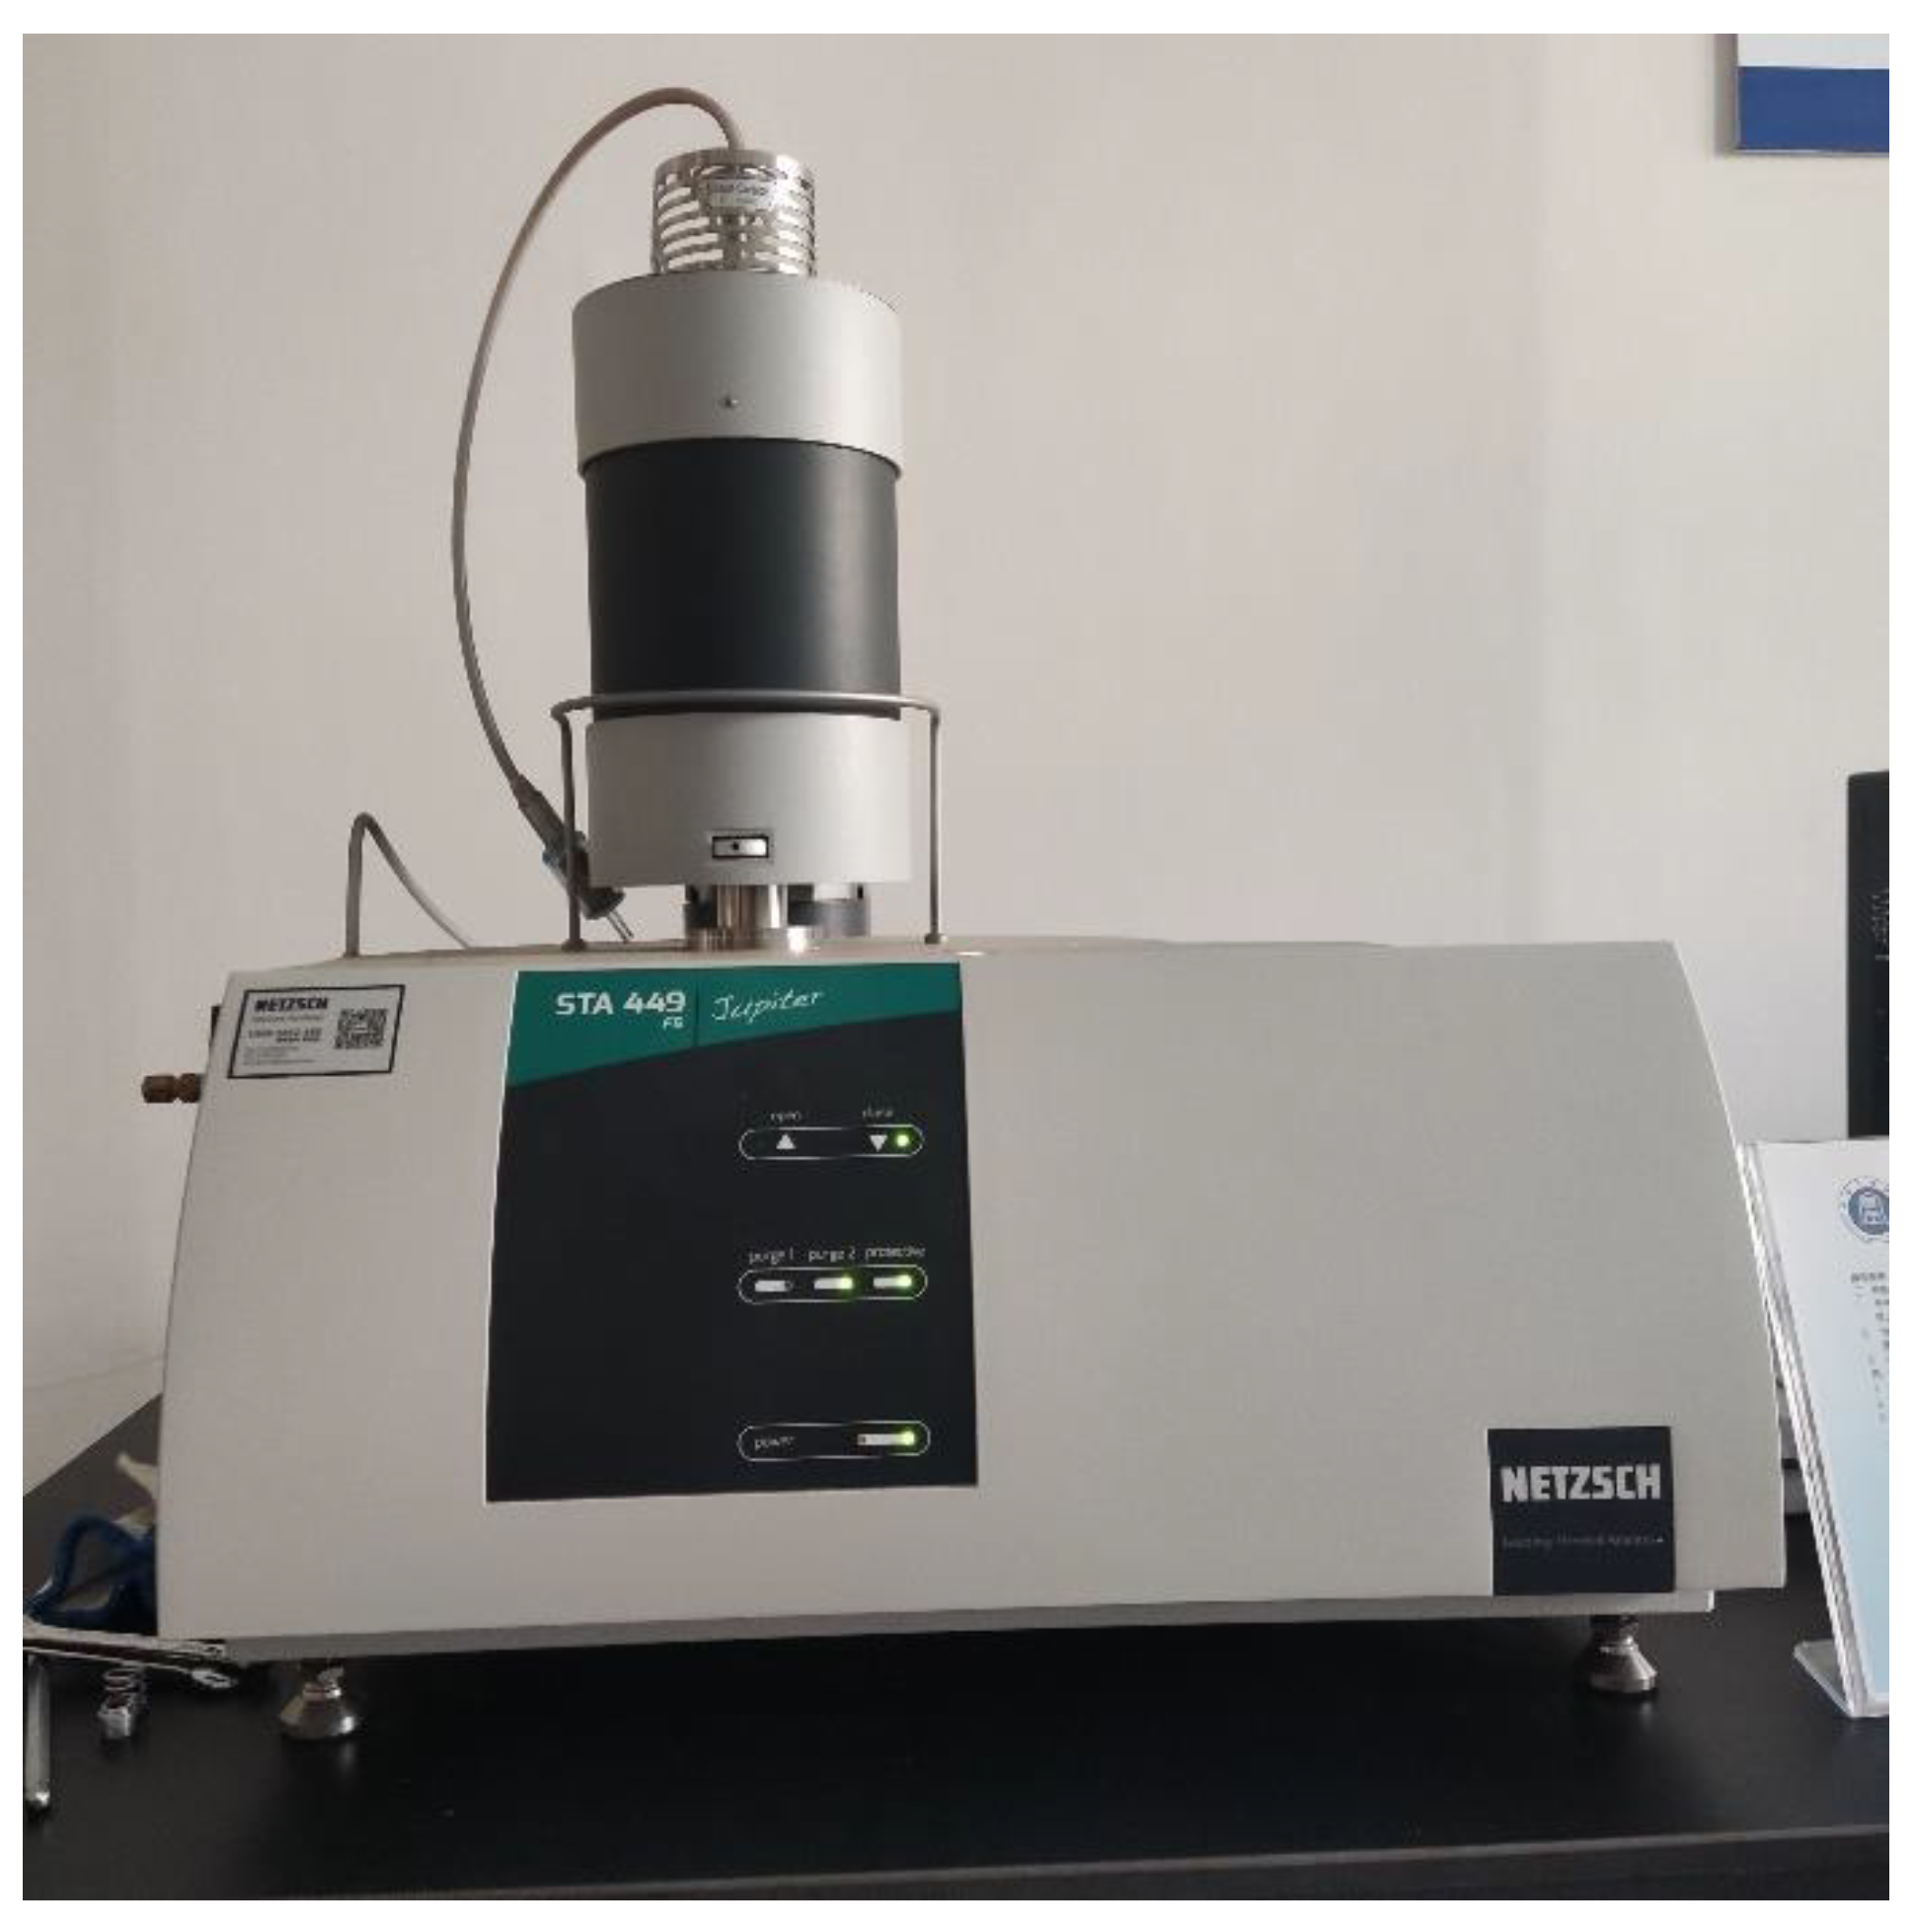
Figure 3.
Mass loss (left) and mass loss rate (right) of Chinese fir under four heating rates in nitrogen atmosphere (a) Natural aging—10; (b) Natural aging—70; (c) Natural aging—100.
Figure 3.
Mass loss (left) and mass loss rate (right) of Chinese fir under four heating rates in nitrogen atmosphere (a) Natural aging—10; (b) Natural aging—70; (c) Natural aging—100.

Figure 4.
Mass loss (left) and mass loss rate (right) of Chinese fir at four natural aging times in nitrogen atmosphere). (a) 5 K/min; (b) 10 K/min; (c) 20 K/min; (d) 40 K/min.
Figure 4.
Mass loss (left) and mass loss rate (right) of Chinese fir at four natural aging times in nitrogen atmosphere). (a) 5 K/min; (b) 10 K/min; (c) 20 K/min; (d) 40 K/min.

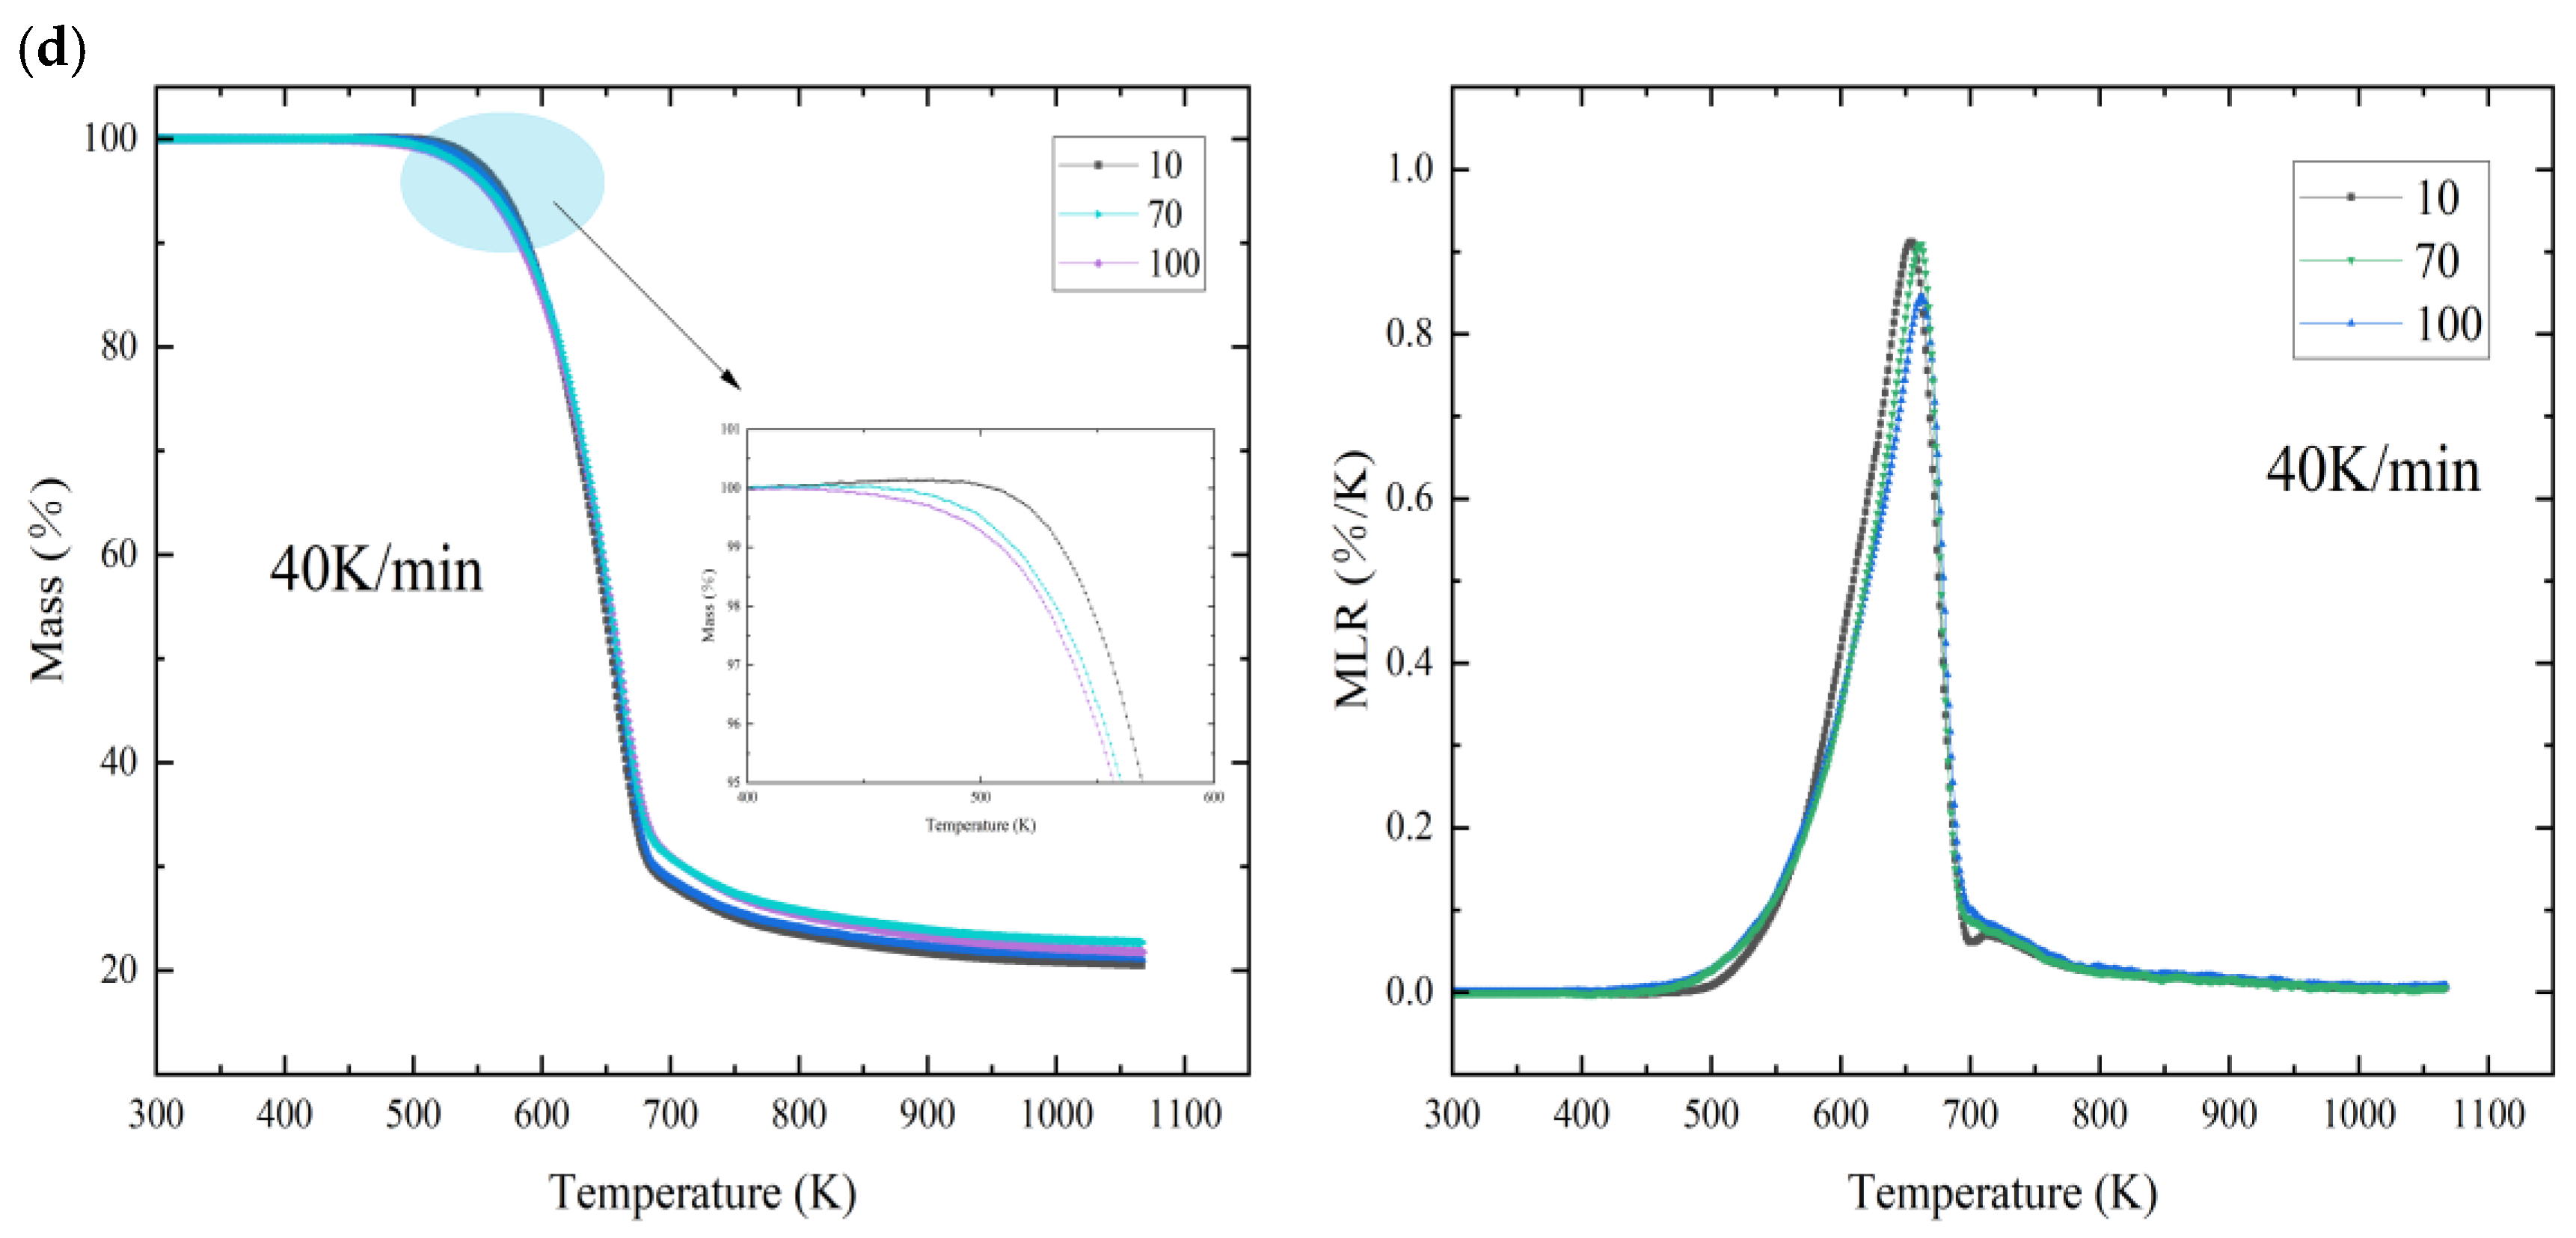
Figure 5.
Linear regression diagram of KAS method under different conversion rates: (a) natural aging−10; (b) natural aging−70; (c) natural aging−100.
Figure 5.
Linear regression diagram of KAS method under different conversion rates: (a) natural aging−10; (b) natural aging−70; (c) natural aging−100.
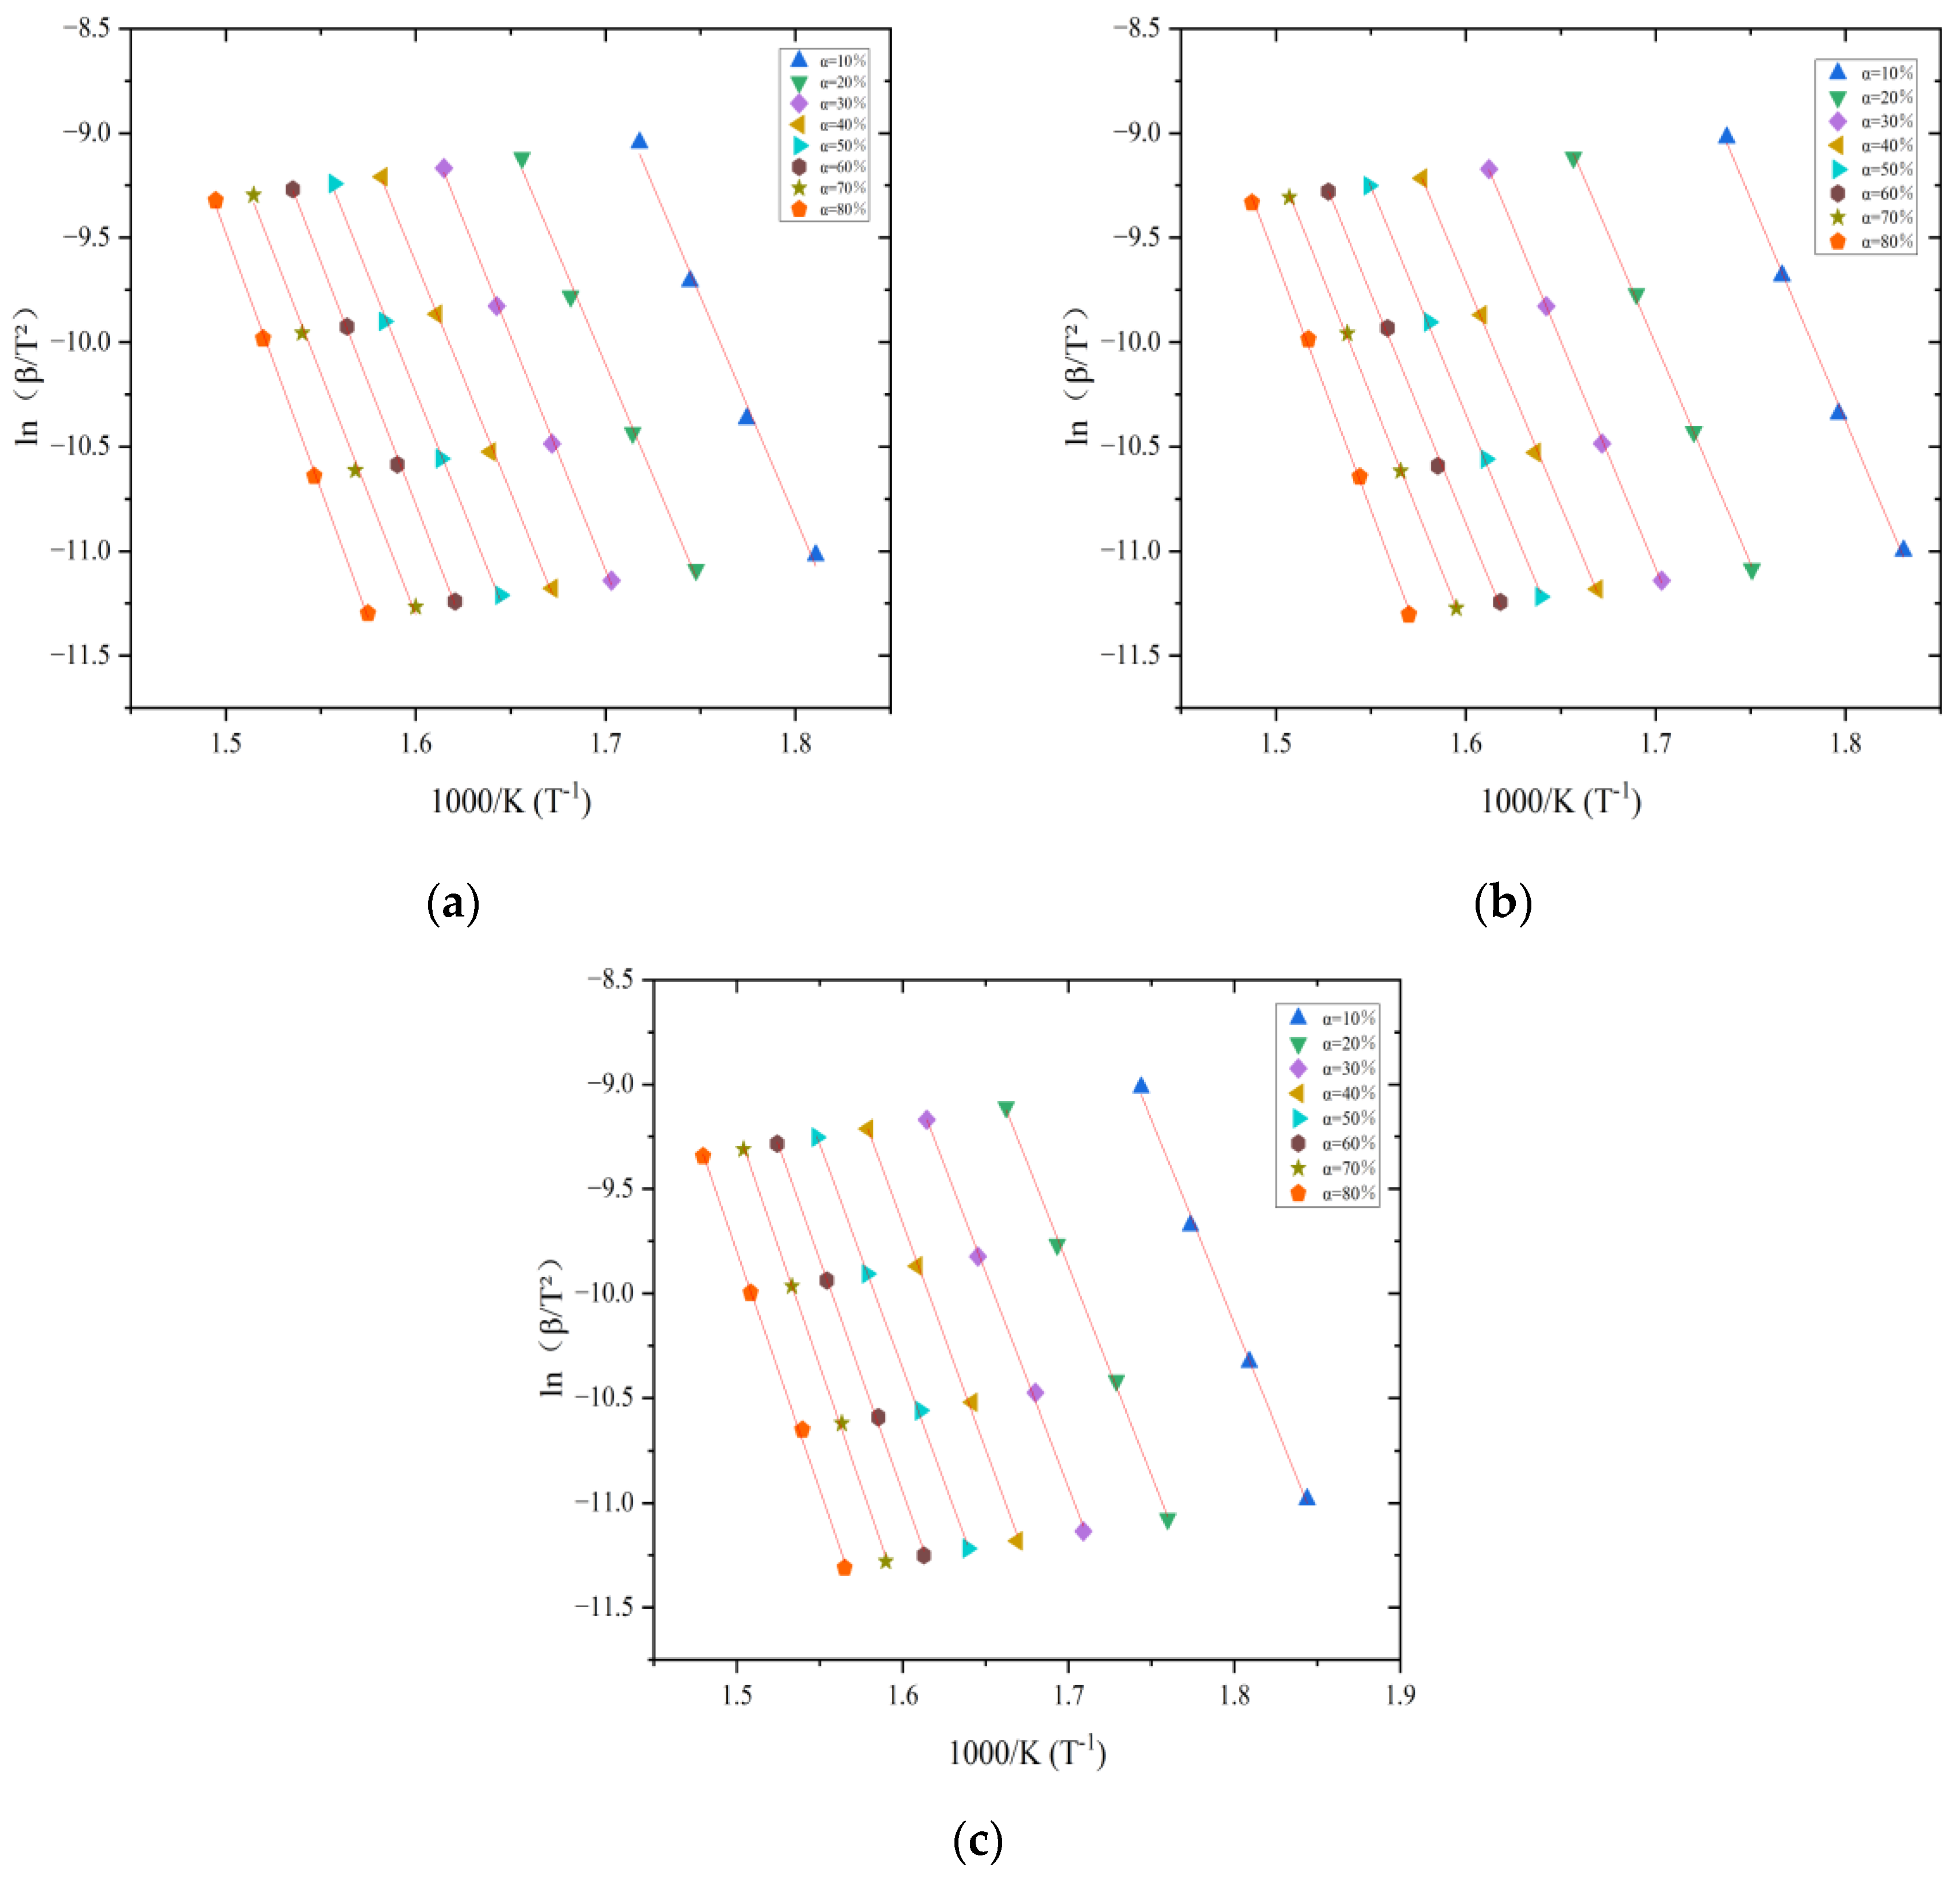
Figure 6.
FWO linear regression at different conversion rates: (a) natural aging−10; (b) natural aging−70; (c) natural aging−100.
Figure 6.
FWO linear regression at different conversion rates: (a) natural aging−10; (b) natural aging−70; (c) natural aging−100.
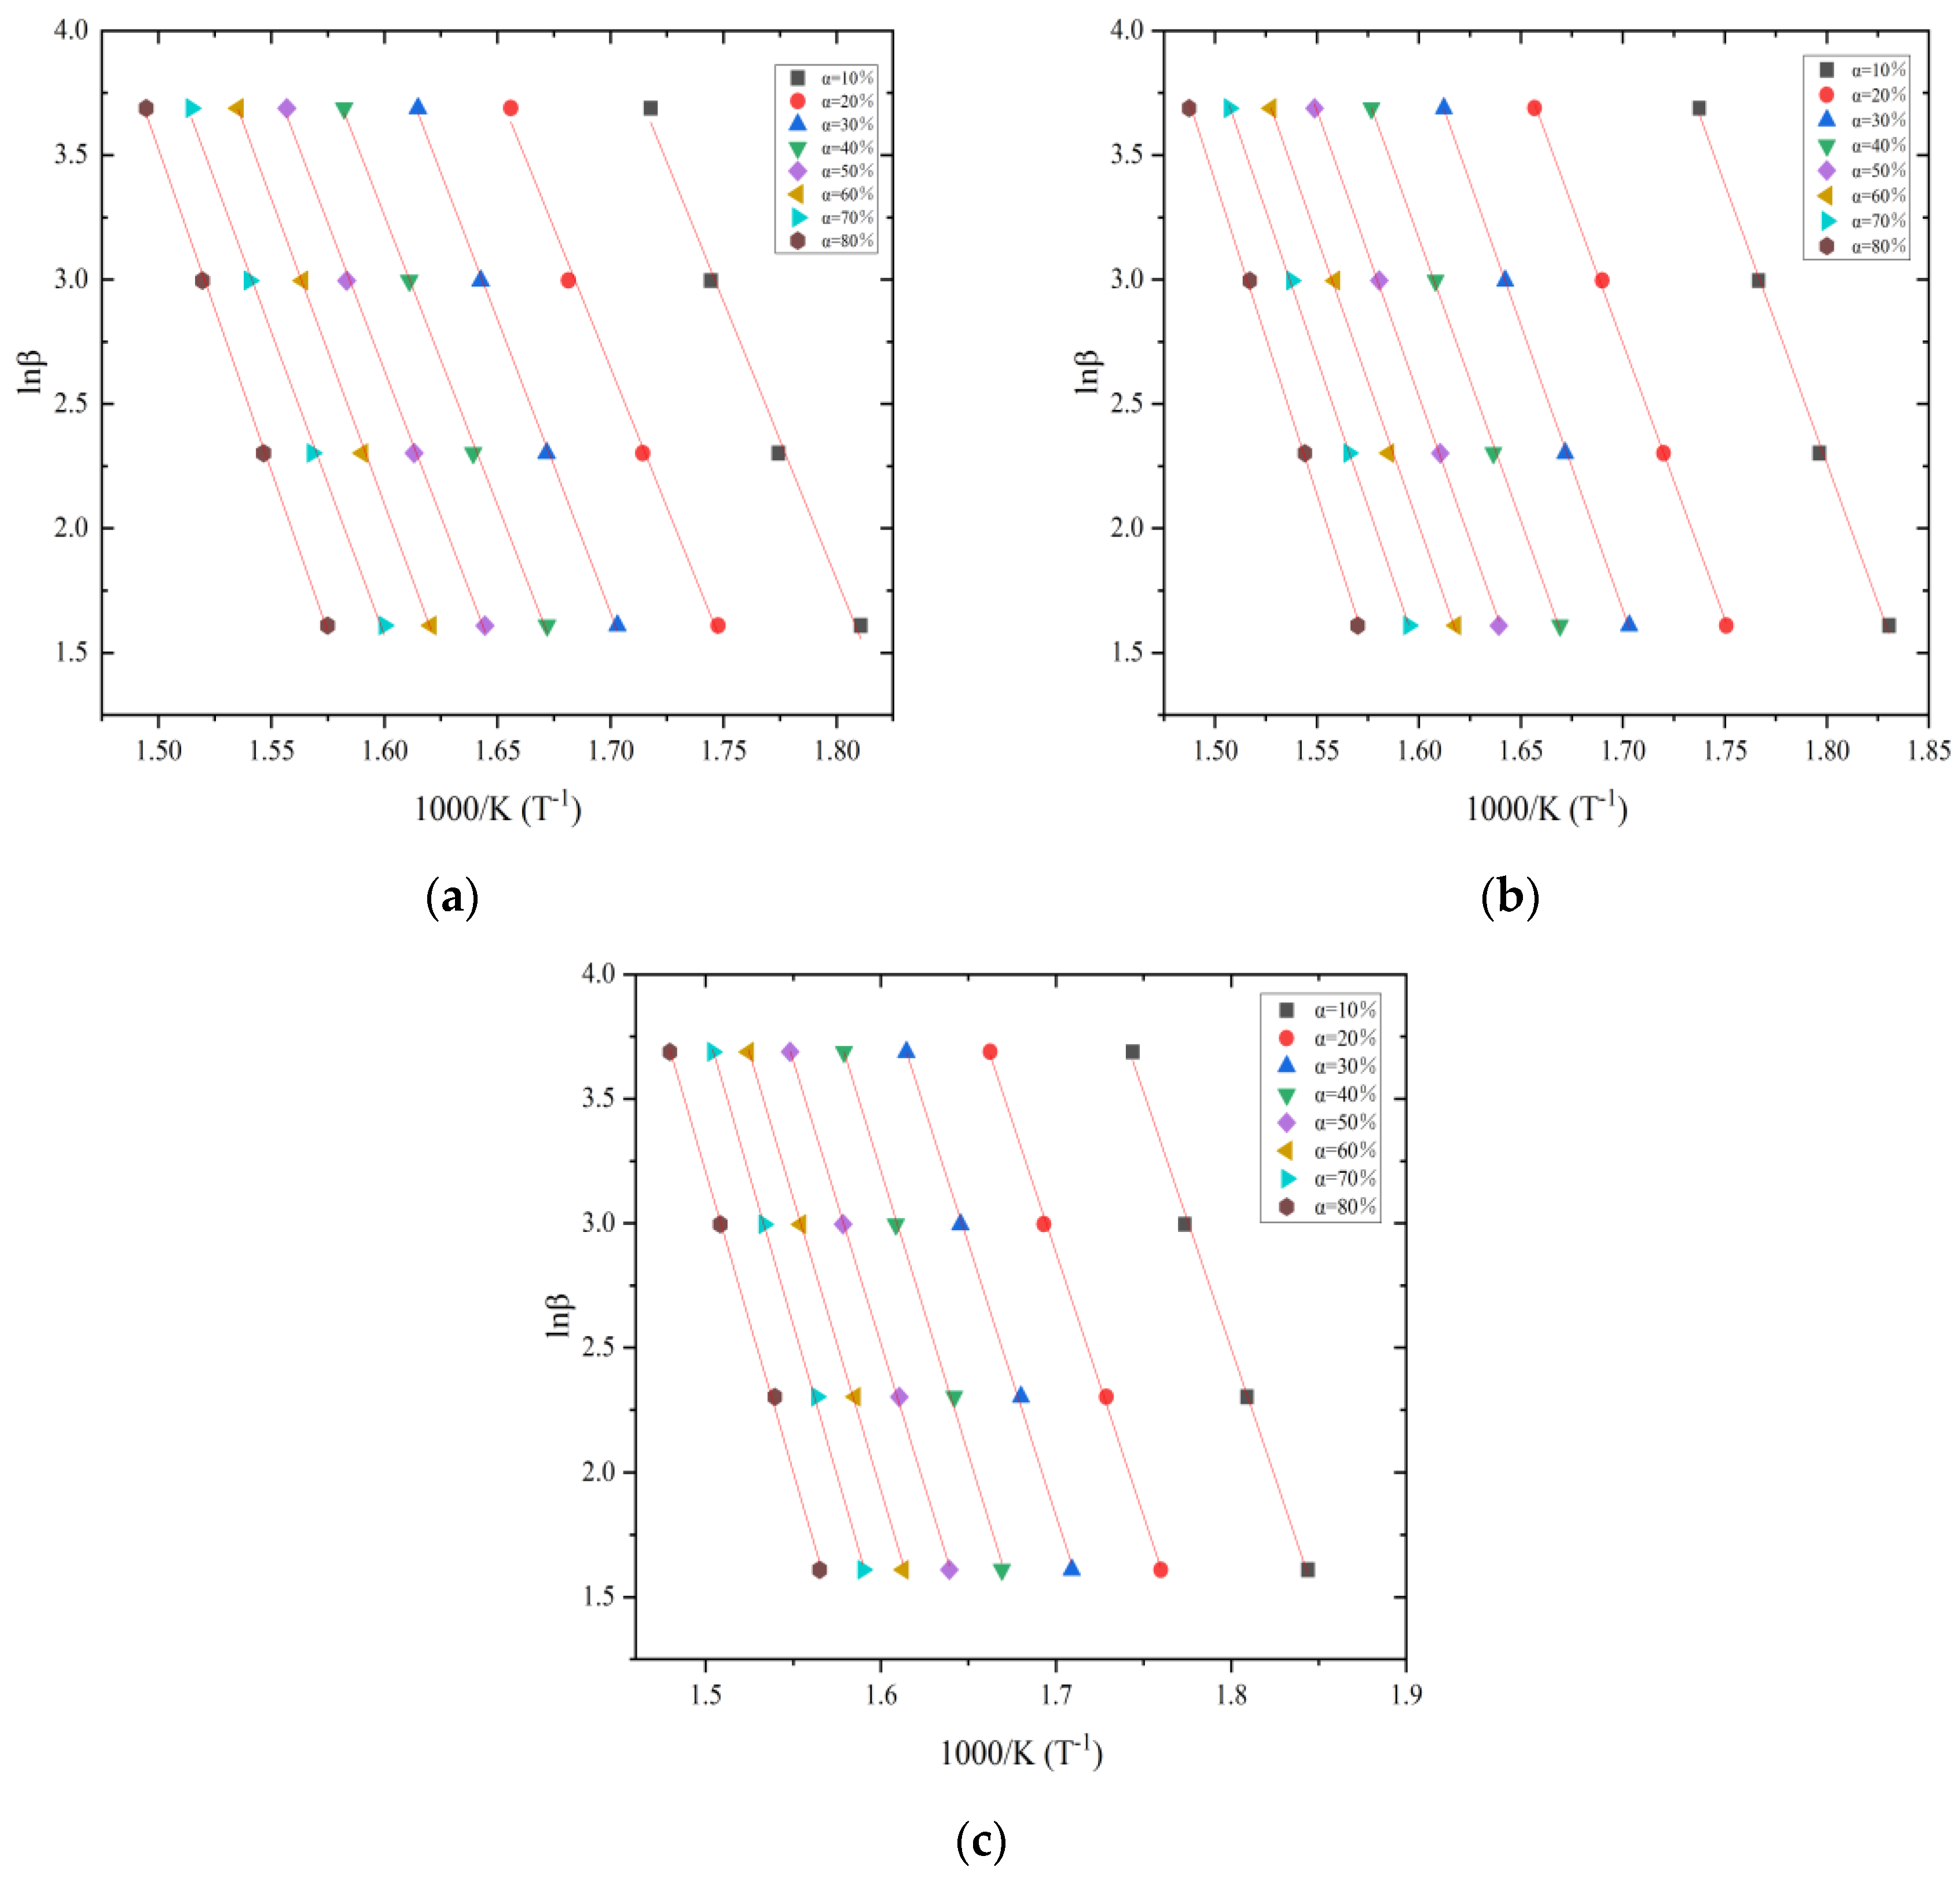
Figure 7.
Distribution trend of activation energy of KAS method and FWO method with conversion rate.
Figure 7.
Distribution trend of activation energy of KAS method and FWO method with conversion rate.


Table 1.
Pyrolysis parameters of Chinese fir with different natural aging degree under different heating rates in nitrogen atmosphere.
Table 1.
Pyrolysis parameters of Chinese fir with different natural aging degree under different heating rates in nitrogen atmosphere.
| Heating Rate | Natural Aging—10 | Natural Aging—70 | Natural Aging—100 | ||||||
|---|---|---|---|---|---|---|---|---|---|
| T5% | Tpeak | MLRpeak | T5% | Tpeak | MLRpeak | T5% | Tpeak | MLRpeak | |
| (K) | (%) | (K) | (%) | (K) | (%) | ||||
| 5 | 540 | 620 | 0.896 | 532 | 623 | 0.838 | 527 | 623 | 0.825 |
| 10 | 551 | 632 | 0.856 | 541 | 635 | 0.812 | 538 | 634 | 0.802 |
| 20 | 562 | 647 | 0.854 | 550 | 648 | 0.777 | 549 | 645 | 0.765 |
| 40 | 568 | 650 | 0.884 | 561 | 656 | 0.804 | 557 | 654 | 0.798 |
Table 2.
Estimation of activation energy at each conversion based on FWO and KAS methods. KAS methods.
Table 2.
Estimation of activation energy at each conversion based on FWO and KAS methods. KAS methods.
| α | Natural Aging—10 | Natural Aging—70 | Natural Aging—100 | |||
|---|---|---|---|---|---|---|
| (kJ/mol) | (kJ/mol) | (kJ/mol) | ||||
| FWO | KAS | FWO | KAS | FWO | KAS | |
| 0.1 | 176 | 176 | 176 | 177 | 162 | 162 |
| 0.2 | 176 | 177 | 174 | 175 | 165 | 166 |
| 0.3 | 185 | 186 | 180 | 181 | 171 | 172 |
| 0.4 | 183 | 183 | 178 | 179 | 179 | 180 |
| 0.5 | 186 | 183 | 180 | 181 | 178 | 179 |
| 0.6 | 193 | 193 | 182 | 183 | 183 | 184 |
| 0.7 | 191 | 192 | 186 | 187 | 189 | 190 |
| 0.8 | 204 | 204 | 198 | 198 | 189 | 190 |
| Avg | 187 | 187 | 182 | 183 | 177 | 178 |
Table 3.
The reaction mechanism in solid state.
| Model | ||
|---|---|---|
| D1 1D diffusion | ||
| D2 2D diffusion-Valensi | ||
| D3 3D diffusion-Jander | ||
| D4 3D diffusion-Ginstling | ||
| F1 First order | ||
| F2 Second order | ||
| F3 Third order | ||
| R2 Contracting area | ||
| R3 Contracting volume | ||
| P2/3 Power law | ||
| P2 Power law | ||
| P3 Power law | ||
| P4 Power law | ||
| A2 Avrami–Erofeev | ||
| A3 Avrami–Erofeev | ||
| A4 Avrami–Erofeev |
Table 4.
Activation Energy and ln A of Natural Aging—10 Chinese Fir under Different Mechanism Functions.
Table 4.
Activation Energy and ln A of Natural Aging—10 Chinese Fir under Different Mechanism Functions.
| 5 K/min | 10 K/min | 20 K/min | 40 K/min | |||||||||
|---|---|---|---|---|---|---|---|---|---|---|---|---|
| Mechanism Function | (kJ/mol) | ln (A) (s−1) | R2 | (kJ/mol) | ln (A) (s−1) | R2 | (kJ/mol) | ln (A) (s−1) | R2 | (kJ/mol) | ln (A) (s−1) | R2 |
| D1 | 137.07 | 20.06 | 0.98 | 140.82 | 20.25 | 0.98 | 143.54 | 20.28 | 0.98 | 143.93 | 19.86 | 0.98 |
| D2 | 149.78 | 22.20 | 0.99 | 153.87 | 22.42 | 0.99 | 156.82 | 22.44 | 0.99 | 157.18 | 21.98 | 0.99 |
| D3 | 164.95 | 24.07 | 0.99 | 169.46 | 24.31 | 0.99 | 172.67 | 24.33 | 0.99 | 172.99 | 23.80 | 0.99 |
| D4 | 154.80 | 21.82 | 0.99 | 159.03 | 22.04 | 0.99 | 162.06 | 22.06 | 0.99 | 162.41 | 21.57 | 0.99 |
| F0 | 63.61 | 5.49 | 0.98 | 65.39 | 5.58 | 0.98 | 66.67 | 5.59 | 0.98 | 66.78 | 5.36 | 0.98 |
| F1 | 85.54 | 10.52 | 0.99 | 87.92 | 10.65 | 0.99 | 89.58 | 10.65 | 0.99 | 89.64 | 10.33 | 0.99 |
| F2 | 113.70 | 16.85 | 0.98 | 116.83 | 17.02 | 0.98 | 118.97 | 17.01 | 0.98 | 118.94 | 16.58 | 0.98 |
| F3 | 145.25 | 24.33 | 0.96 | 151.54 | 24.56 | 0.96 | 154.28 | 24.55 | 0.96 | 154.10 | 23.98 | 0.96 |
| R1 | 73.82 | 7.15 | 0.99 | 75.87 | 7.26 | 0.99 | 77.32 | 7.26 | 0.99 | 77.42 | 7.00 | 0.99 |
| R2 | 77.55 | 7.60 | 0.99 | 79.71 | 7.72 | 0.99 | 81.22 | 7.72 | 0.99 | 81.31 | 7.44 | 0.99 |
| P2/3 | 46.27 | 0.57 | 0.98 | 40.25 | 0.46 | 0.98 | 41.03 | 0.46 | 0.98 | 41.06 | 0.30 | 0.98 |
| P2 | 65.38 | −1.38 | 0.98 | 27.61 | −2.21 | 0.98 | 28.15 | −2.18 | 0.98 | 28.26 | −2.24 | 0.98 |
| P3 | 84.49 | −3.43 | 0.97 | 15.03 | −5.13 | 0.97 | 15.33 | −5.11 | 0.97 | 15.41 | −5.14 | 0.97 |
| P4 | 8.51 | −6.92 | 0.95 | 8.75 | −6.83 | 0.95 | 8.92 | −6.81 | 0.95 | 8.97 | −6.82 | 0.95 |
| A2 | 37.85 | 0.44 | 0.99 | 38.87 | 0.52 | 0.99 | 39.61 | 0.54 | 0.99 | 39.69 | 0.43 | 0.99 |
| A3 | 21.95 | −3.20 | 0.99 | 22.55 | −3.14 | 0.99 | 22.97 | −3.12 | 0.99 | 23.03 | −3.18 | 0.99 |
| A4 | 14.00 | −5.19 | 0.99 | 14.45 | −5.16 | 0.99 | 14.73 | −5.17 | 0.99 | 14.63 | −5.28 | 0.99 |
Table 5.
Activation Energy and ln A of Natural Aging—70 Chinese Fir under Different Mechanism Functions.
Table 5.
Activation Energy and ln A of Natural Aging—70 Chinese Fir under Different Mechanism Functions.
| 5 K/min | 10 K/min | 20 K/min | 40 K/min | |||||||||
|---|---|---|---|---|---|---|---|---|---|---|---|---|
| Mechanism Function | (kJ/mol) | ln (A) (s−1) | R2 | (kJ/mol) | ln (A) (s−1) | R2 | (kJ/mol) | ln (A) (s−1) | R2 | (kJ/mol) | ln (A) (s−1) | R2 |
| D1 | 124.94 | 17.51 | 0.98 | 127.68 | 17.58 | 0.98 | 129.19 | 17.41 | 0.98 | 128.91 | 16.83 | 0.98 |
| D2 | 136.39 | 19.41 | 0.99 | 139.34 | 19.47 | 0.99 | 140.97 | 19.28 | 0.99 | 140.64 | 18.66 | 0.99 |
| D3 | 150.05 | 20.97 | 0.99 | 153.23 | 21.02 | 0.99 | 155.00 | 20.81 | 0.99 | 154.59 | 20.12 | 0.99 |
| D4 | 140.91 | 18.92 | 0.99 | 143.93 | 18.98 | 0.99 | 145.61 | 18.79 | 0.99 | 145.26 | 18.14 | 0.99 |
| F0 | 57.57 | 4.17 | 0.98 | 58.85 | 4.19 | 0.98 | 59.52 | 4.10 | 0.98 | 59.28 | 3.79 | 0.98 |
| F1 | 77.32 | 8.76 | 0.99 | 78.93 | 8.77 | 0.99 | 79.81 | 8.65 | 0.99 | 79.47 | 8.24 | 0.99 |
| F2 | 102.61 | 14.51 | 0.98 | 104.63 | 14.51 | 0.98 | 105.75 | 14.34 | 0.98 | 105.27 | 13.81 | 0.98 |
| F3 | 132.95 | 21.30 | 0.96 | 135.42 | 21.28 | 0.96 | 136.85 | 21.07 | 0.96 | 136.18 | 20.39 | 0.96 |
| R1 | 66.76 | 5.62 | 0.99 | 68.20 | 5.65 | 0.99 | 68.96 | 5.54 | 0.99 | 68.69 | 5.18 | 0.99 |
| R2 | 70.12 | 6.00 | 0.99 | 71.62 | 6.02 | 0.99 | 72.42 | 5.90 | 0.99 | 72.12 | 5.54 | 0.99 |
| P2/3 | 35.11 | −0.52 | 0.99 | 35.90 | −0.50 | 1.00 | 36.29 | −0.58 | 1.00 | 36.07 | −0.80 | 1.00 |
| P2 | 24.71 | −2.80 | 0.99 | 25.24 | −2.76 | 0.99 | 25.56 | −2.77 | 0.99 | 25.56 | −2.87 | 1.00 |
| P3 | 13.48 | −5.50 | 0.98 | 13.78 | −5.47 | 0.99 | 13.95 | −5.47 | 0.99 | 13.95 | −5.52 | 0.99 |
| P4 | 7.86 | −7.09 | 0.97 | 8.04 | −7.06 | 0.97 | 8.14 | −7.05 | 0.97 | 8.15 | −7.08 | 0.98 |
| A2 | 34.58 | −0.32 | 1.00 | 35.29 | −0.28 | 1.00 | 35.71 | −0.31 | 1.00 | 35.65 | −0.46 | 0.99 |
| A3 | 20.06 | −3.67 | 1.00 | 20.47 | −3.64 | 1.00 | 20.72 | −3.65 | 1.00 | 20.68 | −3.74 | 0.99 |
| A4 | 11.98 | −5.76 | 0.99 | 12.25 | −5.76 | 0.99 | 12.33 | −5.82 | 0.99 | 12.11 | −5.96 | 0.98 |
Table 6.
Activation Energy and ln A of Natural Aging—100 Chinese Fir under Different Mechanism Functions.
Table 6.
Activation Energy and ln A of Natural Aging—100 Chinese Fir under Different Mechanism Functions.
| 5 K/min | 10 K/min | 20 K/min | 40 K/min | |||||||||
|---|---|---|---|---|---|---|---|---|---|---|---|---|
| Mechanism Function | (kJ/mol) | ln (A) (s−1) | R2 | (kJ/mol) | ln (A) (s−1) | R2 | (kJ/mol) | ln (A) (s−1) | R2 | (kJ/mol) | ln (A) (s−1) | R2 |
| D1 | 114.93 | 15.44 | 0.98 | 118.60 | 15.77 | 0.98 | 121.31 | 15.81 | 0.98 | 121.71 | 15.41 | 0.98 |
| D2 | 125.53 | 17.17 | 0.99 | 129.55 | 17.53 | 0.99 | 132.49 | 17.56 | 0.99 | 132.92 | 17.13 | 0.99 |
| D3 | 138.16 | 18.52 | 0.99 | 142.60 | 18.92 | 0.99 | 145.81 | 18.96 | 0.99 | 146.26 | 18.48 | 0.99 |
| D4 | 129.71 | 16.61 | 0.99 | 133.87 | 16.98 | 0.99 | 136.90 | 17.02 | 0.99 | 137.33 | 16.58 | 0.99 |
| F1 | 70.84 | 7.38 | 0.99 | 73.19 | 7.60 | 0.99 | 74.84 | 7.61 | 0.99 | 74.99 | 7.33 | 0.99 |
| F2 | 94.22 | 12.75 | 0.98 | 97.35 | 13.04 | 0.98 | 99.50 | 13.06 | 0.98 | 99.68 | 12.70 | 0.98 |
| F3 | 122.25 | 19.09 | 0.96 | 126.31 | 19.47 | 0.96 | 129.07 | 19.49 | 0.96 | 129.30 | 19.03 | 0.96 |
| R1 | 61.07 | 4.41 | 0.99 | 63.10 | 4.59 | 0.99 | 64.54 | 4.61 | 0.99 | 64.67 | 4.36 | 0.99 |
| R2 | 64.19 | 4.73 | 0.99 | 66.32 | 7.97 | 0.99 | 67.82 | 4.94 | 0.99 | 67.96 | 4.69 | 0.99 |
| P2/3 | 38.48 | 0.26 | 0.98 | 32.89 | −1.17 | 0.99 | 33.66 | −1.17 | 0.99 | 33.67 | −1.32 | 1.00 |
| P2 | 27.66 | −2.09 | 0.98 | 23.57 | −3.15 | 0.99 | 24.11 | −3.12 | 0.99 | 24.22 | −3.18 | 0.99 |
| P3 | 15.06 | −5.07 | 0.97 | 12.85 | −5.71 | 0.98 | 13.15 | −5.68 | 0.98 | 13.21 | −5.71 | 0.99 |
| P4 | 8.76 | −6.79 | 0.95 | 7.50 | −7.23 | 0.97 | 7.67 | −7.20 | 0.97 | 7.71 | −7.22 | 0.97 |
| A2 | 38.98 | 0.70 | 0.99 | 33.00 | −0.79 | 1.00 | 33.74 | −0.75 | 1.00 | 33.87 | −0.85 | 1.00 |
| A3 | 22.61 | −3.03 | 1.00 | 19.15 | −3.96 | 1.00 | 19.57 | −3.93 | 1.00 | 19.65 | −3.99 | 1.00 |
| A4 | 12.65 | −5.56 | 1.00 | 10.82 | −6.16 | 0.99 | 11.09 | −6.17 | 0.99 | 10.98 | −6.27 | 0.99 |
Publisher’s Note: MDPI stays neutral with regard to jurisdictional claims in published maps and institutional affiliations. |
© 2022 by the authors. Licensee MDPI, Basel, Switzerland. This article is an open access article distributed under the terms and conditions of the Creative Commons Attribution (CC BY) license (https://creativecommons.org/licenses/by/4.0/).
Share and Cite
MDPI and ACS Style
Yan, H.; Zhu, G.; Zhao, Y. Study on Pyrolysis Characteristics of Chinese Fir under Different Natural Aging Times. Fire 2022, 5, 161. https://doi.org/10.3390/fire5050161
AMA Style
Yan H, Zhu G, Zhao Y. Study on Pyrolysis Characteristics of Chinese Fir under Different Natural Aging Times. Fire. 2022; 5(5):161. https://doi.org/10.3390/fire5050161
Chicago/Turabian StyleYan, Huailin, Guoqing Zhu, and Yongchang Zhao. 2022. "Study on Pyrolysis Characteristics of Chinese Fir under Different Natural Aging Times" Fire 5, no. 5: 161. https://doi.org/10.3390/fire5050161