
Assessing Impact of Multiple Fires on a Tropical Peat Swamp Forest Using High and Very High-Resolution Satellite Images


1
Faculty of Tropical Forestry, Universiti Malaysia Sabah, Jalan UMS, Kota Kinabalu 88450, Malaysia
2
Graduate School of Agricultural and Life Sciences, The University of Tokyo, 1-1-1 Yayoi, Bunkyo-ku, Tokyo 113-8657, Japan
*
Author to whom correspondence should be addressed.
Fire 2021, 4(4), 89; https://doi.org/10.3390/fire4040089
Submission received: 23 September 2021
/
Revised: 11 November 2021
/
Accepted: 16 November 2021
/
Published: 25 November 2021
(This article belongs to the Special Issue Vegetation Fires, Greenhouse Gas Emissions and Climate Change)
Abstract
:Tropical peat swamp forests, found mainly in Southeast Asia, have been threatened by recurring El Niño fires. Repeated burnings form a complex and heterogeneous landscape comprising a mosaic of burned patches of different fire frequencies, requiring fine-scale assessment to understand their impact. We examined the impact of the El Niño fires of 1998 and 2003 on a tropical peat swamp forest in northern Borneo, with the combined use of high and very high-resolution satellite images. Object-based and pixel-based classifications were compared to classify a QuickBird image. Burned patches of different fire frequencies were derived based on unsupervised classification of the principal components of multitemporal Normalized Difference Water Index (NDWI) data. The results show that the object-based classification was more accurate than the pixel-based classification for generating a detailed land cover map. Fire frequency had a severe impact on the number of burned patches and the residual forest cover. Larger patch area retained more residual forest cover for the burned patches. Forest structure of burned-twice patches was more severely altered compared to burned-once patches. Two burned-once patches had a relatively promising recovery potential by natural regeneration due to higher residual forest cover, a vast number of large trees, and aboveground biomass. Except for the largest patch, rehabilitation seemed inevitable for burned-twice patches. This approach can be applied to assess the impact of multiple fires on other forest types for better post-fire forest management.
1. Introduction
Tropical peat swamp forests are a complex ecosystem that holds an enormous amount of carbon compared to the biomass of the entire Amazon [1,2]. These forests are found mainly in Southeast Asia [3], where farmers routinely use fire to clear the land for agricultural purposes [4]. During a prolonged El Niño drought, fires started for cultivation can quickly spread into severe fires, even in the wet tropics [5]. Peat swamp forests are particularly susceptible to fires, as their peat layer contains partially decomposed plant material that is highly flammable in a drought. Widespread El Niño fires destroyed at least 1.6 million ha of peatland in Indonesia, mainly in the Indonesian Borneo and Sumatra. In Central Kalimantan alone, the 1997 El Niño fires destroyed 0.73 million ha of peatland, releasing between 0.24 and 0.28 Gt of carbon into the atmosphere [6].
The impacts of large-scale fires are often examined with moderate to high-resolution satellite sensors [7,8]. Burn severity assessment and burned area estimation are among the most important applications of these satellite sensors at the local to regional scale [9,10]. Burn severity generally refers to changes in the ecosystem caused by fire disturbances, which are widely assessed with the Composite Burn Index, based on impact rating in the field [11]. The charring and vegetation removal by fire creates a dramatic reduction in visible to near-infrared surface reflectance. The spectral changes before and after a fire lead to burn severity assessment based on satellite images. In addition, burn severity levels are often evaluated by comparing pre-fire and post-fire values of vegetation index, such as with the Normalized Burn Ratio. However, results are often arbitrary, as thresholds for different severity levels vary within the same forest type [12]. Applications of the spectral change approach with satellite sensors in post-fire vegetation recovery studies could yield inconsistent results in some burned areas due to differences in pre-fire vegetation conditions, especially the amount of fuel or aboveground biomass (AGB) [13]. In the case of very high-resolution satellite images (<5 m), instead of a decrease, near-infrared surface reflectance after a fire may increase, due to deposition of white ash, causing inconsistency in the evaluation [9].
High-resolution sensors, especially Landsat, play a critical role in estimating the extent of burned peat swamp forest [14] and assessing fire hazards in peat swamp forest [15]. Sentinel-2, one of the recent satellite sensors, also shows great potential for wetland burned area mapping [16]. Fires often occur in past affected areas [17,18], resulting in vegetation patches with various fire histories. Fine-scale impact assessment requires the use of very high-resolution remote sensing data [19,20,21]. Burned areas of multiple fires can be extracted using high-resolution satellite sensors [22] and be combined with very high-resolution airborne laser scanning (ALS) data to derive the volumetric loss due to the peatland fires [23]. Repetitive ALS surveys demonstrate the great potential in the estimation of the AGB changes [24].
Moreover, very high-resolution airborne hyperspectral data can relate the species diversity to vegetation types mapped with a supervised classification approach [25]. Recent advances in super-resolution classification could contribute to accurate vegetation mapping using hyperspectral images [26,27]. However, airborne data acquisition costs are prohibitive for large-area applications, especially for ALS data. Combining high and very high-resolution satellite images aid in the accurate characterization of burned patches; however, its application to impact assessment of multiple fires has been lacking [20,21]. Fine-scale assessment of residual forests’ abundance and spatial extent in burned patches could assist in examining recovery potentials [28,29,30].
Peat swamp forest is well-represented in Borneo and is also found abundantly in the coastal areas [3]. The peat swamp forest in Klias Peninsula, Sabah, is considered the last sizable piece in northern Borneo. However, it was severely affected by repeated fires during the 1998 and 2003 El Niño events. Previous studies examined the fires’ impact by estimating the forest area destroyed by them [18]. This study aimed to examine the impact of fire frequency using high and very high-resolution satellite images. In the Materials and Methods section, pixel-based and object-based classifications were compared using a very high-resolution satellite image to derive the post-fire land cover map. Then, we analyzed multitemporal high-resolution satellite images to derive the burned patches with different fire frequencies. The Results section presents the land cover classifications, followed by land cover types and residual forest covers in burned patches of different fire frequencies. We also reported the relationship between the total area and residual forest cover of the burned patches, presented forest structure variables measured in the field by fire frequency, and evaluated the characteristics of the burned patches. We discussed the use of high and very high-resolution satellite images to better understand post-fire management in the context of forest recovery potential for patches of different frequencies. To the best of our knowledge, this is the first paper that assesses the impact of fire frequency on peat swamp forest by combining the use of high and very high-resolution satellite images.
2. Materials and Methods
2.1. Study Area
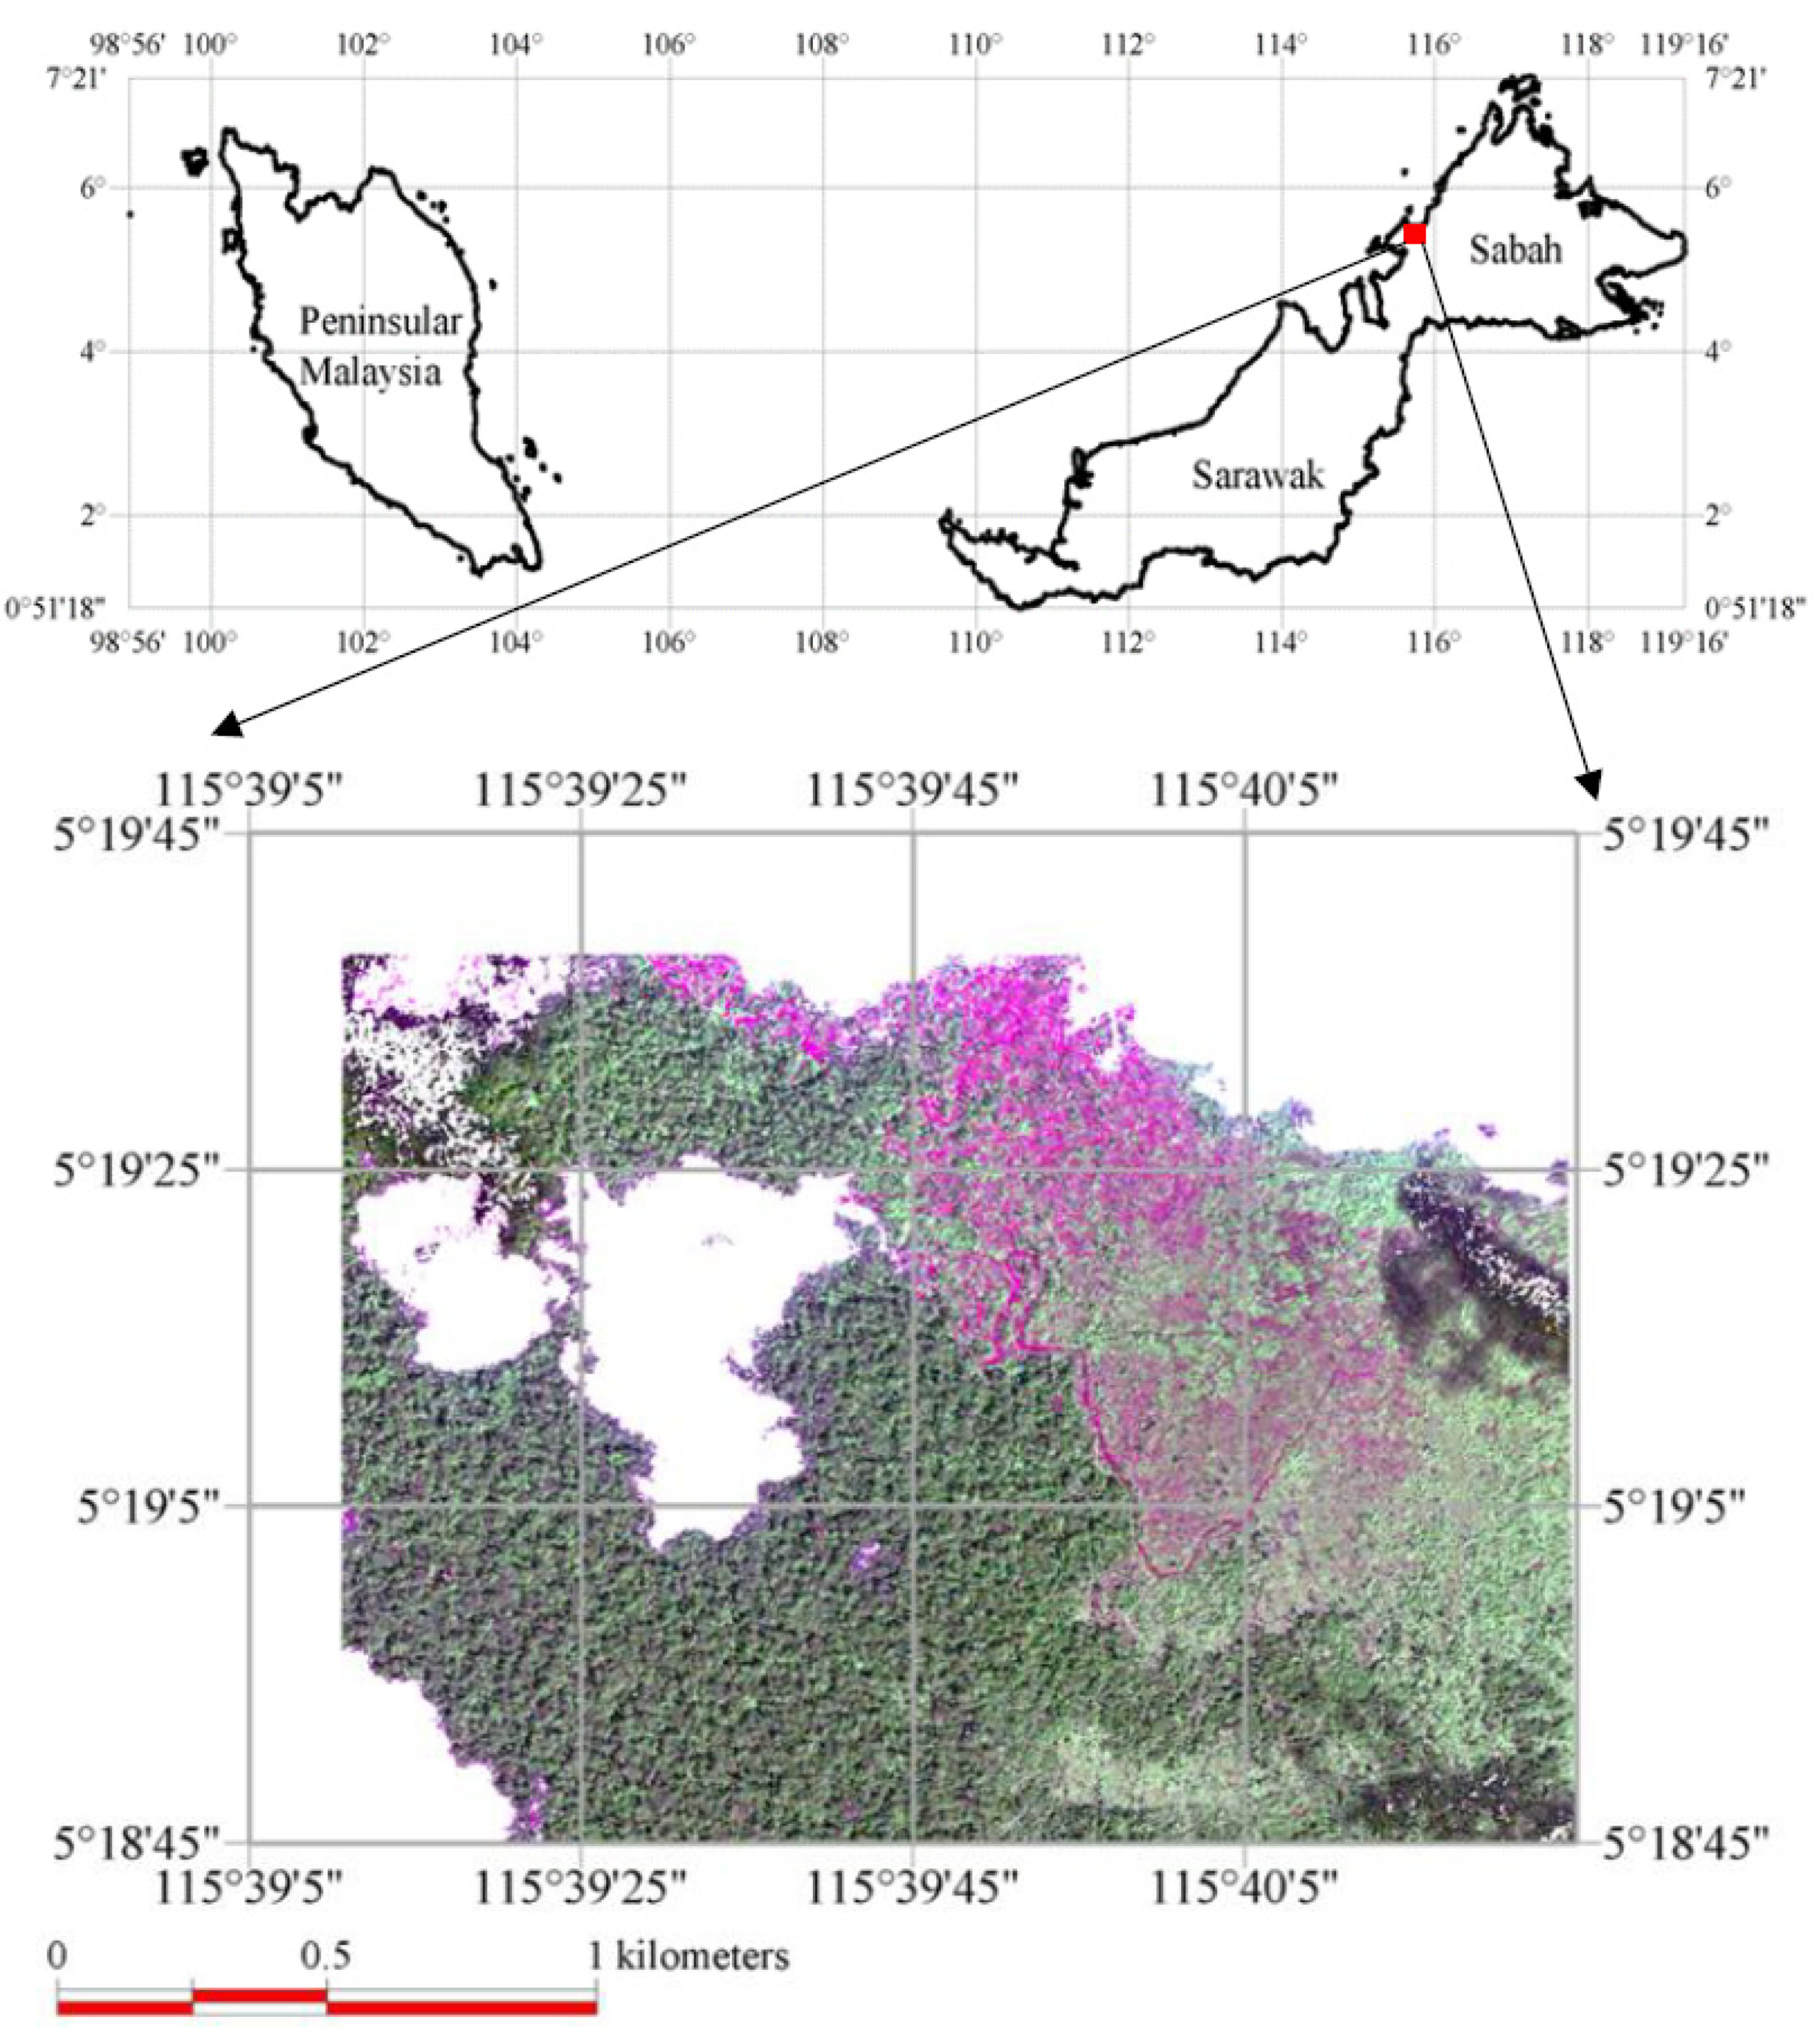
The study focused on the peat swamp forest in the Klias Forest Reserve, located on the Klias Peninsula in the southwestern part of Sabah (Figure 1). It is a flat coastal plain with an elevation of less than 15 m. The climate is wet tropical, with annual rainfall between 2500 mm to 3000 mm [14]. The Klias Forest Reserve is a Protection Forest Reserve (Class 1) with an area of 3620 ha, established by the Sabah Forestry Department in 1984 to protect watersheds and the stability of climatic and environmental factors. Although exploitative commercial use is no longer permitted, the tree species composition has been affected by selective logging activities as a production forest reserve (Class 2). Logging activities focused on commercial species, such as Dactylocladus stenostachys and Gonystylus bancanus. At the same time, Dryobalonops rappa were left unlogged, as they were not marketable or easy to transport due to the tendency of the logs to sink in water [31]. As a result, Dryobalonops rappa is one of the most dominant species in the forest’s upper canopy [14].
The peat swamp forests in the Klias Peninsula were severely affected by fires in previous El Niño events in 1998 and 2003. About 10,000 ha peat swamp forests were burned during the 1998 El Niño. The 2003 El Niño fires destroyed 5671.44 ha peat swamp forests, of which nearly 70% had been previously burned areas [22]. For the Klias Forest Reserve, the 1998 El Niño fires had affected the northeastern and southwestern parts of the reserve. These burned areas were reburned in the 2003 El Niño. Although fire barriers quickly controlled the fires, the multiple fires created a mosaic of heterogeneous landscapes consisting of bare, grassy vegetation, and intact forest areas.
2.2. Field Inventory at Burned Areas of Multiple Fires
The northeastern part (approximately 1.55 km × 1.55 km) of the Klias Forest Reserve was selected as a study site to examine the impact of multiple fires on peat swamp forests (Figure 1). We collected field data within one year of the 2003 fire with a random sampling approach (Table 1). We divided the study site into 100 grids and randomly sampled 20 to establish plots of 40 m × 40 m. We excluded three plots at the edge of the forest or burned areas. Diameter-at-breast height (DBH) and the height of standing trees > 10 cm DBH on plots were measured. Plot locations were recorded by averaging a handheld global navigation satellite system (GNSS) receiver for at least one hour or until the inventory work was completed.
In addition, we obtained data of 18 plots with the stratified random sampling method the same year vs. another research project. This project consisted of 40 m × 40 m randomly established plots for unburned, burned-once, and burned-twice strata. Within each plot, DBH and height were measured with a nested plot design; this consisted of a 1600 m2 plot nested with 800 m2, 400 m2, and 100 m2 subplots with thresholds of ≥40 cm DBH, 30–40 cm DBH, 20–30 cm DBH, and 10–20 cm DBH, respectively.
Combining two datasets gave us 35 plots representing the study site, with a breakdown of 9 plots, 9 plots, and 17 plots for unburned, burned-once, and burned-twice areas, respectively. Mean DBH, height, basal area, and AGB were calculated using tree measurements for the DBH classes. The AGB was calculated for each tree, using the AGB allometry developed for peat swamp forest in Kalimantan, Indonesia [32] (Equation (1)).
AGB = 0.136*DBH2.513
Trees with DBH larger than 40 cm were considered potential mother trees. Mean tree density and AGB of potential mother trees were calculated for burned-once and burned-twice areas.
2.3. Processing and Classification of QuickBird Image
A high-resolution satellite image of QuickBird (Panchromatic: 0.64 m; Multispectral: 2.44 m) (Digital Globe, Westminster, CO, USA) was acquired for mapping post-fire land cover types of the Klias Forest Reserve on a local scale. This image was taken in February 2005 (Figure 1). Some parts of the satellite image were affected by clouds and cloud-induced shadows. The QuickBird image was rectified using ground control points (GCPs) collected with differential GNSS receivers. We conducted the rectification based on affine linear transformation resulting in root-square errors between 0.01 m and 0.32 m for the GCPs. The image was processed with a 3 × 3 average filter prior to land cover classification.
To generate a detailed land cover map, we compared pixel-based and object-based classifications on the QuickBird image. For the pixel-based classification, supervised classification used the maximum likelihood algorithm, which classifies each pixel to a land cover-class based on its probability of being applied to the satellite image. We implemented the maximum likelihood classifier to classify the QuickBird image into six classes (forest, young regenerating vegetation (shrub), grassy vegetation, bare, cloud, and shadow) using TNTmips software (Microimages Inc., Lincoln, NE, USA). We did not use prior probability in the classification because we could not estimate the expected distribution of classes in the final classification. Tree crowns in the very-high satellite image showed spectral variations due to the tree-sun-sensor’s geometry; we subdivided the forest tree class into three subclasses, i.e., bright, medium, and dark parts of the crown for classification. Subclasses were combined in the forest class for accuracy assessment.
For object-based classification, the satellite image was first segmented into objects using the multi-resolution segmentation approach in eCognition software (Trimble, Inc., Sunnyvale, CA, USA), based on spectrum character, geometry, and structure information. The important semantic information for interpreting an image is not represented in a single-pixel but in meaningful image objects and their mutual relations [33]. The scale parameter can be adjusted based on the heterogeneity of pixels in relation to the intended classification. The color parameter balances the homogeneity of a segment with its shape, while the form parameter is a balance between the smoothness of the border of a segment and its compactness. By modifying the parameters of scale, color, and form, we segmented the QuickBird image into objects. Different settings of three segmentation parameters were tested until the resulting objects were visually homogeneous and representative of land cover classes. The final parameter used were: Scale: 10; Shape: 0.3; Compactness: 0.5. These objects were classified as the spatial unit to produce the land cover classification map in a supervised approach.
We assessed land cover classification accuracies by comparing results with photographs and coordinates taken in the field and high-resolution Google Earth images to the classified data in an accuracy matrix. Accuracy measures calculated in the matrix included overall accuracy, producer’s accuracy, and user’s accuracy. These measures, used in pixel-based and object-based classifications, quantify accuracy in terms of area correctly classified and area misclassified [34]. As the overall accuracy tends to be biased towards the category with more samples, we calculated kappa accuracy to assess land cover classifications. The kappa accuracy yields the proportion of agreement after removing the proportion of chance agreement, using all elements of the accuracy matrix, and not just the main diagonal to the calculation [35].
2.4. Characterisation of Burned Patches of Multiple Fires
In order to analyze detailed land covers of the study site affected by multiple fires, we derived a fire frequency map that identified unburned, burned-once, and burned-twice areas using four satellite images. For the 1998 El Niño, a pre-fire image of Landsat5-TM (2 October 1997) and a post-fire image of Landsat7-ETM+ (7 December 1999) were acquired. For the 2003 El Niño, the pre-fire and post-fire images were Landsat7-ETM+ (14 January 2003) and SPOT4-HRVIR (26 March 2003), respectively. The Landsat and SPOT images were rectified by referring to the QuickBird image and field-collected GCPs. We analyzed the satellite images using a hybrid method of Phua et al. (2012), based on the unsupervised classification of principal components (PCs) of multitemporal NDWI images [22]. As a four-dimensional dataset, we performed principal component analysis on the multitemporal NDWIs. PCs 1, 2, and 3 were classified using the fuzzy C-mean classifier, producing fire frequency classes with kappa accuracy higher than 80% for both fire events. We extracted burned patches of different fire frequencies as vector polygons. As the spatial resolutions of the two datasets were very different, we only used polygons larger than 0.25 ha for further analyses. The polygons were overlaid on the object-based land cover classification of the QuickBird image to derive land cover composition for the burned patches. The forest class pixels within each patch were counted and quantified as residual forest cover.
3. Results
3.1. Comparison of Pixel-Based and Object-Based Land Cover Classifications
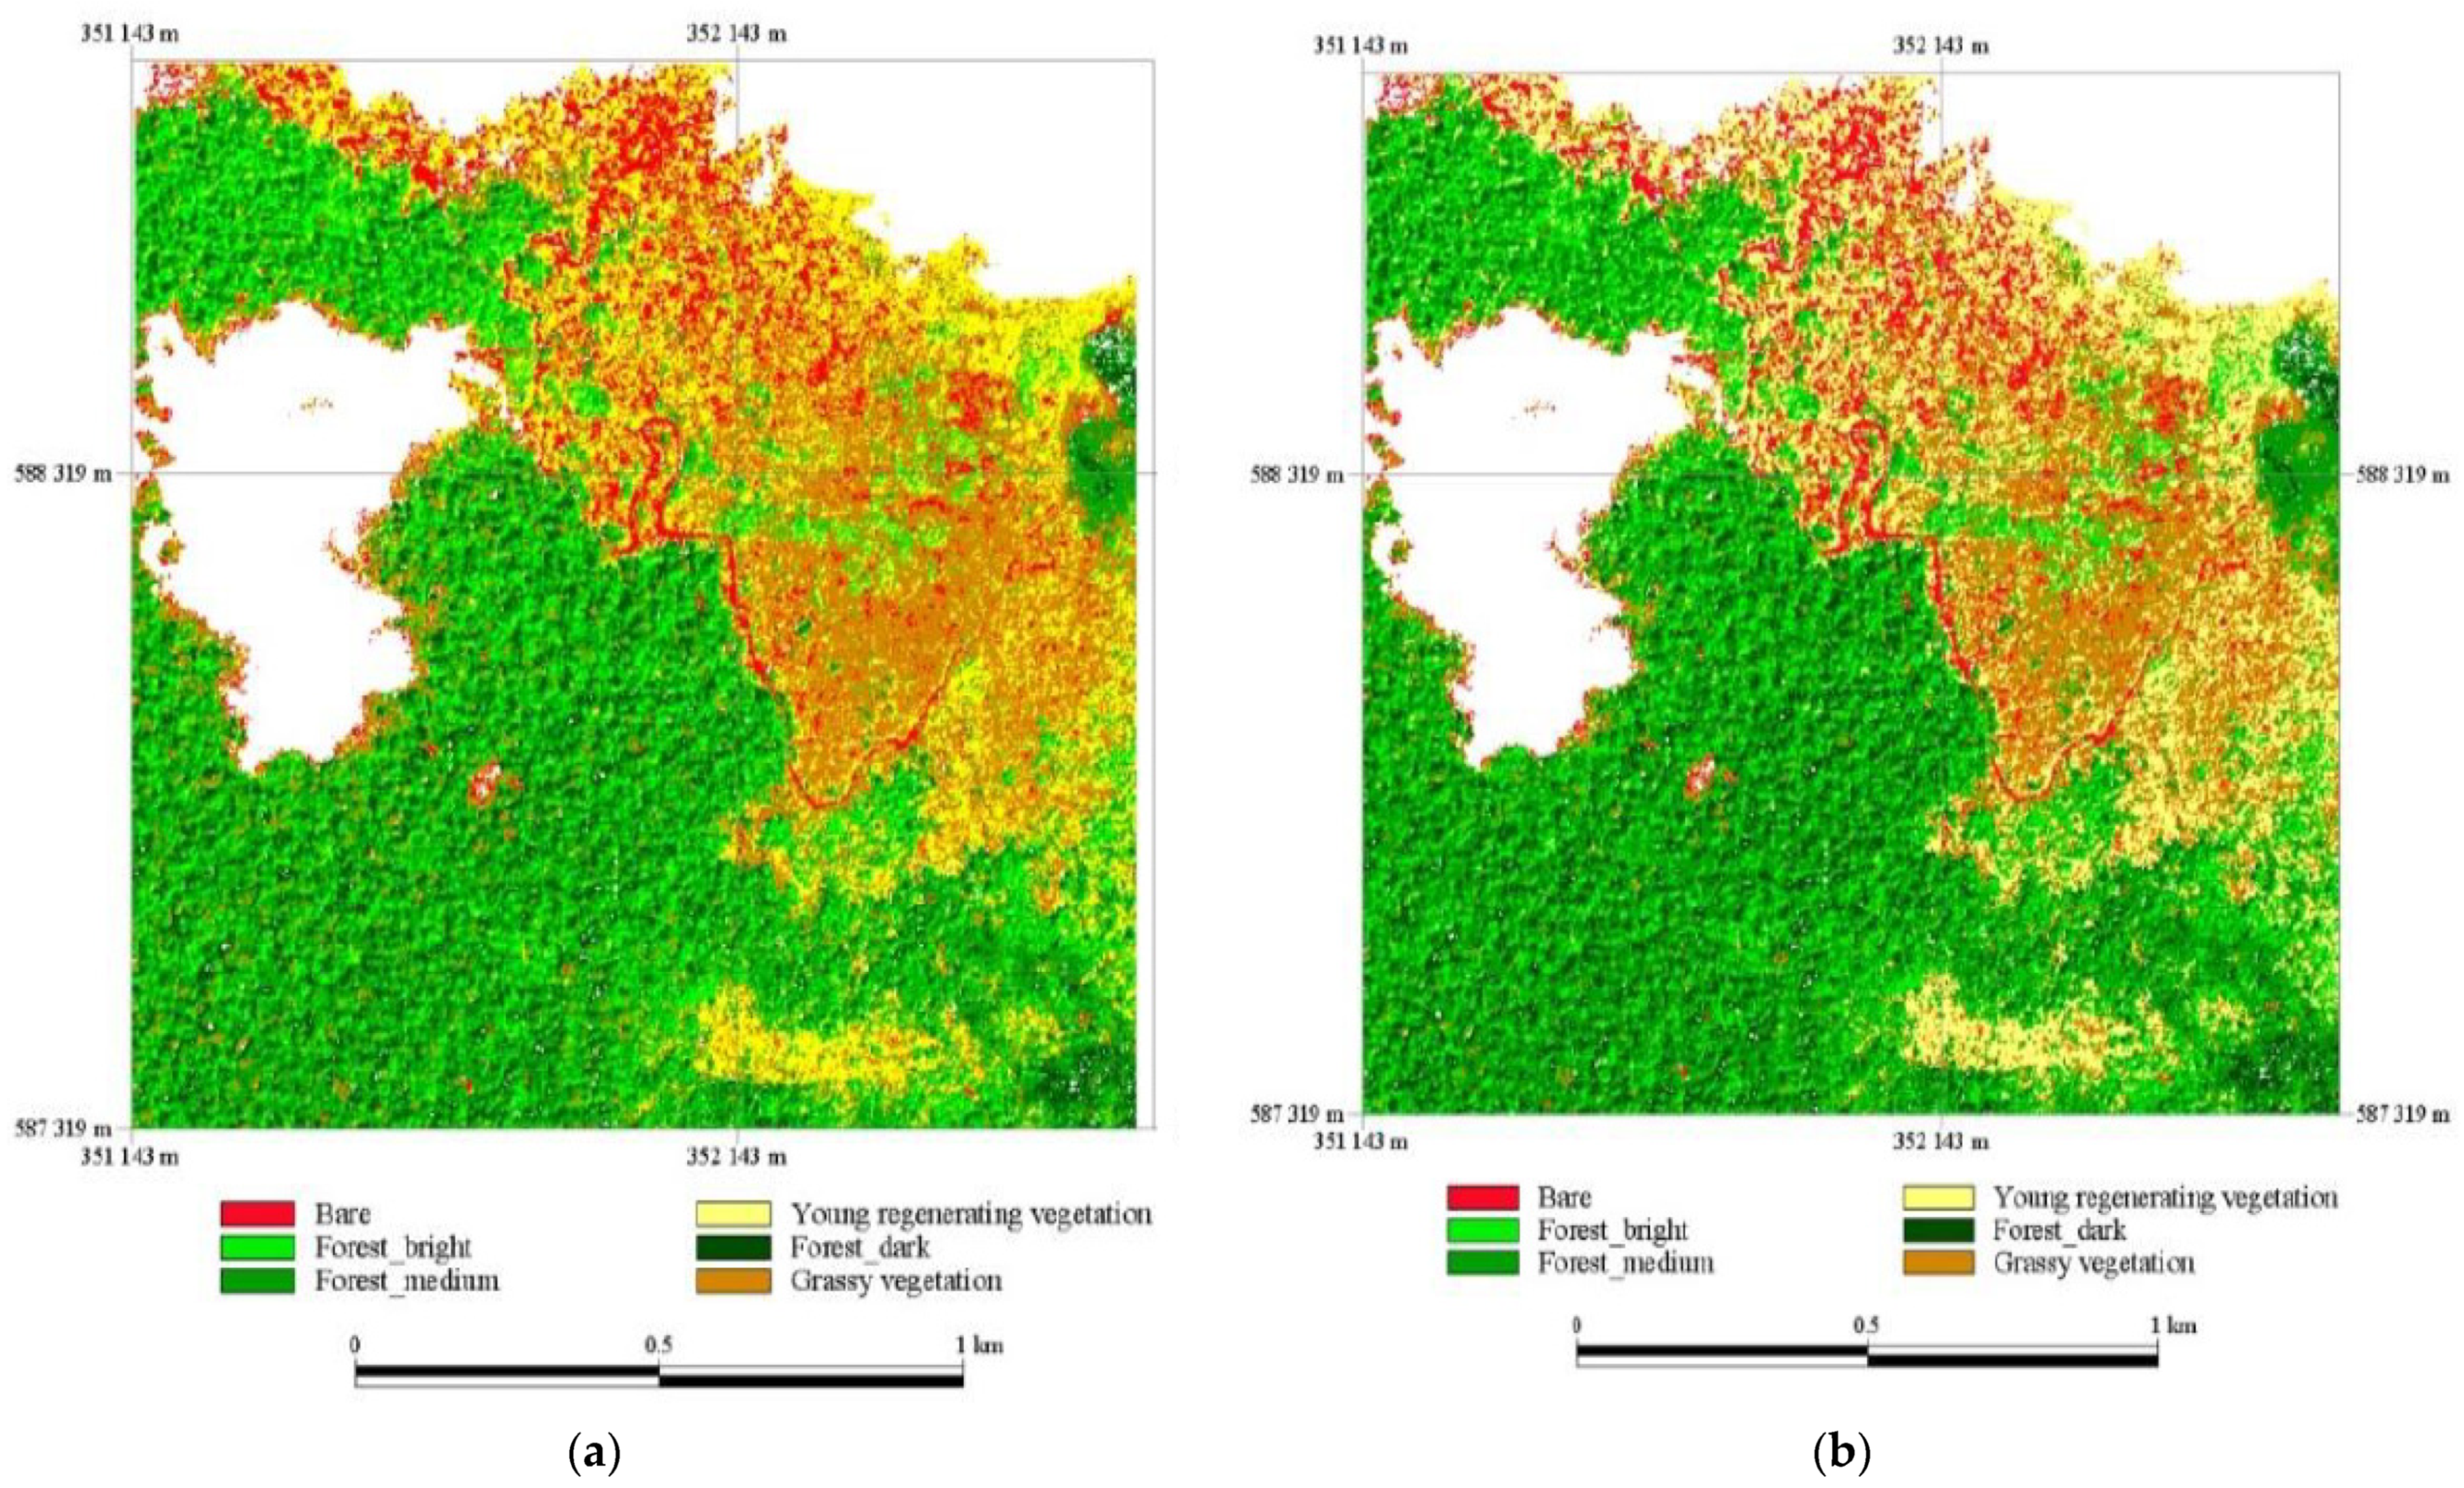
Object-based and pixel-based classifications of post-fire land cover types were compared in terms of accuracy. The total and kappa accuracies for the pixel-based classification were 94.00% and 0.90, respectively (Table 1). Producer accuracies were higher than 90% for all classes, while two classes were below 85% for user accuracy. The object-based classification had total accuracy of 94.5% and 0.93 for kappa accuracy. All classes had producer accuracy higher than 95%, except for the bare class. For user accuracy, only the grassy vegetation class was lower than 90%. Figure 2 shows the results of the pixel-based and object-based classifications. Both maps were visually similar, but the salt-and-pepper effect was apparent in the pixel-based classification map (Figure 2a) compared to the object-based classification (Figure 2b). Therefore, the object-based land cover classification was considered superior to the pixel-based classification for analyzing the fire impact in detail.
3.2. Impacts of Fire Frequency on Residual Forest Cover
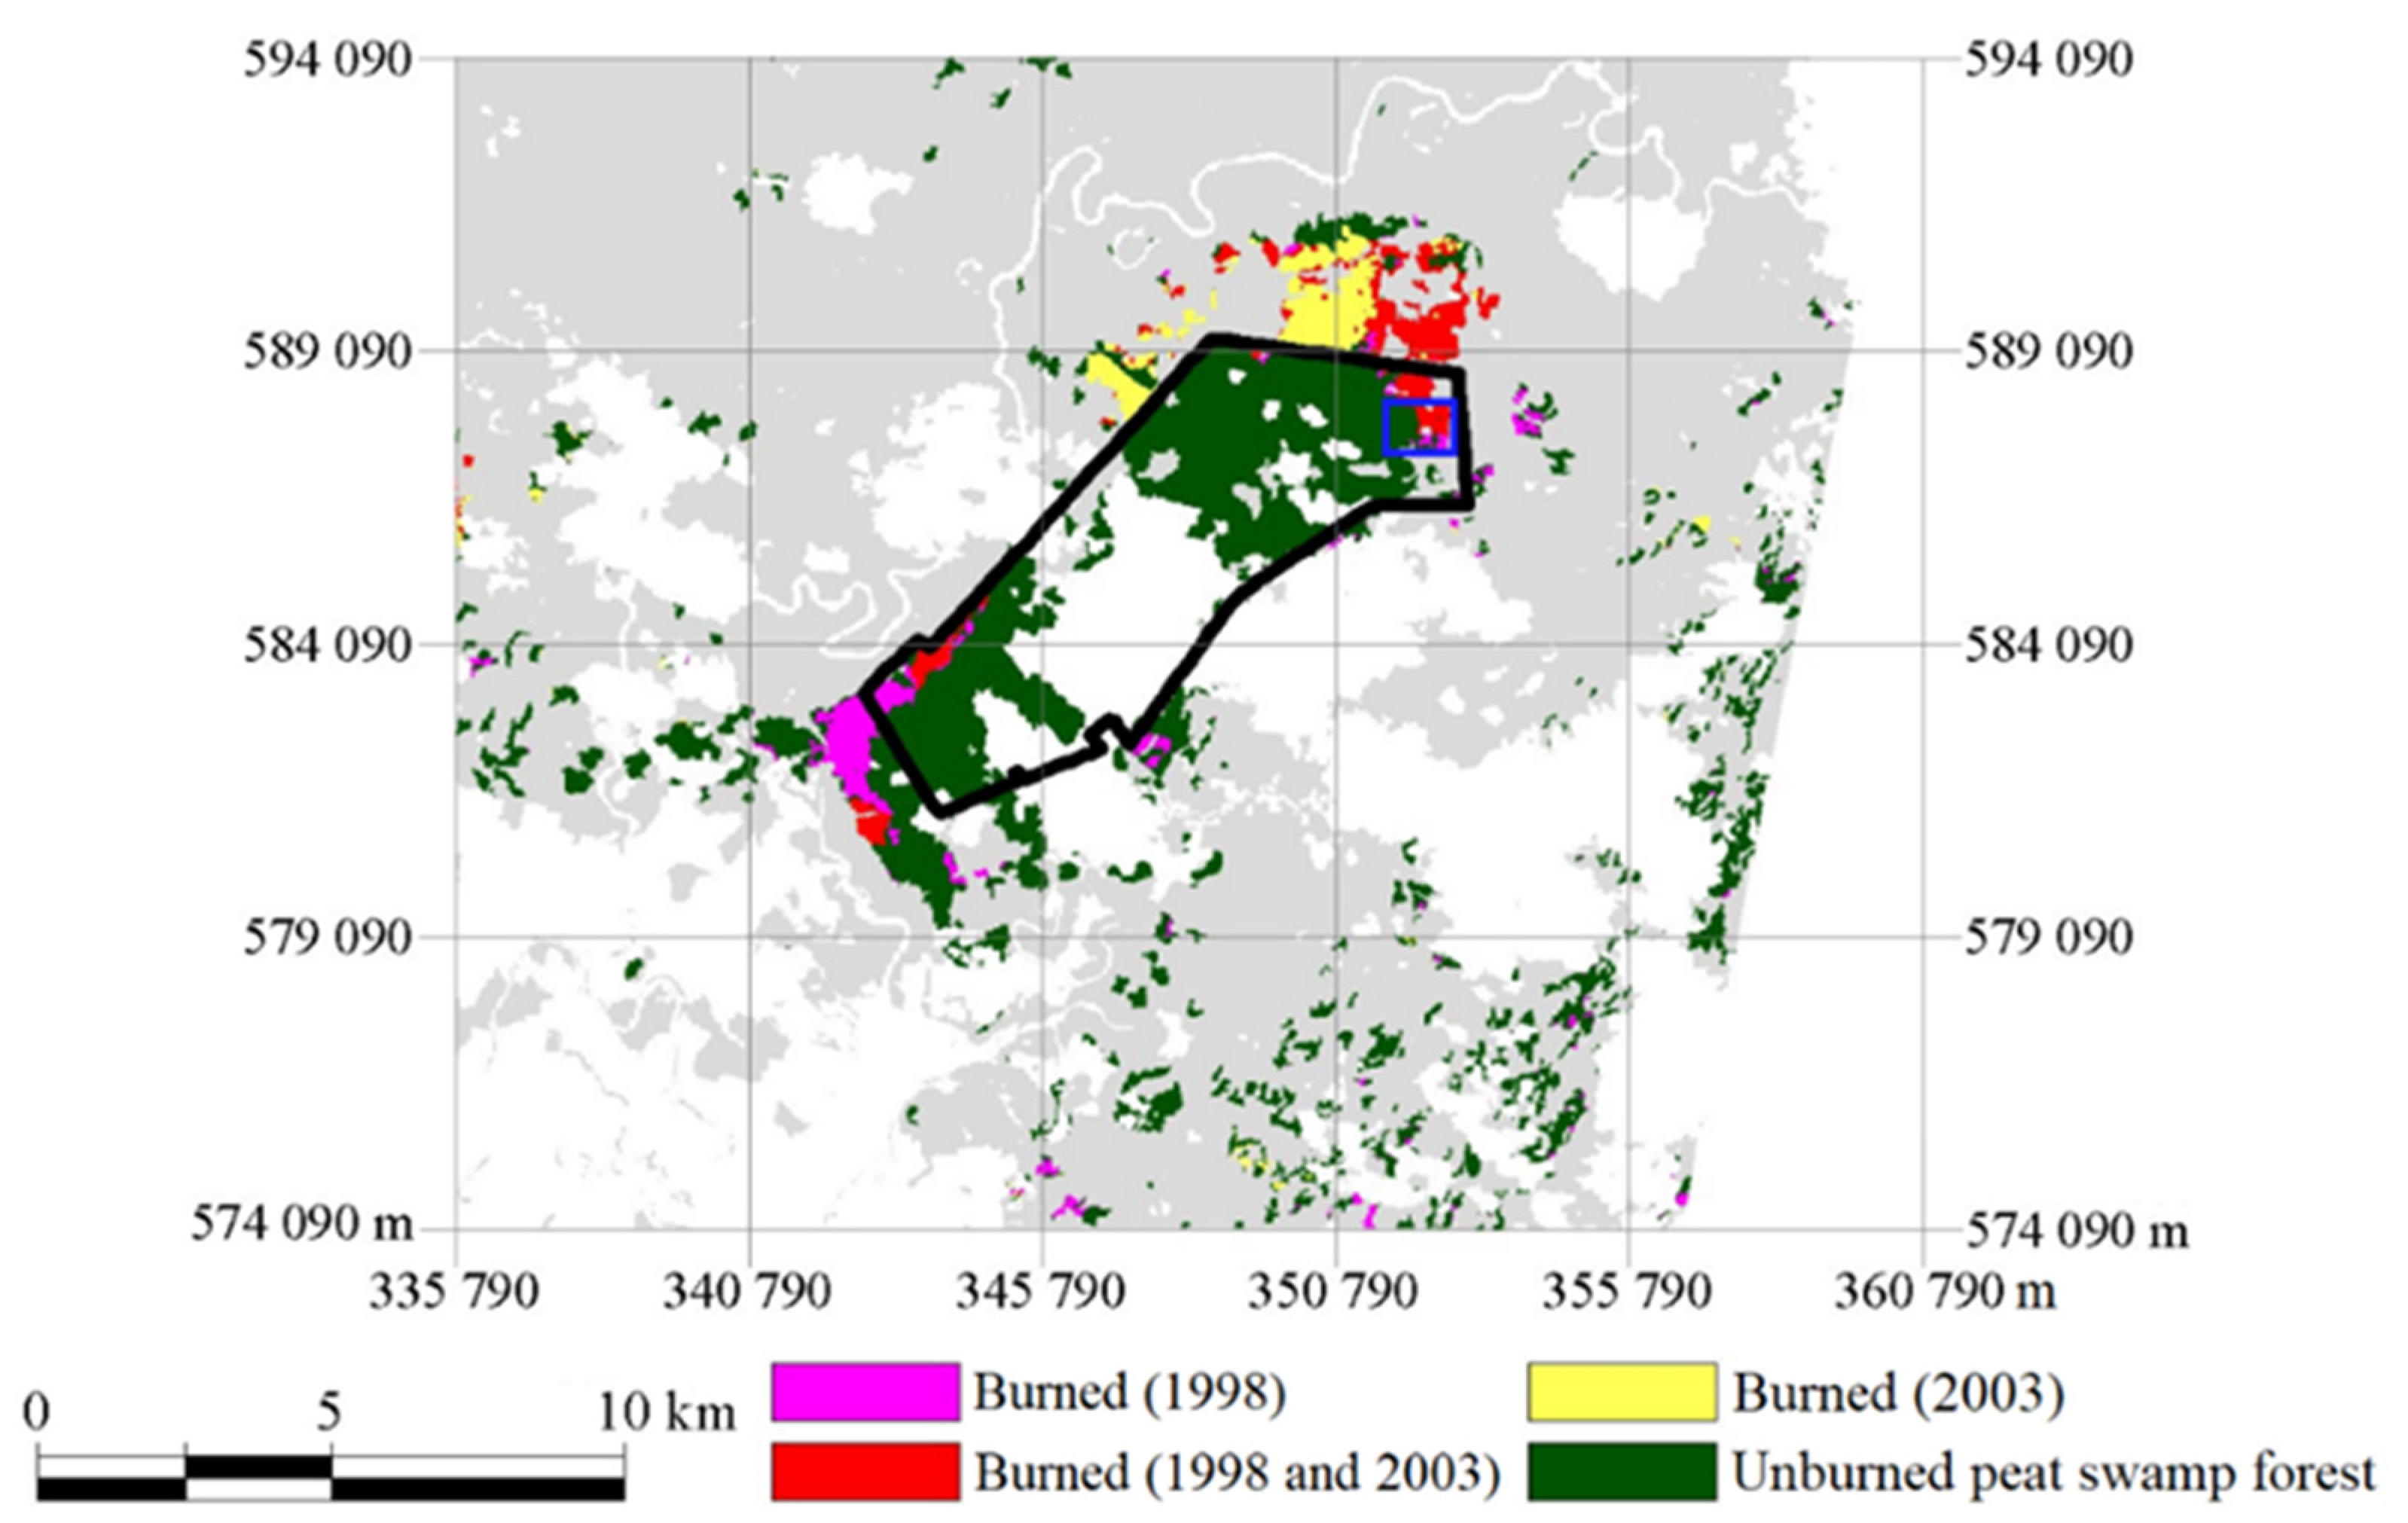
Figure 3 shows the fire frequency map based on analysis of multitemporal high-resolution satellite images. Within the study site (blue rectangle in Figure 2), the burned areas were burned once in 1998 or burned twice in 1998 and 2003. Most areas burned in 1998 were reburned in 2003. We extracted the burned patches of different fire frequencies to examine the post-fire land cover composition. There were 10 patches in the burned-once area, but three made up 80% of the total area (Table 2). While the largest patch was 11.33 ha, the second and third largest patches were 4.56 ha and 1.23 ha, respectively. The smallest burned patch was 0.25 ha. For the burned-twice area, there were only five patches with a total of 67.15 ha. The largest patch was 65.98 ha, constituting 98% of the burned-twice patches. Three of five patches were 0.27 ha, the smallest patch size for the burned-twice patches.
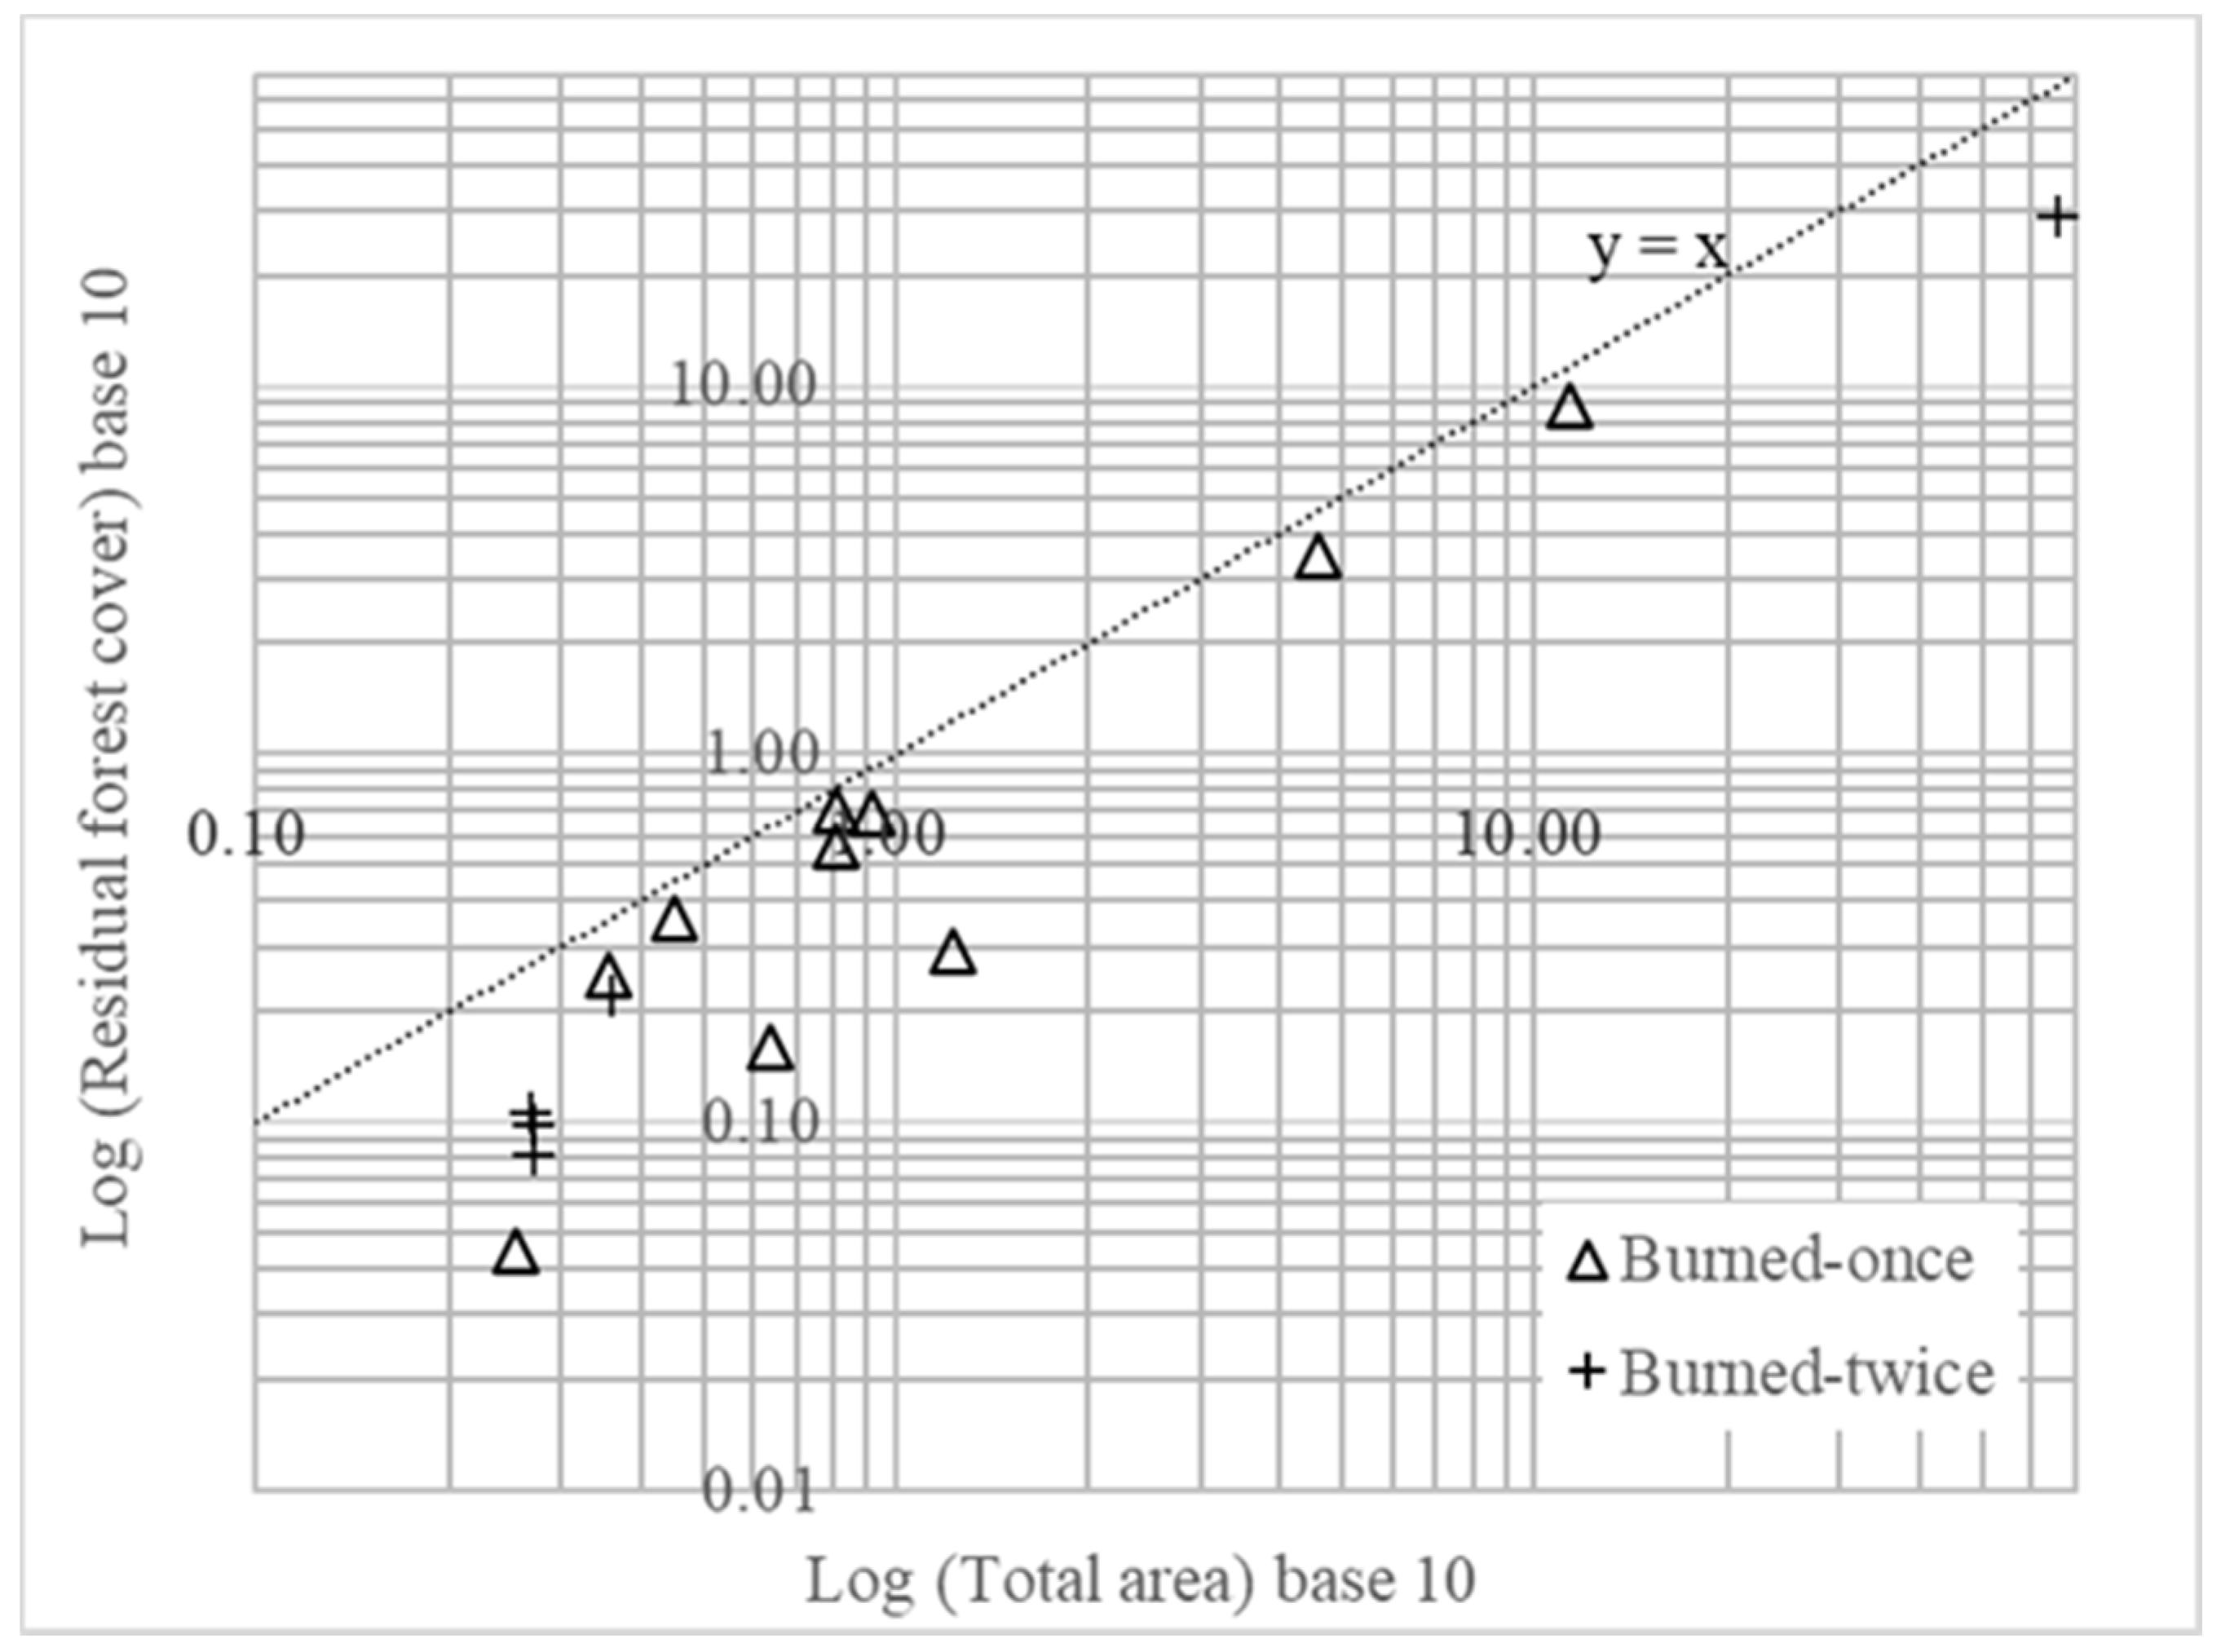
The area and percentage of land cover classes in the burned-once and burned-twice patches are highly different (Table 2). For the burned-once patches, the bare area was less than 10%. The grassy and young regenerating vegetation classes covered 3.48% to 33.84% and 9.08% to 60.50% of the patch areas. The forest cover ranged from 17.49% to 86.64%, with an average of 60.28%. For the burned-twice patches, the bare area covered up to 52.14%. The grassy vegetation cover ranged between 5.09% and 19.22%, while the young regeneration vegetation class covered 24.43% to 57.71% of the patch areas. The forest class had an average cover of 42.13% and ranged from 30.05% to 60.87% of the patch areas. Figure 4 shows the relationship between the total area and residual forest cover for the patches. The residual forest area was larger in larger patches for both burned-once and burned-twice patches. Of the 10 burned-once patches, 7 were close to the Y = X line, which indicates a one-to-one relationship as in an unburned forest. The burned-twice patches were distributed further away from the Y = X line except for one patch.
3.3. Impacts of Fire Frequency on Forest Structure
Table 3 shows the forest structure characteristics of unburned, burned-once, and burned-twice patches. The mean DBH ranged between 14.84 cm and 46.63 cm for the unburned forest, while the mean height was between 15.92 m and 29.41 m for the DBH classes. The mean tree density was high for the DBH 10–20 cm class (216 trees/ha) and decreased sharply for larger DBH classes. The DBH > 40 cm class only had 58.04 trees/ha, but the mean basal area and AGB were highest among the DBH classes. For the burned-once area, the mean DBH was between 14.08 cm and 50.17 cm, while the mean height ranged between 14.75 m and 30.51 m for the DBH classes. The mean tree density was between 22.50 trees/ha and 79.17 trees/ha. The mean basal area was between 0.13 m2/ha and 0.92 m2/ha. In terms of AGB, the DBH > 40 cm class had the highest mean of 59.43 t/ha, while the lowest was the 20–30 cm class (6.85 t/ha). The mean DBH and height for the burned-twice areas were not very different from the burned-once areas. The mean values ranged between 15.21 cm and 52.00 cm and between 12.07 m and 31.00 m for DBH and height, respectively. The mean tree density was 25.00 trees/ha and 12.50 trees/ha for the smallest and largest DBH classes, respectively. The mean basal area was only between 0.47 m2/ha and 2.67 m2/ha, while the mean AGB ranged between 3.35 t/ha and 35.32 t/ha for the DBH classes.
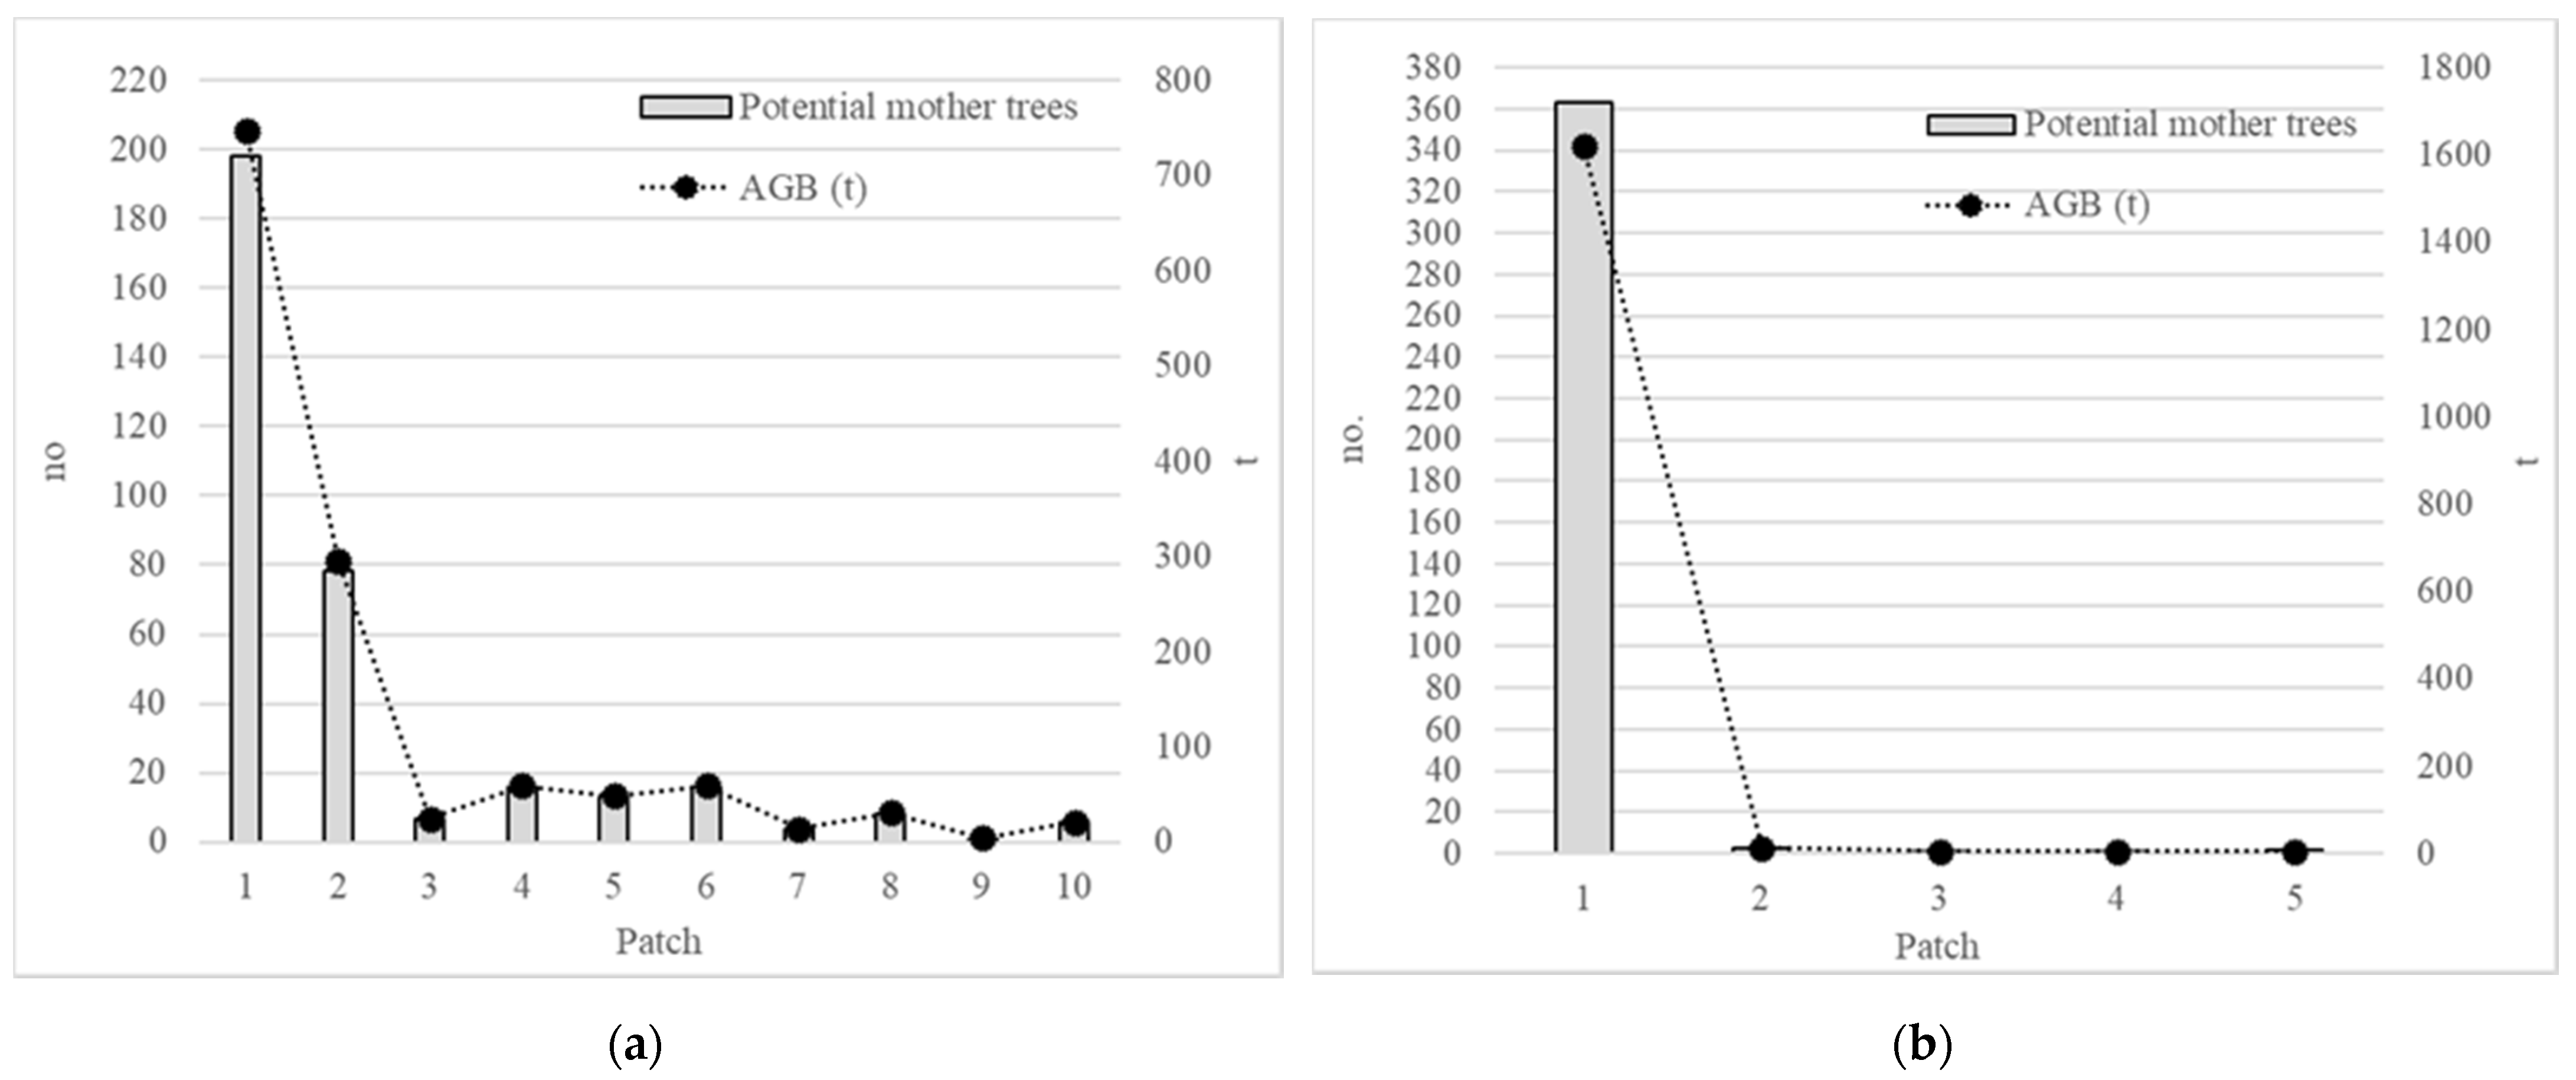
Based on tree density of DBH > 40 cm class and forest cover from the object-based classification of the QuickBird image, we estimated potential mother trees and AGB in burned patches of different fire frequencies (Figure 5). Of the 10 burned-once patches, 2 had more than 50 potential mother trees, with AGB higher than 200 t. For burned-twice patches, the largest patch had more than 350 mother trees and AGB of more than 1500 t, but the remaining patches had less than 20 mother trees and very low AGB.
4. Discussion
Burned area is often estimated as a measure of fire impact and provides accurate extents and perimeters for various purposes, including rehabilitation planning and estimation of gas and particulate emissions [8,36]. High- to moderate-spatial resolution orbital sensors (<100 m) are used to estimate burned areas at local to regional scales [10]. The increasing availability of very high-resolution satellite sensors offers an opportunity to extract detailed land cover information for fire impact assessment [21,37]. The object-based classification approach is presumably superior to the traditional pixel-based classification approach, with its high-resolution satellite image. Based on a survey of 209 journal papers, the object-based classification can achieve up to 95% accuracy but can be as low as 46% [38]. In this study, we compared the object-based and pixel-based classification for classifying the QuickBird image. The object-based approach was marginally better than the pixel-based approach for total accuracy, with a higher kappa accuracy of 0.93 vs. 0.90 for the pixel-based approach. The classification errors could be partially due to the one-year temporal difference between the field information and the QuickBird image. Nevertheless, we observed that the salt-and-pepper effect was lesser in the object-based classification than the pixel-based classification: the object-based approach minimizes within-class spectral variability by assigning all pixels in the object to a land cover class [39,40].
Forest fires generally create a heterogeneous landscape with small and fragmented burned patches [18], but the impacts of multiple fires are not well-reported. The burned-once patches had become more fragmented, consisting of 10 small patches, ranging from 0.25 ha to 11.33 ha. Previously burned areas tend to have open canopies, dry floors, and abundant herbaceous regrowth, prone to recurrent fires [17]. In our study site, more than 75% of previously burned areas were burned again in 2003. Repeat fires had devastated the previously burned peat swamp forest, resulting in five patches with one large patch of 98% of the burned-twice patches.
Overlaying forest cover derived from a very high-resolution satellite image with a high-resolution burned area map assesses fire impact in details. Researchers estimated residual forest cover of a fire event in the boreal forest of Alberta using Landsat and IKONOS images [21]. Our study estimated residual forest cover in the burned patches of different fire frequencies by combining the QuickBird with high-resolution satellite images. Results showed that increasing fire frequency had a more severe impact on residual forest cover of the burned-twice patches. While 7 of the 10 burned-once patches had more than 50% residual forest cover, only the largest patch had a residual forest cover higher than 50% in the burned-twice area. Generally, larger burned patches retained higher residual forest cover for both burned-once and burned-twice patches. The 1998 fire substantially reduced the forest cover in burned-once patches, but 70% of the patches were close to the X = Y line, representing the unburned forest. In contrast, most of the burned-twice patches were comparatively far from the X = Y line, indicating a further reduction of residual forest cover (Figure 4). Although the data is relatively small for further statistical analysis, the relationship between the total patch area and residual forest cover improves our understanding of the fire frequency impact on residual forest cover, crucial for forest recovery assessment [22,29,41].
In Borneo, fires cause a sizable decrease of large trees and alter the forest structure [42]. Our field data have some limitations due to different sampling methods and are relatively small. However, it is evident that repeated fires had modified the tree density distribution among the DBH classes and reduced the number of large trees as well. For unburned forest, the tree densities in the smallest DBH classes were 3 to 5.8 times higher than the largest DBH (>40 cm) class. Tree density distribution in the burned-once area still resembled the unburned forest, but the tree density of DBH > 40 cm class was only 25.50 trees/ha vs. 58.04 trees/ha in the unburned forest. For the burned-twice area, tree density distribution differed from the unburned forest, while the DBH > 40 cm class tree density was only 12.5 trees/ha. Large trees are pivotal structures that play a role in reproduction, recruitment, and succession in a forest [43,44]. Large trees substantially contribute to the AGB, representing the three-dimensional structure habitat in which organisms adapt for growth, survival, and reproduction. For the study site, forest recovery through a natural regeneration process is possible in the burned-once patches, which were relatively abundant in potential mother trees and AGB. Seedlings tend to cluster around the mother trees in a peat swamp forest [45], predominantly in a 10 m radius from the mother trees [46]. Moreover, seed dispersal may occur from the unburned forests next to the burned-once areas [45]. Recurrent fires reduce the biological complexity of forests [47] and slow down regeneration [42]. Our study shows that the burned-twice patches were low in potential mother trees and AGB, except for the largest patch. These patches are relatively far from the unburned forest. Phua et al. [48] reported that none of the regenerated species in the burned-twice area was similar to those in the burned-once and unburned forests. The burned-twice patch would be less likely to recover through natural regeneration, such that rehabilitation is recommended.
5. Conclusions
Tropical peat swamp forests are threatened by recurring El Niño-related fires, creating a mosaic of burned patches with different fire histories. We examined the impact of multiple fires on a peat swamp forest in the Klias Peninsula, using a combination of high and very high-resolution satellite images. Consistent with previous studies, object-based classification was superior to pixel-based classification in producing the fine-scale postfire land cover classification map. Multitemporal high-resolution satellite images allowed the extraction of burned patches of different fire frequencies. More abundant residual forest cover in bigger burned patches provide a better understanding on the fire impact on peat swamp forest. We determined the structural impact from multiple fires, indicating burned-once areas still structurally resembled the unburned forest, while the burned-twice areas were very different. There were more burned-once patches with relatively abundant potential mother trees and AGB vs burned-twice patches. Increased fire frequency can cause further decline in the number of burned patches, severely reducing the residual forest cover and adversely altering the structural characteristics of these patches. Very high and high-resolution satellite sensors can be applied to other forest types to analyze the characteristics of burned patches affected by multiple fires at a fine scale for better post-fire forest management.
Author Contributions
Conceptualization, M.-H.P. and S.T.; methodology, M.-H.P. and S.T.; software, S.T.; validation, M.-H.P.; formal analysis, M.-H.P.; investigation, M.-H.P.; resources, M.-H.P. and S.T.; data curation, M.-H.P.; writing—original draft preparation, M.-H.P.; writing—review and editing, M.-H.P. and S.T.; visualization, M.-H.P.; project administration, M.-H.P. and S.T.; funding acquisition, M.-H.P. and S.T. All authors have read and agreed to the published version of the manuscript.
Funding
The authors wish to acknowledge support from the Grant-in-Aid for Scientific Research of the Japan Society for Promotion of Science and External Collaboration Grant of Universiti Malaysia Sabah (GKP0005-STWN-2016).
Acknowledgments
We are also thankful to Sabah Forestry Department for permission to conduct field research and provide logistics.
Conflicts of Interest
The authors declare no conflict of interest. The funders had no role in the design of the study; in the collection, analyses, or interpretation of data; in the writing of the manuscript, or in the decision to publish the results.
References
- Page, S.E.; Rieley, J.O.; Banks, C.J. Global and regional importance of the tropical peatland carbon pool. Glob. Change Biol. 2011, 17, 798–818. [Google Scholar] [CrossRef] [Green Version]
- Saatchi, S.S.; Harris, N.L.; Brown, S.; Lefsky, M.; Mitchard, E.T.; Salas, W.; Zutta, B.R.; Buermann, W.; Lewis, S.L.; Hagen, S.; et al. Benchmark map of forest carbon stocks in tropical regions across three continents. Proc. Natl. Acad. Sci. USA 2011, 108, 9899–9904. [Google Scholar] [CrossRef] [Green Version]
- Phillips, V.D. Peat swamp ecology and sustainable development in Borneo. Biod. Conserv. 1998, 7, 651–671. [Google Scholar] [CrossRef]
- Brookfield, H.C.; Byron, Y.; Potter, L.M. In Place of the Forest: Environmental and Socio-Economic Transformation in Borneo and the Eastern Malay Peninsula; United Nations University Press: Tokyo, Japan, 1995; Volume 893. [Google Scholar]
- Aiba, S.I.; Kitayama, K. Effects of the 1997–98 El Nino drought on rain forests of Mount Kinabalu, Borneo. J. Trop. Ecol. 2002, 18, 215–230. [Google Scholar] [CrossRef]
- Page, S.E.; Siegert, F.; Rieley, J.O.; Boehm, H.D.V.; Jaya, A.; Limin, S. The amount of carbon released from peat and forest fires in Indonesia during 1997. Nature 2002, 420, 61–65. [Google Scholar] [CrossRef]
- Lentile, L.B.; Holden, Z.A.; Smith, A.M.S.; Falkowski, M.J.; Hudak, A.T.; Morgan, P.; Lewis, S.A.; Gessler, P.E.; Benson, N.C. Remote sensing techniques to assess active fire characteristics and post-fire effects. Int. J. Wildland Fire 2006, 15, 319–345. [Google Scholar] [CrossRef]
- Morgan, P.; Keane, R.E.; Dillon, G.K.; Jain, T.B.; Hudak, A.T.; Karau, E.C.; Sikkink, P.G.; Holden, Z.A.; Strand, E.K. Challenges of assessing fire and burn severity using field measures, remote sensing and modelling. Int. J. Wildland Fire 2014, 23, 1045–1060. [Google Scholar] [CrossRef] [Green Version]
- Meng, R.; Zhao, F. Remote sensing of fire effects: A review for recent advances in burned area and burn severity mapping. In Remote Sensing of Hydrometeorological Hazards; Petropoulos, G.P., Islam, T., Eds.; CRC Press: Boca Raton, FL, USA, 2017; pp. 261–283. [Google Scholar]
- Szpakowski, D.M.; Jensen, J.L. A review of the applications of remote sensing in fire ecology. Remote Sens. 2019, 11, 2638. [Google Scholar] [CrossRef] [Green Version]
- De Santis, A.; Chuvieco, E. GeoCBI: A modified version of the Composite Burn Index for the initial assessment of the short-term burn severity from remotely sensed data. Remote Sens. Environ. 2009, 113, 554–562. [Google Scholar] [CrossRef]
- Kolden, C.A.; Smith, A.M.; Abatzoglou, J.T. Limitations and utilisation of Monitoring Trends in Burn Severity products for assessing wildfire severity in the USA. Int. J. Wildland Fire 2015, 24, 1023–1028. [Google Scholar] [CrossRef]
- Leon, J.R.R.; Van Leeuwen, W.J.; Casady, G.M. Using MODIS-NDVI for the modeling of post-wildfire vegetation response as a function of environmental conditions and pre-fire restoration treatments. Remote Sens. 2012, 4, 598–621. [Google Scholar] [CrossRef] [Green Version]
- Phua, M.H.; Tsuyuki, S.; Lee, J.S.; Sasakawa, H. Detection of burned peat swamp forest in a heterogeneous tropical landscape: A case study of the Klias Peninsula, Sabah, Malaysia. Landsc. Urb. Plann. 2007, 82, 103–116. [Google Scholar] [CrossRef]
- Razali, S.M.; AA Nuruddin, A.A.; IA Malek, I.A.; NA Patah, N.A. Forest fire hazard rating assessment in peat swamp forest using Landsat thematic mapper image. J. Appl. Remote Sens. 2010, 4, 043531. [Google Scholar] [CrossRef]
- Vanderhoof, M.K.; Hawbaker, T.J.; Teske, C.; Ku, A.; Noble, J.; Picotte, J. Mapping wetland burned area from Sentinel-2 across the Southeastern United States and its contributions relative to Landsat-8 (2016–2019). Fire 2021, 4, 52. [Google Scholar] [CrossRef]
- Cochrane, M.A.; Alencar, A.; Schulze, M.D.; Souza, C.M., Jr.; Nepstad, D.C.; Lefebvre, P.; Davidson, E. Positive feedbacks in the fire dynamic of closed canopy tropical forests. Science 1999, 284, 1832–1835. [Google Scholar] [CrossRef] [PubMed]
- Turner, M.G.; Hargrove, W.W.; Gardner, R.H.; Romme, W.H. Effects of fire on landscape heterogeneity in Yellowstone National Park, Wyoming. J. Veg. Sci. 1994, 5, 731–742. [Google Scholar] [CrossRef] [Green Version]
- Holden, Z.A.; Morgan, P.; Smith, A.M.; Vierling, L. Beyond Landsat: A comparison of four satellite sensors for detecting burn severity in ponderosa pine forests of the Gila Wilderness, NM, USA. Int. J. Wildland Fire 2010, 19, 449–458. [Google Scholar] [CrossRef] [Green Version]
- Meng, R.; Wu, J.; Schwager, K.L.; Zhao, F.; Dennison, P.E.; Cook, B.D.; Brewster, K.; Green, T.M.; Serbin, S.P. Using high spatial resolution satellite imagery to map forest burn severity across spatial scales in a Pine Barrens ecosystem. Remote Sens. Environ. 2017, 191, 95–109. [Google Scholar] [CrossRef] [Green Version]
- Kachmar, M.; Sánchez-Azofeifa, G.A. Detection of post-fire residuals using high-and medium-resolution satellite imagery. For. Chron. 2006, 82, 177–186. [Google Scholar] [CrossRef] [Green Version]
- Phua, M.H.; Tsuyuki, S.; Lee, J.S.; Ghani, M. Simultaneous detection of burned areas of multiple fires in the tropics using multisensor remote sensing data. Int. J. Remote Sens. 2012, 33, 4312–4333. [Google Scholar] [CrossRef]
- Ballhorn, U.; Siegert, F.; Mason, M.; Limin, S.; Limin, S. Derivation of burn scar depths and estimation of carbon emissions with LIDAR in Indonesian peatlands. Proc. Natl. Acad. Sci. USA 2009, 106, 21213–21218. [Google Scholar] [CrossRef] [Green Version]
- Englhart, S.; Jubanski, J.; Siegert, F. Quantifying dynamics in tropical peat swamp forest biomass with mul-ti-temporal LiDAR datasets. Remote Sens. 2013, 5, 2368–2388. [Google Scholar] [CrossRef] [Green Version]
- McPartland, M.Y.; Falkowski, M.J.; Reinhardt, J.R.; Kane, E.S.; Kolka, R.; Turetsky, M.R.; Douglas, T.A.; An-derson, J.; Edwards, J.D.; Palik, B.; et al. Characterizing Boreal peatland plant composition and species diversity with hyperspectral remote sensing. Remote Sens. 2019, 11, 1685. [Google Scholar] [CrossRef] [Green Version]
- Cui, B.; Xie, X.; Ma, X.; Ren, G.; Ma, Y. Superpixel-based extended random walker for hyperspectral image classification. IEEE Trans. Geosci. Remote Sens. 2018, 56, 3233–3243. [Google Scholar] [CrossRef]
- Wang, P.; Wang, L.; Leung, H.; Zhang, G. Super-resolution mapping based on spatial–spectral correlation for spectral imagery. IEEE Trans. Geosci. Remote Sens. 2021, 59, 2256–2268. [Google Scholar] [CrossRef]
- Chazdon, R.L. Tropical forest recovery: Legacies of human impact and natural disturbances. Perspect. Plant Ecol. Evol. Syst. 2003, 6, 51–71. [Google Scholar] [CrossRef] [Green Version]
- Turner, M.G.; Baker, W.L.; Peterson, C.J.; Peet, R.K. Factors influencing succession: Lessons from large, infrequent natural disturbances. Ecosystems 1998, 1, 511–523. [Google Scholar] [CrossRef]
- Waide, R.B.; Lugo, A.E. A Research Perspective on Disturbance and Recovery of a Tropical Forest. In Tropical Forests in Transition; Goldammer, J.G., Ed.; Birkhäuser: Basel, Switzerland, 1992; pp. 173–189. [Google Scholar]
- Sabah Forestry Department. Klias Forest Reserve. Available online: https://ww2.sabah.gov.my/htan_caims/Class%20I/A_FR1/klias.htm (accessed on 20 August 2021).
- Manuri, S.; Brack, C.; Nugroho, N.P.; Hergoualc’h, K.; Novita, N.; Dotzauer, H.; Verchot, L.; Putra, C.A.S.; Widyasari, E. Tree biomass equations for tropical peat swamp forest ecosystems in Indonesia. For. Ecol. Manag. 2014, 334, 241–253. [Google Scholar] [CrossRef]
- Baatz, M.; Hoffmann, C.; Willhauck, G. Progressing from object-based to object-oriented image analysis. In Object-Based Image Analysis; Blaschke, T., Lang, S., Hay, G.J., Eds.; Springer: Berlin, Germany, 2008; pp. 29–42. [Google Scholar]
- Stehman, S.V.; Wickham, J.D. Pixels, blocks of pixels, and polygons: Choosing a spatial unit for thematic accuracy assessment. Remote Sens. Environ. 2011, 115, 3044–3055. [Google Scholar] [CrossRef]
- Congalton, R.G. A review of assessing the accuracy of classifications of remotely sensed data. Remote Sens. Environ. 1991, 37, 35–46. [Google Scholar] [CrossRef]
- Jain, A.K. Global estimation of CO emissions using three sets of satellite data for burned area. Atmos. Environ. 2007, 41, 6931–6940. [Google Scholar] [CrossRef]
- Mitri, G.H.; Gitas, I.Z. Mapping post-fire forest regeneration and vegetation recovery using a combination of very high spatial resolution and hyperspectral satellite imagery. Int. J. Appl. Earth Obs. Geoinf. 2013, 20, 60–66. [Google Scholar] [CrossRef]
- Ye, S.; Pontius Jr, R.G.; Rakshit, R. A review of accuracy assessment for object-based image analysis: From per-pixel to per-polygon approaches. ISPRS J. Photogramm. Remote Sens. 2018, 141, 137–147. [Google Scholar] [CrossRef]
- Peña-Barragán, J.M.; Ngugi, M.K.; Plant, R.E.; Six, J. Object-based crop identification using multiple vegetation indices, textural features and crop phenology. Remote Sens. Environ. 2011, 115, 1301–1316. [Google Scholar] [CrossRef]
- Robson, B.A.; Nuth, C.; Dahl, S.O.; Hölbling, D.; Strozzi, T.; Nielsen, P.R. Automated classification of debris-covered glaciers combining optical, SAR and topographic data in an object-based environment. Remote Sens. Environ. 2015, 170, 372–387. [Google Scholar] [CrossRef] [Green Version]
- Del Moral, R.; Bliss, L.C. Mechanisms of primary succession: Insights resulting from the eruption of Mount St. Helens. Adv. Ecol. Res. 1993, 24, 1–66. [Google Scholar]
- Taylor, D.; Saksena, P.; Sanderson, P.G. Environmental change and rain forests on the Sunda shelf of Southeast Asia: Drought, fire and the biological cooling of biodiversity hotspots. Biodivers. Conserv. 1999, 8, 1159–1177. [Google Scholar] [CrossRef]
- Lutz, J.A.; Larson, A.J.; Freund, J.A.; Swanson, M.E.; Bible, K.J. The importance of large-diameter trees to forest structural heterogeneity. PLoS ONE 2013, 8, 82784. [Google Scholar] [CrossRef] [Green Version]
- Bradford, M.; Murphy, H.T. The importance of large-diameter trees in the wet tropical rainforests of Australia. PLoS ONE 2019, 14, 0208377. [Google Scholar] [CrossRef] [Green Version]
- Chai, P.P.K. Seed Production Area in Klias Peat Swamp Forest, Beaufort District, Sabah, Malaysia; UNDP: Kota Kinabalu, Malaysia, 2005. [Google Scholar]
- Hamzah, K.A.; Ismail, P.; Ani, S.; Mohd Azahari, F.; Harry, Y.; Ihsan, S.K. Gonystylus Bancanus: Jewel of the Peat Swamp Forest; Forest Research Institute Malaysia: Selangor, Malaysia, 2010. [Google Scholar]
- Schindele, W.; Thoma, W.; Panzer, K. The Forest Fire 1982/1983 in East Kalimantan; German Forest Inventory Service Ltd.: Jakarta, Indonesia, 1989. [Google Scholar]
- Phua, M.H.; Ghani, M.A.A.; Cooke, F.M.; Tsuyuki, S. Evaluation of recovery potential of forest affected by multiple fires using QuickBird and multitemporal medium resolution satellite data. In Proceedings of the 31st Asian Conference on Remote Sensing, Asian Association of Remote Sensing, Hanoi, Vietnam, 1–5 November 2010. [Google Scholar]
Figure 1.
Location of the Klias Forest Reserve (red box in the upper figure) and the QuickBird image for the study site. The irregular path in reddish pink is the fire barrier established using a tractor in 2003 to stop the fire spread.
Figure 1.
Location of the Klias Forest Reserve (red box in the upper figure) and the QuickBird image for the study site. The irregular path in reddish pink is the fire barrier established using a tractor in 2003 to stop the fire spread.

Figure 2.
Supervised classification using (a) pixel-based approach and (b) object-based approach.

Figure 3.
Fire frequency map of Klias Forest Reserve (Black polygon) derived from high-resolution satellite images. Rectangle in blue is the study site. Grey and white colors represent other land cover and cloud/ shadow, respectively.
Figure 3.
Fire frequency map of Klias Forest Reserve (Black polygon) derived from high-resolution satellite images. Rectangle in blue is the study site. Grey and white colors represent other land cover and cloud/ shadow, respectively.

Figure 4.
Relationship between total area and residual forest cover of the burned patches by fire frequency.
Figure 4.
Relationship between total area and residual forest cover of the burned patches by fire frequency.

Figure 5.
Estimated potential mother trees and AGB in (a) burned-once and (b) burned-twice patches.

Table 1.
Accuracy matrix for (a) pixel-based classification and (b) object-based classification.
| (a) | Reference | ||||||
|---|---|---|---|---|---|---|---|
| Classification | Bare | Grassy vegetation | Forest | Young regenerating vegetation | User’s accuracy | ||
| Bare | 4672 | 0 | 3 | 4 | 4679 | 99.85 | |
| Grassy vegetation | 411 | 3423 | 267 | 61 | 4162 | 82.24 | |
| Forest | 0 | 307 | 14,770 | 117 | 15,194 | 97.21 | |
| Young regenerating vegetation | 102 | 55 | 276 | 2254 | 2687 | 83.89 | |
| 5185 | 3785 | 15,316 | 2436 | 26,722 | |||
| Producer’s accuracy | 90.11 | 90.44 | 96.44 | 92.53 | |||
| Total accuracy (%) | 94.00 | ||||||
| Kappa accuracy | 0.90 | ||||||
| (b) | Reference | ||||||
| Classification | Bare | Grassy vegetation | Forest tree | Young regenerating vegetation | User’s accuracy | ||
| Bare | 4393 | 0 | 0 | 0 | 4393 | 100.00 | |
| Grassy vegetation | 696 | 3690 | 6 | 79 | 4471 | 82.53 | |
| Forest | 0 | 87 | 15310 | 123 | 15520 | 98.65 | |
| Young regenerating vegetation | 96 | 8 | 0 | 2234 | 2338 | 95.55 | |
| 5185 | 3785 | 15316 | 2436 | 26722 | |||
| Producer’s accuracy | 84.73 | 97.49 | 99.96 | 91.71 | |||
| Total accuracy (%) | 94.50 | ||||||
| Kappa accuracy | 0.93 | ||||||
Table 2.
Land cover statistics of patches of different fire frequencies.
| Bare | Grassy Vegetation | Young Regenerating Vegetation | Forest | Total | |||||
|---|---|---|---|---|---|---|---|---|---|
| (a) Burned-once | |||||||||
| Patch | ha | % | ha | % | ha | % | ha | % | ha |
| 1 | 0.03 | 0.24 | 1.07 | 9.44 | 1.44 | 12.68 | 8.80 | 77.65 | 11.33 |
| 2 | 0.01 | 0.26 | 0.52 | 11.32 | 0.56 | 12.30 | 3.47 | 76.11 | 4.56 |
| 3 | 0.01 | 0.72 | 0.20 | 16.28 | 0.73 | 59.39 | 0.29 | 23.62 | 1.23 |
| 4 | 0.02 | 1.80 | 0.06 | 6.74 | 0.15 | 15.82 | 0.70 | 75.63 | 0.92 |
| 5 | 0.00 | 0.00 | 0.10 | 12.05 | 0.15 | 17.96 | 0.57 | 69.99 | 0.81 |
| 6 | 0.01 | 0.79 | 0.03 | 3.48 | 0.07 | 9.08 | 0.70 | 86.64 | 0.81 |
| 7 | 0.06 | 9.54 | 0.21 | 33.84 | 0.20 | 31.11 | 0.16 | 25.50 | 0.63 |
| 8 | 0.01 | 1.60 | 0.04 | 9.20 | 0.04 | 9.16 | 0.36 | 80.04 | 0.45 |
| 9 | 0.00 | 1.61 | 0.05 | 20.40 | 0.15 | 60.50 | 0.04 | 17.49 | 0.25 |
| 10 | 0.03 | 8.21 | 0.03 | 7.37 | 0.05 | 14.26 | 0.25 | 70.15 | 0.36 |
| Total (ha) | 0.17 | 2.31 | 3.54 | 15.34 | 21.36 | ||||
| (b) Burned-twice | |||||||||
| Patch | ha | % | ha | % | ha | % | ha | % | ha |
| 1 | 9.70 | 33.41 | 3.36 | 5.09 | 23.90 | 36.23 | 29.02 | 43.99 | 65.98 |
| 2 | 0.02 | 7.15 | 0.04 | 10.34 | 0.09 | 24.43 | 0.22 | 60.87 | 0.36 |
| 3 | 0.00 | 0.00 | 0.02 | 6.30 | 0.16 | 57.71 | 0.10 | 35.98 | 0.27 |
| 4 | 0.04 | 52.14 | 0.04 | 15.89 | 0.10 | 38.40 | 0.08 | 30.05 | 0.27 |
| 5 | 0.03 | 28.73 | 0.05 | 19.22 | 0.08 | 29.63 | 0.11 | 39.74 | 0.27 |
| Total (ha) | 9.79 | 3.51 | 24.33 | 29.53 | 67.15 | ||||
Table 3.
Forest structure by DBH classes for (a) unburned, (b) burned-once and (c) burned-twice.
| (a) Unburned | |||||
|---|---|---|---|---|---|
| DBH Class | Mean DBH (cm) | Mean Height (m) | Mean Tree Density (no/ha) | Mean Basal Area (m2/ha) | Mean AGB (t/ha) |
| 10–20 | 14.84 | 15.92 | 216.41 | 2.01 | 6.05 |
| 20–30 | 24.18 | 18.24 | 70.00 | 2.92 | 14.47 |
| 30–40 | 33.93 | 25.07 | 36.81 | 3.04 | 36.29 |
| >40 | 46.63 | 29.41 | 58.04 | 10.04 | 126.22 |
| (b) Burned-Once | |||||
| DBH Class | Mean DBH (cm) | Mean Height (m) | Mean Tree Density (no/ha) | Mean Basal Area (m2/ha) | Mean AGB (t/ha) |
| 10–20 | 14.08 | 14.75 | 79.17 | 0.13 | 8.77 |
| 20–30 | 24.50 | 20.17 | 18.75 | 0.62 | 6.85 |
| 30–40 | 35.33 | 17.67 | 9.38 | 0.92 | 9.91 |
| >40 | 50.17 | 30.51 | 22.50 | 0.20 | 59.43 |
| (c) Burned-Twice | |||||
| DBH Class | Mean DBH (cm) | Mean Height (m) | Mean Tree Density (no/ha) | Mean Basal Area (m2/ha) | Mean AGB (t/ha) |
| 10–20 | 15.21 | 12.07 | 25.00 | 0.47 | 3.35 |
| 20–30 | 23.63 | 18.98 | 22.50 | 0.98 | 8.79 |
| 30–40 | 33.50 | 17.25 | 15.63 | 0.80 | 8.38 |
| >40 | 52.00 | 31.00 | 12.50 | 2.67 | 35.32 |
Publisher’s Note: MDPI stays neutral with regard to jurisdictional claims in published maps and institutional affiliations. |
© 2021 by the authors. Licensee MDPI, Basel, Switzerland. This article is an open access article distributed under the terms and conditions of the Creative Commons Attribution (CC BY) license (https://creativecommons.org/licenses/by/4.0/).
Share and Cite
MDPI and ACS Style
Phua, M.-H.; Tsuyuki, S. Assessing Impact of Multiple Fires on a Tropical Peat Swamp Forest Using High and Very High-Resolution Satellite Images. Fire 2021, 4, 89. https://doi.org/10.3390/fire4040089
AMA Style
Phua M-H, Tsuyuki S. Assessing Impact of Multiple Fires on a Tropical Peat Swamp Forest Using High and Very High-Resolution Satellite Images. Fire. 2021; 4(4):89. https://doi.org/10.3390/fire4040089
Chicago/Turabian StylePhua, Mui-How, and Satoshi Tsuyuki. 2021. "Assessing Impact of Multiple Fires on a Tropical Peat Swamp Forest Using High and Very High-Resolution Satellite Images" Fire 4, no. 4: 89. https://doi.org/10.3390/fire4040089