Evaluating the Drought Code Using In Situ Drying Timelags of Feathermoss Duff in Interior Alaska


1
Bureau of Land Management, Alaska Fire Service, Fort Wainwright, AK 99703, USA
2
United States Forest Service, Northern Rockies Regional Office, Missoula, MT 59803, USA
*
Author to whom correspondence should be addressed.
†
1541 Gaffney Road, Fort Wainwright, AK 99703, USA.
‡
Retired.
Fire 2020, 3(2), 25; https://doi.org/10.3390/fire3020025
Submission received: 30 May 2020
/
Revised: 19 June 2020
/
Accepted: 23 June 2020
/
Published: 25 June 2020
(This article belongs to the Special Issue Boreal Fire-Fuels Interactions)
Abstract
:The Drought Code (DC) is a moisture code of the Canadian Forest Fire Weather Index System underlain by a hydrological water balance model in which drying occurs in a negative exponential pattern with a relatively long timelag. The model derives from measurements from an evaporimeter and no soil parameters are specified, leaving its physical nature uncertain. One way to approximate the attributes of a “DC equivalent soil” is to compare its drying timelag with measurements of known soils. In situ measurements of timelag were made over the course of a fire season in a black spruce-feathermoss forest floor underlain by permafrost in Interior Alaska, USA. On a seasonally averaged basis, timelag was 28 d. The corresponding timelag of the DC water balance model was 60 d. Water storage capacity in a whole duff column 200 mm deep was 31 mm. Using these figures and a relationship between timelag, water storage capacity, and the potential evaporation rate, a “DC equivalent soil” was determined to be capable of storing 66 mm of water. This amount of water would require a soil 366 mm deep, suggesting a revision of the way fire managers in Alaska regard the correspondence between soil and the moisture codes of the FWI. Nearly half of the soil depth would be mineral rather than organic. Much of the soil water necessary to maintain a 60 d timelag characteristic of a “DC equivalent soil” is frozen until after the solstice. Unavailability of frozen water, coupled with a June peak in the potential evaporation rate, appears to shorten in situ timelags early in the season.
1. Introduction
Wildland fuels dry in a negative exponential manner as internal bulk diffusion experiences increasing resistance with moisture loss [1]. Negative exponential drying results in a timelag that is useful in comparing fuels on the basis of drying speed or in tracking moisture movement through a fuel complex whose components vary widely in size, weight, and composition [2]. In fire danger rating moisture codes and indices, timelag is most often presented in terms of the logarithmic drying rate equation [3,4]. In this context, it is the time it takes for a fuel to lose or % of its free moisture. Free moisture is the water content in a soil or fuel above equilibrium that is available for drying. Timelag in a negative exponential system can also be expressed as the time it would take to empty the full capacity of stored water at the potential evaporation rate or the time to empty current water storage, , at the actual evaporation rate [5]:
where is timelag, is water storage capacity, is current water storage, and are potential and actual evaporative losses, and t is elapsed time.
Fine dead fuels, e.g., standing dead grass and ground lichens, may have a near-zero or hourly timelag [6,7] while heavy fuels, e.g., large-diameter logs and deep soil, may feature timelags of many days or weeks [4]. In the Canadian Forest Fire Weather Index System (FWI) that is used in boreal and hemiboreal forests of North America three moisture codes feature drying timelags that increase with soil depth from a matter of hours to weeks. These are the Fine Fuel Moisture Code (FFMC), Duff Moisture Code (DMC), and the Drought Code (DC) whose attributes are shown in Table 1 [4,8]. Each moisture code comprises a semi-physical moisture exchange model whose output is converted to an abstraction of fire danger that increases as moisture is depleted. To differentiate the two parts in the DC they are called here the water balance model and the abstraction equation.
The FWI moisture codes were intended to represent various depths of duff under a conifer forest generally regarded as North American lodgepole (Pinus contorta) or jack pine (P. banksiana) [4]. The soil attributes of the FFMC and DMC are fairly clear since these models were dervied from the drying behavior of measured fuels. The DC, however, is different. Its drying model was empirically developed based on evaporimeter measurements in British Columbia, Canada rather than any specific fuel or soil [9,10]. The underlying moisture exchange model is not the commonly used logarithmic drying rate equation [3] but rather a simple water balance equation in which depth of storage, (mm), is directly increased by daily precipitation, P (mm), and decreased by actual evaporation (mm) [4,9,10,11,12]:
It achieves negative exponential drying and a characteristic timelag due to the scaling of actual evaporation from potential evaporation proportional to the “fullness” of its soil water reservoir.
where mm. Under constant conditions, each day of drying makes less and less moisture available for evaporation.
The DC is also different in that the water balance model operates in units of water storage depth that are largely unfamiliar to fire managers who are used to expression of moisture content gravimetrically, i.e., the mass ratio of water to fuel, . is difficult to work with in tracking the movement of moisture through a hydrological system because it is expressed relative to the soil or fuel medium. It is easier to track moisture movement when it is expressed as volumetric moisture content, , or the volume of water relative to the volume of soil (mm3 mm−3). may be equivalently expressed as the depth of water per depth of soil (mm mm−1). Water storage, S, is the depth of water held by soil and is the product of (mm mm−1) and the depth of the soil, (mm). Advantages of water storage are that it is easily cumulated across soil horizons, and precipitation and evaporation may be directly added and subtracted from S (as they are in the DC). Water storage is converted from gravimetric or volumetric moisture content by:
where is soil bulk density (mg mm−3), is soil depth (mm), and is the density of water (1 mg mm−3). Millimeters are used here because they are the native units of precipitation and evaporation. Milligrams intuitively follow in using Equation (4). Conversions to kilograms and meters more typical of fire management applications are given in the Abbreviations section.
The lack of soil parameters in the water balance equations of the DC (Equations (2) and (3)) is significant. Although various physical properties such as soil depth, bulk density, and fuel weight have been published over the nearly 50 years that the DC has been in use, Miller [12] argues that the only known properties of the DC water balance model are hydrological: its water storage capacity and its drying timelag. The basis of this argument, in brief, is that the DC is based on a water balance equation referenced to an open evaporimeter of free water. The evaporation of this free water, however, is paradoxically limited by implied diffusion through the bulk of a soil whose attributes are not defined. Consequently, the physical nature of the “DC equivalent soil” is not apparent but could be inferred by empirically comparing it to known soils.
Some efforts to this end have been attempted in Alaska. The correspondence between water storage in the DC water balance model and black spruce-feathermoss duff has been investigated in several studies and unpublished reports over the years, for the most part taking the approach of correlating measurements of moisture content of various duff horizons with those of the FWI moisture codes [13,14,15,16]. This approach presumes that the strength of correlation is proportional to the similarity of their timelags. Data from a study by Wilmore [17] show a strong correlation (r = 0.71, p < 0.001, ) between water storage in the DC water balance model and moisure content in the the Upper Duff soil horizon (defined below) at three plots near Fairbanks, Alaska over one intensively sampled season. Coordinated fuel moisture monitoring by several fire management agencies from eighteen locations in Interior and South-Central Alaska 2012–2014 indicate a weaker, but significant, correlation (r = 0.32, p < 0.002; [15,16,18]). While these correlations are significant Figure 1 shows considerable bias and departure from theory. By Equation (4) water storage of the DC should be linear with moisture content with an intercept of zero. Some of this bias is thought to be attributable to seasonal patterns of permafrost thaw but its effects have not been directly studied. Shallowly frozen soils were not considered in the development of the DC or the FWI which focused on forests in Canada south of the limits of permafrost (Figure 2).
Interpretation of these efforts is also hampered by differences in the definition of duff itself. In Alaska, timelag has been associated with individual duff horizons, no doubt because of the way moisture content is sampled in the field. Typically, a whole duff “plug” is extracted from the forest floor and sectioned into Live Moss, Dead Moss, Upper Duff, and sometimes Lower Duff horizons for drying and analysis. A cross-walk between soil horizons and the moisture codes of the FWI currently used in Alaska is shown in Table 2 [14]. The Live Moss horizon is so-called because it is primarily composed of feathermosses. It is an oddity that it is considered both a soil horizon and a dead fuel. In reality it is poikilohydric, i.e., a carpet of living “soil” that responds to atmospheric moisture like a dead fuel when dry. The Dead Moss horizon is similarly fibric in its physical properties but is typically brown or yellow. The Upper Duff and Lower Duff are distinctive humic or sapric horizons that increase in bulk density and degree of decomposition. In Canada it is more typical to section the duff into absolute depths rather than by horizon. On the basis of Wilmore’s findings at the time and descriptions of the DC as representing a “deep layer of compact organic matter” in FWI guides (e.g., [4]), fire managers in Alaska have considered the DC to represent the Upper Duff horizon (Table 2).
Thinking of the duff in terms of stacked horizons is not consistent with the way moisture is actually lost from the forest floor, however. In this “stacked” scheme only the uppermost Live Moss horizon loses moisture by evaporation. Moisture loss in lower soil horizons can only occur by drainage, diffusion, or capillarity. Nor is the “stacked” perspective consistent with the moisture models underlying the FFMC, DMC, and DC. These models were empirically developed from measurements of fuels, columns of soil, or evaporimeters fully exposed to the air. Moisture content in the FFMC and DMC approaches the equilibrium moisture content of the air by diffusion in accordance with the logarithmic drying rate equation [4,22] and moisture loss in the DC occurs by direct evaporation to the air. In order for evaporation to occur the duff must extend from the surface to some depth, here called a “profile” rather than a “horizon”.
An alternative and largely untried approach to determine the nature of the “DC equivalent soil” is to empirically equate measurements of timelags in known soils to that of the DC water balance model. This approach requires frequently repeated in situ measurements of, ideally, volumetric moisture content in duff at a single location over the course of a fire season. Although not the original purpose of Wilmore’s study, her measurements comprise just such a dataset for Interior Alaska which may be exploited to gain insight into drying timelag. Once the timelag of the forest floor is measured it becomes possible to determine the soil attributes of the “DC equivalent soil” by translating parameters between three water balances: the in situ forest floor (subscript ), the DC water balance model (subscript ), and a “DC equivalent soil”, (subscript ) using Equation (1). Soil attributes are assigned using Equation (4).
2. Objectives
- 1
- Determine the depth, bulk density, weight, and water storage capacity of black spruce-feathermoss duff from Wilmore’s measurements.
- 2
- Determine the properties of the soil represented by the water balance model of the DC by using measurements of water storage capacity, in situ drying timelag of the duff profile, and known soil attributes. Sequentially, this process is:
- 2.1
- Determine the drying timelag of a black spruce-feathermoss forest floor using a time series of in situ measurements of water storage and the relationships in Equation (1). Similarly calculate timelags of the DC over the same drying periods.
- 2.2
- Determine the potential evaporation rate at the surface of the forest floor from measurements of the water storage capacity (Obj. 1) and in situ drying timelag (Obj. 2.1) using Equation (1).
- 2.3
- Use the potential evaporation rate at the forest floor from Obj. 2.2 to determine the water storage capacity of the “DC equivalent soil” by setting the timelag in Equation (1) equal to the corresponding timelag of the DC.
- 2.4
- Determine the depth of the “DC equivalent soil” using its water storage capacity (Obj. 2.3) and measurements of component horizon bulk density, thickness, and maximum gravimetric moisture content from Obj. 1 using Equation (4).
3. Methods
3.1. Study Site
Wilmore [17] measured duff moisture content at Fort Wainwright, Alaska, USA (64.838, × −147.716°) in the summer of 1999. The study site was selected to match the C-2 Boreal Spruce fuel type [23]. The site was flat, on permafrost, and characterized by feathermosses (Hylocomium splendens and Pleurozium schreberi). The overstory was mostly black spruce (Picea mariana) and white spruce (P. glauca). Shrubs include Ledum groenlandicum and Vaccinium vitis-idaea. Mean annual temperature is about −3 °C and precipitation is 275 mm. Snow melts at Fort Wainwright about 24 April. A high mean daily temperature of 23 °C occurs in July. Precipitation also peaks in July at 55 mm. Summer (Jun–Aug) precipitation is 137 mm and potential evaporation averages 3.4 mm d−1 [24].
3.2. Soil Attributes (Obj. 1)
Wilmore [17] sampled duff plugs at three systematic locations along a randomly laid 15 m transect every d. She sectioned duff into 50 mm vertical increments to 250 mm. Measurements at 250 mm depth were few, due to frozen soils, and were not used in this analysis. Duff was sampled volumetrically so that , , and S, are known. Samples were dried to a stable weight in a convectional drying oven at 100 °C and weighed on a scale. Soil attributes and water storage were aggregated across the sampled soil horizons to yield bulk density, (mg mm−3), soil weight (mg mm−2), and for a 200 mm forest floor profile which is considered to approximate the entire duff column. This depth is not appreciably different from the true mean depth which was 210 mm and does not influence estimation of the attributes of the “DC equivalent soil”. assumes a field capacity of 400% for organic soil and 15% for mineral soil [25].
3.3. Determination of Timelags (Obj. 2.1)
To be eligible for the equation, a pair of storage measurements (, ) had to be declining (i.e., drying) within a period of dry weather. A period of dry weather was defined here as the absence of rainfall >2.8 mm as in the DC algorithm. Eligible periods are depicted in Figure 3. In situ timelag was calculated by the right-hand side of Equation (1):
in which free water storage in the duff takes the place of in the numerator and loss of free storage takes the place of in the denominator. t is elapsed time in days. Equilibrium water storage, , for each duff profile was calculated by Equation (4) using mg mm−3 and mm from Table 4 and a fixed equilibrium moisture content of % following Van Wagner [4,22]. He found that moisture content rarely fell below 20% in duff in Eastern Canada.
Corresponding timelags of the DC for the same drying periods were similarly calculated:
Equilibrium storage was set to 0 mm since the water balance model of the DC (i.e., an evaporimeter) is allowed to completely dry. Moisture code values came directly from the archived data stream for the FRBA2 Remote Automated Weather Station at Fort Wainwright for the 1999 season. was overwintered at 110 mm (DC = 245) rather than defaulted to 197.5 mm (DC = 15). Water storage in the DC, (mm), is:
where D is the DC [4,12].
3.4. Estimation of the Attributes of the “DC equivalent soil” (Obj. 2.2–2.4)
Once drying timelags and the water storage capacity of the duff profile have been measured they can be used to estimate the depth of soil necessary to achieve the timelag of the DC water balance model, using Equation (1). Potential evaporation at the forest floor, , is calculated from the in situ duff water storage capacity and geometric mean timelag :
Although not strictly needed, seasonally averaged actual evaporation at the forest floor can be similarly estimated from and mean water storage, :
is then used to fix the water storage capacity of the “DC equivalent soil”, using the mean timelag of the DC, .
Last, Equation (4) is supplied with Wilmore’s measured soil attributes to determine the depth of the soil required to hold , assuming maximum moisture contents of 400% for organic soil and 15% for mineral soil.
3.5. Evaporimeter and Thaw Depth Measurements
The influence of seasonal patterns of potential evaporation and permafrost on timelag will be discussed later. Measurements of potential evaporation are available from the College Station evaporimeter in West Fairbanks. Open pan evaporation is assumed to be the same as potential evaporation [26]. The pan is a standard U.S. National Weather Service Class-A evaporation pan, 1.22 m in diameter and 254 mm deep and is measured daily through the frost-free season.
Active layer thaw depths were represented by a combined dataset from two sites several kilometers northwest of Fairbanks in an upland mixed white and black spruce-feathermoss forest (Ester Dome Site, n = 77 measurements between 2014–2019), and a lowland black spruce-feathermoss forest (Ballaine Site, n = 75 between 2013–2018). Periodically through the fire season a thaw probe was inserted through the duff to the frozen soil one or more times and measured against a tape measure.
4. Results
4.1. Soil Attributes (Obj. 1)
The bulk density of feathermoss duff is relatively light and increases from 0.017 mg mm−3 in the Live Moss horizon to 0.07 mg mm−3 just above the mineral soil (Table 3). Duff weight and water storage capacity similarly increase. Almost half the water storage capacity of the duff is held in the bottom 50 mm. Each 50 mm of mineral soil has a water storage capacity of 10.5 mm.
Aggregated over all the horizons, bulk density of the entire duff profile is mg mm−3 (Table 4). Total duff weight averaged mg mm−2. Although relatively deep, feathermoss duff is comparatively light, capable of holding about mm of water. Bulk density, fuel weight, and water storage capacity increase nonlinearly with depth. Soil weight and bulk density dramatically increase at the transition from organic to mineral soil.
4.2. Duff Timelag (Obj. 2.1)
Fourteen timelags were measured, ranging from 8.6 to 198 d (Figure 4). Since they ranged over several orders of magnitude, the geometric mean timelag is used: d. The corresponding timelag of the DC over the same drying periods was much longer, d.
4.3. Attributes of the “DC Equivalent Soil” (Obj. 2.2–2.4)
Given d, geometric mean mm, and mm, and must be 1.1 mm and 0.60 mm, respectively, by Equation (1). This actual evaporation rate is within the range of 0.3 and 0.9 mm d−1 measured at the moss surface by Heijmans et al. [27] in closed and open black spruce-feathermoss stands in Interior Alaska. The average timelag of the DC water balance model over the drying periods was d. This value is roughly confirmed by Equation (1) in which the ratio of mm to the June–August 1999 geometric mean potential evaporation rate mm d−1 measured at the College Station evaporimeter in West Fairbanks, yields d. To achieve an equivalent timelag in a sheltered forest where the potential evaporation rate is mm d−1, the water storage capacity would need to be mm. Storage of this amount of water would require a soil profile depth of mm. Associated soil attributes are listed in Table 4.
5. Discussion
The lack of any physical soil attributes in the water balance model of the DC (Equations (2) and (3)) affirms that it is purely hydrological [12]. In order to say anything about the physical nature of the “DC equivalent soil”, Equation (4) must be used and its several parameters (maximum moisture content, bulk density, and depth) empirically supplied. Since these parameters are free to vary in fixing , there is an infinite combination of soil attributes that could yield a timelag equivalent to the DC water balance model. Several soils in Pacific Northwestern and Eastern Canada have been proposed in Van Wagner [4] but an empirical analysis for boreal forest soils on permafrost is lacking (Figure 2).
The estimates of soil parameters for a black spruce-feathermoss forest floor presented here are admittedly coarse and likely vary from forest to forest, but instances of the necessary measurements are otherwise lacking. Even at a coarse scale, the estimates do allow a comparison to the published values in Table 1. Water storage capacity is much lower ( vs. 100 mm) and profile depth ( vs. 180 mm) and weight ( vs. 25 mg mm−2) are much greater. Marked differences in depth and weight are largely due to soil bulk density. The bulk density of feathermoss duff in Alaska is notoriously light, mg mm−3 and much lower than mg mm−3 resulting from the published values in Table 1. The bigger difference, however, is the necessity of including mineral soil which has a bulk density two orders of magnitude greater, mg mm−3. Although the DC is commonly described as representing deep, compact duff, the profile measured here is 45% mineral soil by depth and 97% by weight. While most fire danger moisture codes and indices represent a burnable component of the wildland fuel bed of one type or another, a significant proportion of the soil represented by the DC is not fuel. It seems appropriate to therefore consider the DC, not as representative of any particular component of a fuelbed, but solely as an index of drought in the context of fire danger rating.
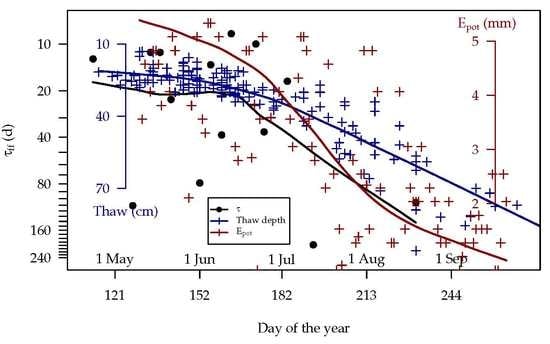
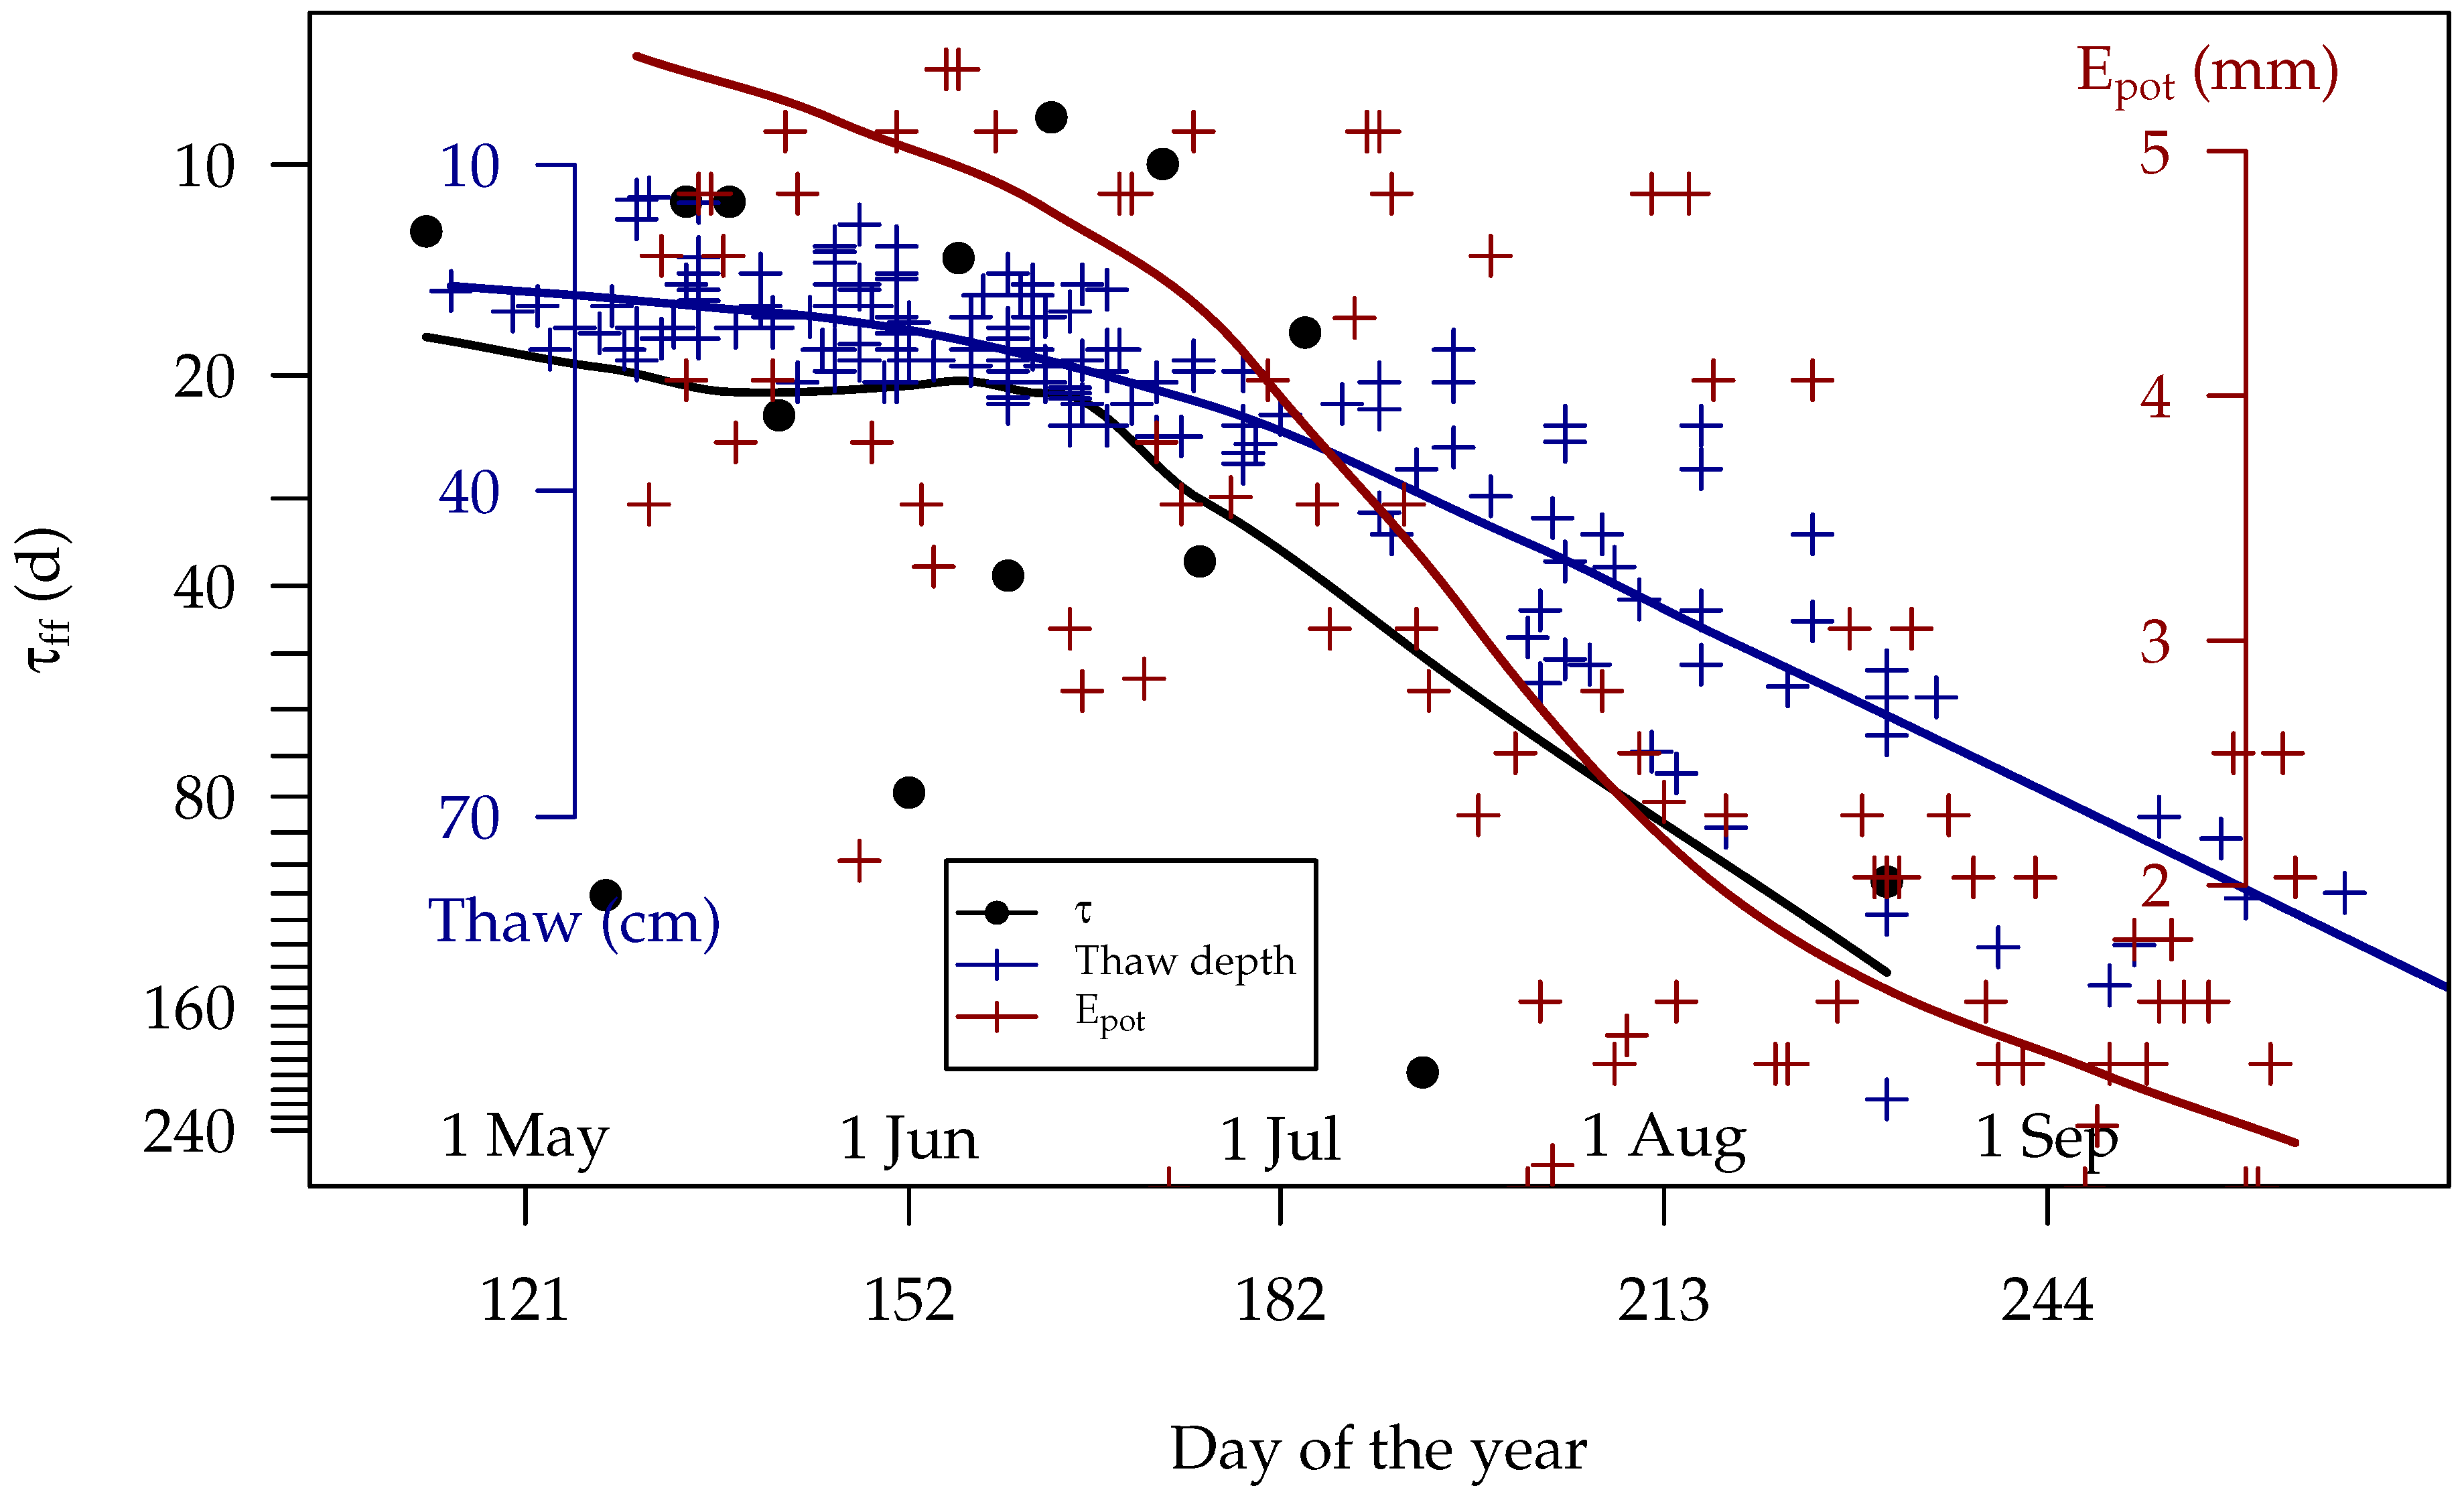
Although a depth of 366 mm has been estimated for the “DC equivalent soil”, it is difficult to interpret in Interior Alaska and other parts of the boreal biome characterized by a shallow permafrost table that liberates deeply stored water only late in the season (Figure 2). Nearby thaw depth measurements suggest that the full water storage capacity becomes available only after about 5 July. If cannot be deeper than the thaw depth (i.e., a frozen soil cannot release water), then the full water holding capacity of the “DC equivalent soil” may not be available until two weeks after the solstice. Coincident with the unavailability of the full water storage capacity is the peak in potential evaporation in June [24], the ratio of the two (Equation (1)) resulting in relatively short timelags early in the season. This pattern is directly seen in Figure 5 in which lengthening timelags are synchronous with declines in the depth of the active layer and in potential evaporation. It is also seen in the progressively steeper slopes of the eligible drying periods in Figure 3. The pattern may contribute to the relative earliness of the fire season in Alaska relative to western, temperate North America.
The depth of the “DC equivalent soil” also suggests a revision of the cross-walk between duff horizons and the FWI moisture codes in Table 2. The results from this study suggest that the DC represents a profile (rather than a horizon) that includes the entire column of duff plus another ≈170 mm of mineral soil.
Author Contributions
Field method design, data collection, and manuscript review, B.W. Conceptualization, data analysis, and manuscript preparation, E.A.M. All authors have read and agreed to the published version of the manuscript.
Funding
Wilmore’s original thesis project was funded by the U.S. Forest Service Pacific Northwest Research Station. Preparation of this paper was supported by the U.S. Bureau of Land Management, Alaska Fire Service.
Acknowledgments
We thank Jennifer Barnes, Chris Moore, Randi Jandt, Robert “Zeke” Ziel, and Heidi Strader for their interest, reviews, insight, and discussions. Marty Alexander suggested timelag as a basis for comparison of soil water storage with the moisture codes of the FWI. Fuel moisture data from Figure 1 resulted from an interagency field campaign 2012–2014 organized by the Alaska Wildland Fire Coordinating Group, Fire Research, Development, & Applications Committee and the Alaska Fire Science Consortium. The Department of Defense, U.S. Army Garrison Alaska, Fort Wainwright permitted sampling on installation property. Jennifer Hrobak and Jennifer Barnes (National Park Service) collected and provided thaw depth measurements from the Ballaine site. Alan Tonne of the University of Alaska Fairbanks, Agricultural and Forestry Experiment Station measured and provided the evaporimeter data for College Station. The Alaska Resources Library and Information Services was indispensable to the literature search.
Conflicts of Interest
The authors declare no conflict of interest.
Abbreviations
The following abbreviations are used in this manuscript:
| Abbreviation | Definition |
| Abbreviations | |
| DC | Drought Code |
| DMC | Duff Moisture Code |
| FFMC | Fine Fuel Moisture Code |
| FWI | Canadian Forest Fire Weather Index System |
| Variables | |
| D | Drought Code (Unitless) |
| Actual evaporation (mm) | |
| Potential evaporation (mm) | |
| Gravimetric moisture content (%) | |
| Volumetric moisture content (mm3 mm−3 or mm mm−1) | |
| S | Water storage depth (mm) |
| t | Elapsed time (d) |
| w | Soil weight (mg mm−2) |
| Depth or thickness (mm) | |
| Soil bulk density (mg mm−3) | |
| Density of water (mg mm−3) | |
| Timelag (d) | |
| Subscripts | |
| Initial or yesterday’s value | |
| Of the DC | |
| Of the “DC equivalent soil” | |
| Of the in situ forest floor soil | |
| Equilibrium | |
| Maximum | |
| Conversions | |
| w | 1 mg mm−2 = 1 kg m−2 |
| 1000 mm = 1 m | |
| 1 mg mm−3 = 1000 kg m−3 |
References
- Byram, G.M.; Nelson, R.M. An Analysis of the Drying Process in Forest Fuel Material; Technical Report; e-General Technical Report SRS-200; U.S. Forest Service, Southern Research Station: Asheville, NC, USA, 2015.
- Nelson, R.M. Some Factors Affecting the Moisture Timelags of Woody Materials; Technical Report; Research Paper SE-44; U.S. Forest Service, Southeastern Forest Experiment Station: Asheville, NC, USA, 1969.
- Van Wagner, C.E. A laboratory study of weather effects on the drying rate of jack pine litter. Can. J. For. Res. 1979, 9, 267–275. [Google Scholar] [CrossRef]
- Van Wagner, C.E. Development and Structure of the Canadian Forest Fire Weather Index System; Technical Report; Forestry Technical Report 35; Canadian Forestry Service: Ottawa, ON, Canada, 1987.
- Van Wagner, C.E. Drought, timelag, and fire danger rating. In Eighth Conference on Fire and Forest Meteorology; Society of American Foresters: Detroit, MI, USA, 1985; pp. 178–185. [Google Scholar]
- Miller, E.A. Moisture sorption models for fuel beds of standing dead grass in Alaska. Fire 2019, 2, 2. [Google Scholar] [CrossRef] [Green Version]
- Mutch, R.W.; Gastineau, O.W. Timelag and Equilibrium Moisture Content of Reindeer Lichen; Technical Report; Research Paper INT-76; U.S. Forest Service, Intermountain Forest and Range Experiment Station: Ogden, UT, USA, 1970.
- Stocks, B.J.; Lawson, B.D.; Alexander, M.E.; Van Wagner, C.E.; McAlpine, R.S.; Lynham, T.J.; Dube, D.E. The Canadian Forest Fire Danger Rating System: An overview. For. Chron. 1989, 65, 450–457. [Google Scholar] [CrossRef]
- Turner, J.A. The Stored Moisture Index: A Guide to Slash Burning; Technical Report; British Columbia Forest Service, Protection Division: Powell River, BC, Canada, 1966.
- Turner, J.A. The Drought Code Component of the Canadian Forest Fire Behavior System; Technical Report; Publication No. 1316; Environment Canada, Canadian Forestry Service, Headquarters: Ottawa, ON, Canada, 1972.
- Hanks, R.J.; Ashcroft, G.L. Applied Soil Physics: Soil Water and Temperature Applications; OCLC: 5029519; Springer: Berlin, Germany; New York, NY, USA, 1980. [Google Scholar]
- Miller, E.A. A Conceptual Interpretation of the Drought Code of the Canadian Forest Fire Weather Index System. Fire 2020, 3, 23. [Google Scholar] [CrossRef]
- Rorig, M.; Furguson, S.; Sandberg, D. Fire weather indexes and fuel condition in Alaska. In Proceedings of Fire Conference 2000: The First National Congress on Fire Ecology, Prevention, and Management; Galley, K., Klinger, R., Sugihara, N., Eds.; Tall Timbers Research Station: Tallahasee, FL, USA, 2003; pp. 202–210. [Google Scholar]
- Jandt, R.; Allen, J.; Horschel, E. Forest Floor Moisture Content and Fire Danger Indices in Alaska; Technical Report; Alaska Technical Report 54; U. S. Department of the Interior, Bureau of Land Management: Anchorage, AK, USA, 2005.
- Barnes, J.; Miller, E.; Saperstein, L. Duff Fuel Moisture and FWI Codes, 2012–2014; Summit on the Canadian Forest Fire Danger Rating System in Alaska: Fort Wainwright, AK, USA, 2014.
- Miller, E.; Barnes, J. Duff Moisture to Code Conversion Equations For Alaska; Summit on the Canadian Forest Fire Danger Rating System in Alaska: Fort Wainwright, AK, USA, 2014.
- Wilmore, B. Duff Moisture Dynamics in Black Spruce Feather Moss Stands and Their Relation to the Canadian Forest Fire Danger Rating System. Master’s Thesis, University of Alaska Fairbanks, Fairbanks, AK, USA, 2001. [Google Scholar]
- AWFCG. Alaska Interagency Records of Duff Moisture Content; Technical Report; Alaska Wildland Fire Coordinating Group, Bureau of Land Management, Alaska Fire Service: Fort Wainwright, AK, USA, 2019.
- Brandt, J.P. The extent of the North American boreal zone. Environ. Rev. 2009, 17, 101–161. [Google Scholar] [CrossRef]
- Brown, J.; Ferrians, O.; Heginbottom, J.A.; Melnikov, E. Circum-Arctic Map of Permafrost and Ground-Ice Conditions; Version 2; US Geological Survey Reston: Reston, VA, USA, 2002.
- Muraro, S.; Lawson, B. Prediction of Duff Moisture Distribution for Prescribed Burning; Technical Report; Information Report BC-X-046; Government of Canada, Department of Fisheries and Forestry, Forest Research Laboratory: Victoria, BC, Canada, 1970.
- Van Wagner, C.E. An Index to Estimate the Current Moisture Content of the Forest Floor; Technical Report; Publication No. 1288; Canadian Forest Service: Ottawa, ON, Canada, 1970.
- Taylor, S.W.; Alexander, M.E. Field guide to the Canadian Forest Fire Behavior Prediction (FBP) System, 3rd ed.; Special Report 11; Natural Resources Canada, Canadian Forest Service, Northern Forestry Centre: Edmonton, AB, Canada, 2018.
- Farnsworth, R.K.; Thompson, E.S. Mean Monthly, Seasonal, and Annual Pan Evaporation for the United States; Technical Report; NOAA Technical Report NWS 34; U.S. National Oceanic and Atmospheric Association, National Weather Service: Washington, DC, USA, 1982.
- White, J.D.; Koepke, B.E.; Swanson, D.K. Soil Survey of North Star Area, Alaska; Technical Report; U.S. Department of Agriculture, National Resources Conservation Service: Washington, DC, USA, 2000.
- McMahon, T.A.; Peel, M.C.; Lowe, L.; Srikanthan, R.; McVicar, T.R. Estimating actual, potential, reference crop and pan evaporation using standard meteorological data: A pragmatic synthesis. Hydrol. Earth Syst. Sci. 2013, 17, 1331–1363. [Google Scholar] [CrossRef] [Green Version]
- Heijmans, M.M.P.D.; Arp, W.J.; Chapin, F.S. Controls on moss evaporation in a boreal black spruce forest. Glob. Biogeochem. Cycles 2004, 18. [Google Scholar] [CrossRef]
Figure 1.
The relationship between water storage in the Drought Code (DC), , and gravimetric moisture content in the Upper Duff. Dashed lines are orthogonal regressions. Correlation coefficients (r) are shown in the plots. Data: Alaska Wildland Fire Coordinating Group [18] and Wilmore [17].

Figure 2.
Location of Fort Wainwright, Alaska, within the North American circumpolar boreal and hemiboreal zones of Brandt [19] (dark gray) where the Canadian Fire Weather Index System is primarily used. The white line is the approximate southern limit of permafrost [20]. The DC was empirically developed from forests on Vancouver Island, British Columbia, Canada [9,10,21] and evaluated there and in forests at Petawawa and Northern Quebec, Canada [4].
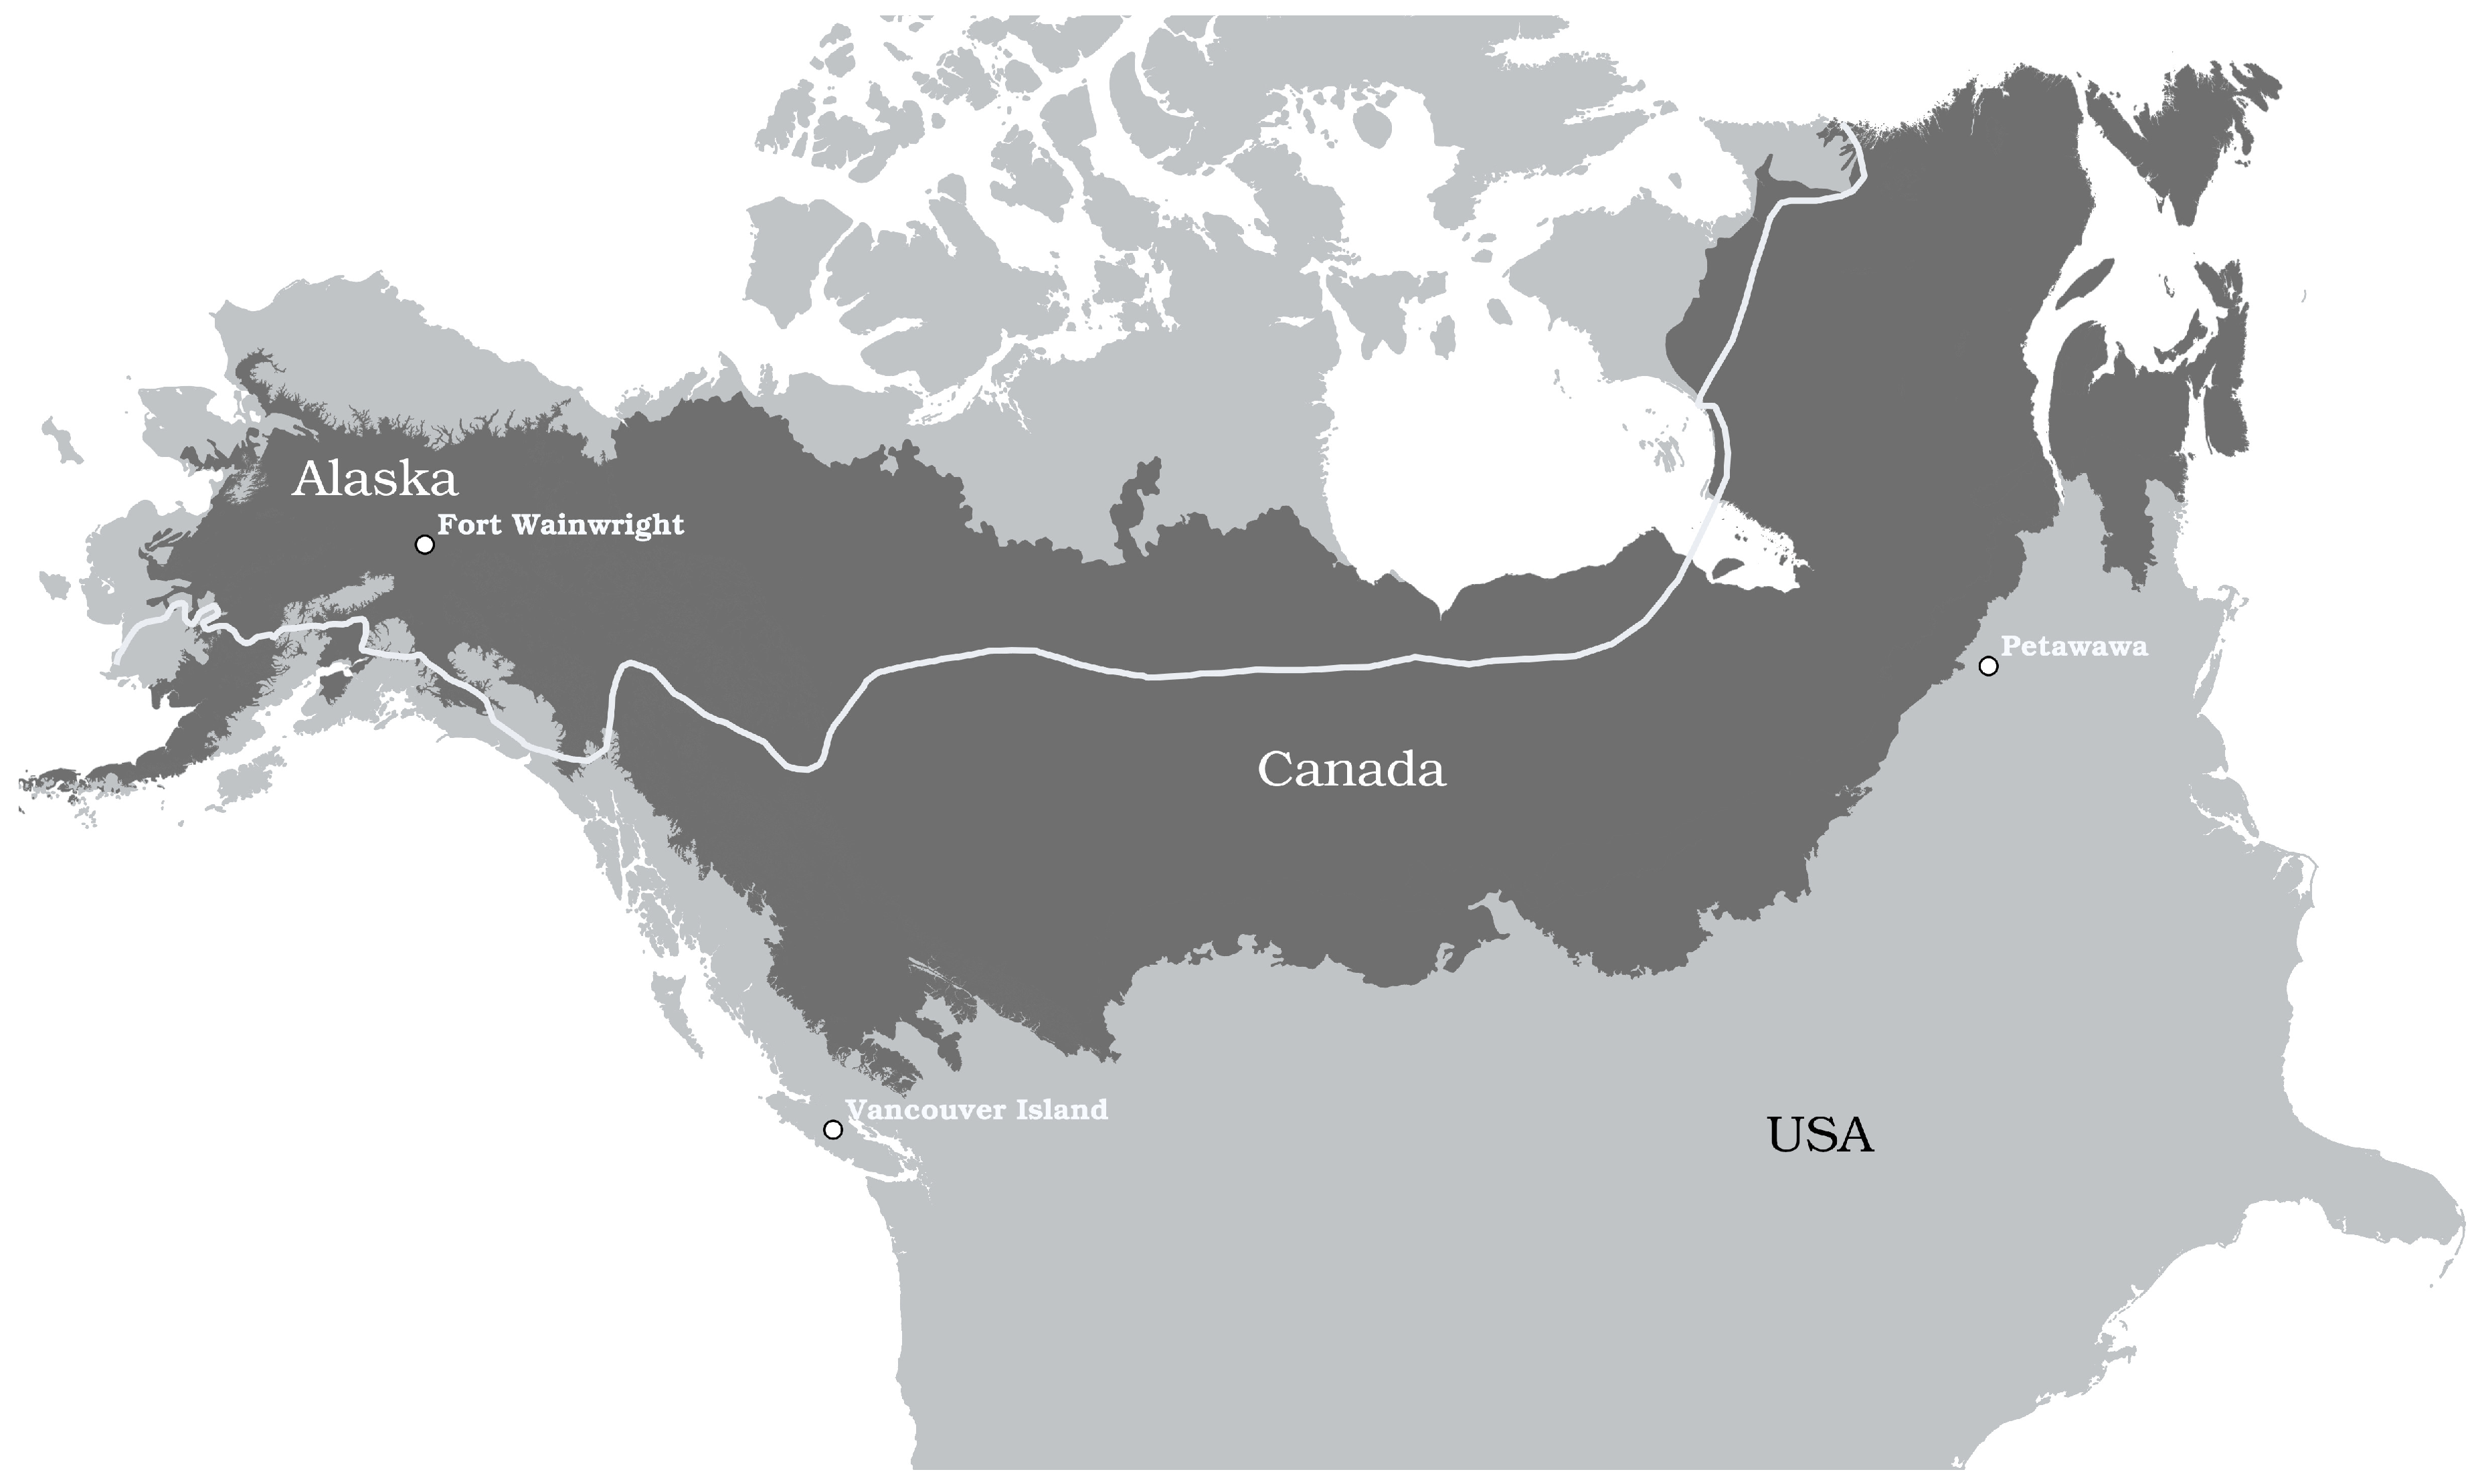
Figure 3.
Water storage in the duff, , and DC, . Eligible drying periods are denoted by the black filled circles and solid lines. is shown in dark red. Precipitation is shown in gray.
Figure 3.
Water storage in the duff, , and DC, . Eligible drying periods are denoted by the black filled circles and solid lines. is shown in dark red. Precipitation is shown in gray.
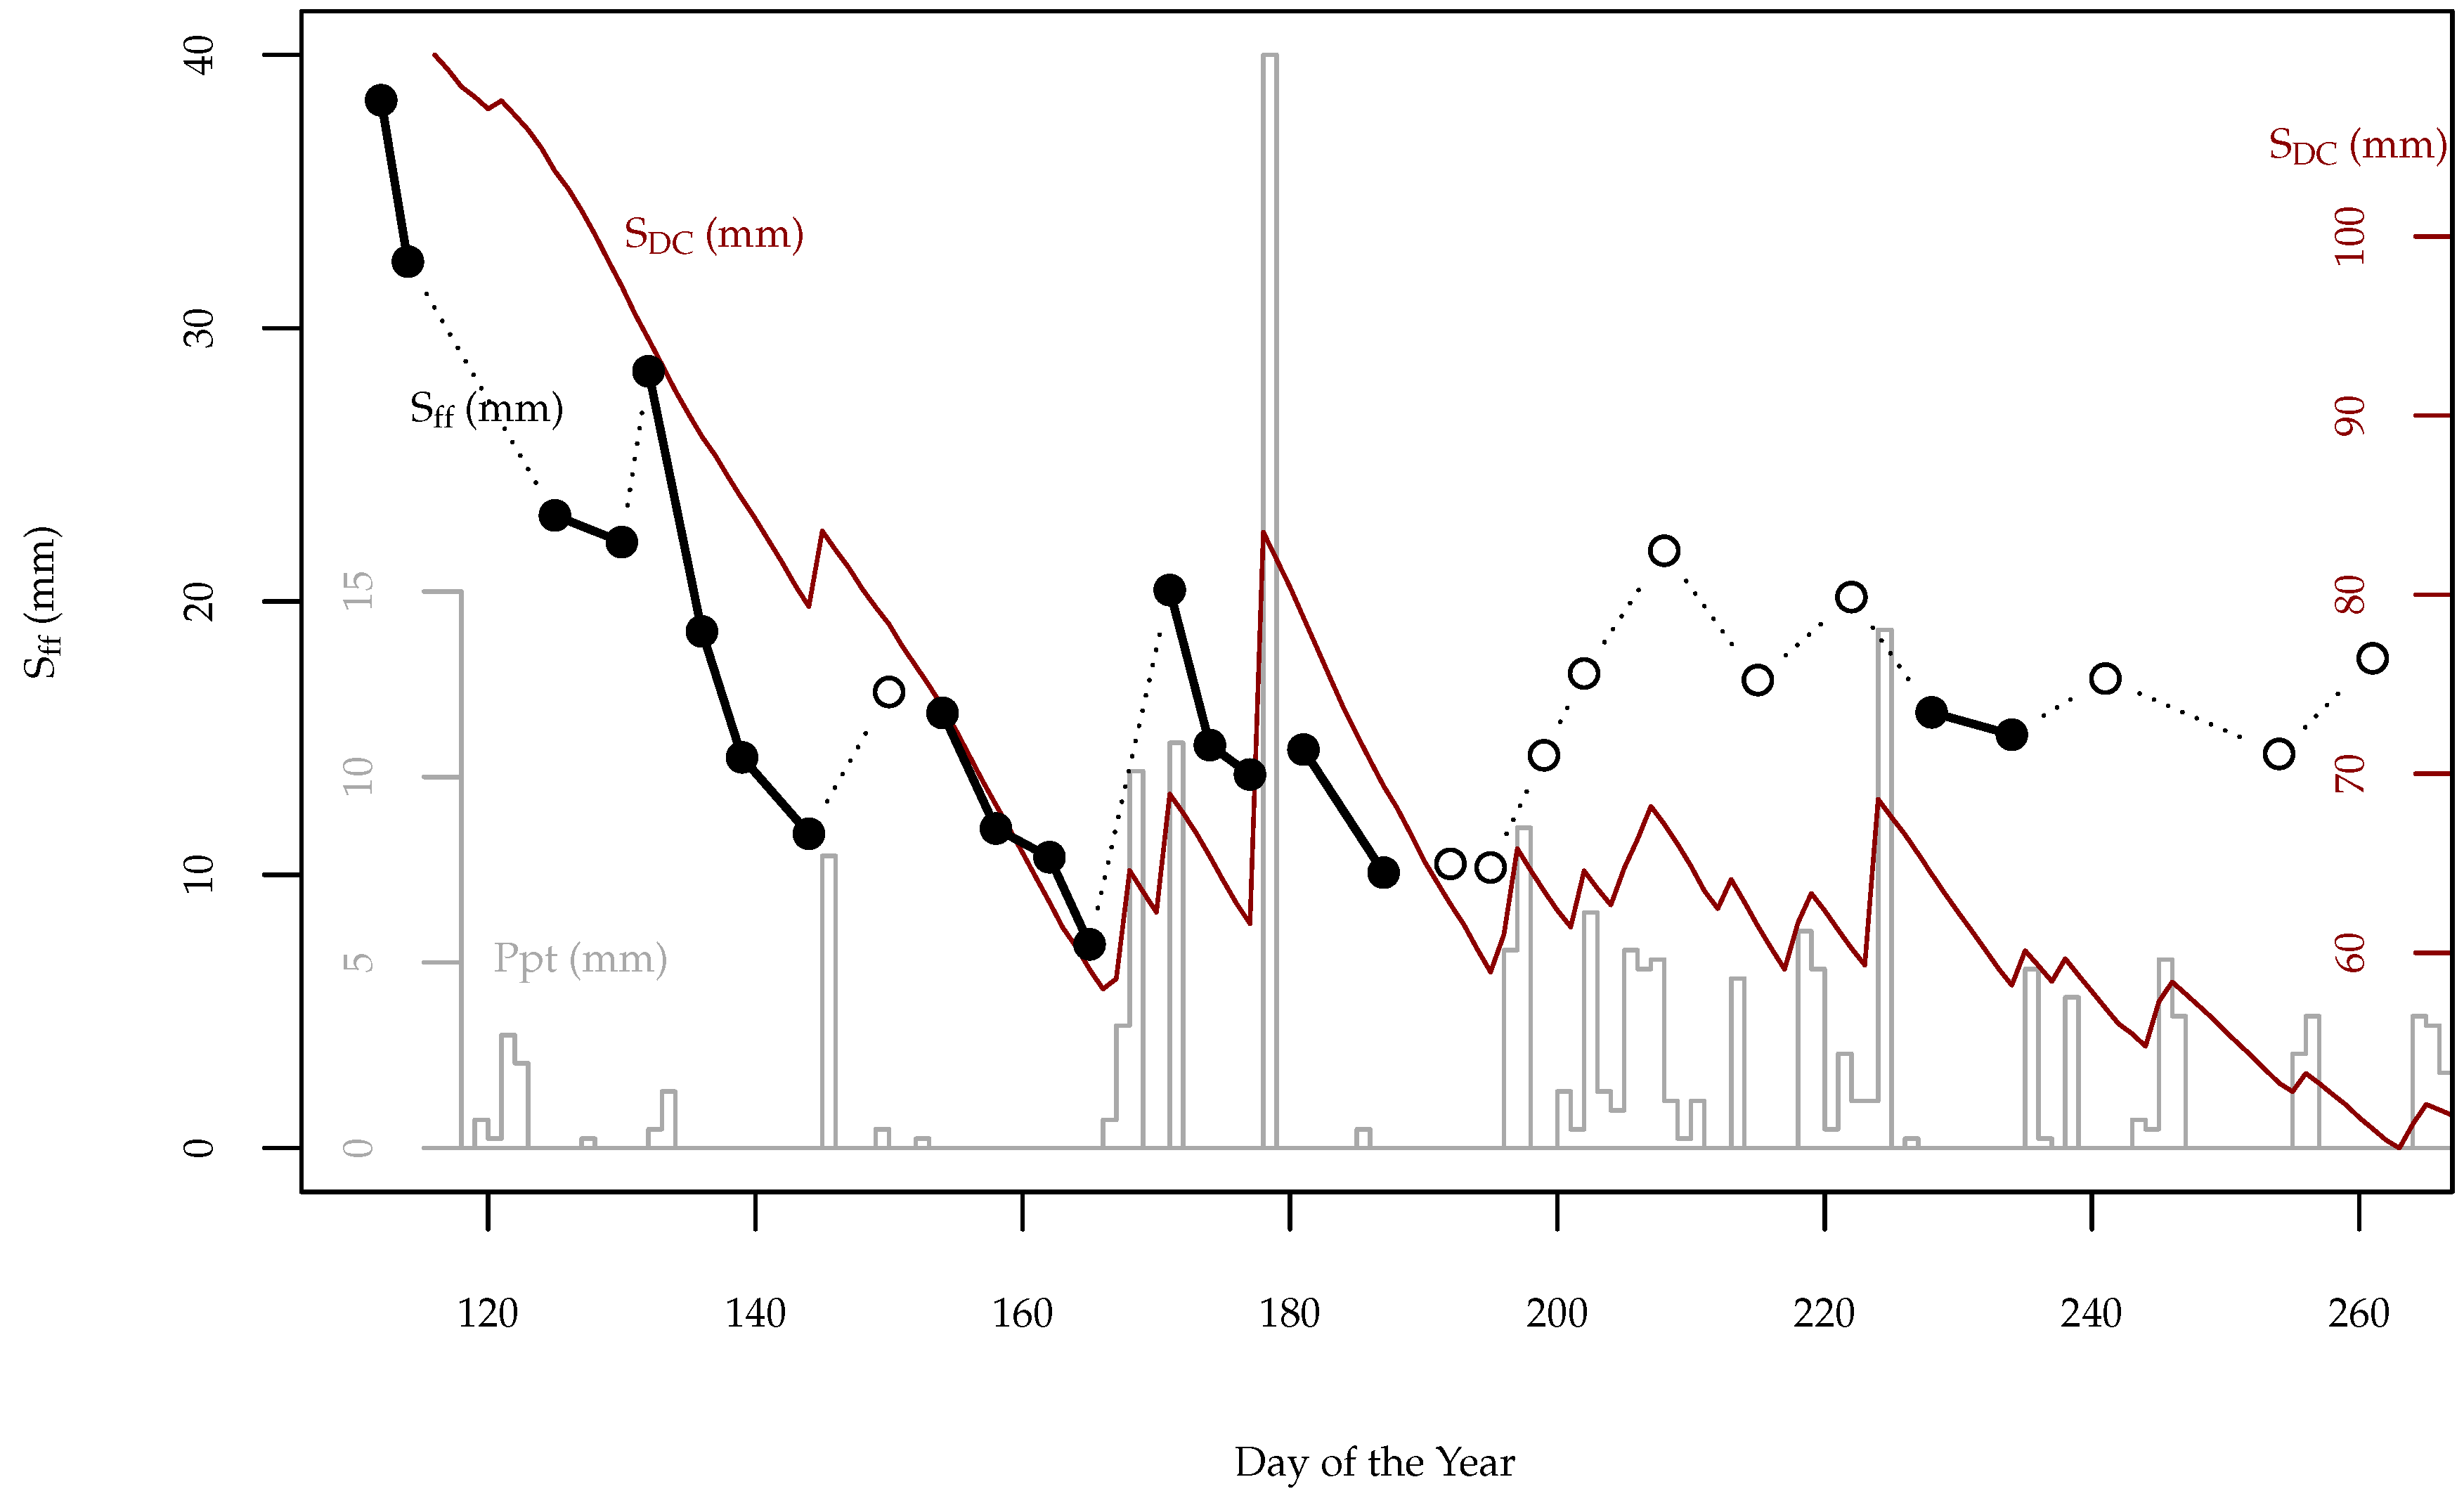
Figure 4.
Distribution of measured timelags.
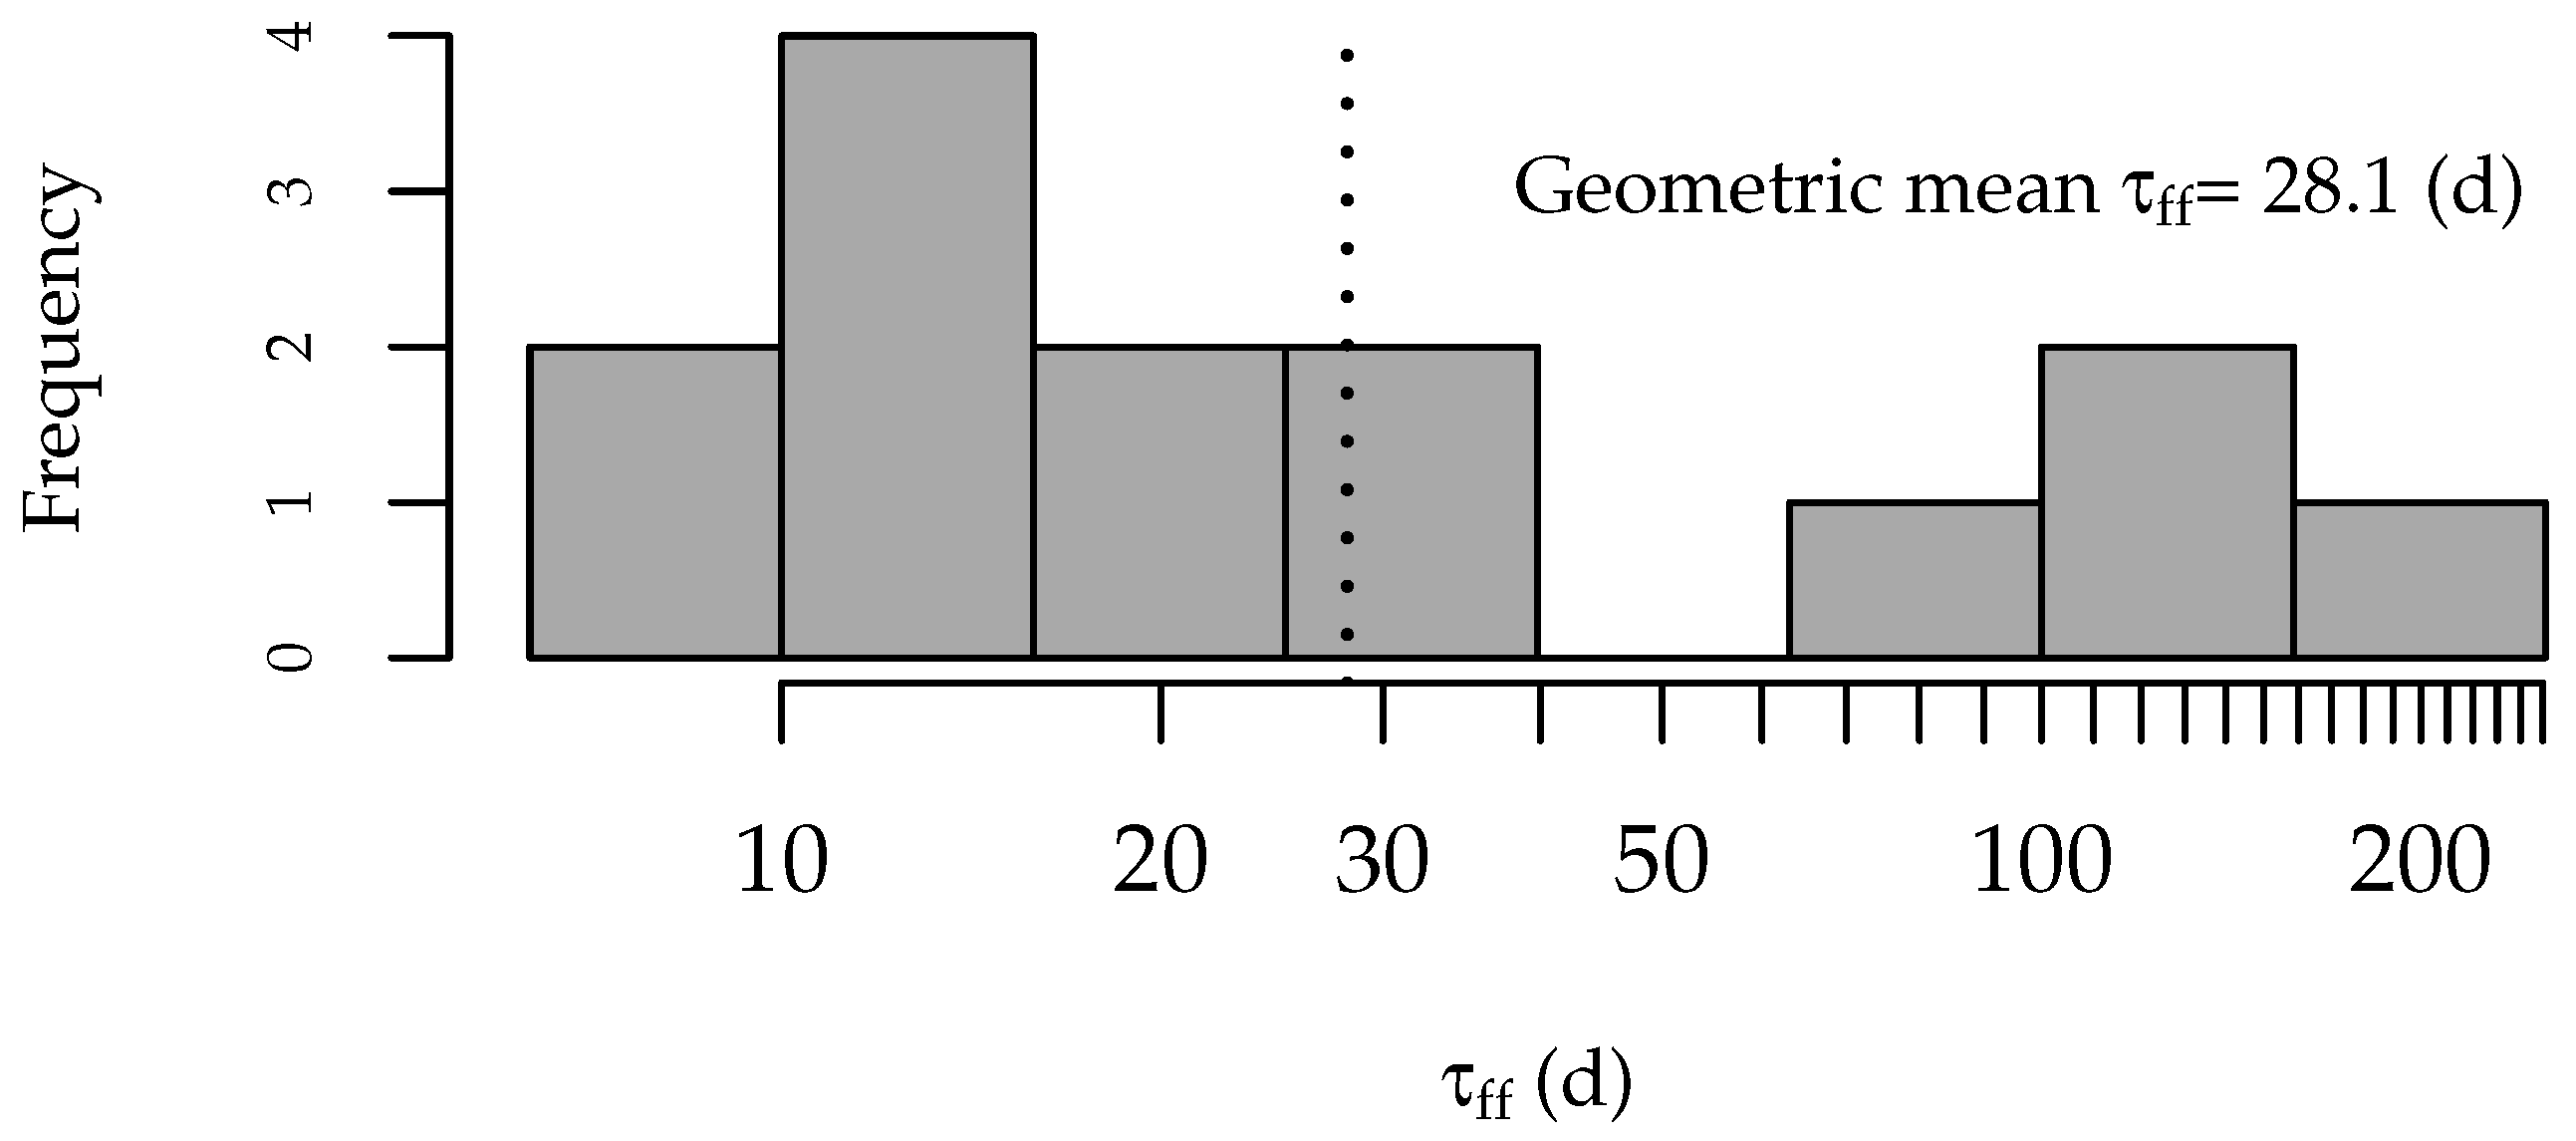
Figure 5.
Comparison of in situ duff drying timelag to active layer thaw depth (2013–2019) and potential evaporation (1999). Lines are locally estimated scatterplot smoothing (LOESS).
Figure 5.
Comparison of in situ duff drying timelag to active layer thaw depth (2013–2019) and potential evaporation (1999). Lines are locally estimated scatterplot smoothing (LOESS).

Table 1.
Properties of the Canadian Forest Fire Weather Index System (FWI) moisture codes from Van Wagner [4]. is maximum water storage. Timelag assumes it is July with an air temperature of 21 °C and a relative humidity of 45%.
Table 1.
Properties of the Canadian Forest Fire Weather Index System (FWI) moisture codes from Van Wagner [4]. is maximum water storage. Timelag assumes it is July with an air temperature of 21 °C and a relative humidity of 45%.
| Moisture Code | (mm) | Timelag (d) | Depth (mm) | Weight (mg mm−2) |
|---|---|---|---|---|
| FFMC | 0.6 | 0.67 | 12 | 0.25 |
| DMC | 15 | 12 | 70 | 5 |
| DC | 100 | 52 | 180 | 25 |
Table 2.
Currently accepted correspondence between soil horizons and the FWI moisture codes in Interior Alaska [14].
Table 2.
Currently accepted correspondence between soil horizons and the FWI moisture codes in Interior Alaska [14].
| Duff | Approximate | Corresponding |
|---|---|---|
| Horizon | Thickness (mm) [18] | Moisture Code |
| Live Moss | 0–30 | FFMC |
| Dead Moss | 30–80 | DMC |
| Upper Duff | 80–150 | DC |
| Lower Duff | 150–200 | – |
| Mineral soil | 200+ | – |
Table 3.
Hydrological properties of soil horizons. is water storage capacity.
| Soil Type | Horizon | Bulk Density | Thickness | Weight | |
|---|---|---|---|---|---|
| (mm) | (mg mm−3) | (mm) | (mg mm−2) | (mm) | |
| Organic | 0–50 | 0.017 | 50 | 0.85 | 3.4 |
| 50–100 | 0.025 | 50 | 1.25 | 5.0 | |
| 100–150 | 0.042 | 50 | 2.10 | 8.4 | |
| 150–200 | 0.070 | 50 | 3.50 | 14.0 | |
| Mineral | Each 50 mm | 1.40 | 50 | 70 | 10.5 |
Table 4.
Black spruce-feathermoss soil profile attributes. and are maximum gravimetric moisture content and water storage capacity, respectively. The profile 0-366 mm represents the “DC equivalent soil”.
Table 4.
Black spruce-feathermoss soil profile attributes. and are maximum gravimetric moisture content and water storage capacity, respectively. The profile 0-366 mm represents the “DC equivalent soil”.
| Soil Type | Profile | Bulk Density | Weight | ||
|---|---|---|---|---|---|
| (mm) | (mg mm−3) | (mg mm−2) | (%) | (mm) | |
| Organic | 0–50 | 0.017 | 0.85 | 400 | 3.4 |
| 0–100 | 0.021 | 2.1 | 400 | 8.4 | |
| 0–150 | 0.028 | 4.2 | 400 | 17 | |
| 0–200 | 0.039 | 7.7 | 400 | 31 | |
| Organic + Mineral | 0–366 | 0.62 | 227 | 29 | 66 |
© 2020 by the authors. Licensee MDPI, Basel, Switzerland. This article is an open access article distributed under the terms and conditions of the Creative Commons Attribution (CC BY) license (http://creativecommons.org/licenses/by/4.0/).
Share and Cite
MDPI and ACS Style
Miller, E.A.; Wilmore, B. Evaluating the Drought Code Using In Situ Drying Timelags of Feathermoss Duff in Interior Alaska. Fire 2020, 3, 25. https://doi.org/10.3390/fire3020025
AMA Style
Miller EA, Wilmore B. Evaluating the Drought Code Using In Situ Drying Timelags of Feathermoss Duff in Interior Alaska. Fire. 2020; 3(2):25. https://doi.org/10.3390/fire3020025
Chicago/Turabian StyleMiller, Eric A., and Brenda Wilmore. 2020. "Evaluating the Drought Code Using In Situ Drying Timelags of Feathermoss Duff in Interior Alaska" Fire 3, no. 2: 25. https://doi.org/10.3390/fire3020025