Endothelialization of Polyethylene Terephthalate Treated in SO2 Plasma Determined by the Degree of Material Cytotoxicity


Department of surface engineering and optoelectronics, Jozef Stefan Institute, Jamova cesta 39, 1000 Ljubljana, Slovenia
*
Author to whom correspondence should be addressed.
Plasma 2018, 1(1), 12-22; https://doi.org/10.3390/plasma1010002
Submission received: 18 October 2017
/
Revised: 4 December 2017
/
Accepted: 8 December 2017
/
Published: 9 December 2017
Abstract
:Improving the biocompatibility of polyethylene terephthalate (PET) vascular grafts is an important task for avoiding thrombus formation. Therefore, SO2 plasma at various treatment periods were used to modify PET surface properties by forming sulfate functional groups. These groups were shown to act antithrombogenically, ensuring good hemocompatibility of the materials, although the biocompatibility of such materials still remains a mystery. For this reason, the adhesion and viability of HUVEC cells on SO2 plasma-modified PET surfaces were studied, and the possible toxicity of the tested material was determined using two different assays, MTT (metabolic activity assay) and SRB (in-vitro toxicology assay). Changes in chemical composition, morphology and wettability were determined as well. Improved endothelialization was observed for all plasma-treated samples, with the most optimal being the sample treated for 80 s, which can be explained by it having the best combination of surface functionalization, roughness and morphology. Furthermore, toxicity was observed to some extent on the sample treated for 160 s, indicating the lowest cell density among the plasma-treated samples. X-ray photoelectron spectroscopy showed increased oxygen and sulfur content on the surface, which was independent on treatment time. Surface roughness of the plasma-treated samples increased, reaching its maximum after 80 s of treatment, and decreased thereafter.
1. Introduction
Application of polymer materials in the biomedical field is increasing enormously. They can be used in drug-delivery systems [1], for artificial body implants (vascular grafts, stents and heart valves), as scaffolds for ligament and tendon repair, for urinary and vascular catheters, dialysis membranes, orthopedic implants, etc. [2]. The major problem with polymers is their surface properties, which are often inadequate, and have to be modified prior to application. This is especially important in cases where polymers are implanted into the human body. In this case, their surface must be altered to improve their biocompatibility properties, meaning that they must cause an appropriate host response when in contact with bodily liquids and tissues.
One of the most frequently used polymers in medical applications is polyethylene terephthalate (PET). It is a particularly important material for vascular grafts. However, it has poor blood compatibility, and poor cell-adhesion properties. Therefore, formation of a blood clot often appears, leading to thrombosis, especially in cases where vascular grafts of a small diameter have been used. The antithrombogenic properties of PET vascular grafts can be improved by coating the inner surface of the vessels with antithrombogenic molecules [3], or by endothelialization of the inner surfaces of the vessels [4]. Various methods can be applied for surface modification of polymers, ranging from various chemical treatments to plasma treatments, either to improve the adhesion of antithrombogenic molecules or to improve endothelialization. The chemical methods that are currently applied use heparin as an anticoagulant [3]. Heparin needs to be covalently bonded to the surface using spacers or linkers. A review of various chemical methods for covalent attachment of heparin is provided in the paper by Murugesan et al. [5]. Another alternative for improving the hemocompatibility of polymers is to perform surface endothelialization. Endothelialization can be improved by chemical treatments, such as the grafting of hydrophilic polymers and the immobilization of bioactive molecules [6], or by wet chemical treatments that include surface aminolaysis or hydrolysis [7]. However, it has also been shown that endothelialization can be improved by plasma treatment, because it alters the surface wettability, morphology and surface chemistry. Each one of these parameters alone may have an impact on the improved endothelialization; however, they may also have a synergistic effect. They have an influence on the adhesion of water molecules and proteins from the cell medium and, therefore, they also have an influence on cell adhesion [8]. This was observed for plasmas created in various gases, such as O2, CO2, N2, NH3, Ar [9,10,11,12,13]. However, there is a lack of data for SO2 plasma. Gugala et al. found reduced adhesion of cells on the surface treated with SO2 plasma; however, they did not use pure SO2, but rather a mixture with hydrogen [14]. It has also been reported that SO2 plasma can mimic the antithrombogenic properties of sulfated polysaccharides, because sulfate groups play an important role in the coagulation process [15]. For example, it was found that sulfated chitosan and fucoidan have strong anti-coagulant properties, similar to heparin [16,17]. The reactive gaseous particles created in SO2 plasma may interact chemically with the surface carbon atoms, forming such sulphur-containing functional groups. However, as already mentioned, what the influence of SO2 plasma is on cell proliferation still remains unclear.
Plasma treatment has many advantages in comparison to other treatment methods. Plasma treatment provides an easy and fast way of forming various functional groups at the surface. It is ecologically suitable, because it is a solvent-free technique. The surface can be treated uniformly, regardless of the shape of the surface; and, with an appropriate selection of gas, it is possible to obtain favorite chemical groups without altering the mechanical properties of the polymer. Furthermore, as mentioned above, plasma treatment also modifies wettability and adhesion properties, roughness, and morphology. All of these properties may play an important role in the improved biocompatibility of the polymer surface, because they affect cell adhesion and proliferation. Therefore, plasma-treated surfaces may already have the desired surface properties for enhancing cell adhesion without the need for any additional chemical treatment.
In this paper, an investigation of the surface modification of the polymer PET treated in SO2 plasma is reported, and the influence of the plasma treatment on the adhesion and proliferation of endothelial cells is described.
2. Materials and Methods
2.1. Materials
Biaxially-oriented polyethylene terephthalate (PET) foils with a thickness of 0.25 mm from Goodfellow Ltd. (Huntingdon, UK) were used as a polymer substrate. SO2 gas was supplied by Messer (Ljubljana, Slovenia). Human umbilical vein endothelial cells (HUVEC) were purchased from ATCC (Manassas, VA, USA). Minimum essential medium (MEM), fetal bovine serum (FBS), Hanks’ balanced salt solution (HBSS), trichloroacetic acid (TCA), and sulforhodamine B assay solubilization solution (10 mM base solution) were purchased from Sigma-Aldrich (Taufkirchen, Germany). MTT assay (EZ4U) was supplied by Biomedica (Vienna, Austria).
2.2. Plasma Treatment
The PET samples were treated in a Pyrex discharge tube with a length of 80 cm and a diameter of 4 cm. The discharge tube was pumped with a rotary pump with a nominal pumping speed of 80 m3 h−1. SO2 gas with a purity of 99.98% was leaked to the discharge tube. The pressure of SO2 was set to 30 Pa. The base pressure in the vacuum system before introducing SO2 was 1 Pa. A coil of six turns was mounted in the center of the tube and coupled to a radio frequency (RF) generator via a matching network. Frequency of the RF generator was 13.56 MHz. The nominal power was fixed at 150 W. Plasma was thus run in the E-mode. An alternative would be H-mode, where the discharge is much more powerful [18], but such a mode would destroy the thin polymer films due to extensive exothermic reactions. Samples were treated in SO2 plasma for various treatment periods ranging from 10 to 160 s. After treatment, the samples were analyzed using atomic force microscopy (AFM), X-ray photoelectron spectroscopy (XPS), and water contact angle measurements (WCA).
2.3. Atomic Force Microscopy (AFM) Measurements
An AFM (Solver PRO, NT-MDT, Moscow, Russia) was used to characterize the topology of the plasma-treated PET samples. All measurements were performed in a tapping mode using ATEC-NC-20 tips (Nano and More GmbH, Limerick, Ireland) with a resonance frequency of 210–490 kHz and force constant of 12–110 Nm−1. The surface roughness was calculated from AFM images taken over an area of 5 × 5 µm2 using the program Spip 5.1.3 (Image Metrology A/S, Hørsholm, Denmark). Surface roughness was expressed in terms of average roughness (Ra) and root mean square roughness (RMS). An analogue filter was used to determine the numerical evaluation of the roughness by removal of waviness form the measured profile. To exclude waviness, the limiting wavelength (cutoff) was set to 8 nm. Uncertainty in surface roughness measurements was also determined. Uncertainties include nonuniformity of a sample, repeatability of measurements, nonlinearity and resolution of interferometer, Abbe error, compensation of an index of refraction in air, change of optical path difference in interferometer, and stability of laser frequency [19]. Additionally, the tip test also constitutes a major source of uncertainty in surface roughness measurements.
2.4. Characterization by X-ray Photoelectron Spectroscopy (XPS)
Chemical changes of the surface were determined by using an XPS (a model TFA XPS Physical Electronics, Chanhassen, MN, US). Monochromatic Al Kα1,2 radiation at 1486.6 eV was applied. The area analyzed was 400 µm2. Take-off angle was set at 45°. XPS survey-scan spectra were acquired at a pass-energy of 187 eV using an energy step of 0.4 eV. The high-resolution C1s spectra were acquired at a pass-energy of 23.5 eV using an energy step of 0.1 eV. The main C1s peak was shifted to a value of 284.8 eV for charge compensation. The XPS spectra were analyzed using MultiPak v8.1c software (Ulvac-Phi Inc., Kanagawa, Japan, 2006) from Physical Electronics.
2.5. Contact Angle Measurements
Water contact angle (WCA) was measured immediately after plasma treatment. Surface wettability was assessed by demineralized water droplet of 2 μL volume, using See System (Advex Instruments, Brno, Czech Republic). The data points and error bars represent the averages and standard deviations from five independent measurements.
2.6. Cell Adhesion and Morphology Studies
Human umbilical vein endothelial cells (HUVEC) were cultured in a minimum essential medium (MEM) supplemented with 10% fetal bovine serum (FBS), 100 U penicillin, 1000 U streptomycin, 2 mM l-glutamine, and plated at density of 3000 cells/cm2. 100 μL drop of medium with cells in concentration of 2.55 × 10⁴ cells/cm2 was added on the samples surface and incubated in 3, 5 and 24 h, at 37 °C in a humidified atmosphere of 5% CO2. Cell adhesion and morphology were studied. Experiments were performed in duplicate. Cell cultivation on plasma-treated samples was done no later than 1 h after the treatment.
2.6.1. MTT (3-(4,5-Dimethylthiazol-2-yl)-2,5-diphenyltetrazolium bromide) Assay
HUVEC cell viability was determined using MTT-related colorimetric assay (EZ4U), according to the manufacturer’s instructions. 10 μL of Hanks’ balanced salt solution (HBSS) mixed with the tetrazolium agent was added to 100 μL medium with cells, incubated on the polymer samples placed in a 24-well plate. Cells were then incubated on the different plasma-treated polymer surfaces, and cell viability was determined after 3, 5 and 24 h. After incubation, the plate was removed from the incubator and gently mixed by tipping the plate at all 4 sides, to avoid increased standard deviations. Supernatants were transferred into 96-well plates, and the absorbance was measured at OD 570/690 nm with SynergyTM HT Microplate Reader (Bio-TeK Instruments, Inc., Winooski, VT, USA).
2.6.2. SRB (Sulforhodamine B) Assay
The Sulforhodamine B Assay system is used to measure total biomass by staining cellular proteins with the Sulforhodamine B. The key component is the dye, Sulforhodamine B. HUVEC cells were cultured on the sample surfaces at density of 3000 cells/cm2. The cells were briefly washed, fixed, and stained with the dye. The incorporated dye was then liberated from the cells with a Tris base solution. Absorbance was measured spectrophotometrically at a wavelength of 565 nm. The background absorbance of the multiwell plates was measured at 690 nm and subtracted from the measurement at 565 nm. Changes in the absorbance values resulting from the different amounts of dye incorporated by the cells indicated the total biomass (number of cells) adhered on the sample surface, indirectly assuming the degree of cytotoxicity caused by the test material. Experiments were performed in duplicate, and each experiment included a blank (medium without cells).
2.6.3. Statistical Analysis
Experiments were performed in two biological and three technical replicates. The data points and error bars represent the averages and standard deviations from independent measurements. Significant differences between the samples were determined using the graphical representations, where ** is statistically significant at p < 0.01 and *** statistically significant at p < 0.001 compared between SO2 plasma treated samples and the control one.
3. Results and Discussion
The XPS surface compositions of the samples treated for various time periods are shown in Figure 1. In comparison to the untreated sample, we observed that, for plasma-treated samples, oxygen concentration increased from 24 at % to 33 at %, whereas carbon decreased from 76 at % to 65 at %. Additionally, small amounts of sulfur appeared on the plasma-treated surface as well (approximately 2 at %). Surface composition of the plasma-treated samples was constant and independent of treatment period.
Increased oxygen concentration was a consequence of formation of the oxidized sulfur groups as well as pure oxygen groups, which were formed because of the reaction of oxygen atoms originating from dissociated SO2 molecules with the polymer surface. This can be observed in Figure 2, where comparison of the high-resolution carbon and sulfur spectra for the samples treated for various periods is shown. In comparison to the untreated sample, the peaks corresponding to oxygen functionalities such as C–O and O=C–O groups increased after the treatment (Figure 2a), which is consistent with the increased oxygen concentration on the plasma-treated samples (Figure 1).
Detailed examination of the intensity of C–O and O=C–O peaks also leads to observation that the intensity of these two peaks slightly increased with the increase in treatment period up to 80 s; however, for the sample treated for the longest period (160 s), it decreased (detail in Figure 2a), which could be due to thermal effects and overtreatment. It is important to note, here, that these differences are minor, and they are within the margin of experimental error. The characterization was performed on different spots on each sample, and some variations were observed.
Figure 2b shows a comparison of the sulfur spectra. Two peaks can be observed. The main one corresponds to the oxidized sulfur functional groups C–SOx on the polymer surface, whereas the second one, which appeared only in marginal concentrations, corresponds to the nonoxidized sulfur species C–S(H). Furthermore, the intensity of this peak decreased with the increase in treatment period, and diminished at the longest treatment periods.
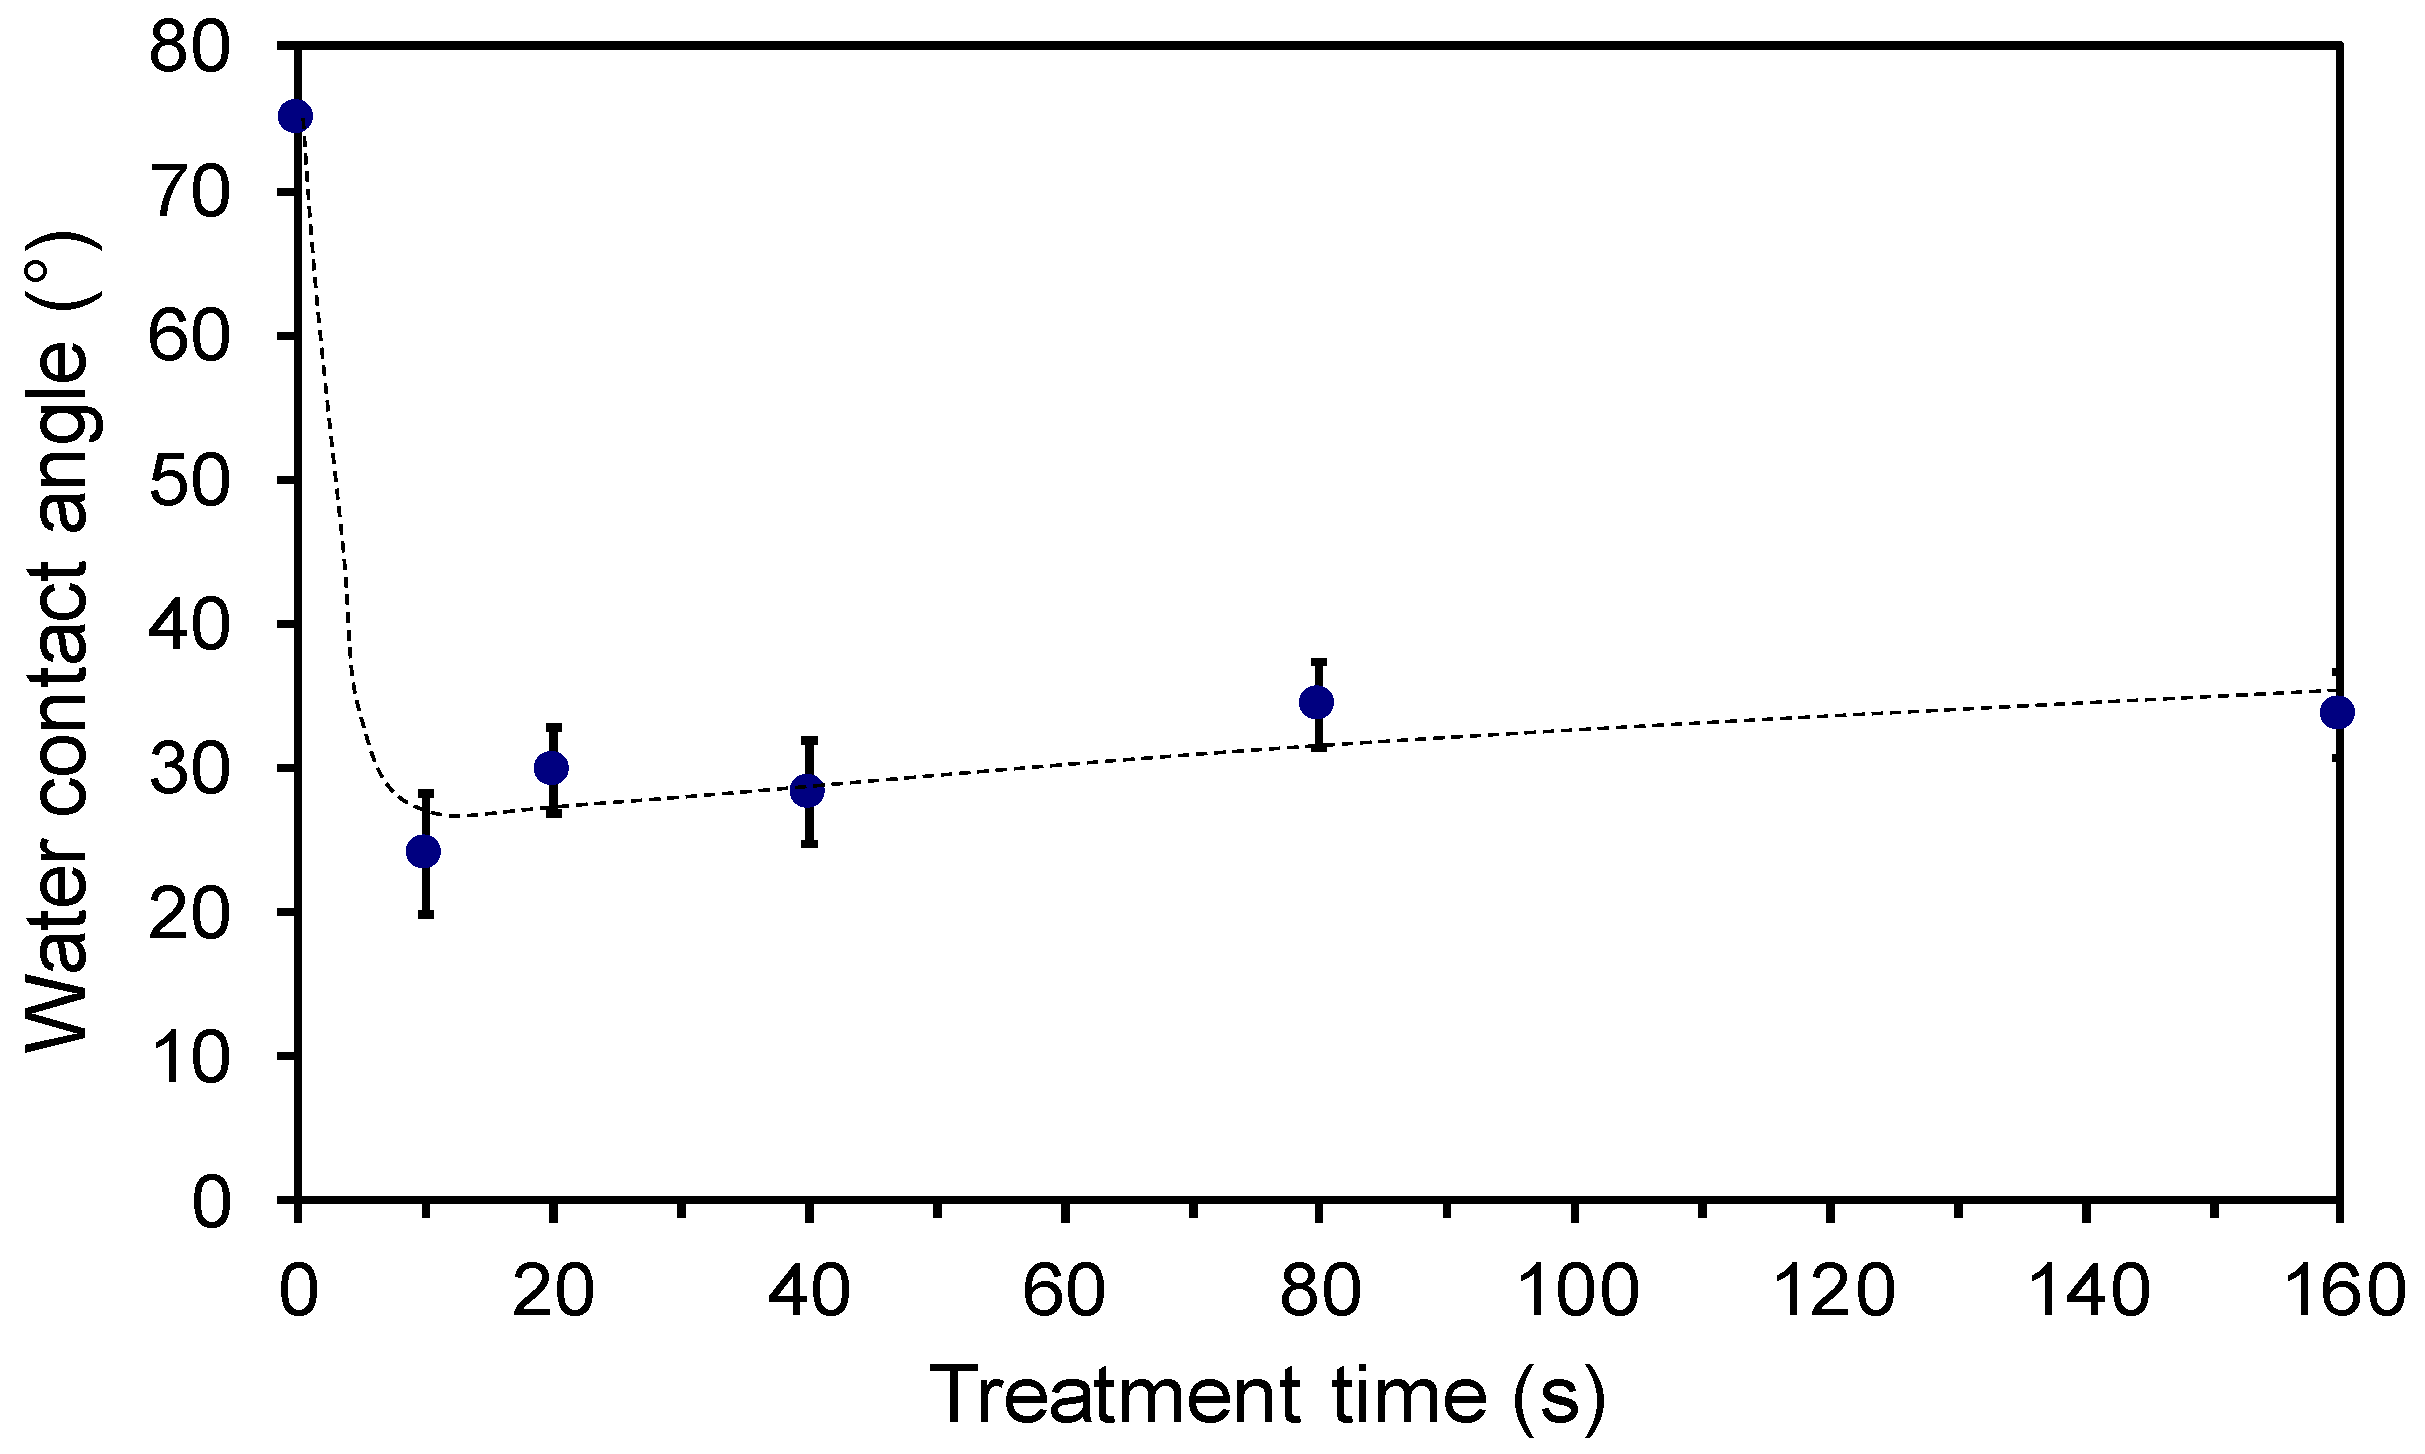
Figure 3 shows variations in the water contact angle with treatment period. The contact angle of the plasma-treated samples significantly decreased, and the surface became hydrophilic. At short treatment periods, the contact angle was approximately 25°; however, at longer treatment periods it increased slightly to 35°. Such variation of the water contact angle with treatment time cannot be explained by surface functionalization alone, as the differences in the chemical composition between the samples are only minor. Therefore, the contact angle variation could also be a result of the altered surface roughness and morphology following plasma treatment.
It is also worth mentioning that the static contact angles defined by Young’s equation have some limitations, because in practice, there may exist many metastable states of a droplet on the surface [20]. Advancing and receding contact angle measurements giving the maximum and minimum contact angles (hysteresis) would definitely provide more information; however, our device does not enable such measurements.
The surface morphology of the samples as measured by AFM is shown in Figure 4. The original sample is rather smooth. Already at the shortest treatment time, spherical features in the form of dots occurred on the polymer surface. The roughness had increased after even 10 s of treatment time, at which point interesting morphological features of submicron lateral dimensions appeared. Such nanostructuring has already been observed for the same material [21] upon exposure to oxygen plasma. It was explained by inhomogeneous etching of this particular polymer. The morphological features further developed with prolonged treatment as the temperature of the samples increased. As explained elsewhere, prolonged treatment causes an increase in sample temperature reaching close to melting point; thus, small features tend to agglomerate to larger ones [22]. In Figure 4, we can observe that the size of the features was rather varied; from smaller, with diameter of less than 1 µm after 10, 20 and 40 s of treatment, to larger, with diameters of a few µm after 80 and 160 s of treatment—the lateral size of dots thus gradually increased with treatment time. The height of the dots was already between 200 and 250 nm after 10 s of treatment, and did not change significantly with increased treatment time up to 80 s. However, a smaller number of dots was observed on the sample treated for 160 s, and their height decreased. Moreover, after 160 s, these dots almost disappeared from the sample surface (not shown here). Such rich surface morphology was also reflected in the surface roughness of the samples shown in Table 1. The highest roughness was observed on the sample treated for 80 s.
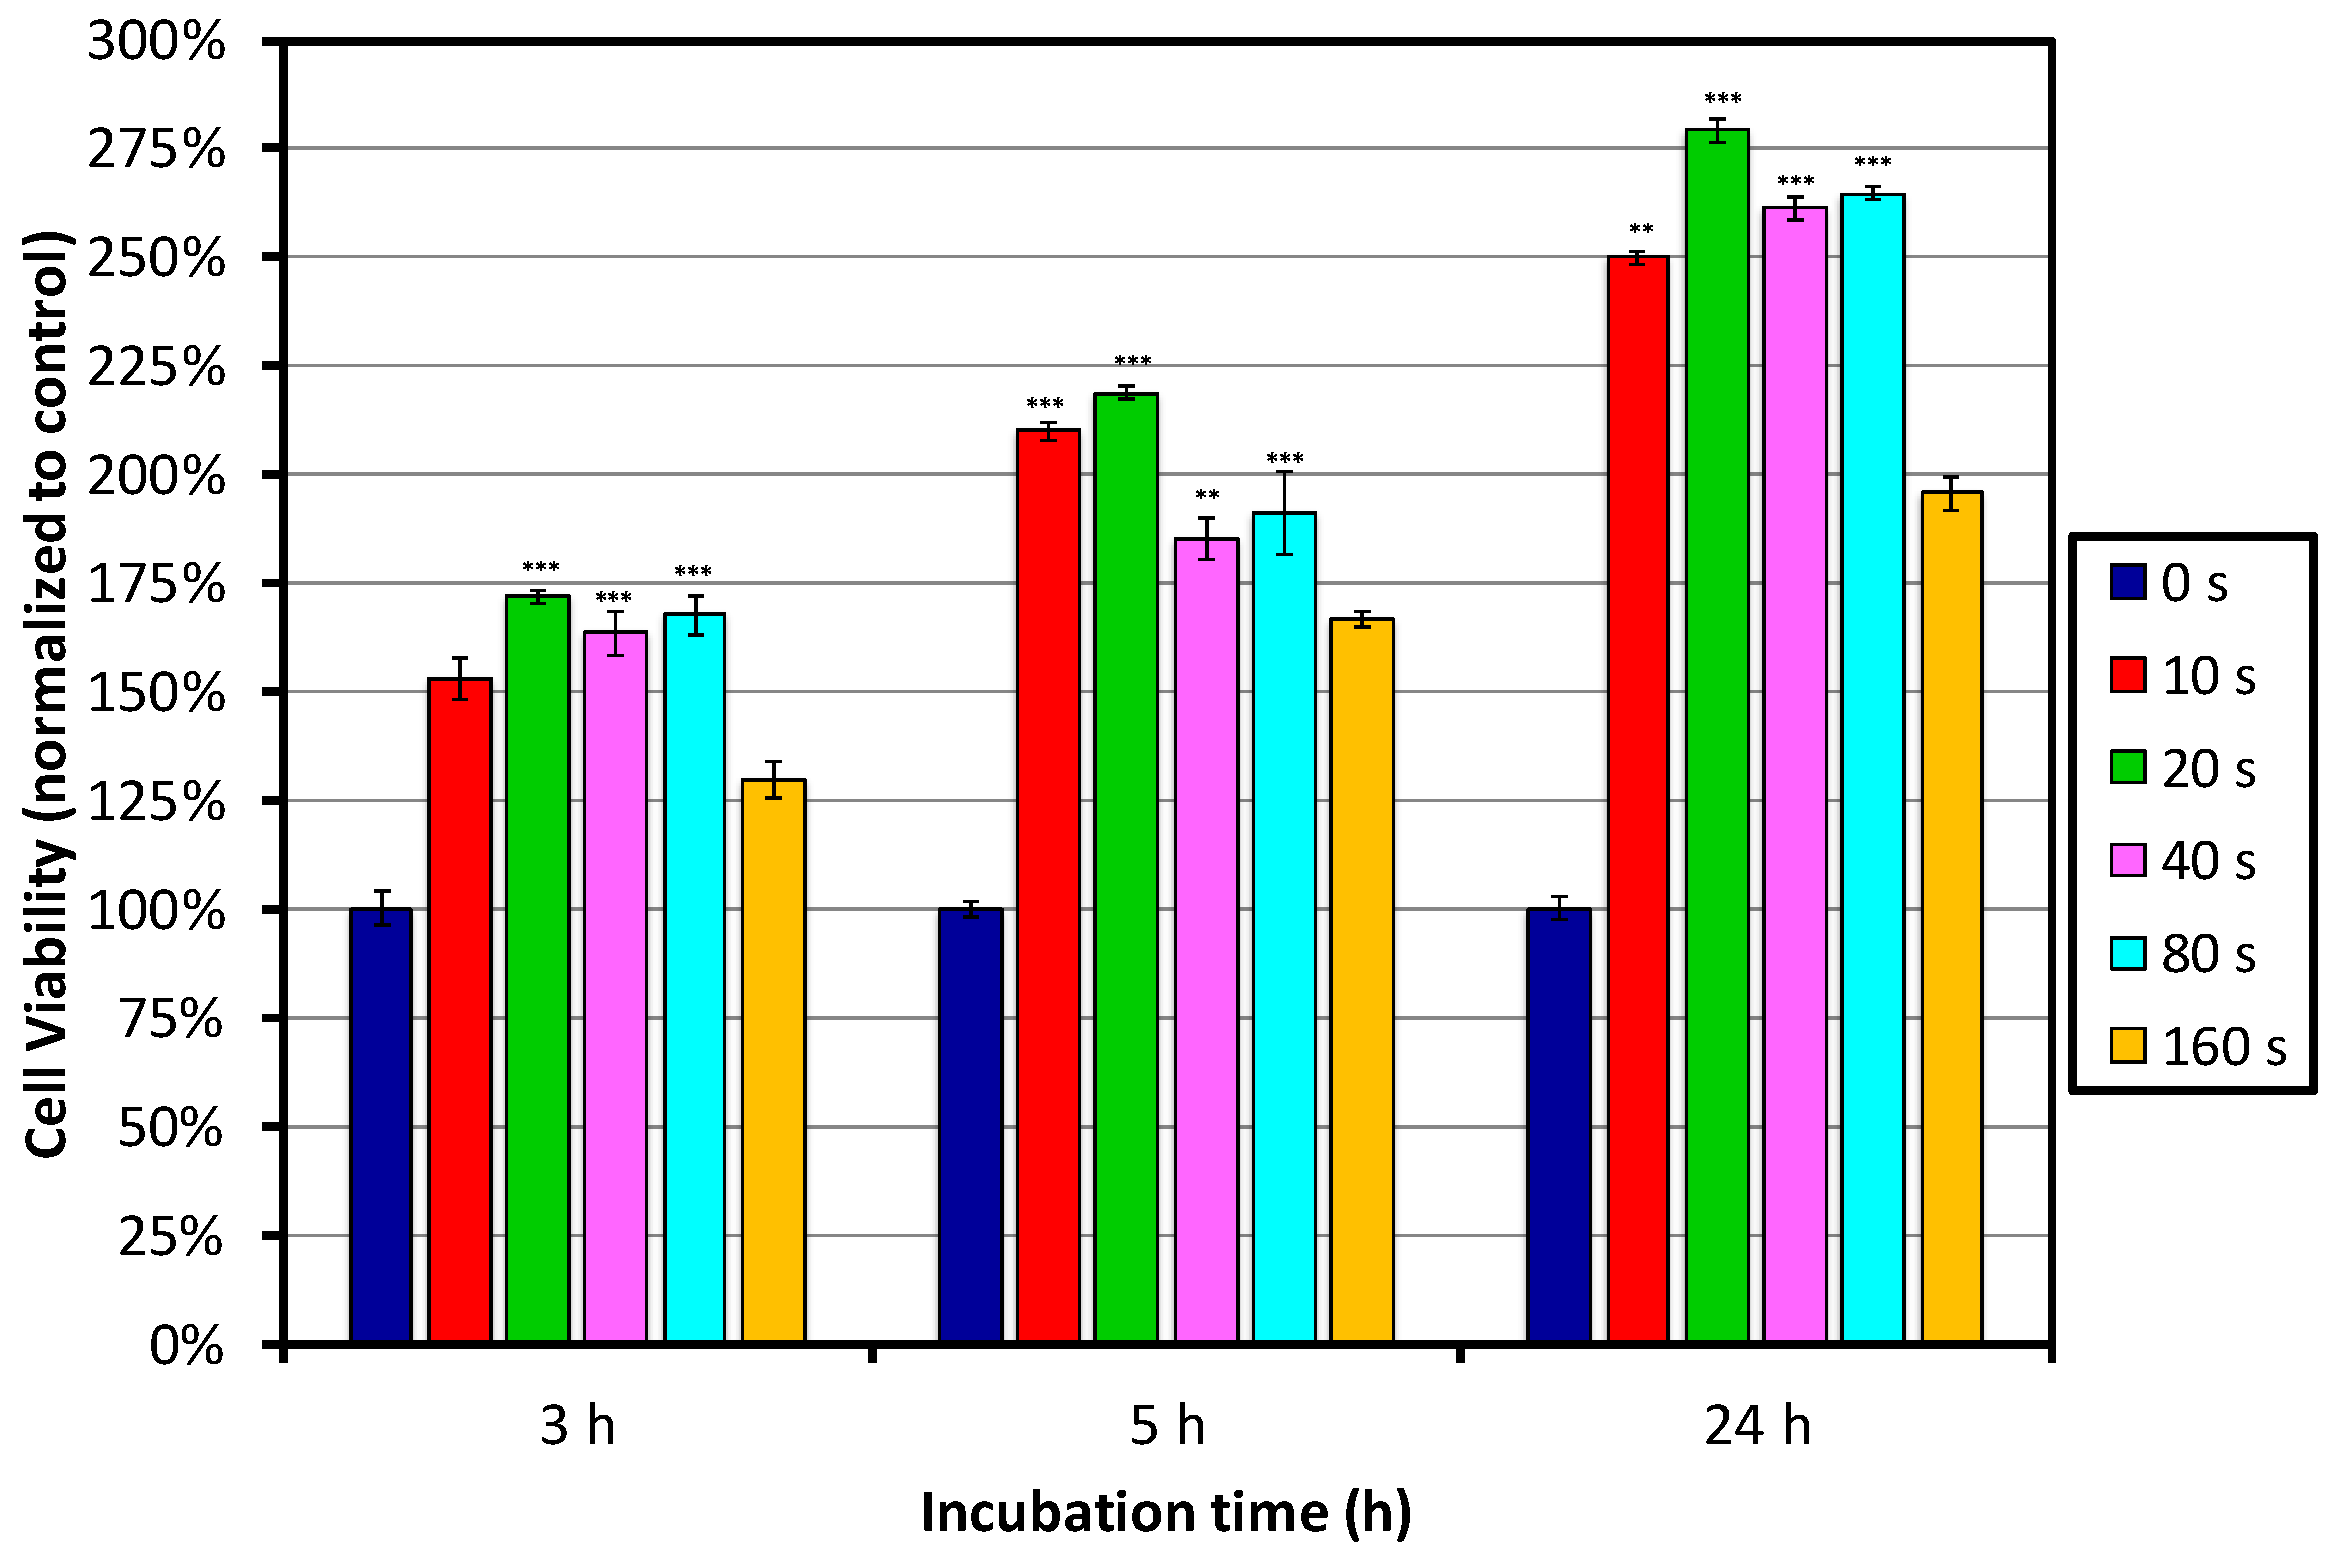
Figure 5 shows the results of the MTT assay after 3, 5 and 24 h of incubation. Significant improvement of the cell viability on all plasma-treated samples was already observed after 3 h of incubation, when compared to the control-untreated sample. The best performance was observed for PET polymer surfaces treated with plasma for between 10 and 80 s, which showed the highest cell viability and proliferation; whereas, on the surface treated for 160 s, the cell viability decreased. Nevertheless, it was still better than that for the untreated control sample. When comparing the samples treated for between 10 and 80 s, it seems that 20 s of treatment performs the best, but differences between the samples were not so pronounced.
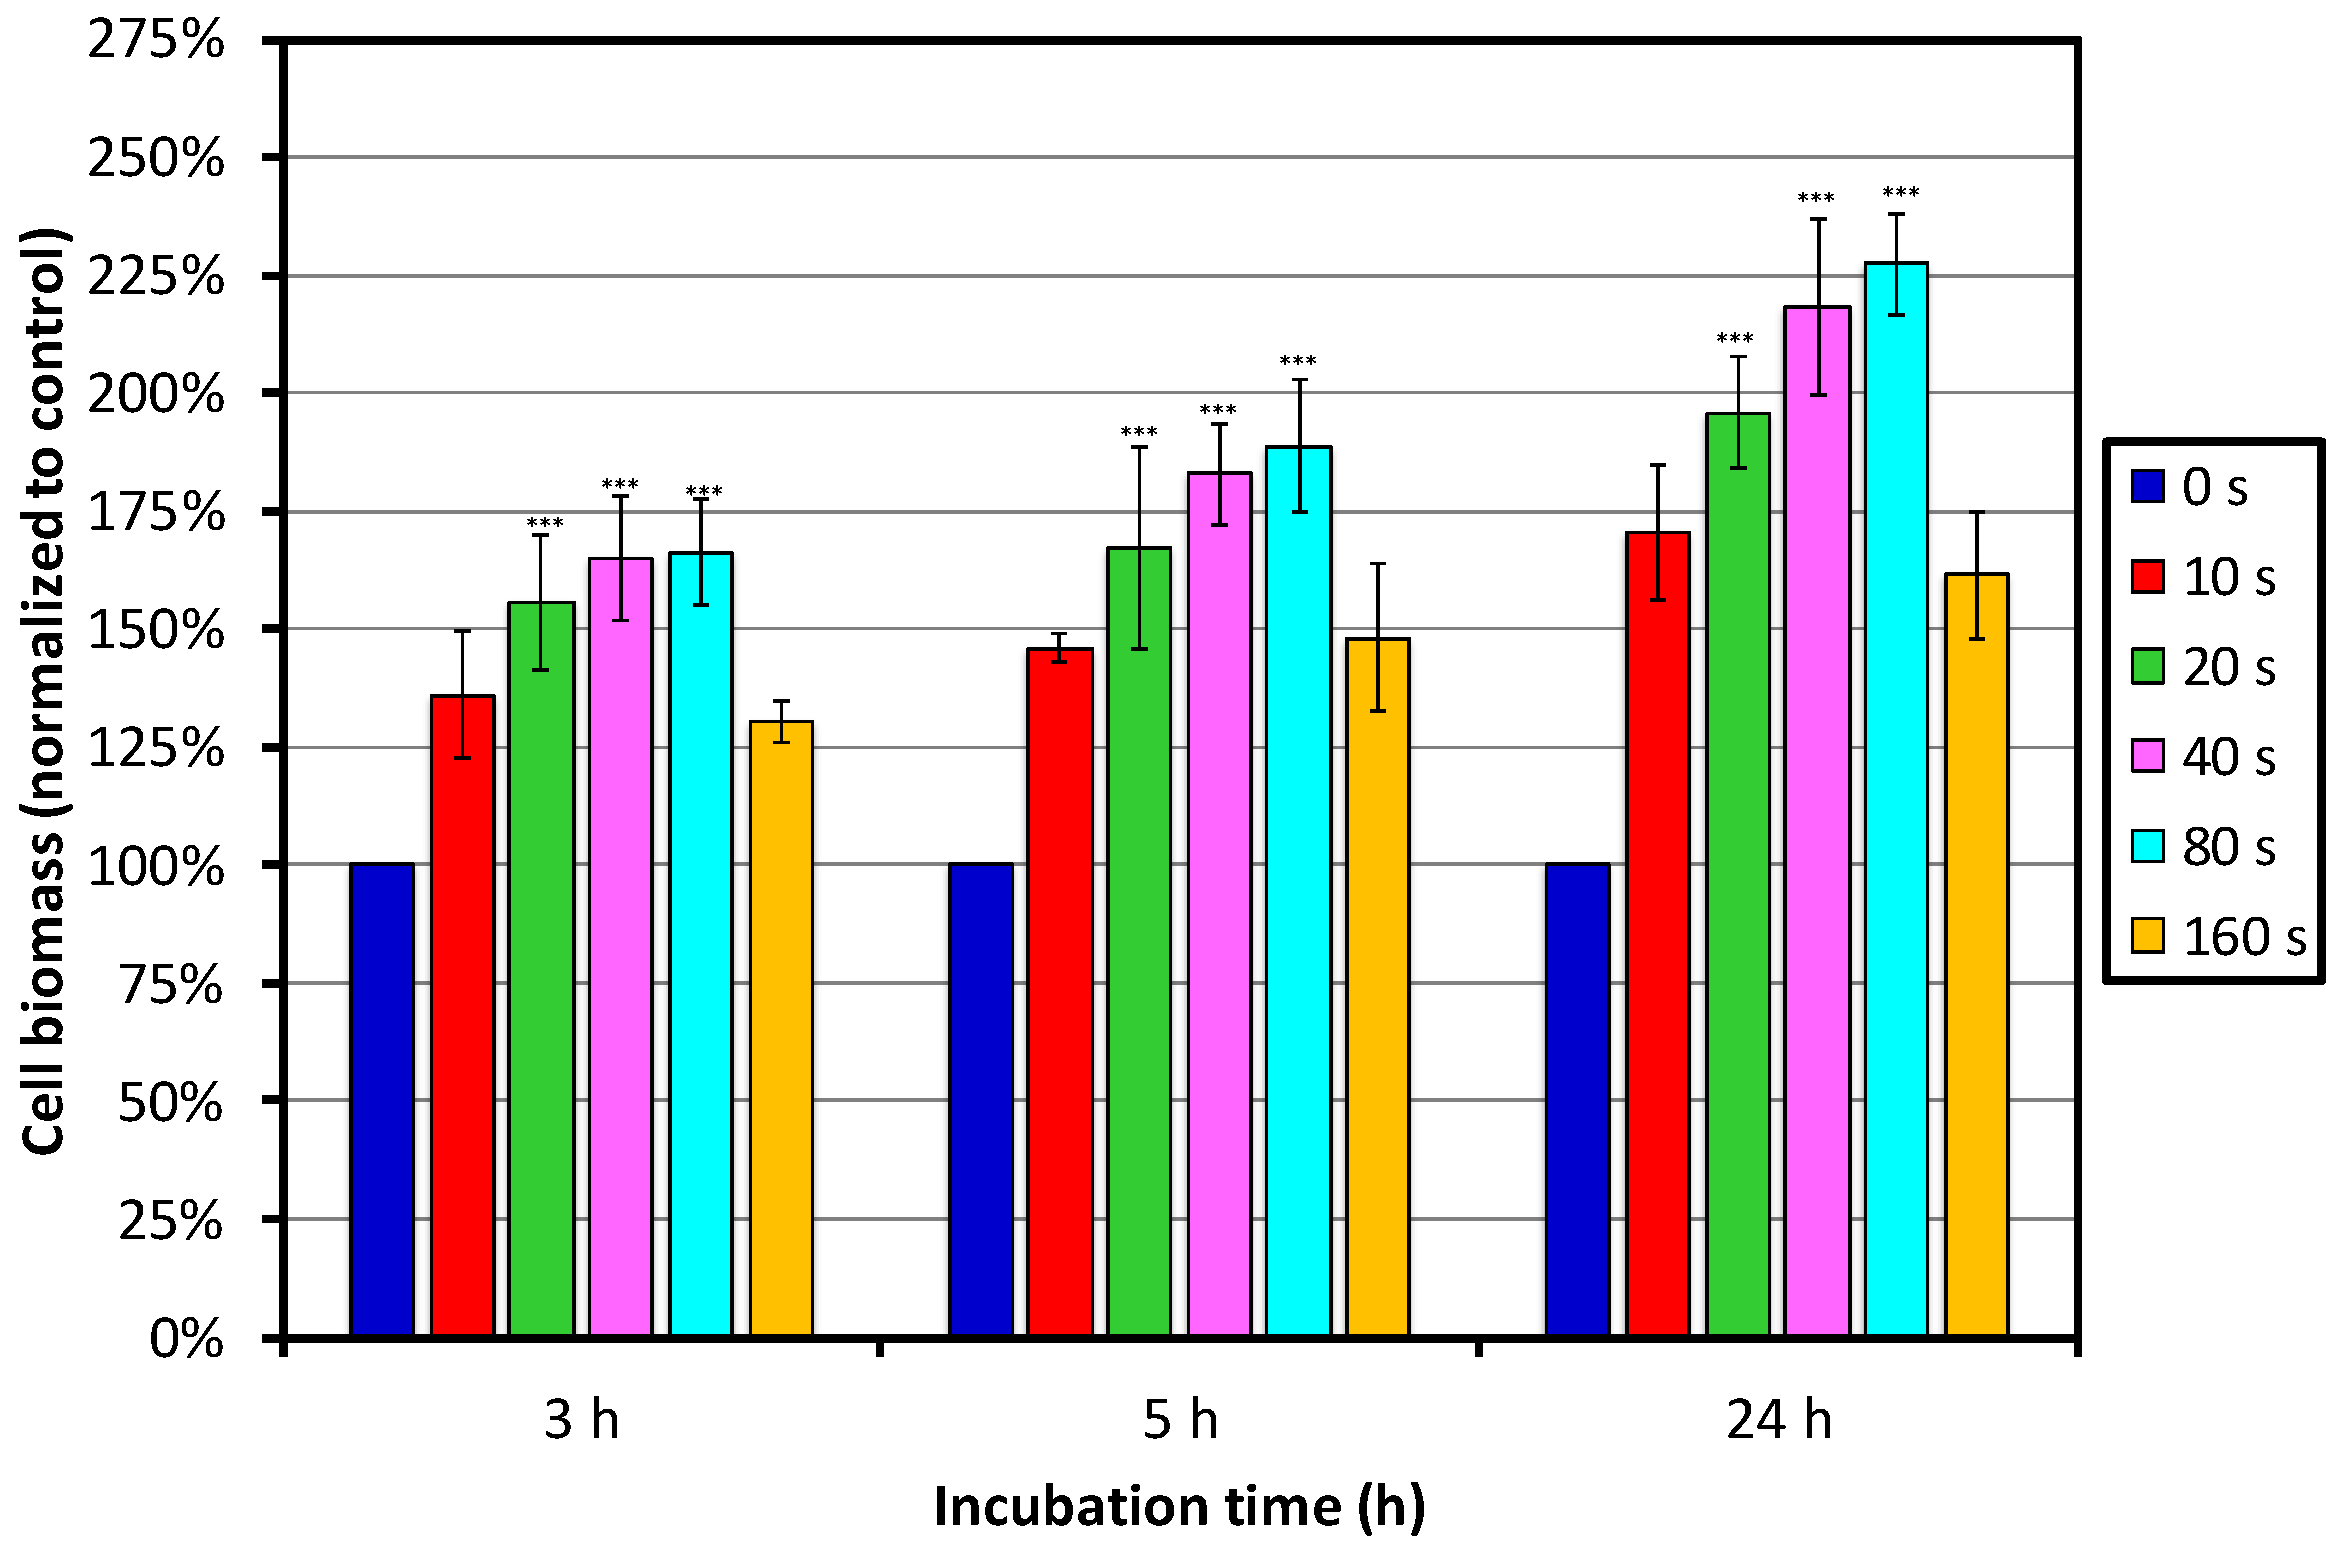
Figure 6 shows the results of the SRB assay. We can see that the cell biomass increased with increasing treatment time, and reached the maximum at 80 s of treatment, whereas the lowest biomass was observed on the sample treated for 160 s. Increased cell biomass on the PET surfaces treated for between 10 and 80 s is, in the first approximation, in good agreement with the MTT assay, showing the highest cell viability on the same batch of samples. Smaller deviations between the two assays are due to the fact that the MTT assay shows cell viability by measuring metabolic activity, whereas the SRB assay shows cell density determined by measuring the content of the total biomass, staining cellular proteins. More importantly, values of cell viability by MTT assay are determined only by living and senescent cells on the surface, as functional mitochondria in cells is required, capable of reducing less-colored tetrazolium salts into intensely-colored formazan derivatives. Therefore, with the SRB assay, the total number of live and dead cells on the sample surface is measured. A decrease in the number of cells (total biomass) indicates a degree of cytotoxicity caused by the test material.
Moreover, inconsistencies between measurements with various assays are not uncommon [23,24,25,26,27], and they arise from individual characteristics of the measuring techniques. It has been reported that the MTT assay, which is the most commonly used method, has several disadvantages, including poor linearity with the cell number, sensitivity to environmental conditions, and dependence of the cell metabolism on formazan, which is formed during enzymatic conversion of a dye in the cell mitochondria, as well as in other cell organelles [28]. MTT may result in underestimation due to the increased activity of mitochondrial dehydrogenase [29]. Therefore, SRB is often used as an alternative assay. As reported by Keepers et al., the SRB assay provides a better linearity with the cell number and a higher sensitivity [27]. Van Tonder et al. also reported better performance for the SRB assay than for MTT, because of more accurate results [30].
Nevertheless, we can conclude that the most optimal treatment periods were between 20 and 80 s, with a tendency towards 80 s. This can be explained by surface functionalization in combination with the most optimal morphology and roughness, which significantly contribute to cell adhesion and importantly affect cell viability on these samples. Namely, the highest roughness was observed for the sample treated for 80 s, and AFM images showed high and large dot-like features present on the surface, whereas surface roughness after 160 s of treatment was the lowest, with fewer dot-like features.
In the end, we have to mention that the experiments were performed on polymer foils; however, actual artificial blood vessels are cylindrical. The foils were used for ease of manipulation and characterization. Plasma with similar characteristics can be sustained in narrow tubes of a diameter typical for cardiovascular implants. It is probable that the best discharge for generating such plasma is produced by a microwave generator run in surfatron mode. The penetration depth of microwaves in an electrically conductive medium such as gaseous plasma is of the order of micrometers; therefore, plasma can be sustained in tubes as narrow as a millimeter. In fact, surfatron plasmas are usually sustained in tubes of an inner diameter of a few millimeters [31]. Such plasma does not propagate far from the microwave cavity, but uniformity in treatment of long tubes can be assured by moving either the tube or the cavity along an artificial blood vessel. Details about the suitable configuration are explained elsewhere [32].
4. Conclusions
Influence of SO2 plasma on surface endothelialization was investigated. Polymer PET was treated in SO2 plasma for various time periods from 10 to 160 s. XPS showed the formation of additional oxygen, as well as new sulfur functional groups, which were oxidized. Treatment also resulted in a rich surface morphology and roughness. Improved adhesion and proliferation of HUVEC cells was observed for all plasma-treated samples, as determined by MTT and SRB assays. Although the results obtained by both assays differed slightly, it is clear that the sample biocompatibility was the lowest after 160 s treatment, indicating a degree of toxicity for cells. The most biocompatible were the samples treated with plasma between 20 and 80 s, where the highest % of the cell viability and density was observed on the surfaces.
Acknowledgments
This research was financially supported by the Slovenian Research Agency ARRS (project grant number L7-6782).
Author Contributions
Nina Recek designed the experiments and performed the plasma treatments under the supervision of Alenka Vesel; Alenka Vesel performed the surface characterization of the samples; Nina Recek and Helena Motaln performed and interpreted the biological experiments; Alenka Vesel and Miran Mozetic analyzed the data and wrote the paper.
Conflicts of Interest
The authors declare no conflict of interest. The founding sponsors had no role in the design of the study, in the collection, analyses, or interpretation of data, in the writing of the manuscript, and in the decision to publish the results.
References
- Vilar, G.; Tulla-Puche, J.; Albericio, F. Polymers and drug delivery systems. Curr. Drug. Deliv. 2012, 9, 367–394. [Google Scholar] [CrossRef] [PubMed]
- Maitz, M.F. Applications of synthetic polymers in clinical medicine. Biosurf. Biotribol. 2015, 1, 161–176. [Google Scholar] [CrossRef]
- Tao, Y.M.; Hu, T.H.; Wu, Z.S.; Tang, H.; Hu, Y.R.; Tan, Q.; Wu, C.L. Heparin nanomodification improves biocompatibility and biomechanical stability of decellularized vascular scaffolds. Int. J. Nanomed. 2012, 7, 5847–5858. [Google Scholar] [CrossRef] [PubMed]
- Ong, A.T.L.; Aoki, J.; Kutryk, M.; Serruys, P.W. How to accelerate the endothelialization of stents. Arch. Mal. Coeur. Vaiss. 2005, 98, 123–126. [Google Scholar] [PubMed]
- Murugesan, S.; Xie, J.; Linhardt, R.J. Immobilization of heparin: Approaches and applications. Curr. Top. Med. Chem. 2008, 8, 80–100. [Google Scholar] [PubMed]
- Adipurnama, I.; Yang, M.-C.; Ciach, T.; Butruk-Raszeja, B. Surface modification and endothelialization of polyurethane for vascular tissue engineering applications: A review. Biomater. Sci. 2017, 5, 22–37. [Google Scholar] [CrossRef] [PubMed]
- Desmet, T.; Morent, R.; De Geyter, N.; Leys, C.; Schacht, E.; Dubruel, P. Nonthermal plasma technology as a versatile strategy for polymeric biomaterials surface modification: A review. Biomacromolecules 2009, 10, 2351–2378. [Google Scholar] [CrossRef] [PubMed]
- Kasemo, B. Biological surface science. Surf. Sci. 2002, 500, 656–677. [Google Scholar] [CrossRef]
- Ramires, P.A.; Mirenghi, L.; Romano, A.R.; Palumbo, F.; Nicolardi, G. Plasma-treated PET surfaces improve the biocompatibility of human endothelial cells. J. Biomed. Mater. Res. 2000, 51, 535–539. [Google Scholar] [CrossRef]
- Boespflug, G.; Maire, M.; De Crescenzo, G.; Lerouge, S.; Wertheimer, M.R. Characterization and comparison of N-, O-, and N plus O-functionalized polymer surfaces for efficient (HUVEC) endothelial cell colonization. Plasma Process. Polym. 2017, 14, e1600139. [Google Scholar] [CrossRef]
- Recek, N.; Resnik, M.; Motaln, H.; Lah-Turnsek, T.; Augustine, R.; Kalarikkal, N.; Thomas, S.; Mozetic, M. Cell Adhesion on Polycaprolactone Modified by Plasma Treatment. Int. J. Polym. Sci. 2016, 2016. [Google Scholar] [CrossRef]
- Jaganjac, M.; Vesel, A.; Milkovic, L.; Recek, N.; Kolar, M.; Zarkovic, N.; Latiff, A.; Kleinschek, K.S.; Mozetic, M. Oxygen-rich coating promotes binding of proteins and endothelialization of polyethylene terephthalate polymers. J. Biomed. Mater. Res. A 2014, 102, 2305–2314. [Google Scholar] [CrossRef] [PubMed]
- Jacobs, T.; Morent, R.; De Geyter, N.; Dubruel, P.; Leys, C. Plasma surface modification of biomedical polymers: Influence on cell-material interaction. Plasma Chem. Plasma Process. 2012, 32, 1039–1073. [Google Scholar] [CrossRef]
- Gugala, Z.; Gogolewski, S. Attachment, growth, and activity of rat osteoblasts on polylactide membranes treated with various low-temperature radiofrequency plasmas. J. Biomed. Mater. Res. A 2006, 76, 288–299. [Google Scholar] [CrossRef] [PubMed]
- Ruocco, N.; Costantini, S.; Guariniello, S.; Costantini, M. Polysaccharides from the marine environment with pharmacological, cosmeceutical and nutraceutical potential. Molecules 2016, 21, 551. [Google Scholar] [CrossRef] [PubMed]
- Vongchan, P.; Sajomsang, W.; Subyen, D.; Kongtawelert, P. Anticoagulant activity of a sulfated chitosan. Carbohyd. Res. 2002, 337, 1239–1242. [Google Scholar] [CrossRef]
- Wang, J.; Zhang, Q.B.; Zhang, Z.S.; Hou, Y.; Zhang, H. In-vitro anticoagulant activity of fucoidan derivatives from brown seaweed Laminaria japonica. Chin. J. Oceanol. Limnol. 2011, 29, 679–685. [Google Scholar] [CrossRef]
- Zaplotnik, R. E and H modes of inductively coupled SO2 plasma. IEEE Trans. Plasma Sci. 2014, 42, 2532–2533. [Google Scholar] [CrossRef]
- Misumi, I.; Naoi, K.; Sugawara, K.; Gonda, S. Profile surface roughness measurement using metrological atomic force microscope and uncertainty evaluation. Measurement 2015, 73, 295–303. [Google Scholar] [CrossRef]
- Yuan, Y.; Lee, T.R. Contact angle and wetting properties. In Surface Science Techniques. Springer Series in Surface Sciences; Bracco, G., Holst, B., Eds.; Springer: Berlin/Heidelberg, Germany, 2013. [Google Scholar]
- Vesel, A.; Kolar, M.; Doliska, A.; Stana-Kleinschek, K.; Mozetic, M. Etching of polyethylene terephthalate thin films by neutral oxygen atoms in the late flowing afterglow of oxygen plasma. Surf. Interface Anal. 2012, 44, 1565–1571. [Google Scholar] [CrossRef]
- Junkar, I.; Cvelbar, U.; Vesel, A.; Hauptman, N.; Mozetic, M. The role of crystallinity on polymer interaction with oxygen plasma. Plasma Process. Polym. 2009, 6, 667–675. [Google Scholar] [CrossRef]
- Uzunoglu, S.; Karaca, B.; Atmaca, H.; Kisim, A.; Sezgin, C.; Karabulut, B.; Uslu, R. Comparison of XTT and Alamar blue assays in the assessment of the viability of various human cancer cell lines by AT-101 (−/− gossypol). Toxicol. Mech. Methods 2010, 20, 482–486. [Google Scholar] [CrossRef] [PubMed]
- Fotakis, G.; Timbrell, J.A. In vitro cytotoxicity assays: Comparison of LDH, neutral red, MTT and protein assay in hepatoma cell lines following exposure to cadmium chloride. Toxicol. Lett. 2006, 160, 171–177. [Google Scholar] [CrossRef] [PubMed]
- Sliwka, L.; Wiktorska, K.; Suchocki, P.; Milczarek, M.; Mielczarek, S.; Lubelska, K.; Cierpial, T.; Lyzwa, P.; Kielbasinski, P.; Jaromin, A.; et al. The comparison of MTT and CVS assays for the assessment of anticancer agent interactions. PLoS ONE 2016, 11. [Google Scholar] [CrossRef] [PubMed]
- Bopp, S.K.; Lettieri, T. Comparison of four different colorimetric and fluorometric cytotoxicity assays in a zebrafish liver cell line. BMC Pharmacol. 2008, 8. [Google Scholar] [CrossRef] [PubMed]
- Keepers, Y.P.; Pizao, P.E.; Peters, G.J.; van Ark-Otte, J.; Winograd, B.; Pinedo, H.M. Comparison of the sulforhodamine B protein and tetrazolium (MTT) assays for in vitro chemosensitivity testing. Eur. J. Cancer Clin. Oncol. 1991, 27, 897–900. [Google Scholar] [CrossRef]
- Marqués-Gallego, P.; den Dulk, H.; Backendorf, C.; Brouwer, J.; Reedijk, J.; Burke, J.F. Accurate non-invasive image-based cytotoxicity assays for cultured cells. BMC Biotechnol. 2010, 10. [Google Scholar] [CrossRef] [PubMed]
- Wang, P.; Henning, S.M.; Heber, D. Limitations of MTT and MTS-based assays for measurement of antiproliferative activity of green tea polyphenols. PLoS ONE 2010, 5. [Google Scholar] [CrossRef] [PubMed]
- Van Tonder, A.; Joubert, A.M.; Cromarty, A.D. Limitations of the 3-(4,5-dimethylthiazol-2-yl)-2,5-diphenyl-2H-tetrazolium bromide (MTT) assay when compared to three commonly used cell enumeration assays. BMC Res. Notes 2015, 8. [Google Scholar] [CrossRef] [PubMed]
- Kutasi, K.; Zaplotnik, R.; Primc, G.; Mozetic, M. Controlling the oxygen species density distributions in the flowing afterglow of O2/Ar–O2 surface-wave microwave discharges. J. Phys. D 2014, 47, 1–11. [Google Scholar] [CrossRef]
- Junkar, I.; Mozetic, M.; Vesel, A.; Cvelbar, U.; Krasna, M.; Domanovic, D. Biomedical Polymeric Prostheses for Improvement of Their Antithrombogenous Properties; Austrian Patent Office: Vienna, Austria, 2014. [Google Scholar]
Figure 1.
XPS surface composition of the PET samples treated in SO2 plasma for various periods.
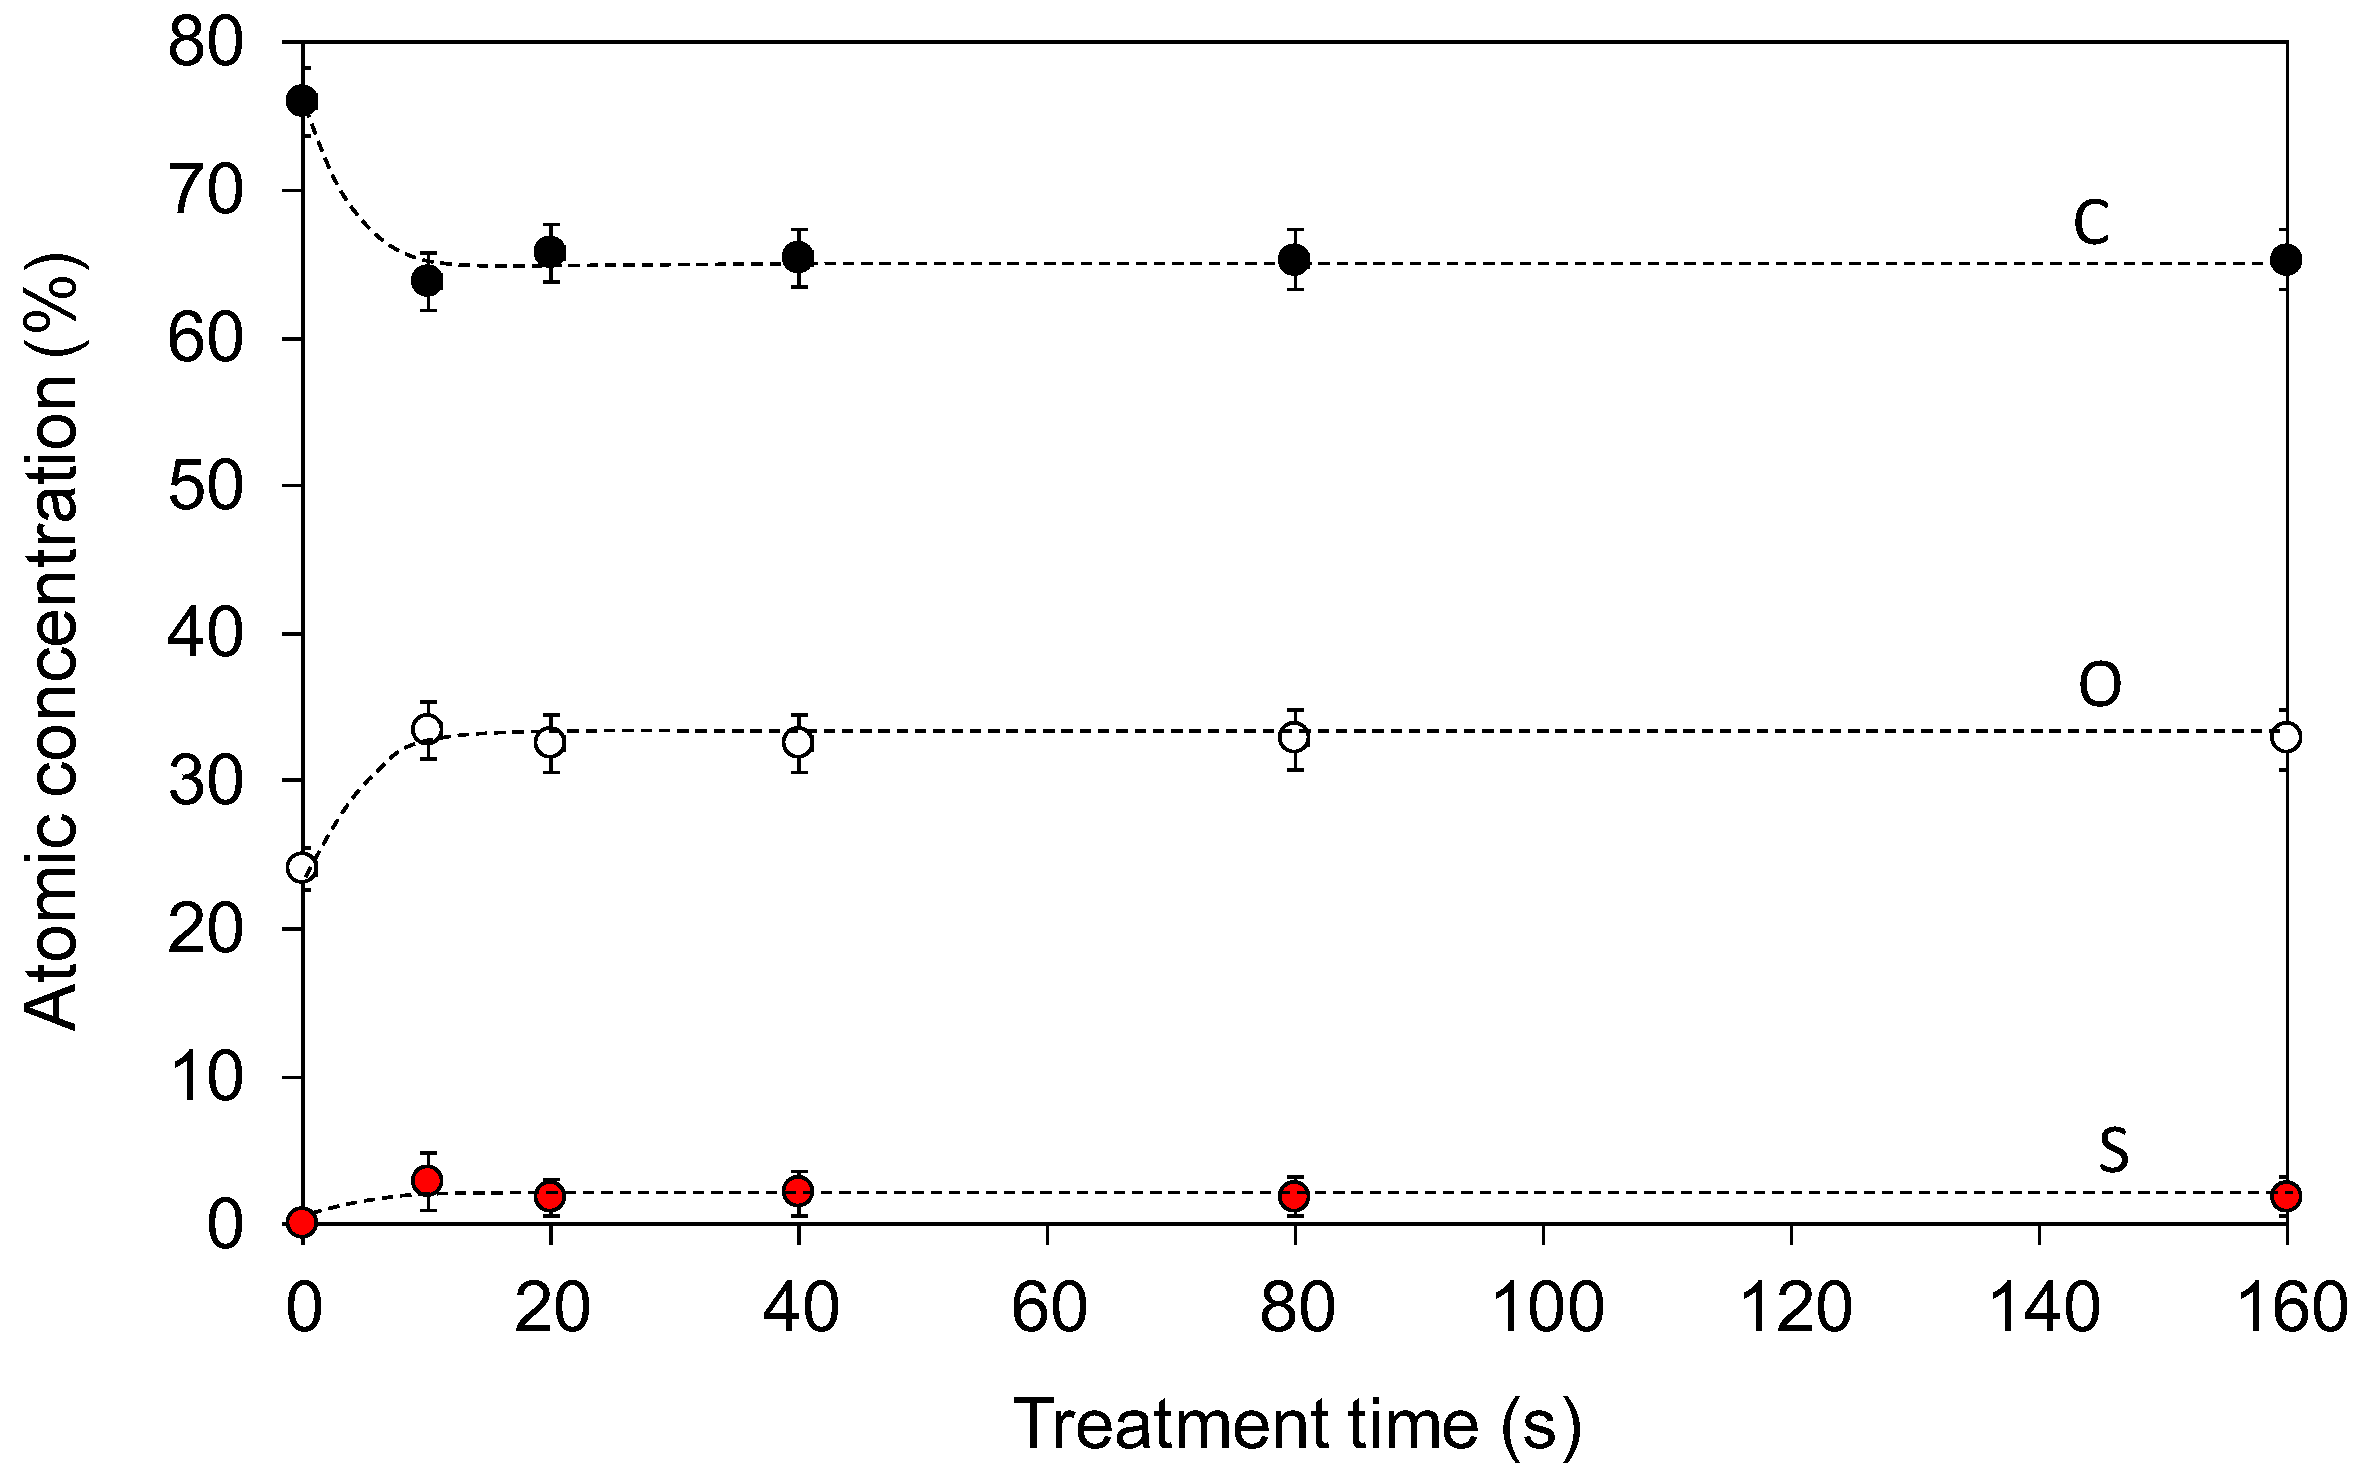
Figure 2.
High-resolution XPS spectra of PET polymer treated in SO2 plasma for various periods: (a) C1s peaks; (b) S2p peaks.
Figure 2.
High-resolution XPS spectra of PET polymer treated in SO2 plasma for various periods: (a) C1s peaks; (b) S2p peaks.
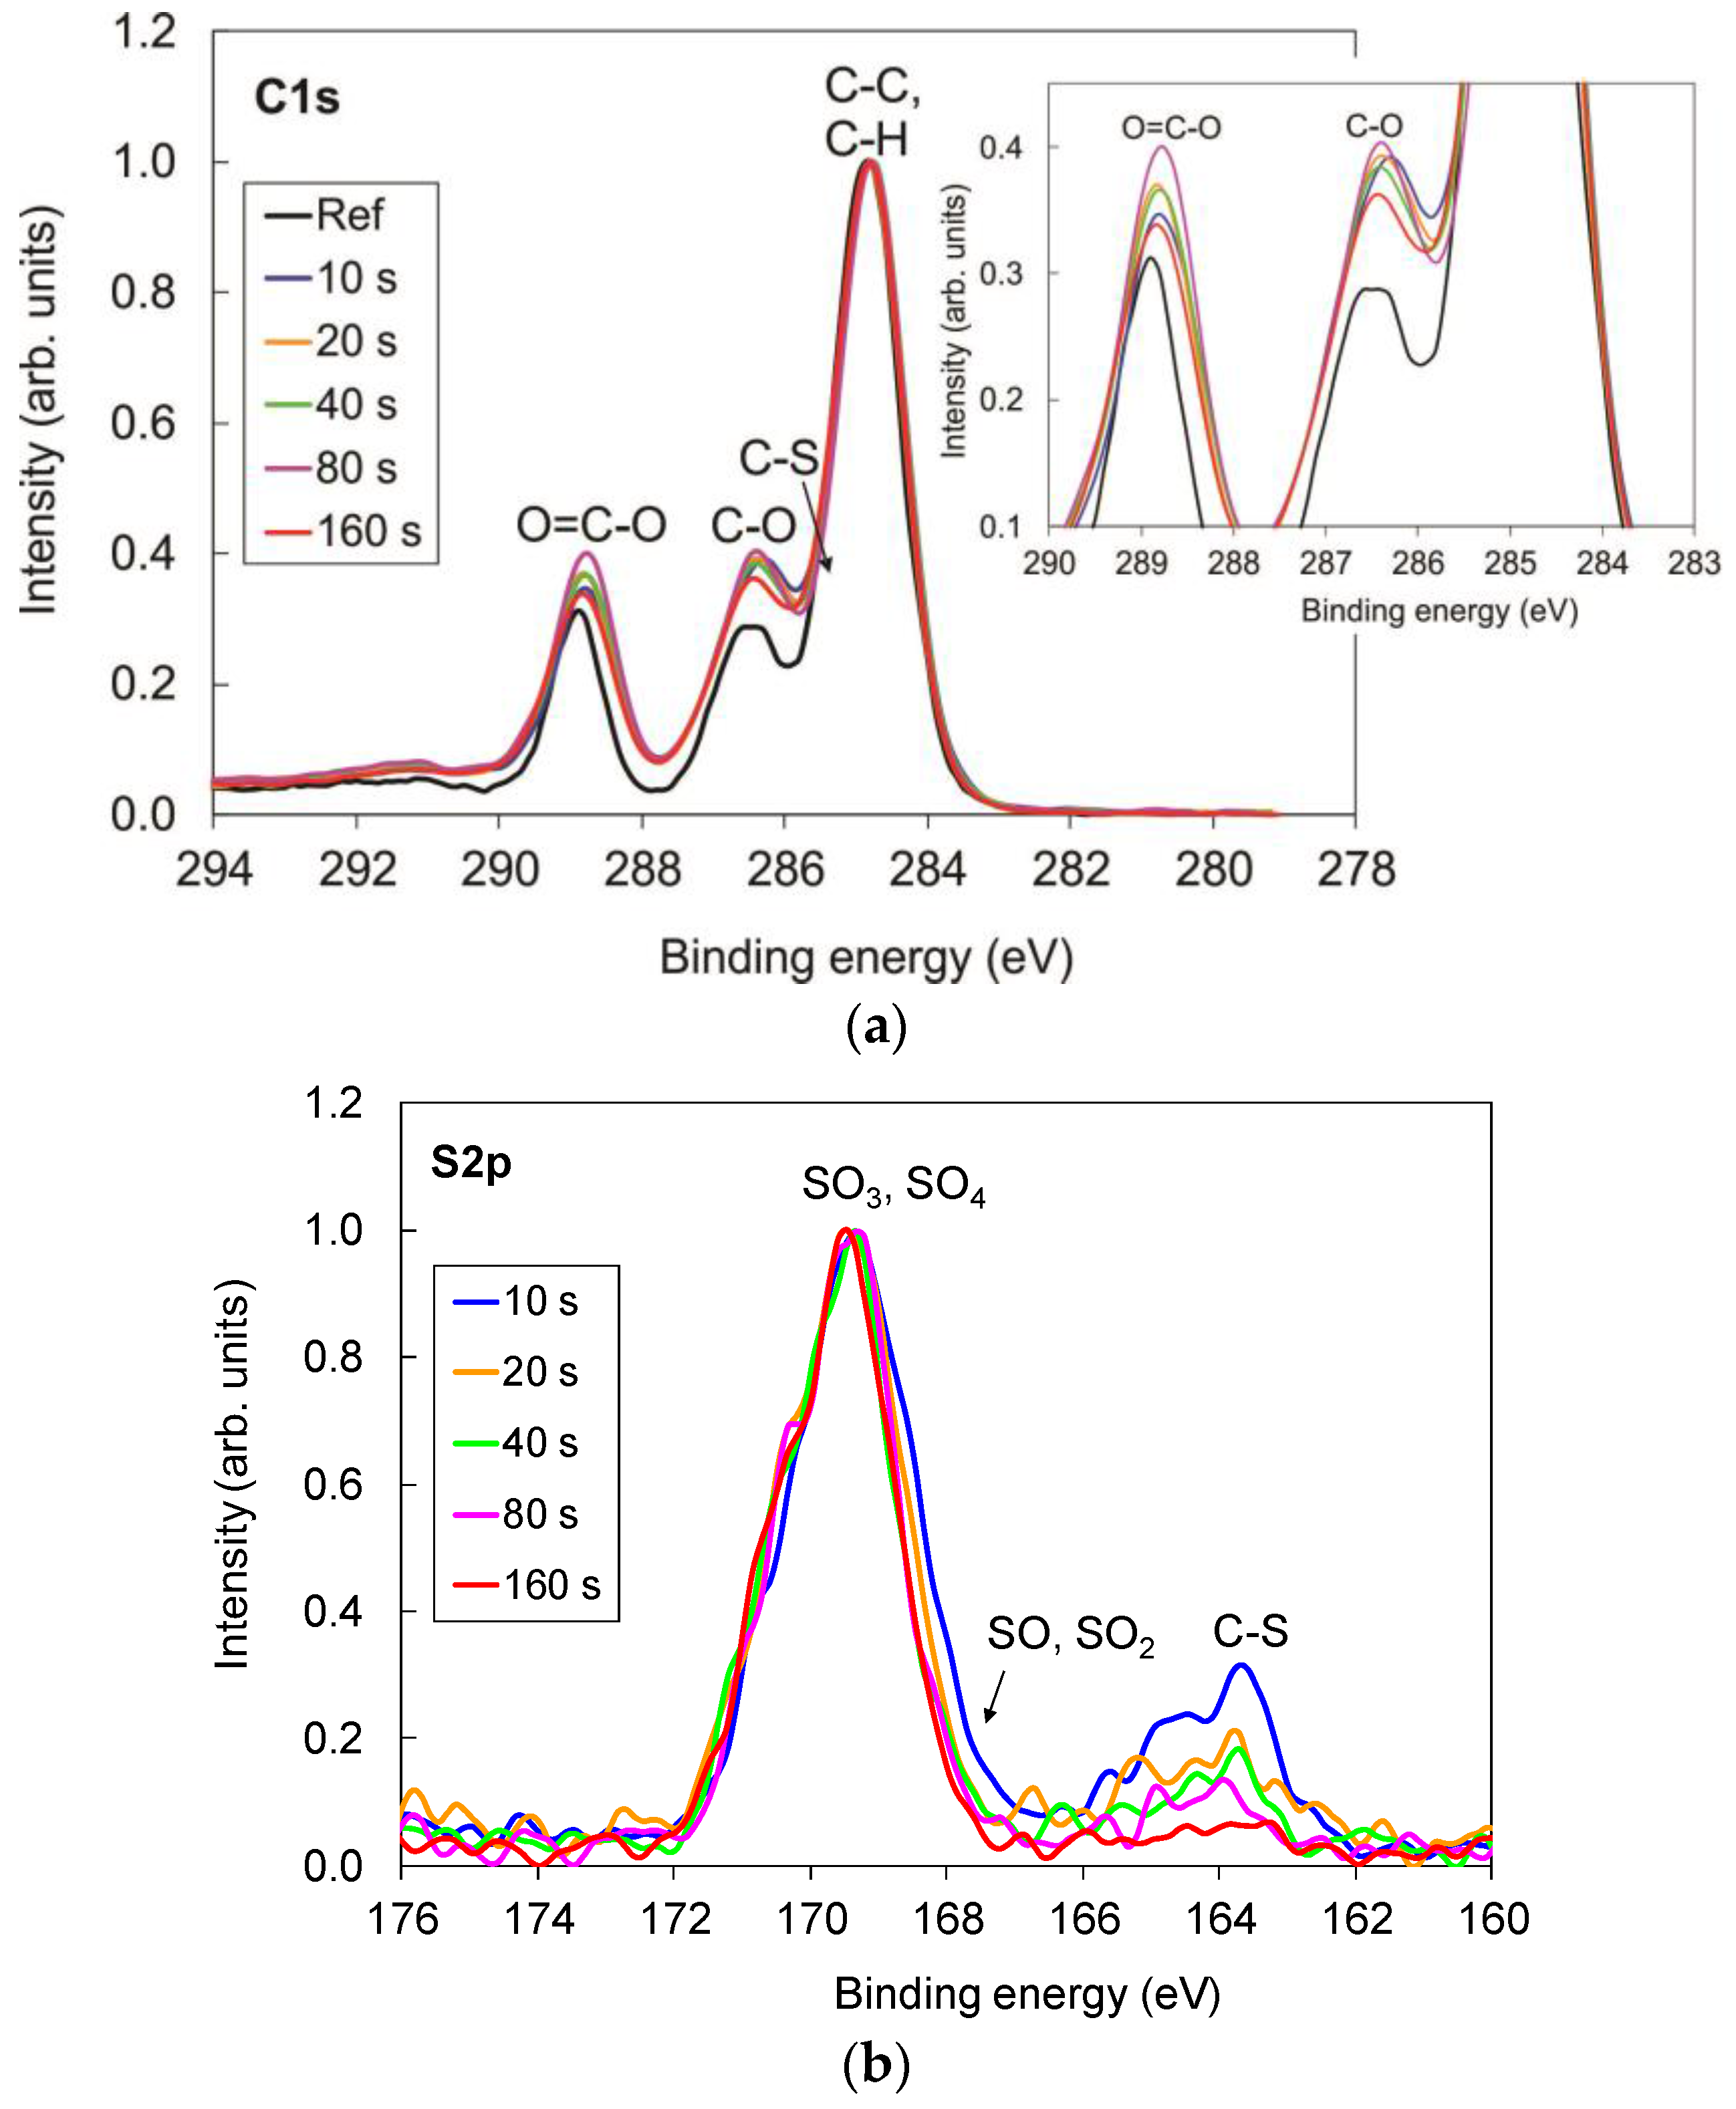
Figure 3.
Variation of the water contact angle of PET polymer treated in SO2 plasma for various periods.
Figure 3.
Variation of the water contact angle of PET polymer treated in SO2 plasma for various periods.

Figure 4.
AFM images (5 × 5 µm2) of PET polymer treated in SO2 plasma for various time periods.
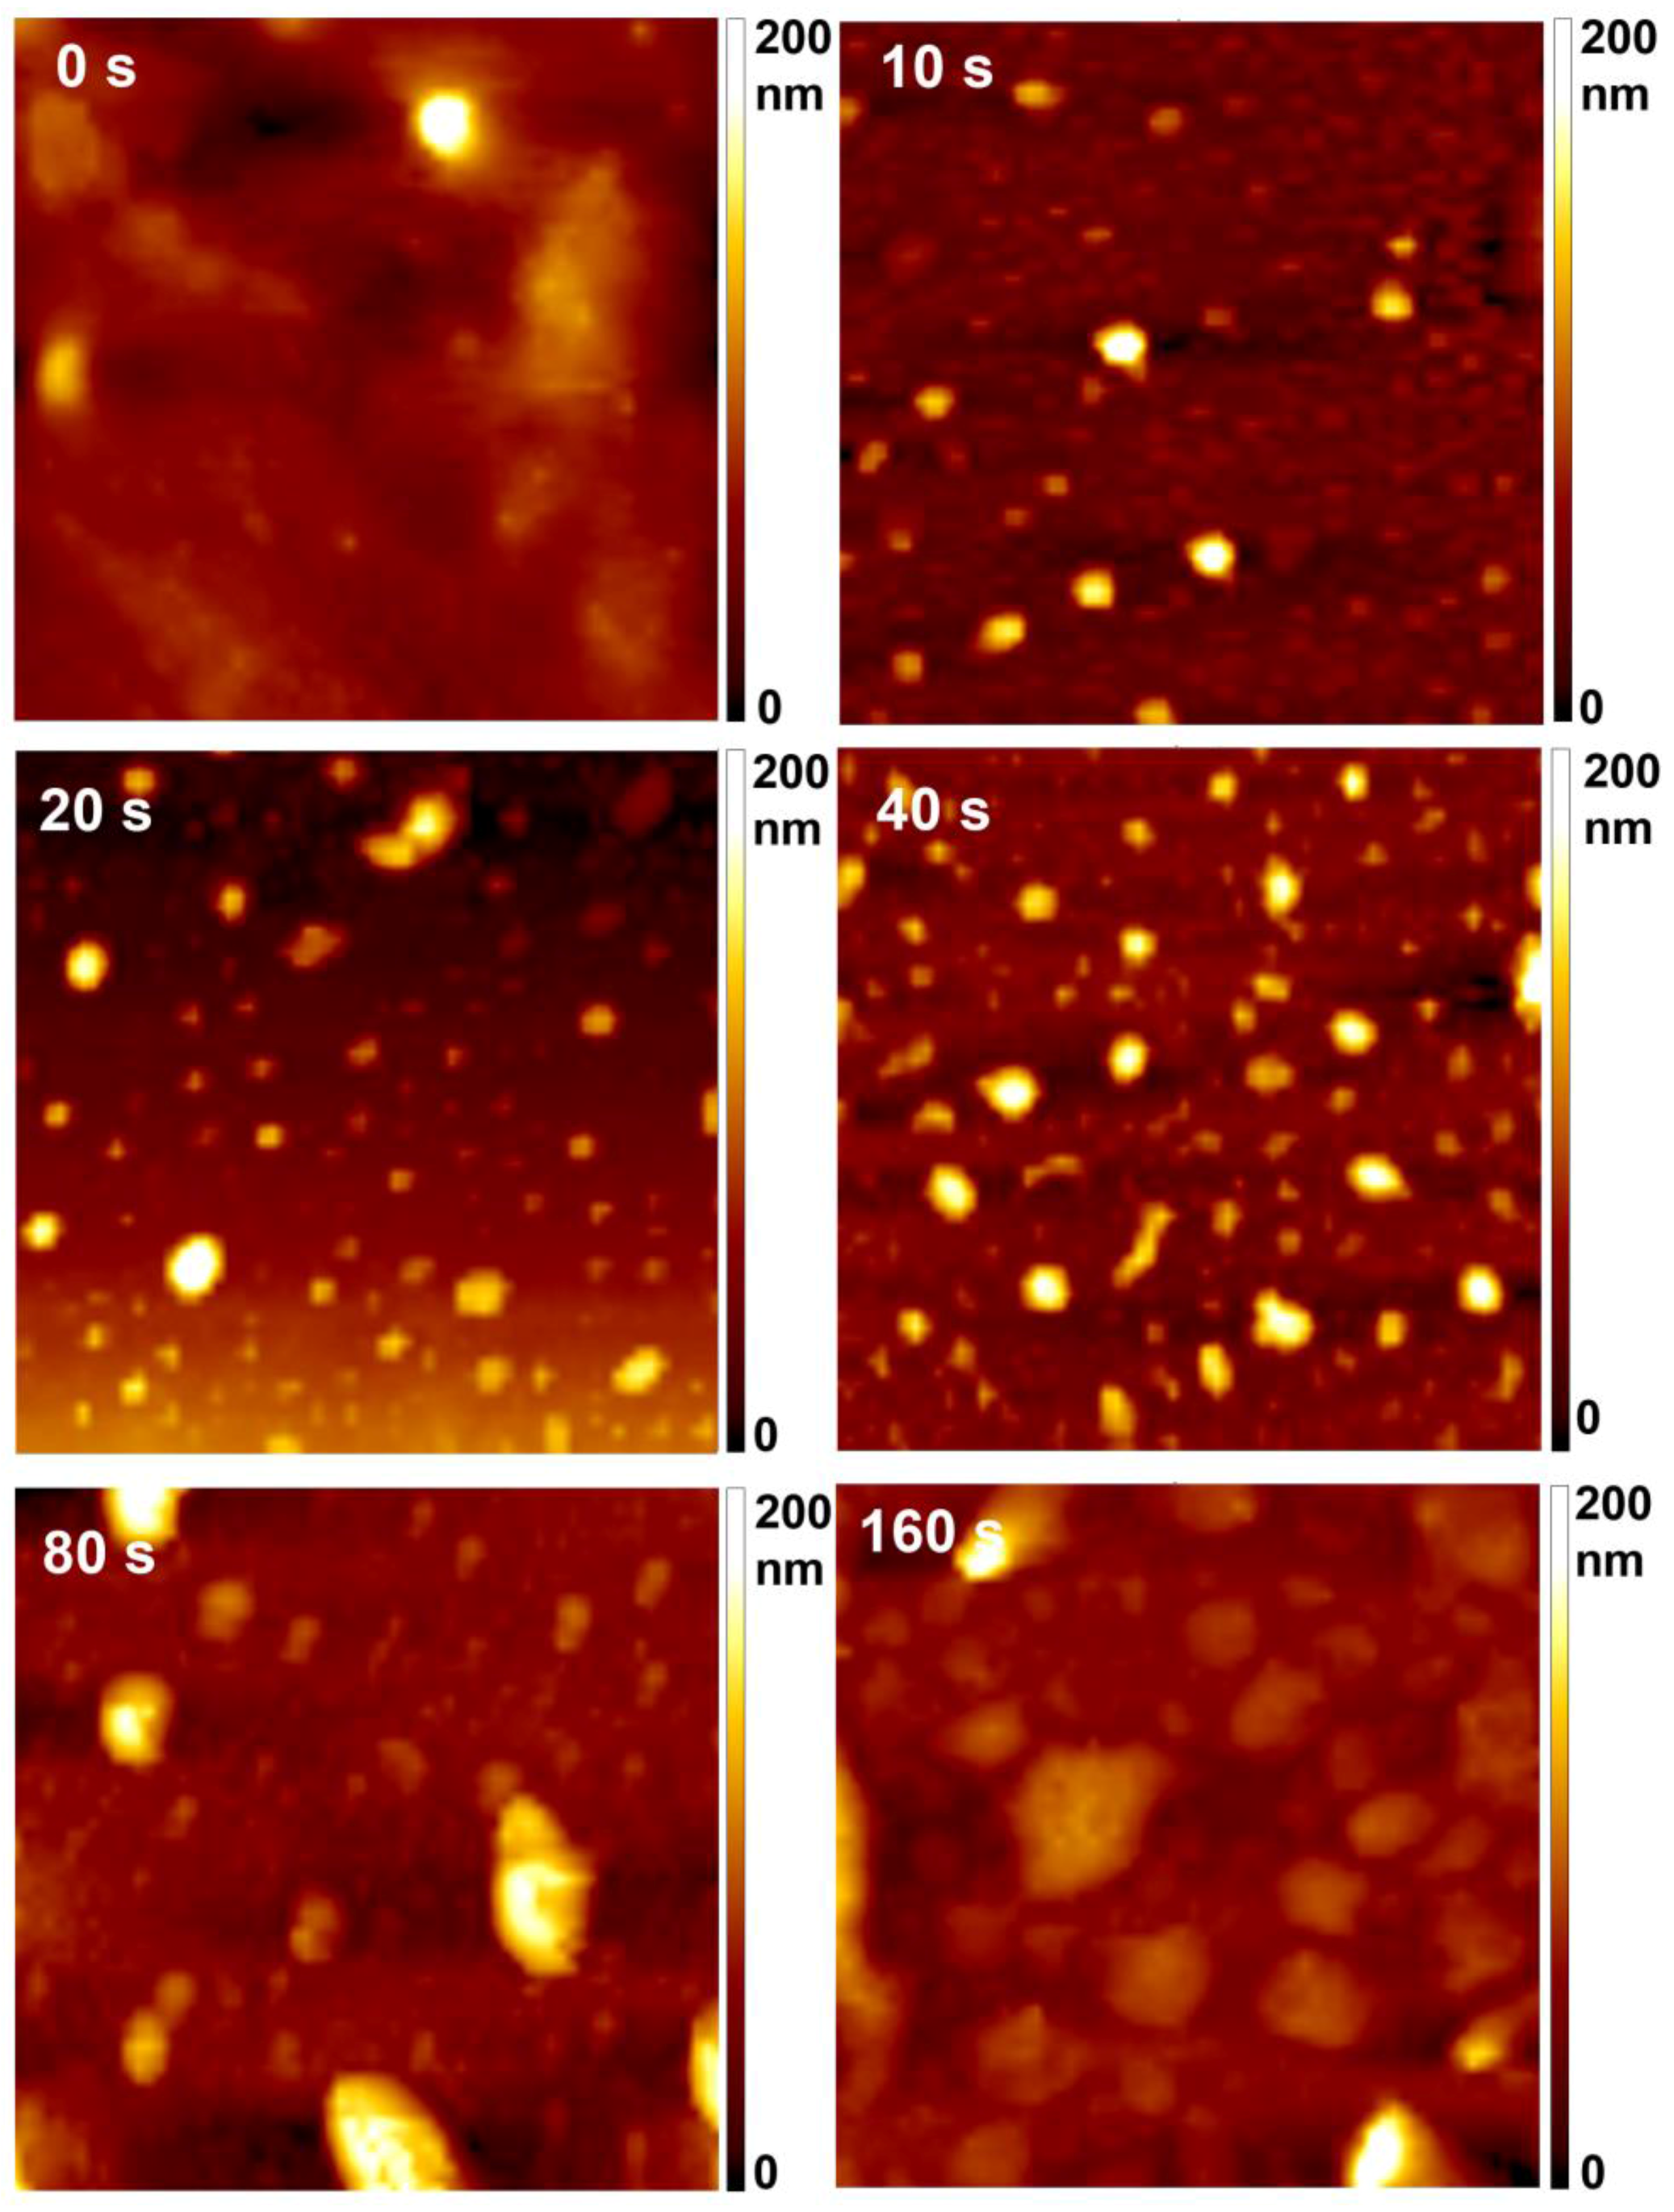
Figure 5.
Results of MTT assay for HUVEC cell proliferation on PET surfaces treated in SO2 plasma for various time periods. Symbols ** and *** present statistical significance at p < 0.01 and p < 0.001, respectively, as compared with the control. Mean values (±SE) for the respective triplicates are also given.

Figure 6.
Surface cytotoxicity (SRB assay) of PET surfaces treated in SO2 plasma for various periods. Symbols ** and *** represent statistical significance at p < 0.01 and p < 0.001, respectively, as compared with the control. Mean values (±SE) for the respective triplicates are given.
Figure 6.
Surface cytotoxicity (SRB assay) of PET surfaces treated in SO2 plasma for various periods. Symbols ** and *** represent statistical significance at p < 0.01 and p < 0.001, respectively, as compared with the control. Mean values (±SE) for the respective triplicates are given.


Table 1.
Surface roughness of SO2 plasma-treated PET at various time periods measured on 5 × 5 µm2 surface area.
Table 1.
Surface roughness of SO2 plasma-treated PET at various time periods measured on 5 × 5 µm2 surface area.
| Treatment Period | Roughness Ra | Roughness RMS | Ra Uncertainty U95 |
|---|---|---|---|
| 0 s | 1.2 nm | 2.3 nm | 0.2 nm |
| 10 s | 15.2 nm | 24.5 nm | 0.6 nm |
| 20 s | 13.4 nm | 23.5 nm | 1.7 nm |
| 40 s | 13.5 nm | 20.4 nm | 1.6 nm |
| 80 s | 17.6 nm | 28.0 nm | 2.2 nm |
| 160 s | 13.5 nm | 19.7 nm | 2.4 nm |
© 2017 by the authors. Licensee MDPI, Basel, Switzerland. This article is an open access article distributed under the terms and conditions of the Creative Commons Attribution (CC BY) license (http://creativecommons.org/licenses/by/4.0/).
Share and Cite
MDPI and ACS Style
Vesel, A.; Recek, N.; Motaln, H.; Mozetic, M. Endothelialization of Polyethylene Terephthalate Treated in SO2 Plasma Determined by the Degree of Material Cytotoxicity. Plasma 2018, 1, 12-22. https://doi.org/10.3390/plasma1010002
AMA Style
Vesel A, Recek N, Motaln H, Mozetic M. Endothelialization of Polyethylene Terephthalate Treated in SO2 Plasma Determined by the Degree of Material Cytotoxicity. Plasma. 2018; 1(1):12-22. https://doi.org/10.3390/plasma1010002
Chicago/Turabian StyleVesel, Alenka, Nina Recek, Helena Motaln, and Miran Mozetic. 2018. "Endothelialization of Polyethylene Terephthalate Treated in SO2 Plasma Determined by the Degree of Material Cytotoxicity" Plasma 1, no. 1: 12-22. https://doi.org/10.3390/plasma1010002