Article

Motion Sensor Application on Building Lighting Installation for Energy Saving and Carbon Reduction Joint Crediting Mechanism

1
Center for Environmental Studies, Universitas Budi Luhur, South Jakarta 12260, Indonesia
2
Deparment of Electrical Engineering, Universitas Budi Luhur, South Jakarta 12260, Indonesia
3
Department of Information Technology, Universitas Budi Luhur, South Jakarta 12260, Indonesia
4
Department of Economics and Business, Universitas Budi Luhur, South Jakarta 12260, Indonesia
5
JCM Secretariat, Coordinating Ministry for Economic Affairs, Jl. Medan Merdeka Barat 7, Jakarta 10110, Indonesia
*
Author to whom correspondence should be addressed.
Appl. Syst. Innov. 2018, 1(3), 23; https://doi.org/10.3390/asi1030023
Submission received: 7 April 2018 / Revised: 5 July 2018 / Accepted: 6 July 2018 / Published: 23 July 2018
(This article belongs to the Special Issue Selected papers from IEEE ICASI 2018)

Abstract

:
Although common in developed countries such as Japan and Taiwan, the use of lamps coupled with motion sensors are still uncommon and even rare in Indonesia. Our experiment aims to show that simple installation of commercially available motion sensors can contribute to reduce the electricity bill from the increase of energy efficiency, abundance in availability of energy being the main factor in Indonesian high energy consumption habits. High electricity demand for consumption at current supply level in Indonesia led to the rising cost of electricity bills. This factor is compounded by the fact that many electric generators in Indonesia still use fossil fuels, which contributes to the high basic generation cost. UBL is one of the universities that aim to be a green campus. Our research explores the possibility of installing motion sensors to contribute to the energy efficiency. Although mostly common in developed countries, the use of motion sensors for energy efficiency is still rare, especially in Indonesia. Despite rising cost and supply shortages, Indonesian buildings are still of high energy consumption. Our experiment shows that simple installation of commercially available motion sensors can contribute to reduce the electricity bill from the increase of energy efficiency. One of the efforts to lower energy demand on the consumer side is to use the electricity efficiently, such as turning off lights in a room when it is not in use. This method can be simply done by turning the light switches for office and classrooms, but difficult to do in public spaces such as toilets and corridors. Automatic light switches experimentally installed in sample toilet rooms prove that electricity consumption from the lamps can contribute to the reduction of total weekly energy that translates into Greenhouse Gas emission reduction.

1. Introduction

Due to an abundance of energy in Indonesia, most energy usage by Indonesian individuals and entities are of high consumption. The high level of electricity consumption translates into higher cost. Moreover, the majority of Indonesian electricity generation power plants are fossil-fueled. A change in oil price affects the fuel price and in turn influences the base electricity fares. One effort to lower the electricity energy consumption cost on the customer side is to increase the efficiency of electricity usage, such as using energy-efficient equipment, and deactivate electrical equipment when not in use [1]. Current buildings that adhere to energy efficiency are almost entirely built after the year 2000; it is also the case mentioned by Jansson et al. [2] and Pisello et al. through effective thermal zone occupancy [3]. Therefore, for older and already built buildings to implement energy saving measures is still uncommon.
One aspect that can be made more efficient in universities is room lighting. Classrooms’ electricity consumption in Universitas Budi Luhur is already controlled by a main panel; when no lectures are scheduled in a classroom, that particular classroom can be remotely deactivated. Other aspects of room lighting usage are office room and toilets, which is mostly on from the start of the morning workday to the end of night classes. Offices and staff rooms can be manually switched off when not occupied, but the use of public facilities such as toilets and enclosed corridors is random, therefore it is impractical to manually switch the lightings. The proposed method in this pilot project is to use an automatic switch which detects the presence of humans in a particular room. Aside from its practical use, no contact with humans needed, it also helps to lower the electricity consumption and longer lifetime of the lightbulbs, which in turn translates into cost saving. The objective of this pilot project is to measure the level of reduction in electricity consumption and its correlation to the reduction of equivalent carbon emissions, with the expected benefit being energy efficiency and cost saving for the campus [4].
Joint Crediting Mechanism (JCM) is a bilateral cooperation between Japan and the host country in low carbon development implementation that intended to push Japanese private-sector companies to invest in Low Carbon Development activities in Indonesia, as a host country, by giving financial and technical incentives. JCM activities cover many sectoral scopes, including energy efficiency, renewable energy, deforestation and forest degradation, waste management, fugitive emission, and the manufacturing industry. Indonesia hopes that JCM can be an interesting alternative to support Greenhouse Gas (GHG) emissions reduction activities that are conducted by both Indonesia private and public sectors and support economic growth without overriding environmental sustainability. Until mid-2017, 109 feasibility studies have been undertaken under the cooperation between Japanese Company partnership with Indonesian private companies and central and local government. From the feasibility studies, both countries implement 28 JCM projects. Fifteen projects had been installed and the other 13 projects are still under construction. Total investment values of the 28 projects are 150 million USD. Figure 1 shows the JCM scheme between Indonesia and Japan where the Indonesian side that is able to reduce GHG emissions through measuring, reporting, and verification (MRV) is supported by the Japanese side [5].

2. Materials and Methods

2.1. Motion Detection

A motion detection algorithm begins with the segmentation part where foreground or moving objects are segmented from the background. The simplest way to implement this is to take an image as background and take the frames obtained at the time t, denoted by I(t) to compare with the background image denoted by B. Here, using simple arithmetic calculations, we can segment out the objects simply by using image subtraction technique of computer vision meaning for each pixel in I(t), take the pixel value denoted by P[I(t)] and subtract it with the corresponding pixels at the same position on the background image denoted as P[B]. In mathematical equation it is written as:
P[F(t)] = P[I(t)] − P[B]
where F refers to the foreground or resulted image after the computation at time t [6].
Analysis of human motion is currently one of the most active research topics in computer vision, in which the moving human body detection is the most important part of the human body motion analysis. The purpose is to detect the moving human body from the background image, and for the follow-up treatment such as the target classification, the human body tracking and behavior understanding, its effective detection plays a very important role. Human motion analysis concerns the detection, tracking and recognition of people behaviors. According to the result of moving object detection research on video sequences, Rakibe et al. [7] presents a new algorithm for detecting moving objects from a static background scene to detect moving objects based on background subtraction. Wibowo [8] explored the use of proximity sensor as human presence sensor in a room with analysis in the performance of the sensor, which works as heat detection. The discussion is limited to testing the response of the fabricated sensor.

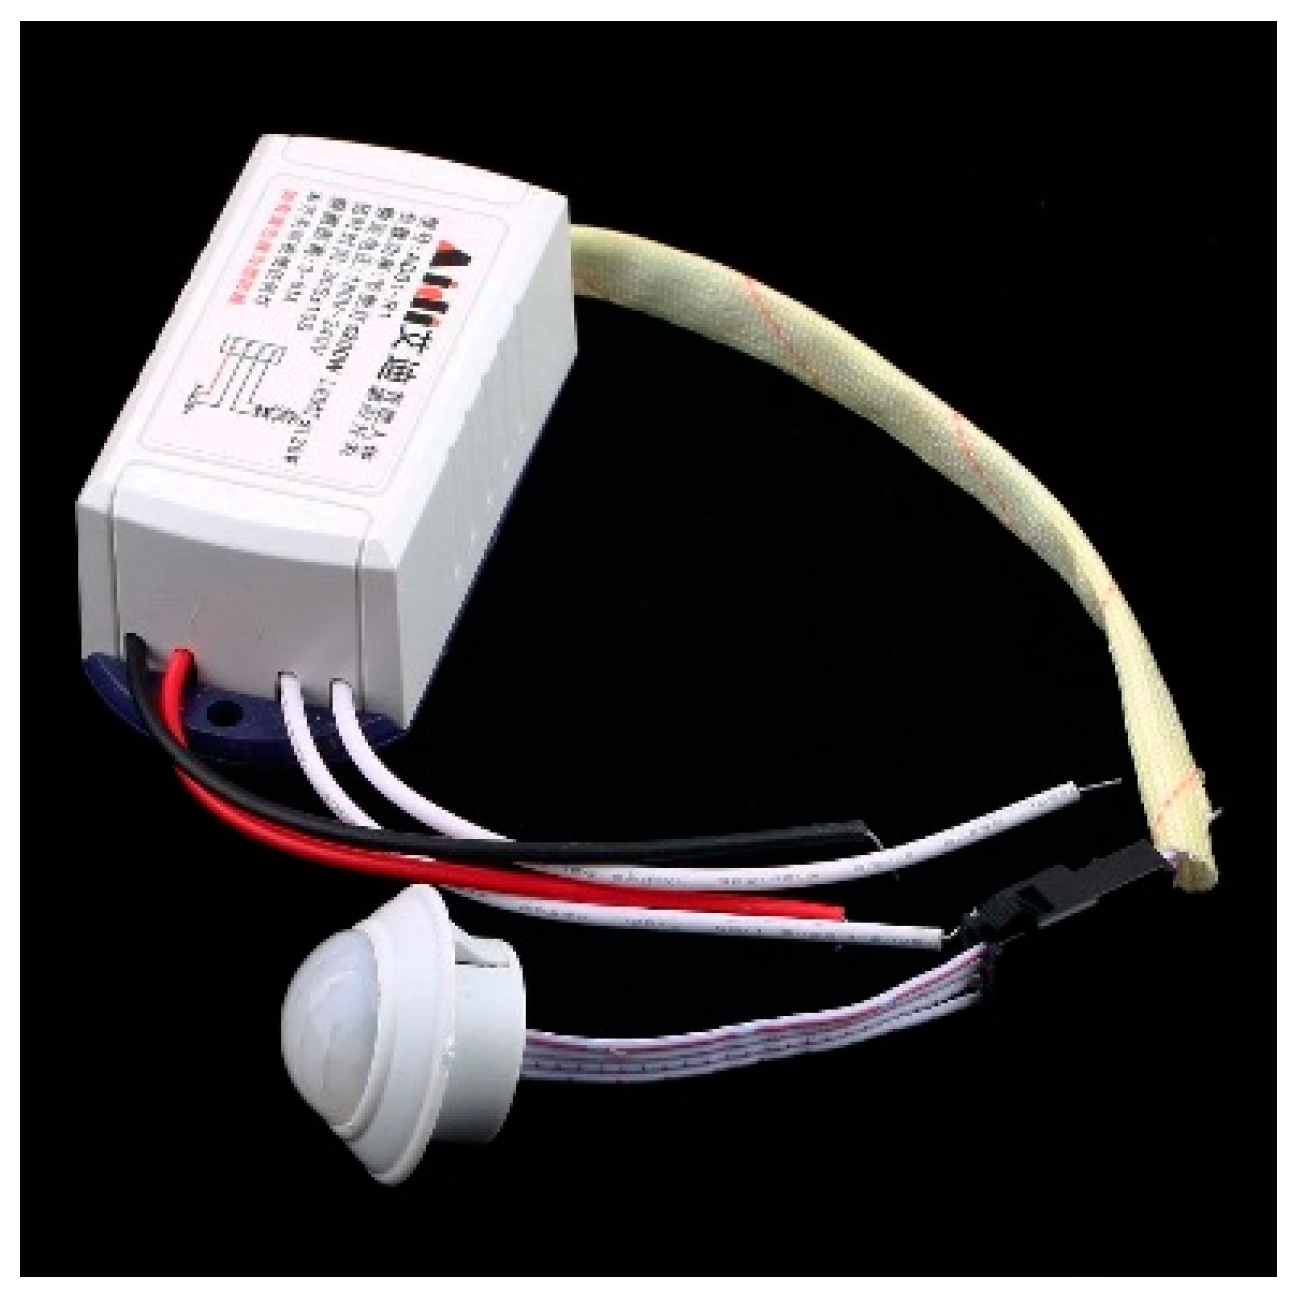
2.2. Passive Infrared Sensor

PIR (Passive Infrared Receiver) is an infrared-based sensor (Figure 2); as the name implies, “Passive” means the device does not emit any infrared radiation. This differentiates PIR devices from other IR-based devices such as IR LED and phototransistor [9]. PIR only responds to infrared radiation emitted by other objects within its detection sphere. The device usually detects human body temperature and/or movement. PIR sensors detect human presence by sensing the change of heat radiation caused by body movement, since the human body emits thermal radiation when moving due to energy metabolism to make muscle movement. PIR detects changes in infrared radiation and responds by releasing output voltage.

2.3. Related Research
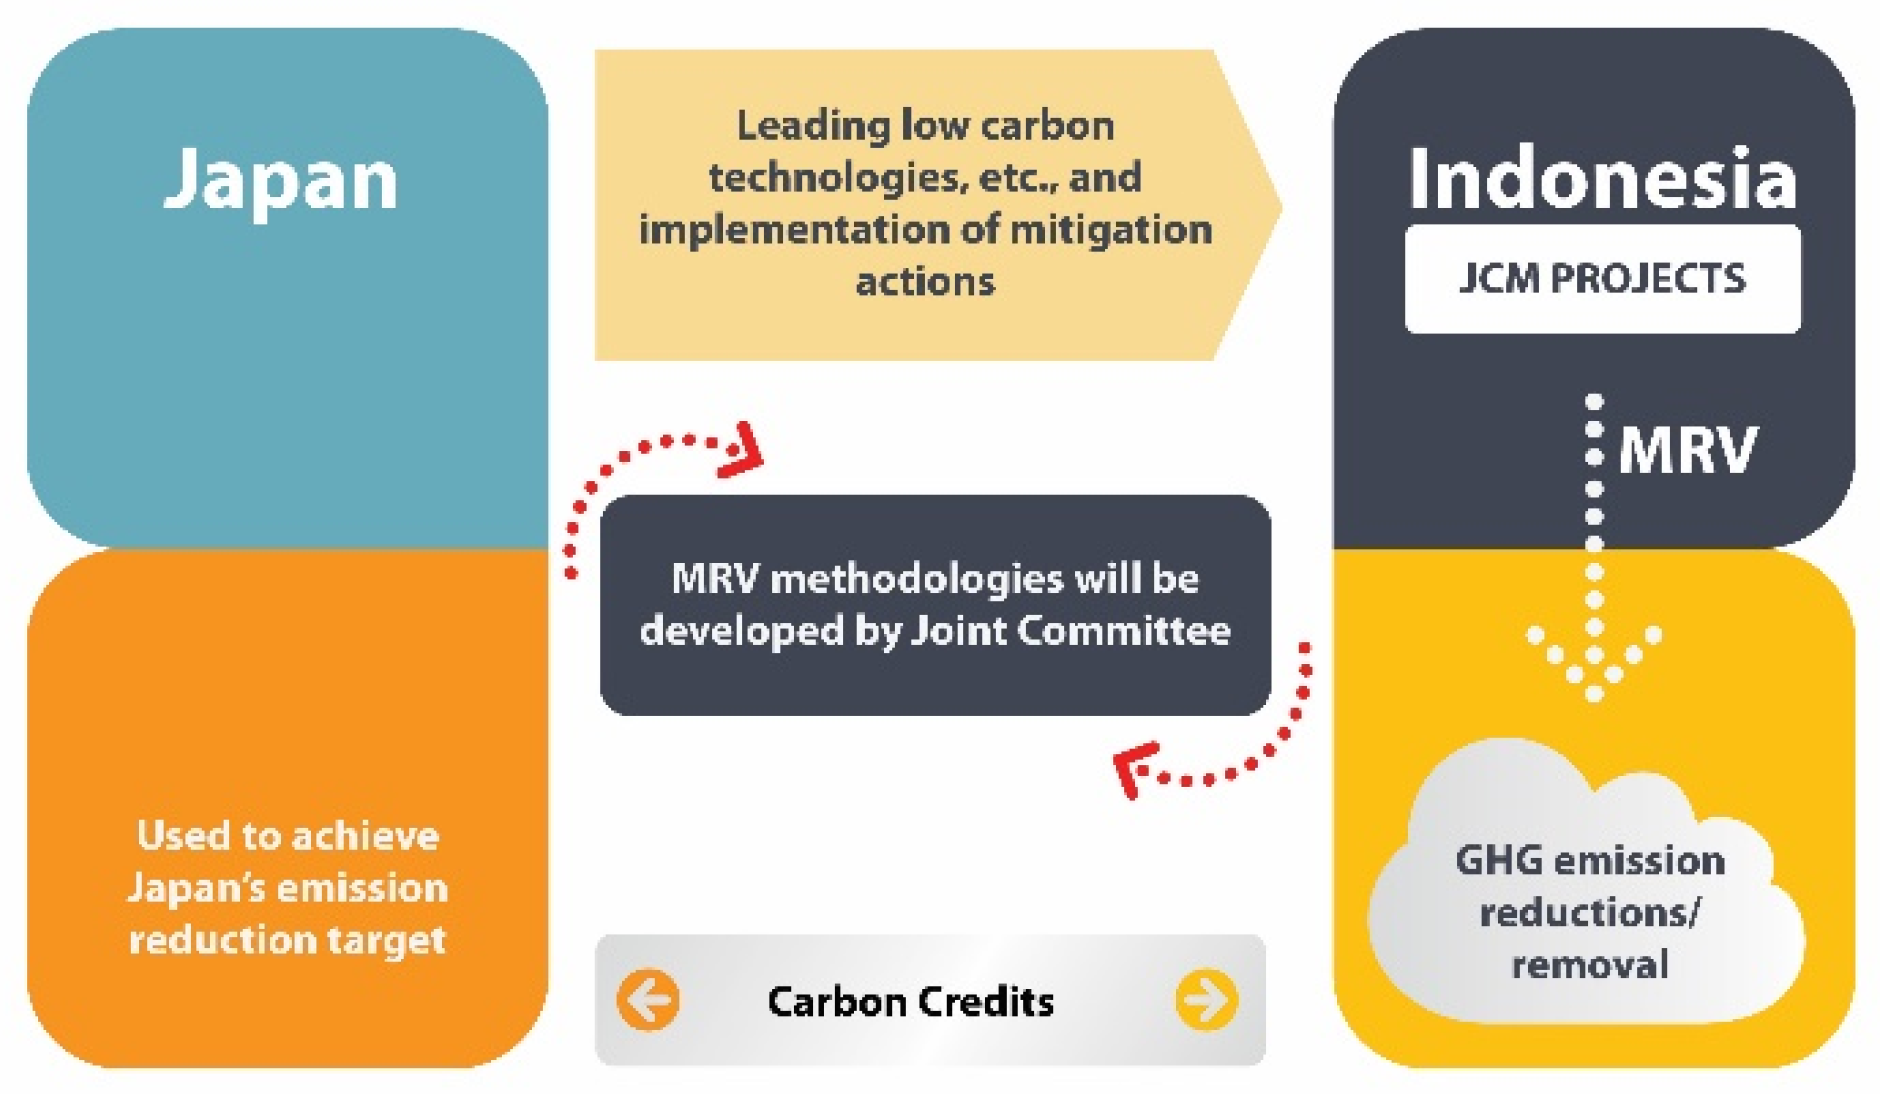
A simulation for lighting energy savings in office spaces was compared with actual consumption. Aside from installation of control systems, the simulation models the monthly consumption for several European cities [10], while our experiment deals with actual consumption in the equatorial region with relatively constant pattern. One research investigates the use of smart occupancy sensor which varies the time delay of the sensor to suit the various activities of the occupants. The experiment is set in a general room with work environment as indicated by the installation of sensor on a Personal Computer [11]. Our experiment uses the toilet room with varying occupancy duration, but of predictable duration for each occupant. Another research deals with the position of the occupant through the use of Wi-Fi and smartphone connection calculation, which is useful for workspace energy saving [12]. This project deals with simpler occupied-or-unoccupied rooms.

2.4. JCM Method

The JCM has several methods for GHG emission reduction; one of interest is JCM_ID_AM005, in which the method covers emission reduction in public buildings through the change of lighting from fluorescent to LED lights. The method of calculating GHG reduction is derived from the total power consumption and the CO2 emission factor [3].
REp = ECPJ,p × (ηPJ ÷ ηRE) × EFelec
PEp = ECPJ,p × EFelec
ERp = REpPEp
where:
REpReference emissions during the period p [tCO2/p]
ECPJ,pTotal power consumption of project lighting during the period p [MWh/p]
ηPJLuminous efficiency of project lighting [lm/W]
ηRELuminous efficiency of reference lighting [lm/W]
EFelecCO2 emission factor for consumed electricity [tCO2/MWh] for Java and Bali is 0.84
Similar calculation is also proposed by Gieseler [13] for calculating the additional investment cost for energy-efficient building but focusing on thermal insulation for temperate zone building.
Measurement method for the illuminance (lux) of the installed lighting is as follows:
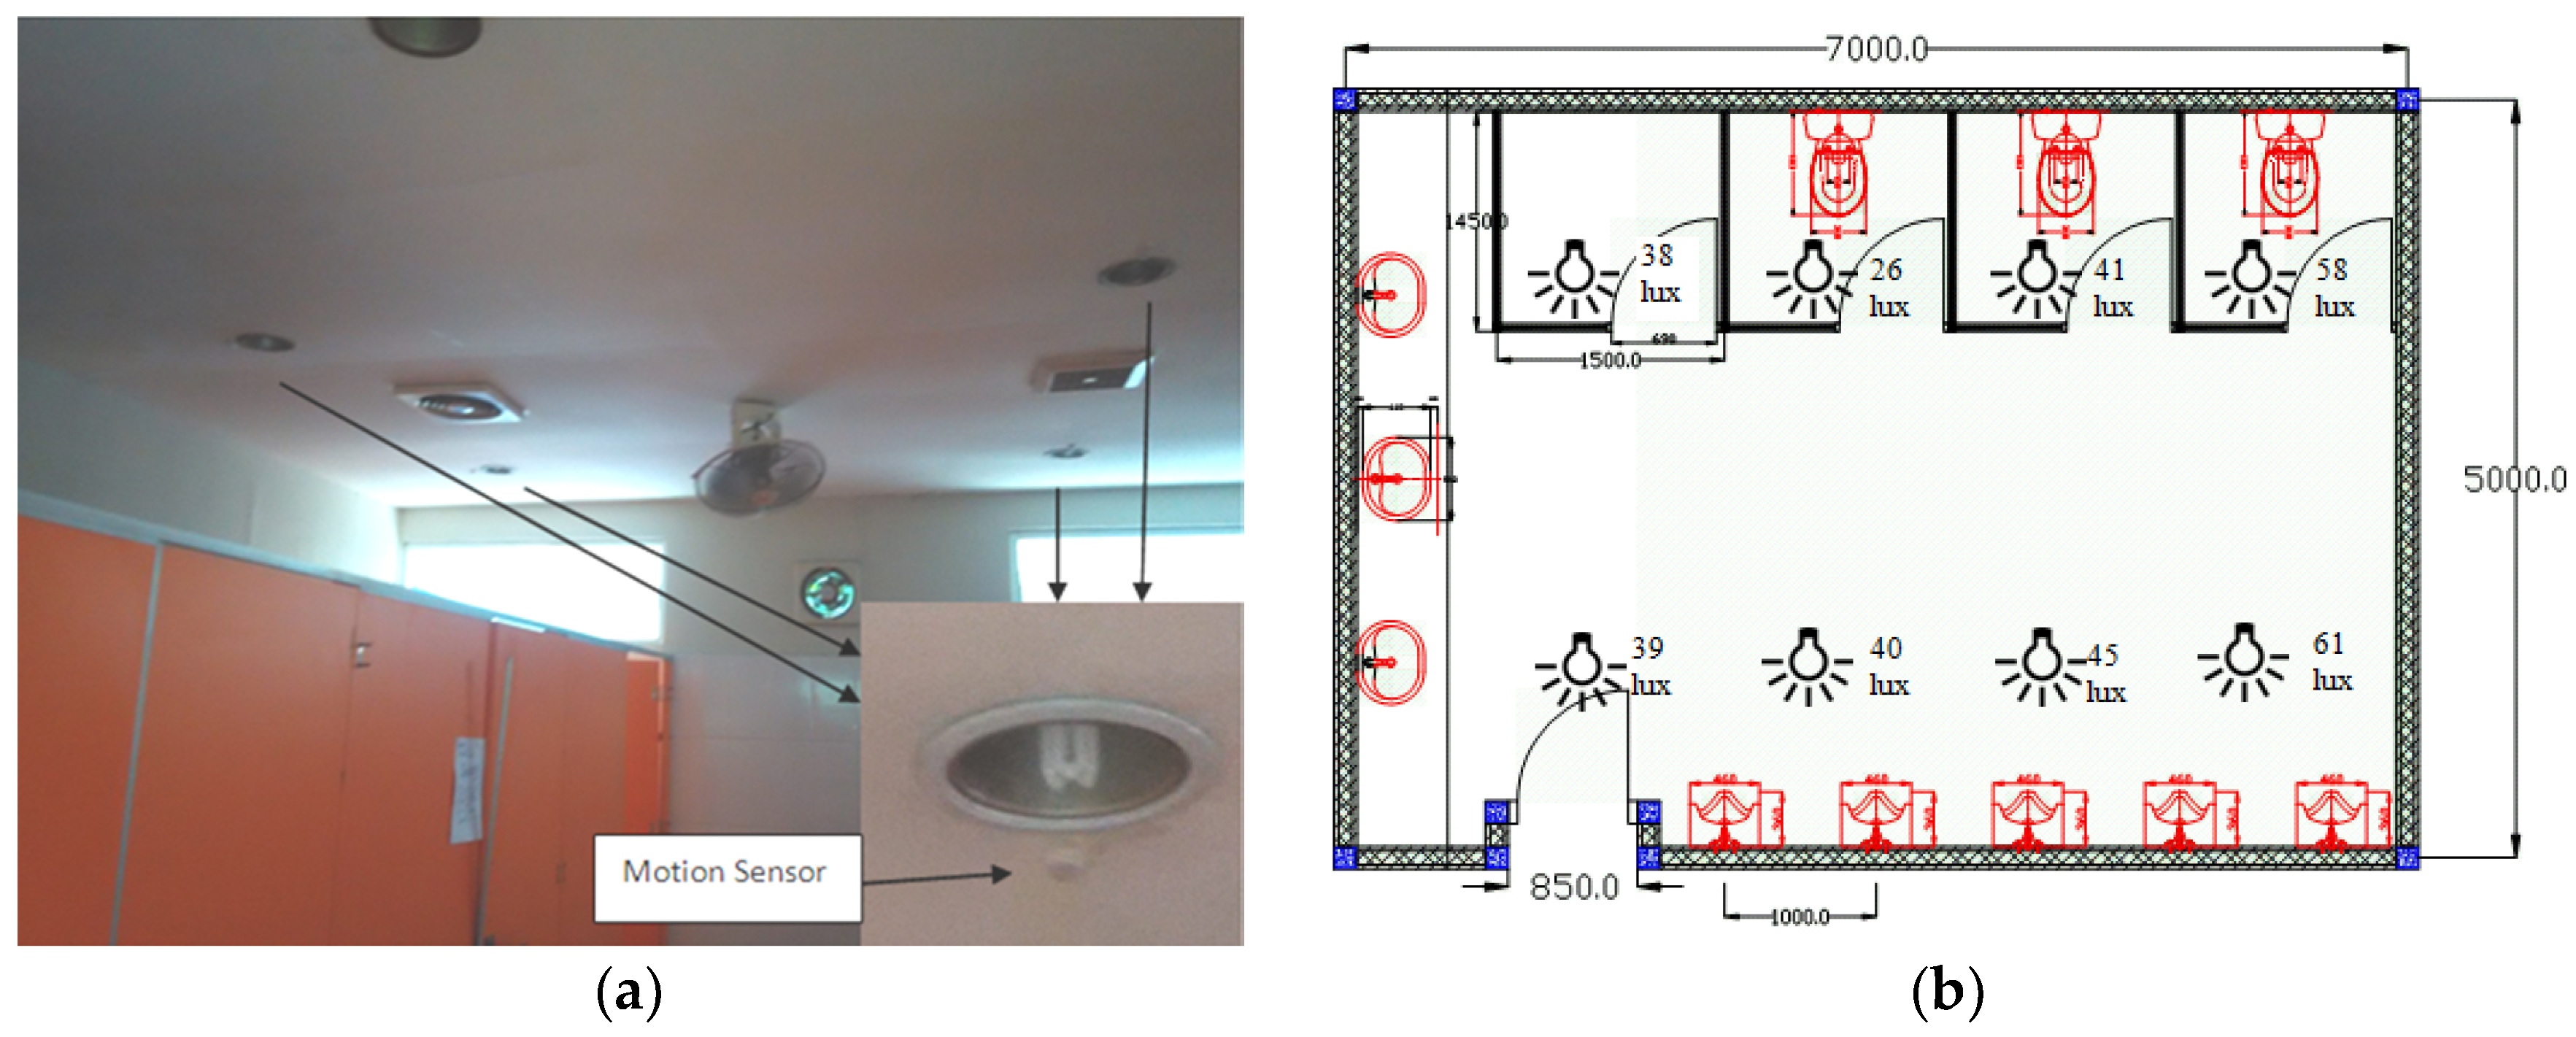
  • Equipment: Use lux meter which shows the readings of the measurement in illuminance. Record the model of the lux meter used for the measurement and its most recent record of the calibration;
  • Measurement points: Illuminance readings are taken under each light at the height of 1 meter above the floor.

3. Results

The electric equipment installed in the experiment room consisted of eight 23 W bulbs and six exhaust fans of 80 W each with daily operation of 14 hours from 7:00 a.m. to 21:00 p.m. Sensors are installed next to the lamp, as shown in Figure 3a. Measurement for the illuminance (lux) of the installed lighting uses lux meter placed under each lamp at a height of 1 m above the floor which shows the readings of the measurement in illuminance as shown in Figure 3b. Highest illuminance readings recorded are for under the lamps near the outside window, with lowest reading at the cubicle furthest away from both window and outside door. The accuracy of the lux meter is within ±6%. For each measurement, stable numerical values are obtained. At the time of measurement, the door of the restroom and room lighting is set to be as close as possible to the normal working condition.
Total power consumption is 664 Watt-hours, which translates into 0.664 kWh in one hour or 9.3 kWh/day, or on average 231 kWh/month and 2772 kWh annually. Baseline Measurement is taken and recorded with 7-hour interval up to 84 h equal to a 6-day week of operation. During this period, total electric power consumption is amounted to 55.576 kWh without the use of motion sensors [1]. Measurement for low usage period during the semester break, where usage is minimum, yields 20.229 kWh and with a carbon emission factor of 0.00785, calculation on the annual carbon reduction resulted from the use of motion sensors is 36 tons/year. Measurement for high usage period is taken during the first days of the new academic year, the busiest days where the maximum number of students are present to attend their first week of courses. Measurement taken in September with the same interval yields 38.854 kWh.
During measurement with sensors on Monday, 1 August 2016 at 8:00 a.m., with all lamps except ones near the toilet door being off and only the exhausts operating, the power meter reading shows 304.2 W and total consumption is 504.49 Wh. This reading is within reduction range after 1 h of operation (0.504 Wh vs 0.664 Wh). Measurement taken on Wednesday, 3 August 2016 at 14:30, after 35 h of operation, shows a 10.6 kWh of consumption versus 27.9 kWh for normal operation. The measurement data is shown in Table 1 and plotted in Figure 4. From Table 1, it can be seen that reduction to half of the normal consumption is achieved after 28 h. By the end of the week, the reduction reached 63.73%. As for high usage condition measurement starting from 5 September 2016, the saving for the first day (14-hour) operation yields only 18% reduction and by the end of the measurement period, the average saving is only slightly above 25%.

4. Discussion

With the installation of motion sensors for lighting, the expected reduction of monthly electricity energy consumption is between 30% and 40% lower compared to the one without sensors installation, with 30% reduction being for peak usage in the beginning of the first semester, and 40% for semester breaks. Base measurement yields power consumption of 55.576 kWh, with base electricity fare of 1.467,28 Rp/kWh; this costs Rp 327.356,04 per month or Rp 23.6 Million annually for just six restrooms only. This figure is constant for each month without modification to the electricity installation. From Table 1, the expected reduction of 40% is firmly achieved after 14 hours of operation, and after 28 hours, it only consumes half than without sensors for the same duration. The first phase of implementation on restrooms yields a cost saving of Rp 15 Million.
Annual CO2 emission equivalent for normal operation without sensor can be calculated as a product of electrical power consumption (664 Wh) and carbon factor coefficient (0.00785 kg/W [5]) which yield 1902.57 kg/year). With 10 restrooms, total CO2 emission amounts to 19.03 tons/year. For annual CO2 reduction, ERp must be factored by 60.83 [5], and the resulting annual reduction is 1.812 tCO2/MWh/year when implemented for all restrooms; projected contribution in reducing CO2 emission is calculated at 10.95 tons/year. With carbon credit pricing at USD 11.5 per tons of CO2 equivalent for energy efficiency [5], this project could potentially save another Rp 1.7 Million.
A further phase of implementation would include sensors installation on corridors, replacement of fluorescent lamps with LEDs, and rooftop Photo-voltaic Panels installation on all buildings, expected to reach the target of 150 tons of CO2 equivalent emission reduction. When the implementation is completed, this installation could be optimized by Building Information Modelling [14] and evaluated in the future by the use of Building Design Index and Building Operation Index [15].

Author Contributions

This project is initiated by Indra Riyanto and Lestari Margatama, cost analysis is performed by Martini and environmental aspect is by Hakim, with method and guidance provided by Dicky Edwin Hindarto.

Funding

This project is funded by Universitas Budi Luhur and supported by Yayasan Pendidikan Budi Luhur Çakti.

Conflicts of Interest

The authors declare no conflict of interest.

References

  1. Martini; Riyanto, I.; Adiyarta, K.; Suparmoko, M. An Effort to Lower Electricity Bill in University Building by Automatic Lighting Switches Application. Pertan. J. Soc. Sci. Human. 2018, 26, 11–19. [Google Scholar]
  2. Jansson, G.; Schade, J.; Olofsson, T. Requirements management for thedesign of energy efficient buildings. J. Inform. Technol. Constr. (ITcon) 2013, 18, 321–337. [Google Scholar]
  3. Pisello, A.L.; Bobker, M.; Cotana, F. A Building Energy Efficiency Optimization Method by Evaluating the Effective Thermal Zones Occupancy. Energies 2012, 5, 5257–5278. [Google Scholar] [CrossRef] [Green Version]
  4. Riyanto, I.; Margatama, L.; Suparmoko, M.; Martini; Hindarto, D.E. University Contribution in Developing Country on Carbon Emission Reduction through Motion Sensor Application Pilot Project on Building Lighting Installation. In Proceedings of the IEEE International Conference on Applied System Innovation, Chiba, Japan, 13–17 April 2018. [Google Scholar]
  5. JCM Indonesia Secretariat. Installation of LED Lighting for Grocery Store; Version 2.0; JCM Indonesia Secretariat: Jakarta, Indonesia, 2015.
  6. Sahu, A.K.; Choubey, A. Motion Detection Surveillance System Using Background Subtraction Algorithm. Int. J. Adv. Res. Comput. Sci. Manag. Stud. 2013, 1, 58–65. [Google Scholar]
  7. Rakibe, R.S.; Patil, B.D. Background Subtraction Algorithm Based Human Motion Detection. Int. J. Sci. Res. Publ. 2013, 3, 3–6. [Google Scholar]
  8. Wibowo, T. Sensor Kehadiran Orang Sebagai Saklar Otomatis Suatu Ruangan. Undergraduate Thesis, Universitas Diponegoro, Semarang, Indonesia, 2011. [Google Scholar]
  9. Coulson, D. ZMOTION™—A New PIR Motion Detection Architecture; Zilog, Inc.: Milpitas, CA, USA, 2010; No. WP001703-1110. [Google Scholar]
  10. Roisin, B.; Bodart, M.; Deneyer, A.; D’Herdt, P. Lighting Energy Savings in Offices Using Different Control Systems and Their Real Consumption. Energy Build. 2008, 40, 514–523. [Google Scholar] [CrossRef]
  11. Garg, V.; Bansal, N.K. Smart Occupancy Sensors to Reduce Energy Consumption. Energy Build. 2000, 32, 81–87. [Google Scholar] [CrossRef]
  12. Riyanto, I.; Akbar, Y.M. Local Area Positioning System (LAPS) for Indoor Navigation and Tracking System and Building Electricity Energy Saving. Int. J. Simul. Syst. Sci. Technol. 2016, 17, 101–107. [Google Scholar]
  13. Gieseler, U.D.J.; Heidt, F.D.; Bier, W. Evaluation of The Cost Efficiency of an Energy Efficient Building. Renew. Energy J. 2004, 29, 369–376. [Google Scholar] [CrossRef]
  14. Petri, I.; Kubicki, S.; Rezgui, Y.; Guerriero, A.; Li, H. Optimizing Energy Efficiency in Operating Built Environment Assets through Building Information Modeling: A Case Study. Energies 2017, 10, 1167. [Google Scholar] [CrossRef]
  15. Treado, S.; Chen, Y. Saving Building Energy through Advanced Control Strategies. Energies 2013, 6, 4769–4785. [Google Scholar] [CrossRef] [Green Version]
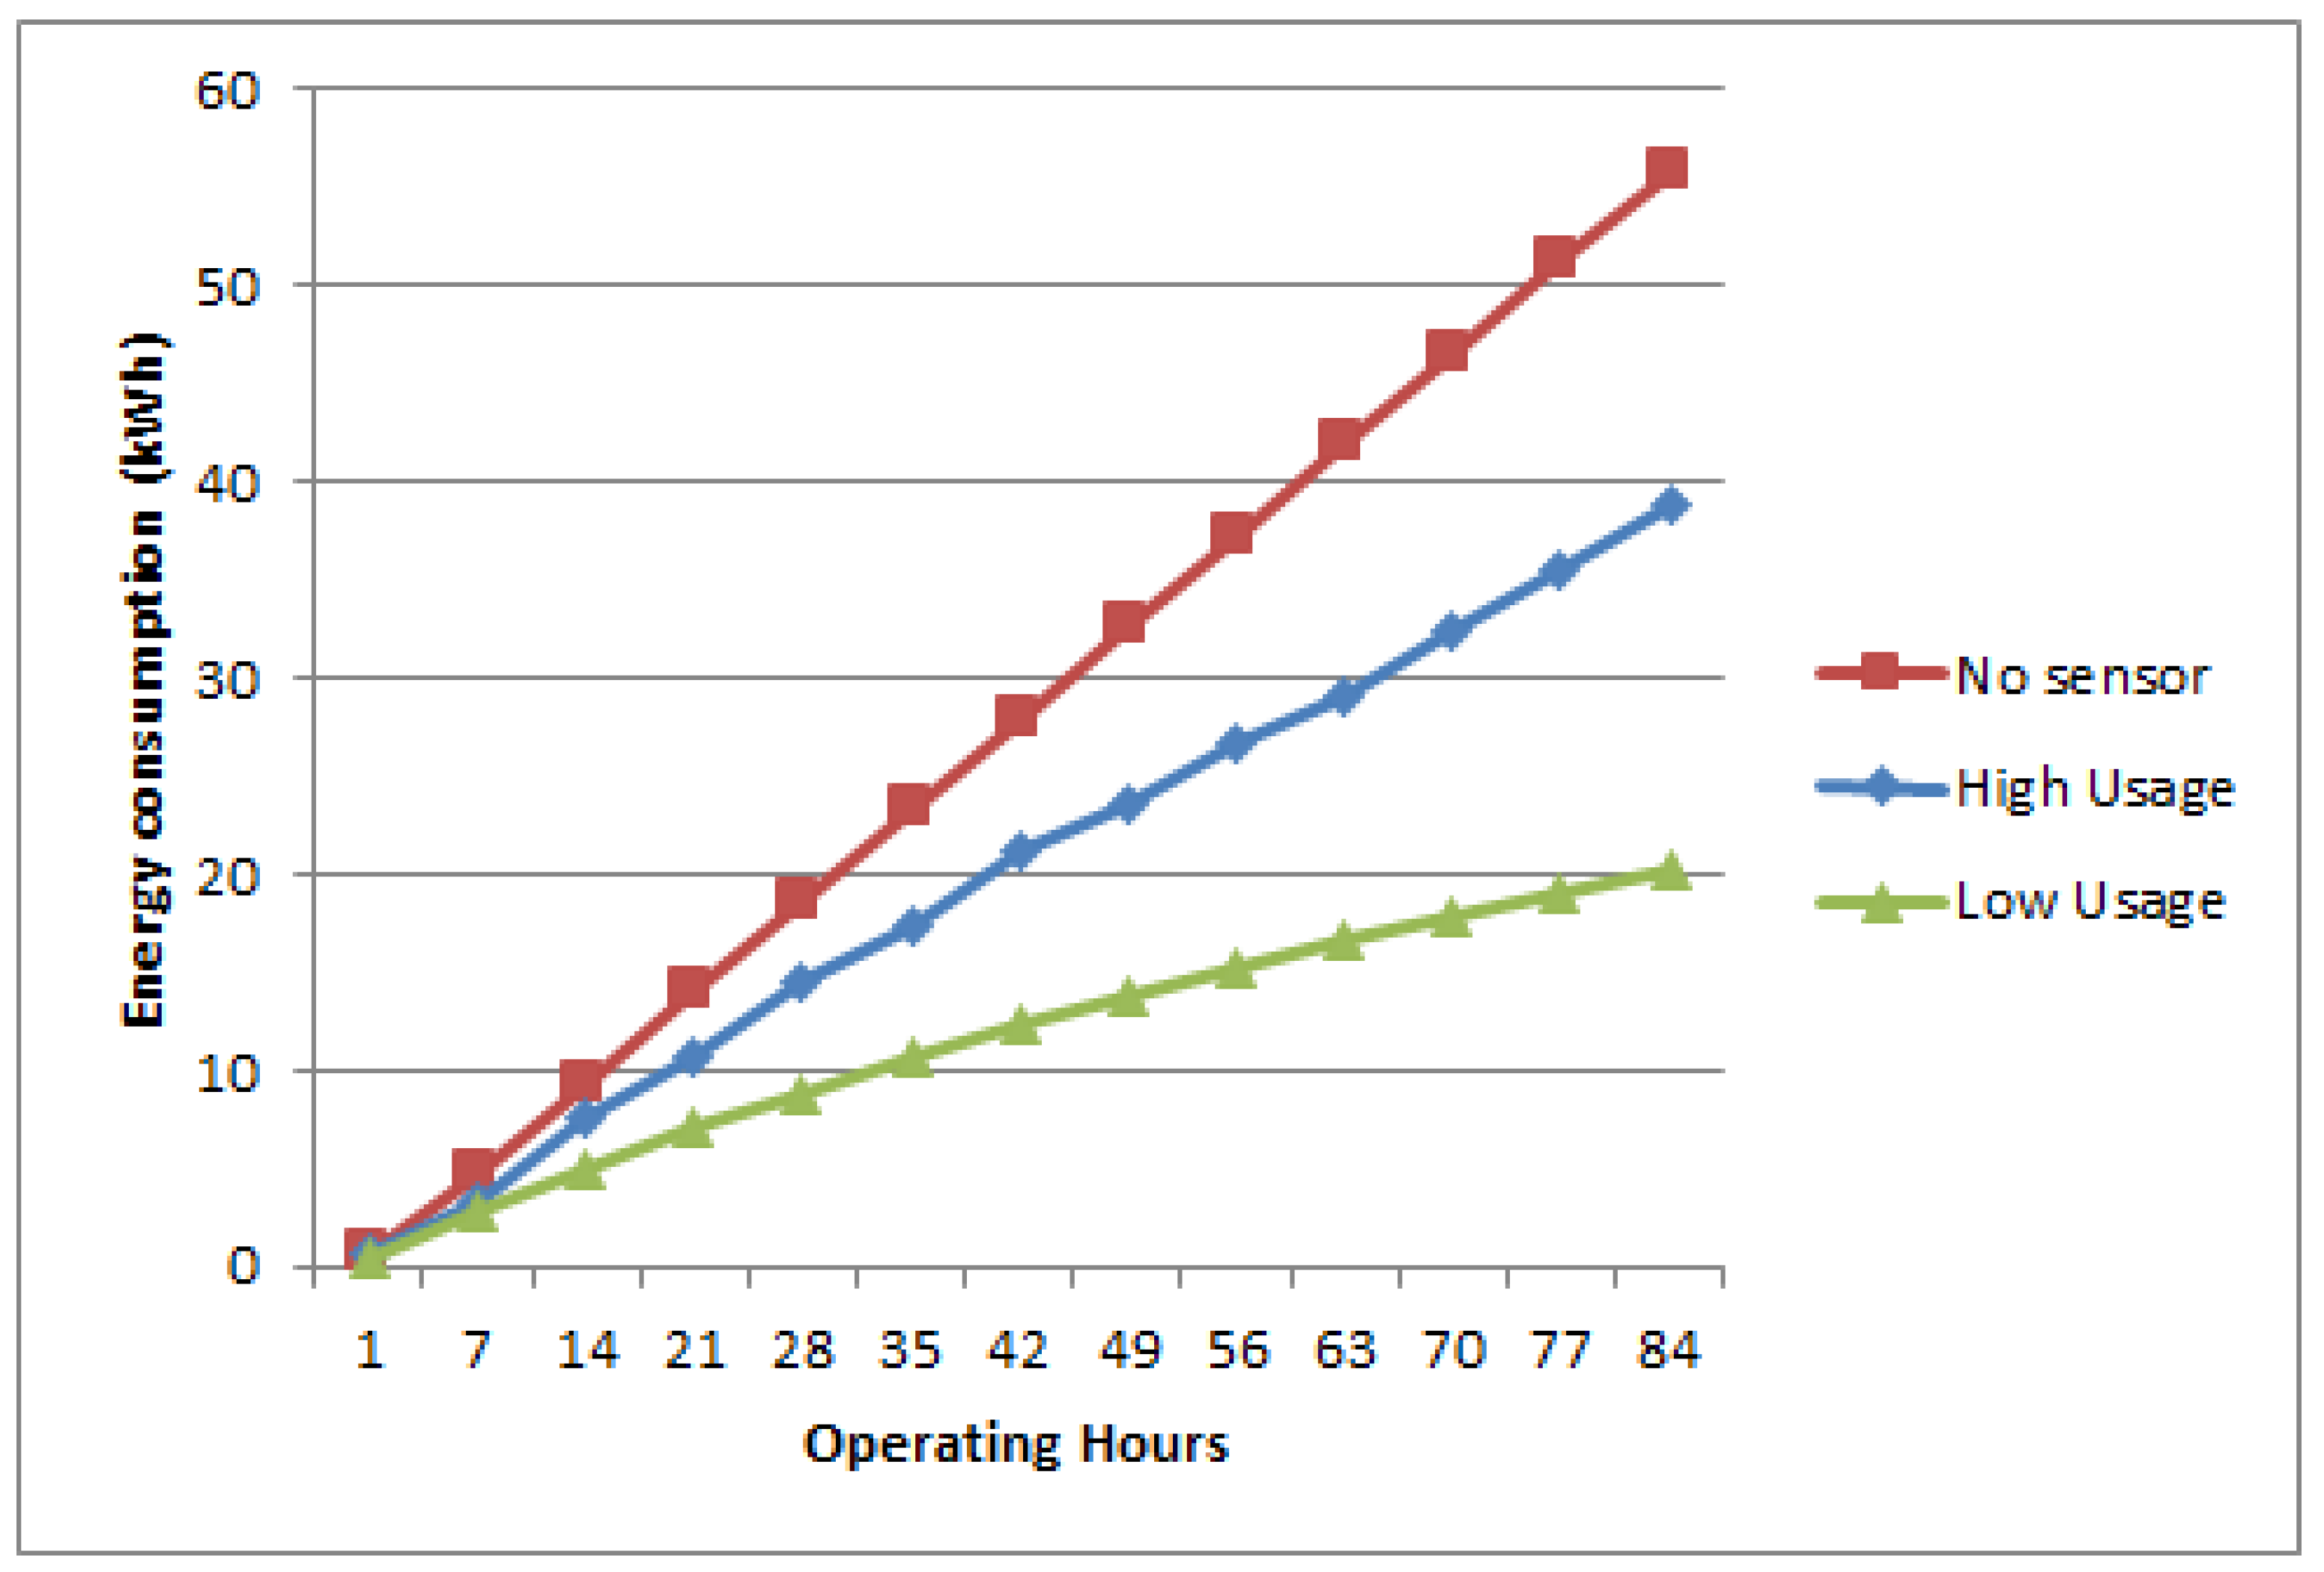
Figure 1. Joint Crediting Mechanism Scheme.
Asi 01 00023 g001
Figure 2. PIR-based motion sensor switch, the type used in this project [1].
Asi 01 00023 g002
Figure 3. (a) Motion sensor installation next to each lamp; (b) Illumination measurement for points under each individual lamp; the ones with higher illuminance are near the window, showing a significant difference, with the darkest point being the one furthest away from the window and outside door.
Asi 01 00023 g003
Figure 4. Power measurement comparison graph.
Asi 01 00023 g004
Table 1. Power consumption data comparison without sensor installation and after the sensors installation [1].
Duration (hours)Electrical Power (kWh)Energy Reduction (%)
With SensorWithout Sensor
0.5040.66424.10
72.7114.64841.67
145.0589.29645.59
217.15813.94448.66
288.89018.59252.18
3510.62223.2454.29
4212.26427.88856.02
4913.81632.53657.54
5615.27837.18458.91
6316.65141.83260.20
7017.93346.4861.42
7719.12651.12862.59
8420.22955.77663.73

