


Theoretical and Experimental Determinations of the Hydrophilic–Lipophilic Balance (HLB) of Representative Oils and Lecithins

Pressure Biosciences, Canton, MA 02021, USA
*
Author to whom correspondence should be addressed.
Colloids Interfaces 2024, 8(2), 21; https://doi.org/10.3390/colloids8020021
Submission received: 14 June 2023
/
Revised: 26 February 2024
/
Accepted: 27 February 2024
/
Published: 16 March 2024
(This article belongs to the Special Issue Recent Advances on Emulsions and Applications: Volume II)
Abstract
:The hydrophilic–lipophilic balance (HLB) is a valuable parameter used to determine the relative hydrophobicity of a compound based on its chemical structure. This semi-empirical parameter has been instrumental in formulating oil-in-water and water-in-oil emulsions using well-characterized ingredients with known HLB values. However, recent trends toward the use of minimally processed “virgin” oils of therapeutic or nutritional value may render the reported “required HLB” values inaccurate. Minimally processed oils can contain numerous compounds at varying or unknown concentrations, rendering the HLB value incalculable. Factors such as regional source, growing season, and processing method contribute to the variability in oil composition. Furthermore, the solubilization of lipophilic bioactives in oils can significantly alter the HLB of the oil phase in a concentration-dependent manner. This complicates the formulation of emulsions, as the HLB values of both the oil phase and emulsifiers must be closely matched to achieve stable formulations. This study presents a simple and efficient experimental method to determine an HLB value of a complex ingredient without resorting to lengthy Design-of-Experiment (DoE) matrices and trial-and-error approaches. The optimal HLB of a formulation can be determined from a series of experiments in which two well-characterized surfactants of known HLB values are mixed at varying proportions with an unknown oil phase, where the HLB of the oil is considered to match the HLB value of the surfactants combined at the proportion at which nanoemulsions with the smallest, most stable oil droplets are formed. Similarly, when the HLB values of the oil phase and other contributing components are precisely known, the unknown HLB of a complex natural surfactant can be calculated. These calculations assist in formulating emulsions efficiently and effectively by ensuring optimal compatibility among all the components.
1. Introduction
Emulsions may be self-assembling or may be driven to form nanodispersions by intense fluid shear forces in high energy processes. Some emulsions exhibit instability analogous to familiar oil and vinegar mixtures, where very large and unstable oil droplets are transiently formed in water, but they rapidly separate into oil and water phases when left undisturbed. The stability of lipid droplets is energetically favored when the energy required for phase separation is greater than the energy needed for the oil to exist as droplets [1,2]. The stability of small oil droplets dispersed in an aqueous phase relies on the arrangement of amphiphilic surfactants on droplet surfaces, which in turn alters the interfacial tension and repulsion between droplets.
When the HLB value of the surfactant(s) closely matches the HLB value of the oil, the surfactant molecules will be packed more tightly at the oil–water interface, leading to increased repulsion between oil droplets [3]. The surfactant-to-oil ratio (SOR) is also of fundamental importance to droplet size and stability [4,5]. An increased SOR has been correlated to decreased oil droplet size [6,7]. Higher concentrations of surfactants may be necessary to stabilize nanoemulsions compared to macroemulsions since the collective surface area of the smaller, more numerous oil droplets is greater. Maximum adsorption of surfactant molecules at the oil–water interface is ensured when an excess of surfactant is provided. This surfactant “pool” will exist as monomers and micelles (and mixed micelles if more than one surfactant is included), the proportions of which are defined by the critical micelle concentration (CMC) of each surfactant. A correlation between surfactant CMC and HLB has been demonstrated [8].
HLB is a calculable value based on known chemical structure that enables pure compounds to be ranked according to their relative hydrophobicity. It is similar to the partition coefficient logP, which experimentally measures the partitioning of a given molecule between two immiscible solvents but does not necessarily provide insights into the interplay of oils and surfactants. The concept of HLB was originally described by Griffin [9,10] and later refined by Davies [11], but the two methods described by these authors may yield significantly different HLB values for some molecules. For example, HLB values of 3.7 and 1.0 are calculated for alpha tocopherol using the equations of Griffin and Davies, respectively. HLB closely resembles the inorganic–organic balance (IOB) system, which also scores compounds according to their chemical structure [12].
Recently, a hydrophilic–lipophilic deviation (HLD), also known as the hydrophilic–lipophilic difference, was devised, which considers the influence of other variables such as the alkane carbon numbers of the oil and surfactant, ionic strength, pressure, and temperature on the phase behavior of the mixed components [13,14,15]. The characteristic curvature value (Cc) of a surfactant (where higher values are more hydrophobic) is weighed against the equivalent alkane carbon number of the oil, ionic strength, and temperature in the HLD equation [16]. The Cc values of several ionic surfactants have been shown to correlate with HLB [17]. While the HLD system may approach characterizing behavior of several model systems more accurately, the industry has yet to widely adopt this method; therefore, most manufacturers of oils and other reagents that report HLB typically rely on Griffin or Davies values, often not even specifying which scale is being used.
While calculated HLB values based solely on chemical structure may be considered hypothetical and are sometimes criticized [16], experimentally determined “actual” HLB values are expected to summarize the combined effect of multiple parameters defining HLD but in much more practical terms.
The required HLB (rHLB) of many refined oils and surfactants has been determined experimentally. However, the composition of refined plant oils and their unrefined counterparts may be highly variable, depending on their country of origin, growing season, and processing [18]. Further, some oils are more susceptible to oxidation and rancidification than others, and the prophylactic inclusion of lipid-soluble antioxidants such as tocopherols and ascorbyl esters can render rHLB values inaccurate. Likewise, the addition of glycerol as a viscosity modifier and cryoprotectant has been shown to measurably affect the HLB of formulations [19].
In general, the HLBs of a bioactive and a carrier oil do not need to be precisely matched, provided the bioactive is adequately solubilized in the selected oil. Therefore, there may be some latitude in the selection of the oil, and a bioactive can often be dissolved in any one of several oils over a relatively broad HLB range. For example, when the ascorbyl ester tetrahexyldecyl ascorbate (Griffin HLB = 2.5) is dissolved in argan oil (HLB = 11.0) at a 1:1 mass ratio, the HLB of the resulting “hybrid” oil phase shifts to 6.75. Therefore, the determination of the HLB of the new oil phase becomes of critical importance in guiding surfactant selection. Thus, the rHLB of an oil will be of limited use when the HLB of the bioactive or other additive is unknown and cannot be accurately calculated. An experimental approach for the determination of the HLB value of complex natural extracts or mixtures of multiple ingredients for which a theoretical HLB value cannot be easily calculated would be of significant value for the formulation of stable emulsions.
The HLB of a formulation can be determined from a relatively simple series of experiments in which two well-characterized surfactants of known HLB are admixed at different ratios to empirically optimize the formulation in terms of oil droplet size and stability. Physical measurement of the relative degree of phase separation following centrifugation is commonly used to estimate the HLB of the oils [20,21] and to screen formulations to optimize oil, surfactant, and cosurfactant concentrations. If a stable emulsion is not formed, as indicated by phase separation, then the HLB value determined from the data may be inaccurate.
The HLB of a ternary system () can be derived from the sum of the products of HLB and mass fraction for each of the individual components (the oil and two or more surfactants) where these values are known.
where h designates the HLB of the oil () and surfactants ( and ), and where represents their weight fractions, respectively.
Where the HLB of two combined components is known (), the unknown HLB of a third component can be calculated using the equation below.
Likewise, the unknown HLB of a surfactant can be determined where the HLBs of the oil and a second surfactant are precisely known.
Lecithins represent a diverse class of natural phospholipid emulsifiers widely used in pharmaceutical, nutraceutical, and food and beverage emulsions. They range from crude lecithin preparations (low HLB) to highly specialized fractions enriched for specific phospholipids (medium HLB) and lysolecithins produced by the enzymatic removal of one of the two fatty acids of the phospholipids (high HLB). These are valuable reagents suitable as primary emulsifiers and as co-emulsifiers for adjusting the HLB of the surfactants to match that of the oil phase while providing organoleptic plant-based alternatives to synthetic surfactants [22]. The lysolecithin P-LPC-80 contains a minimum of 80% lysophosphatidylcholine and has a reported HLB value in the 9–12 range [23].
The goal of this study was to develop a method for the experimental determination of accurate HLB values of complex or poorly characterized compounds using a minimal number of experiments coupled with a mathematical interpolation to determine the most optimal formulation. HLB values of three representative oil phases were determined using the approach described herein. The method was validated using well-characterized surfactants in which the results closely agreed with previously reported values. In addition, the previously unknown HLBs of three surfactants were empirically determined.
2. Materials and Methods
2.1. Materials
Astaxanthin algal oleoresin (AsX-AO) was purchased from Astareal (Moses Lake, WA, USA). Organic argan oil, virgin black cumin seed oil, and virgin hemp seed oil were obtained from Jedwards International (Braintree, MA, USA). Krill oil was purchased from Aker Biomarine ASA (Lysaker, Norway). Alcolec S, Phospholipon 85G, and P-LPC-80 lecithins were obtained from American Lecithin Company (Oxford, CT, USA). Reagent-grade Polysorbate 20 (PS20) and Span 80 were derived from Millipore-Sigma (Burlington, MA, USA). Food-grade Polysorbate 80 (PS80) was obtained from Lab Alley Essential Chemicals (Spicewood, TX, USA). CellPro disposable sterile filtration flasks with 220 nm pore size polyethylsulfone membranes were derived from Alkali Scientific (Fort Lauderdale, FL, USA).
2.2. Nanoemulsions Prepared by Ultra-High-Pressure Homogenization
Oil phases were held constant at 10% (w/w) of the final formulation while varying the mass ratio of the surfactant to cosurfactant to adjust the HLB of the system over a broad range. Unless otherwise specified, the SOR was 1.0. Coarse emulsions were prepared using an Omni TH115 rotor-stator homogenizer (Omni International, Kennesaw, GA, USA). The oil phase was blended with surfactants and water at 35,000 rpm for two minutes. The coarse emulsion was then immediately processed by the UltraShear Technology™ (UST) high-pressure homogenizer (Pressure Biosciences, South Easton, MA, USA) at 45,000 psi for 10 consecutive passes, as previously described [24,25], to generate stable nanoemulsions. Mean droplet size was measured after each pass through the UST homogenizer.
2.3. Analysis
Oil droplet size and polydispersity of the nanoemulsions were determined by dynamic light scattering (DLS) measured 30 times at 10 s acquisition time for each measurement in a Wyatt Technology DynaPro Nanostar (Waters Corporation, Santa Barbara, CA, USA). Samples were diluted 1:100 in water, and light scattering was measured at three different laser power settings. Oil droplet size was expressed as the mean hydrodynamic diameter (Dh). Polydispersity was expressed as the polydispersity index (PDI).
Oil droplets formed in coarse emulsions were too large and too polydisperse to be reliably sized by DLS; therefore, coarse emulsions were analyzed by phase contrast microscopy using an etched glass hemocytometer (Hausser Scientific, Horsham, PA, USA). Size distribution was determined using the ImageJ version 1.54 image analysis software (National Institutes of Health, Bethesda, MI, USA) [26].
Sample turbidity was quantified by UV/Vis spectrophotometry in a BioTek TS 800 microplate reader (Agilent Technologies, Santa Clara, CA, USA) by following visible light absorbance at a wavelength of 595 nm.
2.4. Mathematical Basis for Calculation of Theoretical HLB
Polynomial regression analysis was used to determine the correlation coefficient (r2) for each data series. Both symmetrical and asymmetrical hyperboles were observed. The local minimum (the HLB where the smallest droplet size occurs) was derived by interpolation of the best fit polynomial equation using the Local Minimum Calculator from Wolfran-Alpha Computational Intelligence (Champain, IL, USA).
2.5. Stability Studies
For long-term stability studies, filter-sterilized nanoemulsions were stored protected from light at 4 °C and 20 °C for up to 36 months. There was no measurable difference in droplet size, polydispersity, or clarity before or after filter sterilization, as confirmed by DLS and UV/Vis spectrophotometry.
3. Results and Discussion
3.1. Coarse Emulsions
Coarse emulsions prepared by rotor-stator homogenization formed very large oil droplets over a broad size distribution that were prone to phase separation within hours. Mean oil droplet size was 5.2 ± 4.2 microns (CV = 0.802, n = 419) in AsX-AO coarse emulsions (Figure 1A). Droplet size distribution in coarse emulsions varied according to the characters of the oil and surfactants and their relative concentrations. For example, the oil droplet size distribution was 13.0 ± 4.4 microns (CV = 0.340, n = 355) in argan oil coarse emulsions and 17.3 ± 7.3 microns (CV = 0.442, n = 274) in krill oil coarse emulsions.
3.2. Nanoemulsions Prepared by Ultra-High-Pressure Homogenization
The UST high-pressure homogenizer exerts intense fluid shear on coarse emulsions as they are extruded through a self-throttling annular nanoscale aperture, resulting in rapidly diminishing oil droplet size that decreases incrementally with each successive product passage through the UST homogenizer [24]. The measurement of mean oil droplet size by DLS showed a linear reduction in size with each additional pass, typically showing an inflection in reduction rate after four passes and reaching a minimum droplet size after 8–10 passes. For example, the oil droplet size of AsX-AO coarse emulsion decreased to 211.5 ± 5.9 nm (CV = 0.028, PDI = 0.329) following a single pass through the UST valve and reached 91.8 ± 1.8 nm (CV = 0.020, PDI = 0.321) following four UST passes (Figure 1B).
3.3. Experimental and Theoretical Determinations of HLB
3.3.1. Validation of the Method
The method was validated from a series of 10% argan oil nanoemulsions containing two well-characterized surfactants, PS20 (HLB = 16.7) and Span 80 (HLB = 4.3), mixed in various proportions over the HLB 8–13 range. The SOR was 1.0. The smallest droplet size of 71.1 ± 3.4 nm (CV = 0.048, PDI = 0.161) was observed in 10% argan oil, 5.5% PS20, and 4.5% Span 80 corresponding to an HLB value of 11.12 (Figure 2). Interpolation of the best fit polynomial regression line (r2 = 0.968, n = 11) predicted a local minimum at HLB 11.19. These values were in very close agreement with the reported HLB value of 11.0 for argan oil [27].
3.3.2. Determination of Alcolec S HLB
Alcolec S is a food-grade liquid lecithin of variable composition ranging from 14 to 16% phosphatidylcholine, 10 to 15% phosphatidylethanolamine, 10 to 15% phosphatidylinositol, 5 to 12% phosphatidic acid, and 37% triglycerides. It is the precursor to Alcolec F-100, a granular lecithin in which the triglycerides are removed, increasing the phospholipid concentration nearly 1.5 times. The manufacturer reports the HLBs of Alcolec S and F100 as 4.0 and 7.0, respectively [28].
The HLB of Alcolec S was determined experimentally from a series of 10% argan oil nanoemulsions containing Alcolec S and PS20 mixed in various proportions over the HLB 9–13 range. The SOR was 0.9. Oil droplet size was measured by DLS following each UST cycle for 10 passes. The smallest oil droplet size of 53.6 ± 0.6 nm (CV = 0.011, PDI = 0.243) was observed in 10% argan oil nanoemulsion containing 4.3% PS20 and 4.8% Alcolec S, where the HLB of Alcolec S was unknown (Figure 3A). From these data, an HLB value of 6.08 was determined for Alcolec S using Equation (2) and confirmed by Equation (1) (Figure 3B). Polynomial regression analysis of these data (r2 = 0.931, n = 12) predicted a local minimum occurring at HLB 11.11, consistent with the experimental value determined for the argan oil. In reasonable agreement, an HLB value of 6.8 was determined for Alcolec S using the equation of Otto et al. [23], in contrast to the value of 4.0 reported by the manufacturer.
3.3.3. Determination of Black Cumin Seed Oil HLB
Most plant oils have HLBs in the 6–8 range. Black cumin seed oil (BCSO) is an edible oil with an exceptionally high reported HLB of 16.0 [29] and antimicrobial activity due to its content of thymoquinone, the same active ingredient found in thyme oil [30,31].
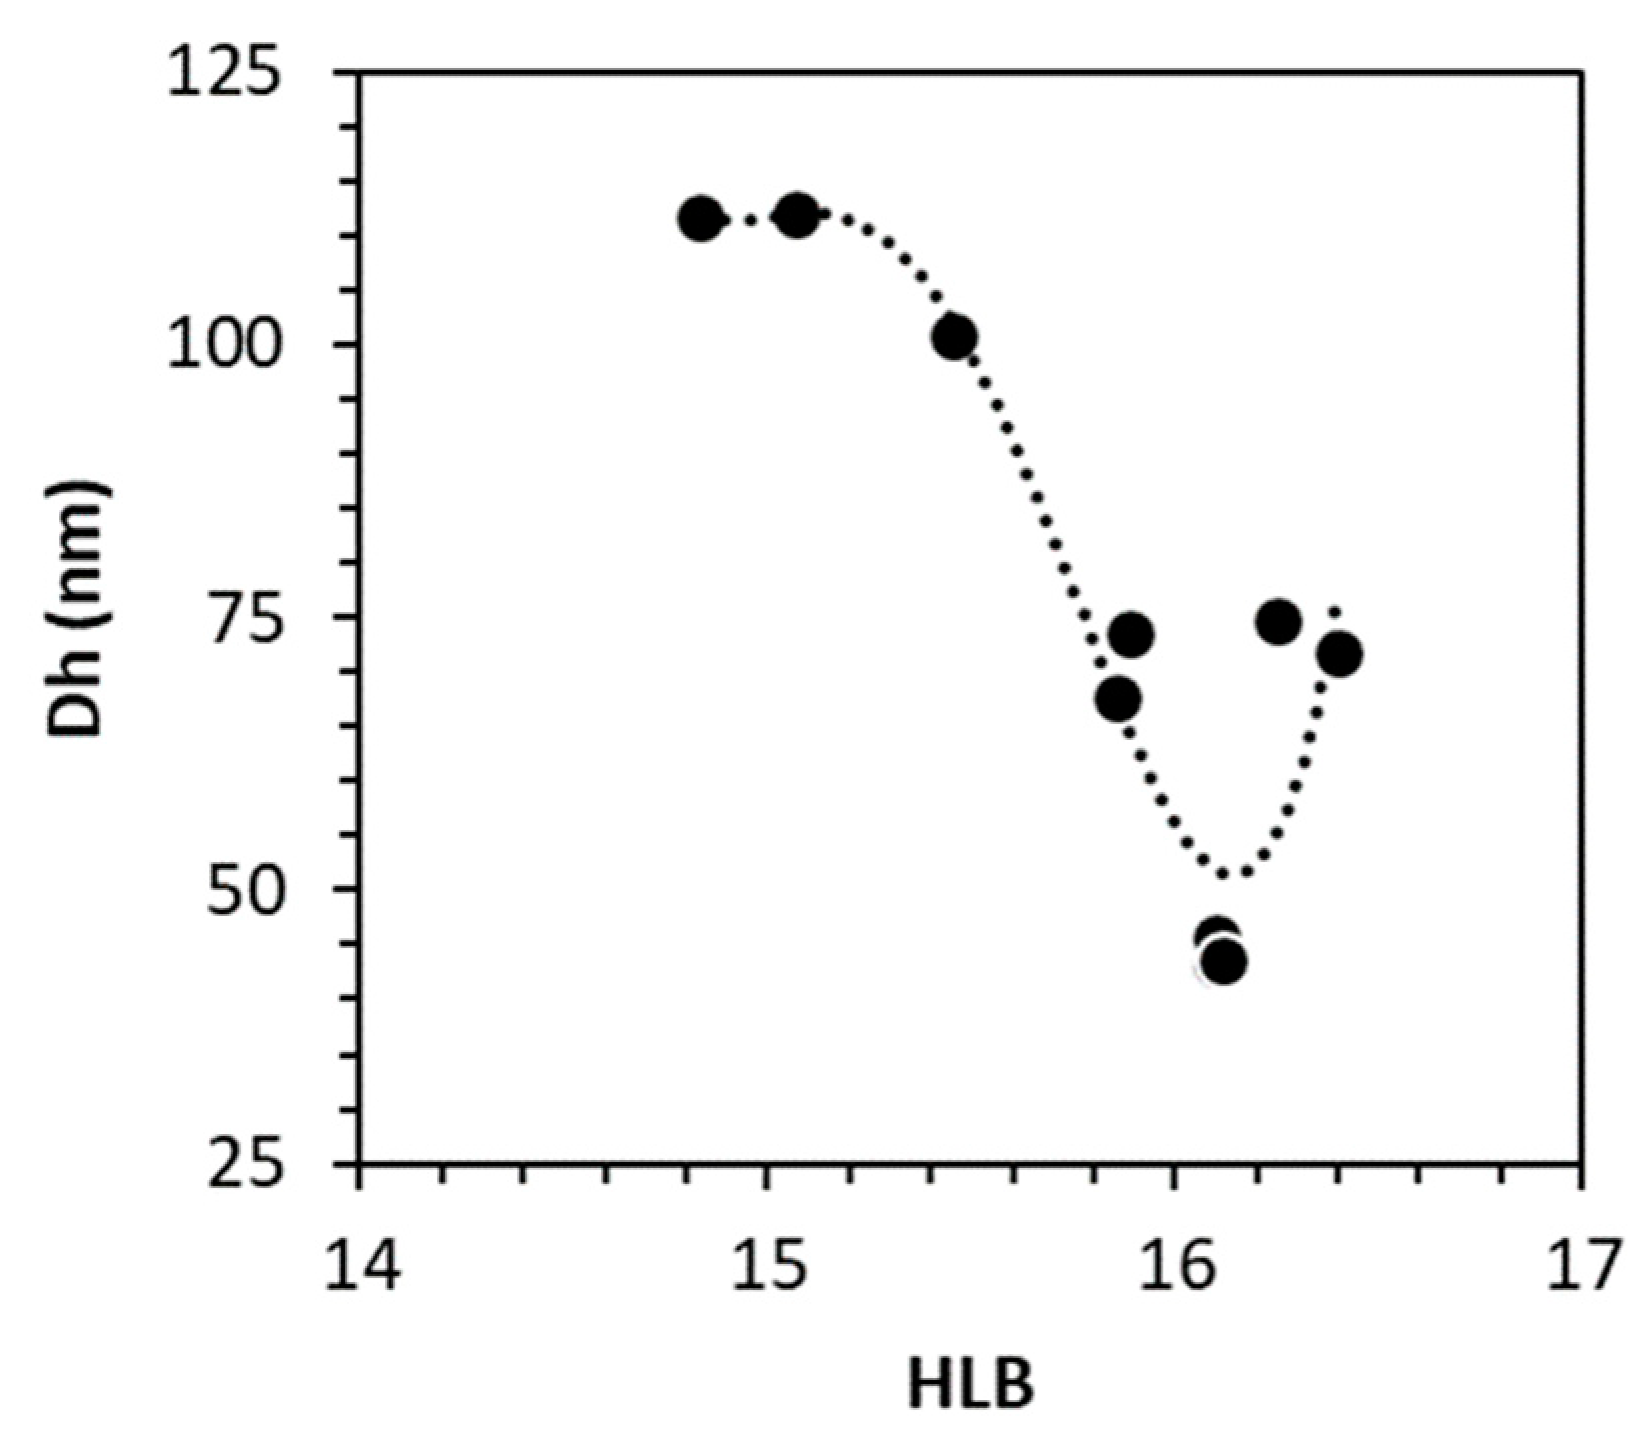
The HLB of BCSO was determined experimentally from a series of BCSO nanoemulsions using PS20 and Alcolec S mixed in various proportions over the HLB 15–17 range. The SOR was 1.0. The smallest oil droplet size of 53.5 ± 0.7 nm (CV = 0.013, PDI = 0.239) was observed in 10% BCSO, 9.7% PS20, and 0.6% Alcolec S corresponding to HLB 16.1 (Figure 4), in close agreement with the reported value. Polynomial regression analysis of these data (r2 = 0.974, n = 10) predicted a local minimum at HLB 16.0.
3.3.4. Determination of Astaxanthin Oleoresin HLB
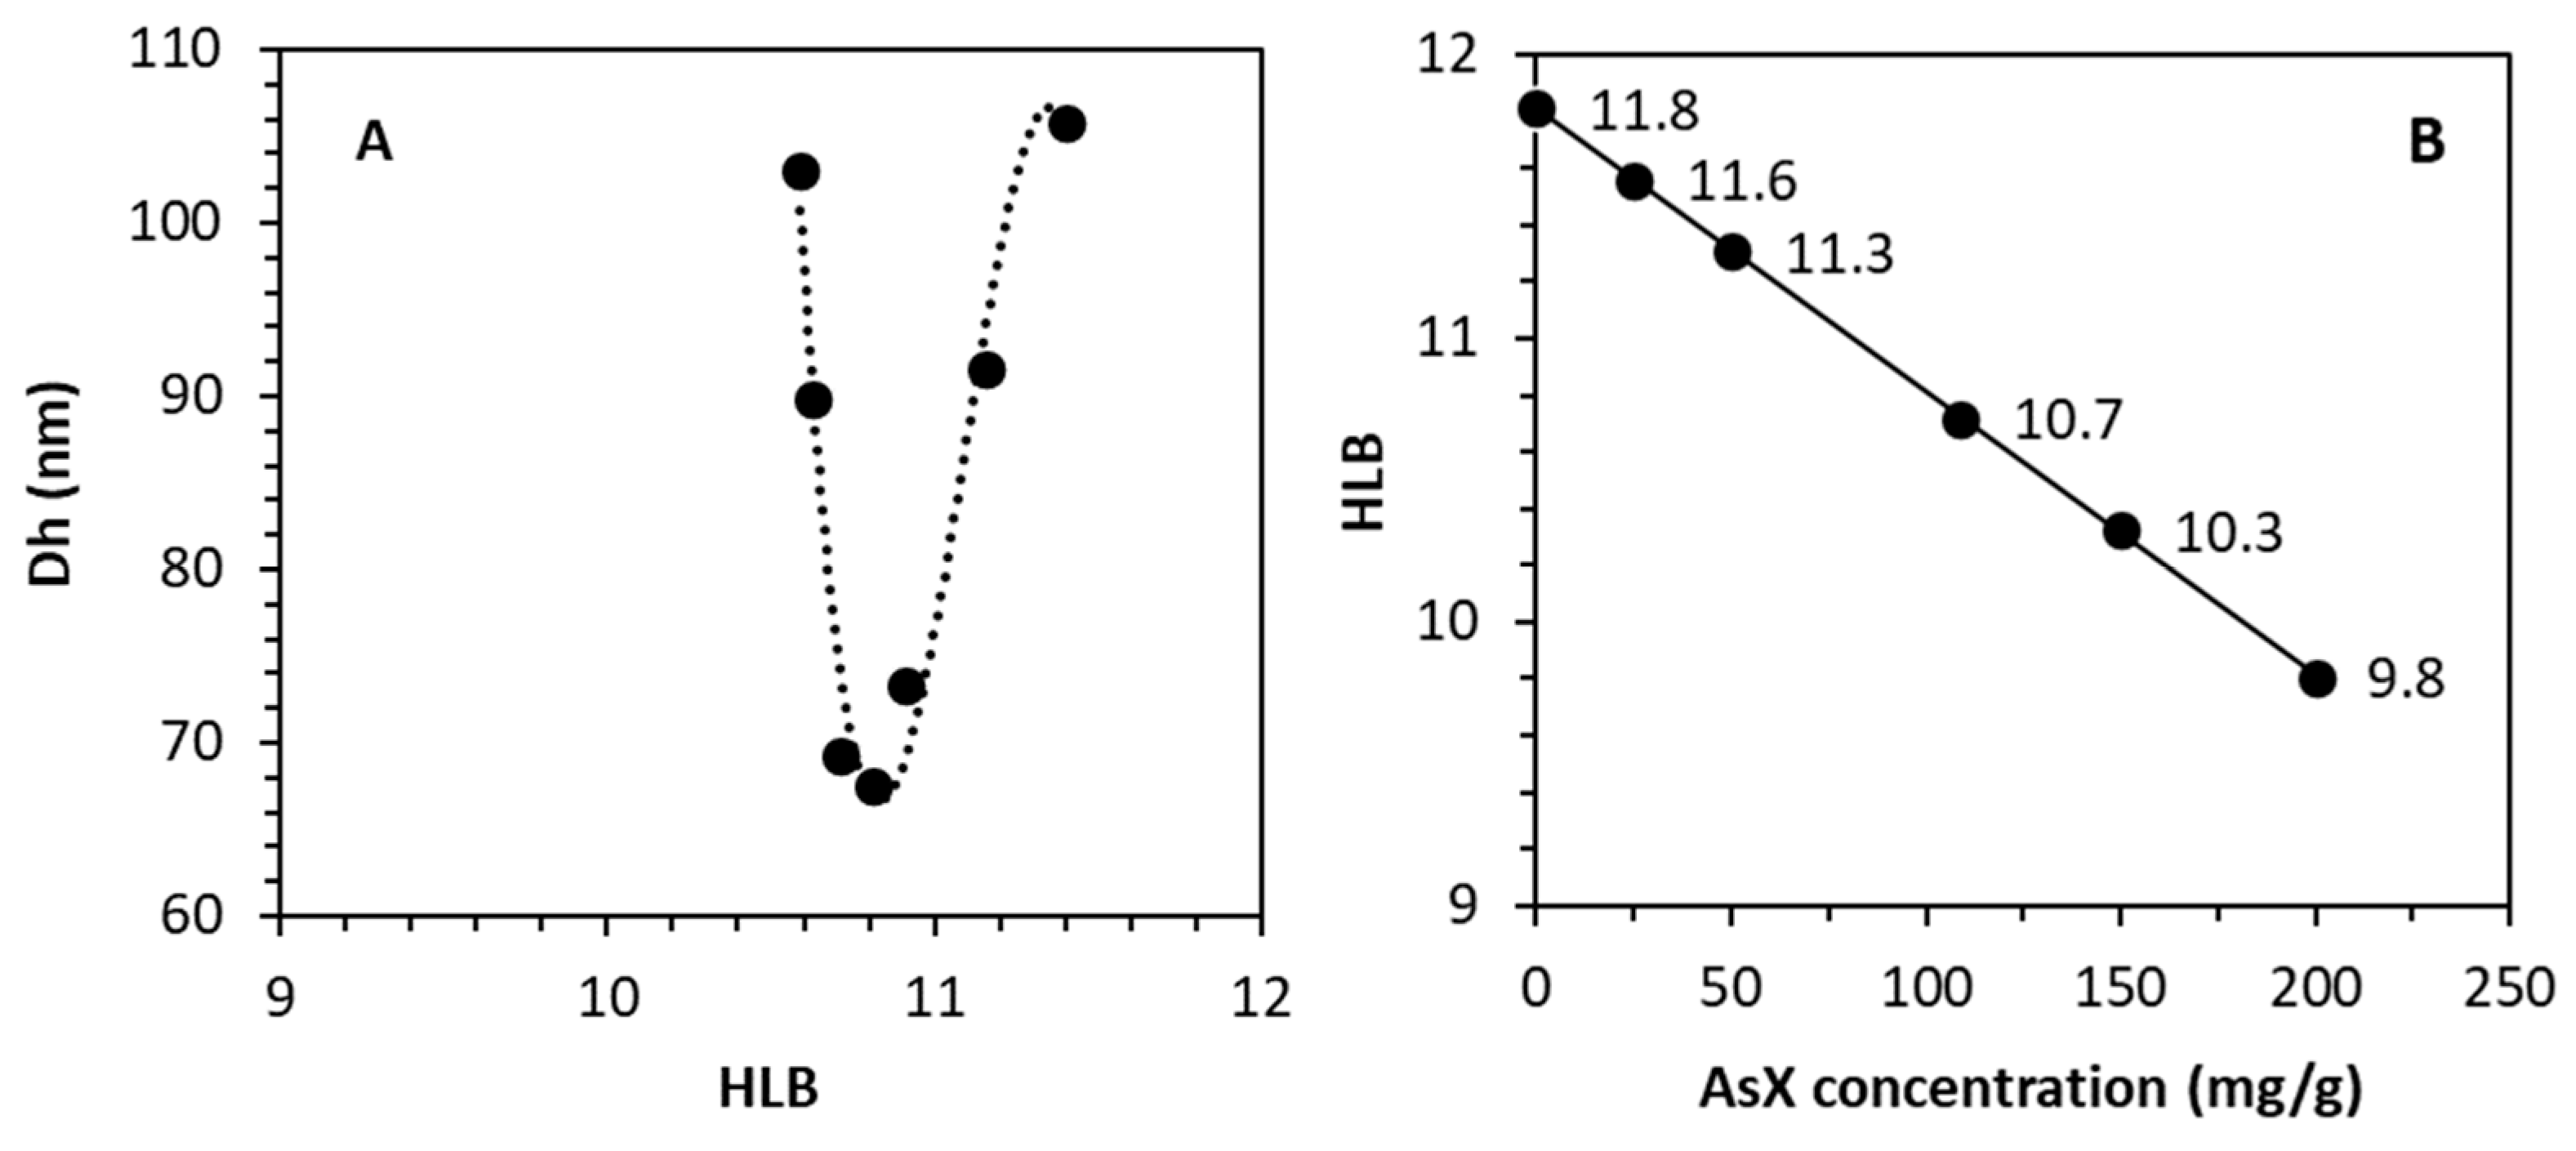
The HLB of an algal oleoresin containing 10.4% AsX (AsX-AO) was empirically determined from a series of nanoemulsions in which Alcolec S and PS20 were mixed at various proportions over the HLB 9–13 range (Figure 5A). The SOR was 1.0. The smallest droplet size of 67.5 ± 0.4 nm (CV = 0.005, PDI = 0.295) was observed at HLB 10.81. Polynomial regression analysis (r2 = 0.965, n = 7) predicted a local minimum at HLB 10.84.
Having determined the HLB of the AsX-AO, the HLB of the oil phase can be calculated as a function of the AsX concentration. The HLB of the oleoresin decreases as the AsX concentration is increased. Using an HLB value of 1.8 for pure AsX, the HLB of oleoresins containing 0%, 5%, or 20% AsX is predicted to be 11.9, 11.4, and 9.8, respectively (Figure 5B). In the optimal formulation, the surfactant concentrations would have to be adjusted to match each new oil phase when the concentration of the active ingredient is changed.
3.3.5. Determination of P-LPC-80 HLB
P-LPC-80 is a lysolecithin containing 90–92% lysophosphatidylcholine with an expected HLB value in the 9.1–11.3 range [23]. Accordingly, it is much more water-soluble than other lecithins, forming completely transparent 20% stock solutions in water.
The HLB of P-LPC-80 was determined from nanoemulsions prepared by mixing AsX-AO and Alcolec S at various proportions over the HLB 9–11 range and then adjusting the SOR to 1.0 with 20% P-LPC-80. Experimentally, the smallest droplet size of 86.9 ± 0.6 nm (CV = 0.007, PDI = 0.257) was observed at HLB 10.81, where the HLB of the combined surfactants matched the HLB of AsX-AO (Figure 6). An HLB of 12.23 was derived for P-LPC-80 from Equation (2). Polynomial regression analysis (r2 = 0.964, n = 5) predicted a local minimum at HLB 10.87, suggesting an HLB of 12.38 for P-LPC-80.
3.3.6. Determination of Kolliphor EL HLB
Kolliphor EL is a widely used excipient in pharmaceutical formulations produced by the polyethoxylation of castor oil. The reported HLB values of Kolliphor EL range from 13 to 14 [32,33], while the manufacturer reports an HLB in the 12–14 range [34].
The HLB of Kolliphor EL was determined experimentally from a series of 10% BCSO coarse emulsions containing 8–10% Kolliphor EL with SOR adjusted to 1.0 with Alcolec S or PS20. The smallest droplet size of 44.7 ± 1.8 nm (CV = 0.040, PDI = 0.239) was observed in the absence of any cosurfactant, indicating that BCSO and Kolliphor EL were of nearly identical HLB. From Equation (2), an HLB of 16.12 is predicted for Kolliphor EL. By interpolating the best fit polynomial regression (r2 = 0.894, n = 9), a local minimum at HLB 16.15 was derived (Figure 7).
3.3.7. Estimation of HLB by UV/Vis Spectroscopy
DLS is routinely used to measure oil droplet size and polydispersity. DLS measures fluctuations in laser light scattering over time resulting from the Brownian motion of particles and applies the Stokes–Einstein equation to estimate their mean hydrodynamic diameter [35,36]. However, DLS instrumentation may not be readily available in many formulation laboratories.
By the strictest definition, a nanoemulsion is any emulsion of submicron oil droplet size. However, a critical threshold is crossed at around 100 nm, where light scattering is diminished as to render transparent or nearly transparent dispersions (Figure 1B). Optical clarity can be quantified from absorbance measurements and expressed as transmittance relative to a water blank.
Commonly available and affordable UV/Vis spectrophotometers can be used to measure the loss of transmitted light due to increased light scattering. Turbidity measurement has become a widely accepted method for estimating relative oil droplet size in emulsions [20] and can be used to monitor growing oil droplet size over time in stability studies [21].
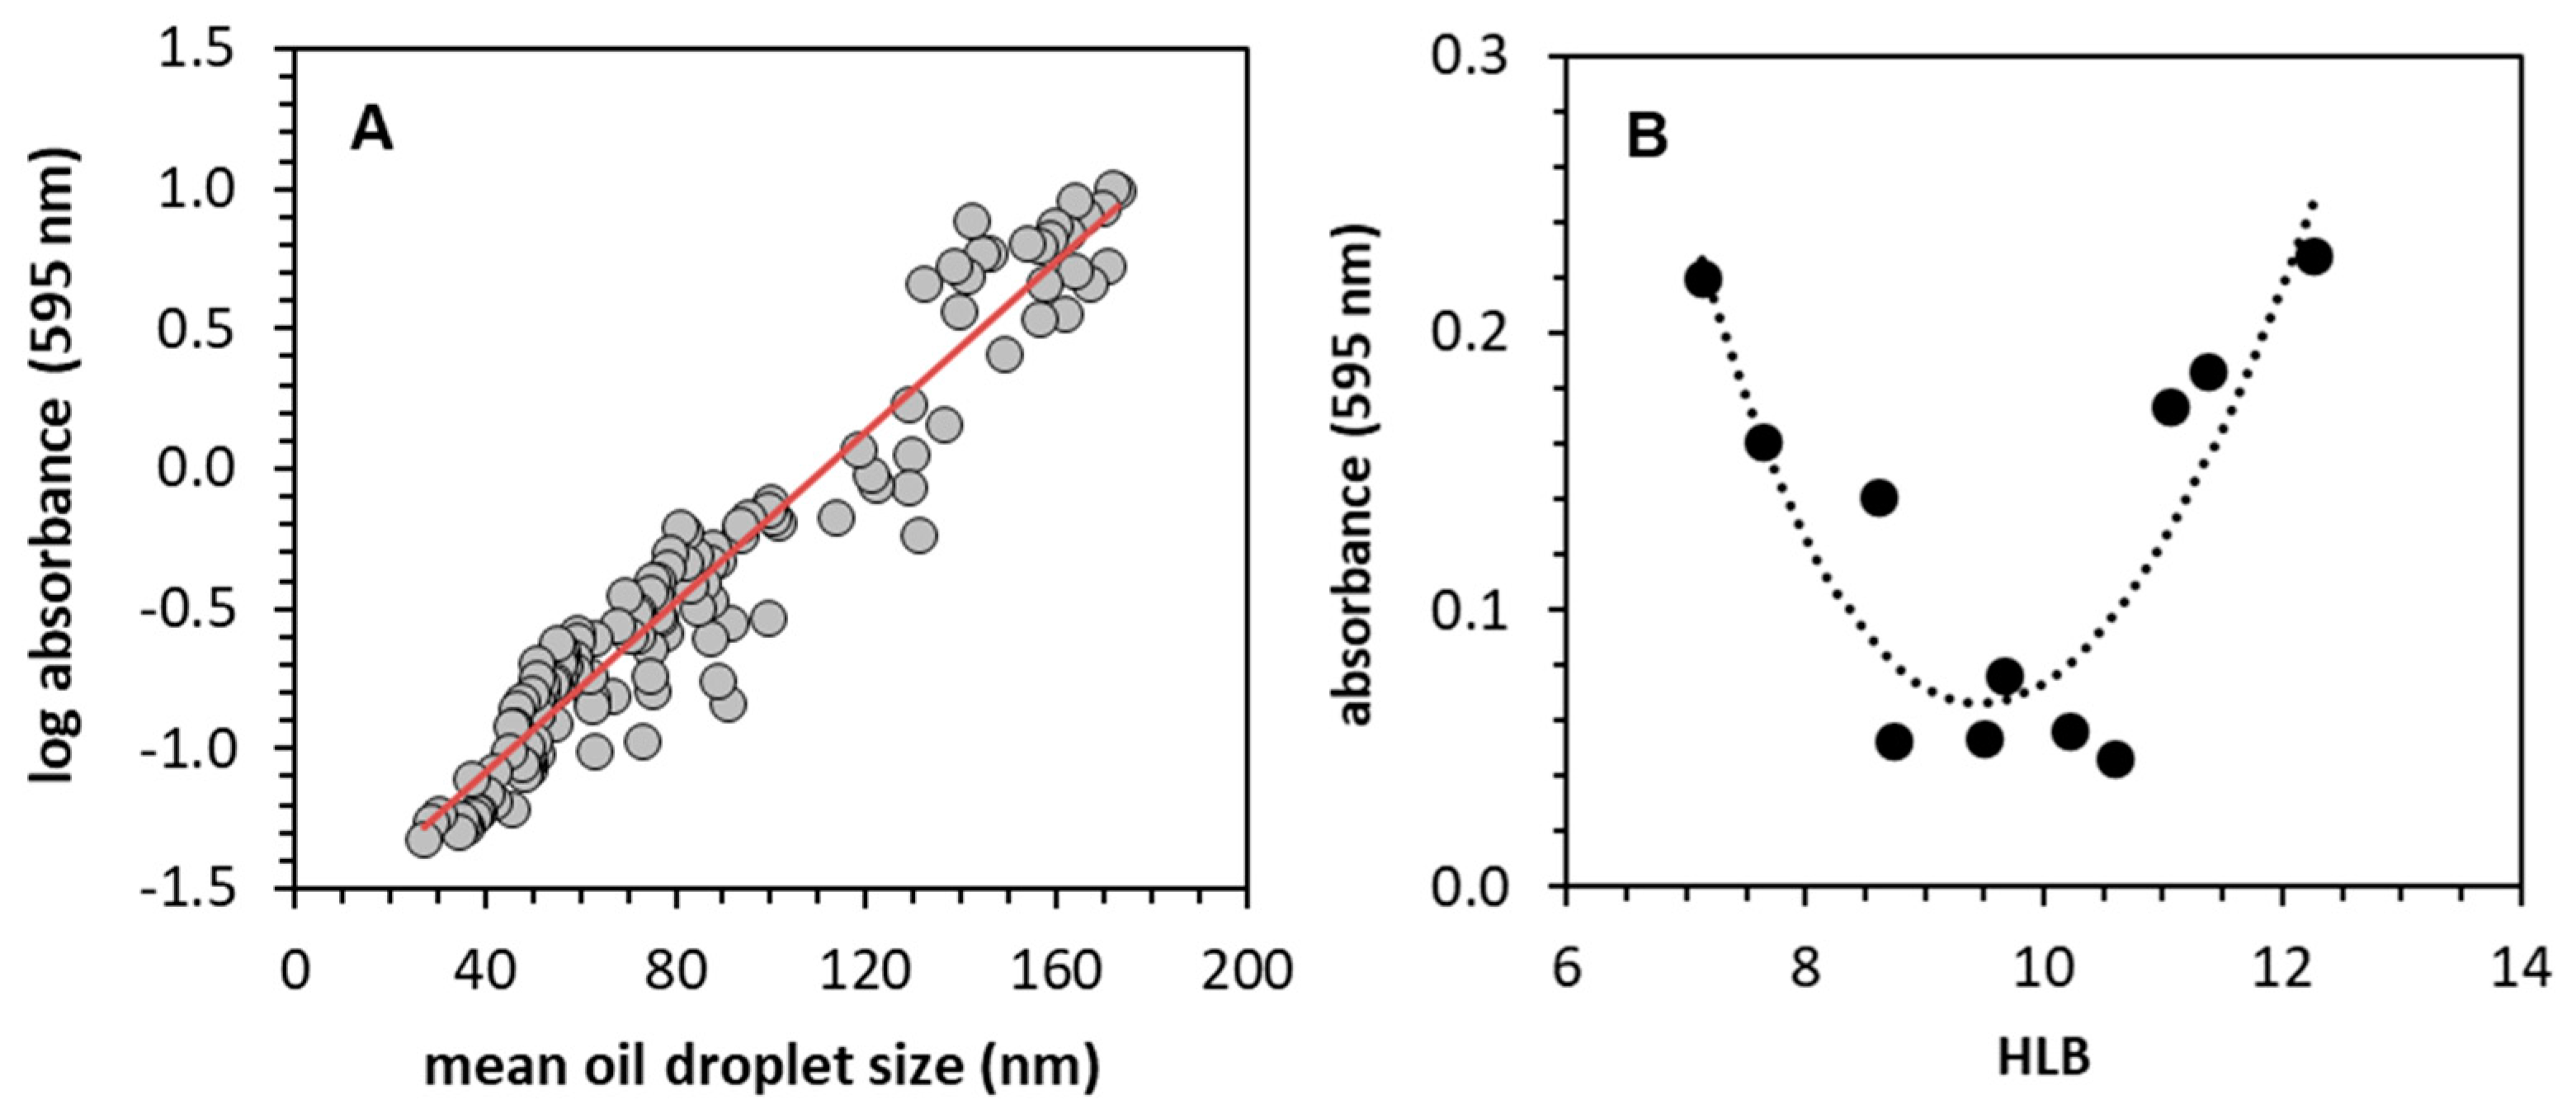
A linear correlation (r2 = 0.933, n = 135) was observed between turbidity measured at a wavelength of 595 nm and hemp seed oil droplet size over the 20–180 nm range, as determined by DLS (Figure 8A), suggesting that rapid turbidity measurements can be used as a first pass qualitative assessment in nanoemulsion manufacturing, although conclusion relies on the assumption that none of the components absorb light significantly at the wavelength used.
Hempseed oil HLB was estimated from nanoemulsions prepared with Phospholipon 85G mixed at various proportions with PS80 over the HLB range of 7–12. Following UST processing at 45,000 psi, absorbance was measured at a wavelength of 595 nm. The lowest absorbance value (lowest light scattering and smallest theoretical oil droplet size) was observed in 10% hemp seed oil containing 4% Phospholipon 85G and 6% PS80, corresponding to an HLB of 9.5 for hemp seed oil (Figure 8B). This is similar to a previously reported HLB value of 9.0 for cold-pressed hemp seed oil [37].
3.3.8. Stability of Nanoemulsions
Experimental HLB determination relies on an effective and consistent process that facilitates the formation of nanoemulsions with the smallest possible droplet size in order to reliably calculate the target HLB values. It is critical to employ an emulsification technique that guarantees that all physical parameters of the process are tightly controlled and remain exactly the same when processing formulations with varying HLB values for an accurate comparison. In this work, we chose to employ the UltraShear homogenizer system that maintains tight control of high pressure and temperature and carried our processing of all formulations by ten passes to ensure that the smallest possible droplet size was reached. Once formed, these nanoemulsions should remain stable over extended periods of time. AsX-AO nanoemulsions were stable for at least one year at 4 °C. DLS measurements over the time course showed no significant changes in droplet size or polydispersity. Hemp seed oil nanoemulsions were stable for at least three years at 4 °C with no significant change in oil droplet size or sample clarity. At the time of this report, argan oil nanoemulsions were stable for at least four months at room temperature. BSCO nanoemulsions were stable for at least two months at room temperature.
4. Concluding Remarks
Coarse emulsions of micron or submicron oil droplet sizes form where the types and relative concentrations of oils and surfactants support emulsification. Large oil droplets can be decreased in size by at least one order of magnitude using high-energy processes that exert intense fluid shear forces. An important threshold is reached at approximately 100 nm, below which light scattering is so diminished as to produce transparent or nearly transparent dispersions.
The encapsulation of bioactives into the smallest possible oil droplets has been shown to significantly improve absorption through oral and transdermal delivery routes. The oral bioavailability of several pharmacologically relevant lipophiles, including AsX [38], curcumin [39], coenzyme Q10 [40], and cannabidiol [41,42], is significantly increased by nanoemulsification. For example, the gastrointestinal absorption of andrographolide, a water-insoluble drug compound used for the treatment of chronic inflammatory bowel disease, was increased at least eight-fold following the oral administration of nanoemulsions of 120 nm mean oil droplet size [43].
The formation of exceptionally small oil droplets is a function of both the formulation and a disruptive physical process which exerts intense fluid shear forces. High-pressure homogenization by the UST homogenizer has been shown to incrementally reduce oil droplet size with each successive cycle, thus enabling the targeting of droplet size and reaching a minimum droplet size after 6–10 passes. For example, 25 nm krill oil droplets were formed after seven UST passes [24]. Moreover, the process is highly reproducible, thus allowing for the direct comparison of discrete formulations.
The HLB of oils or surfactants may deviate from their reported rHLB; thus, a method for determining actual HLB from a relatively short series of experiments would be valuable, enabling the adjustment of component ratios to compensate for drifting HLB (Table 1). For oils, their composition may be variable according to the crop origin, growing season, and processing method. For example, palm oils which constitute roughly 40% of traded vegetable oils [44] are of highly diverse lipid composition [45].
Climate change has measurably influenced plant oil composition. A recent study of Tunisian olive oil showed significant variation in fatty acid and triacylglycerol content over three consecutive growing seasons [48]. Likewise, the variability of soybean and sunflower crops may also potentially influence lecithin HLBs. Finally, synthetic surfactants are prone to forming reaction intermediates [46,47], the degree of which is expected to vary across different manufacturers and production batches, which may also influence HLB. Therefore, the experimental confirmation of oil and surfactant HLBs, especially when new reagents are sourced, will be useful for the optimization of formulations.
Emulsion stability, on the other hand, is a function of both droplet size and the formulation. Thus, the concentrations and relative proportions of oil phase components, bioactives, and one or more surfactants will play a critical role in nanoemulsion stability. Long-term preservation of the bioactive and oil is ensured by the inclusion of antioxidants, the addition of which may influence the HLB. The experimental approach for the determination of the HLB value for chemically complex oil-based natural extracts enables the development of stable nanoemulsion formulations using commercially desirable plant-derived oils and emulsifiers.
Author Contributions
Conceptualization, G.S.; Methodology, G.S. and A.L.; Software, G.S. and A.L.; Validation, G.S., V.G. and A.L.; Formal analysis, G.S., V.G. and A.L.; Investigation, G.S., V.G. and A.L.; Data curation, G.S., V.G. and A.L.; Writing—original draft preparation, G.S., V.G. and A.L.; Writing—review and editing G.S., V.G. and A.L. All authors have read and agreed to the published version of the manuscript.
Funding
This research received no external funding.
Data Availability Statement
The original contributions presented in the study are included in the article. Further inquiries can be directed to the corresponding author.
Acknowledgments
The authors thank Karen Hecht of AstaReal USA, Lorin Borghini of American Lecithin Company, and Kathy Hickey of Jedwards International.
Conflicts of Interest
All authors were employed by Pressure Biosciences. The authors declare that the research was conducted in the absence of any commercial or financial relationships that could be construed as a potential conflict of interest.
Abbreviations
AsX: astaxanthin; AsX-AO, astaxanthin oleoresin; BCSO, black cumin seed oil; HLB, hydrophilic–lipophilic balance; LPC, lysophosphatidylcholine; PS20, polysorbate 20; PS80, polysorbate 80; rHLB, required HLB; SOR, surfactant-to-oil ratio.
References
- McClements, D.J. Nanoemulsions versus microemulsions: Terminology, differences, and similarities. Soft Matter 2012, 8, 1719–1729. [Google Scholar] [CrossRef]
- Aswathanarayan, J.B.; Vittal, R.R. Nanoemulsions and Their Potential Applications in Food Industry. Front. Sustain. Food Syst. 2019, 3, 95. [Google Scholar] [CrossRef]
- Wang, Q.; Zhang, H.; Han, Y.; Cui, Y.; Han, X. Study on the relationships between the oil HLB value and emulsion stabilization. RSC Adv. 2023, 13, 24692–24698. [Google Scholar] [CrossRef] [PubMed]
- Silva, H.D.; Cerqueira, M.A.; Vicente, A.A. Influence of surfactant and processing conditions in the stability of oil-in-water nanoemulsions. J. Food Eng. 2015, 167, 89–98. [Google Scholar] [CrossRef]
- Hadnadev, T.D.; Dokic, P.; Krstonosic, V.; Hadnadev, M. Influence of oil phase concentration on droplet size distribution and stability of oil-in-water emulsions. Tamara Eur. J. Lipid Sci. Technol. 2013, 115, 313–321. [Google Scholar] [CrossRef]
- Nejadmansouri, M.; Hosseini, S.M.H.; Niakosari, M.; Yousefi, G.H.; Golmakani, M.T. Physicochemical properties and oxidative stability of fish oil nanoemulsions as affected by hydrophilic lipophilic balance, surfactant to oil ratio and storage temperature. Colloids Surf. A Physicochem. Eng. Asp. 2016, 506, 821–832. [Google Scholar] [CrossRef]
- Badruddoza, A.Z.M.; Gupta, A.; Myersonm, A.S.; Trout, B.L.; Doyle, P.S. Low Energy Nanoemulsions as Templates for the Formulation of Hydrophobic Drugs. Adv. Therap. 2017, 1, 10. [Google Scholar] [CrossRef]
- Hait, S.K.; Moulik, S.P. Determination of critical micelle concentration (CMC) of nonionic surfactants by donor-acceptor interaction with lodine and correlation of CMC with hydrophile-lipophile balance and other parameters of the surfactants. J. Surfact Deterg. 2001, 4, 303–309. [Google Scholar] [CrossRef]
- Griffin, W.C. Calculation of HLB Values of Non-Ionic Surfactants. J. Soc. Cosmet. Chem. 1954, 5, 249–256. [Google Scholar]
- Pasquali, R.C.; Sacco, N.; Bregni, C. The Studies on Hydrophilic-Lipophilic Balance (HLB): Sixty Years after William C. Griffin’s Pioneer Work (1949–2009). Lat. Am. J. Pharm. 2009, 28, 313–317. [Google Scholar]
- Davies, J.T. A quantitative kinetic theory of emulsion type. Physical chemistry of the emulsifying agent. Proc. Int. Congr. Surf. Act. 1957, 1, 426–438. [Google Scholar]
- Nihon Emulsion Company. The Effective Formulation Development Using the Organic Conceptual Diagram (IOB System). Available online: http://Nihon-emulsion.co.jp/shared/pdf/tech/emulsification_prescriptionE.pdf (accessed on 30 January 2023).
- Salager, J.L.; Antón, R.; Bullón, J.; Forgiarini, A.; Marquez, R. How to Use the Normalized Hydrophilic-Lipophilic Deviation (HLDN) Concept for the Formulation of Equilibrated and Emulsified Surfactant-Oil-Water Systems for Cosmetics and Pharmaceutical Products. Cosmetics 2020, 7, 57. [Google Scholar] [CrossRef]
- Aubry, J.M.; Ontiveros, J.F.; Salager, J.L.; Nardello-Rataj, V. Use of the normalized hydrophilic-lipophilic-deviation (HLDN) equation for determining the equivalent alkane carbon number (EACN) of oils and the preferred alkane carbon number (PACN) of nonionic surfactants by the fish-tail method (FTM). Adv. Colloid Interface Sci. 2020, 276, 102099. [Google Scholar] [CrossRef]
- Salager, J.L.; Marquez, N.; Graciaa, A. Lachaise Partitioning of Ethoxylated Octylphenol Surfactants in Microemulsion−Oil−Water Systems: Influence of Temperature and Relation between Partitioning Coefficient and Physicochemical Formulation. Langmuir 2000, 16, 5534–5539. [Google Scholar] [CrossRef]
- Abbott, S.R. Surfactant Science: Principles and Practice. Available online: https://www.stevenabbott.co.uk/practical-surfactants/hld.php#:~:text=At%20the%20point%20of%20perfect,of%20the%20HLD%20%3D%200%20point (accessed on 30 January 2023).
- Acosta, E.J.; Yuan, J.S.; Bhakta, A.S. The Characteristic Curvature of Ionic Surfactants. J. Surfact Deterg. 2008, 11, 145–158. [Google Scholar] [CrossRef]
- Kampa, J.; Frazier, R.; Rodriguez-Garcia, J. Physical and Chemical Characterisation of Conventional and Nano/Emulsions: Influence of Vegetable Oils from Different Origins. Foods 2022, 11, 681. [Google Scholar] [CrossRef]
- Ga, S.; Jovanovi, B.; Jovanovi, S. The stability of emulsions in the presence of additives. J. Serb. Chem. Soc. 2002, 67, 31–39. [Google Scholar]
- Orafidiya, L.O.; Oladimeji, F.A. Determination of the Required HLB Values of Some Essential Oils. Int. J. Pharm. 2002, 237, 241–249. [Google Scholar] [CrossRef]
- Niczinger, N.A.; Kállai-Szabó, N.; Dredán, J.; Budai, L.; Hajdú, M.; Antal, I. Application of Droplet Size Analysis for the Determination of the Required HLB of Lemon Oil in O/W Emulsion. Curr. Pharm. Anal. 2015, 11, 11–15. [Google Scholar] [CrossRef]
- Van Hoogevest, P. An update on the use of oral phospholipid excipients. Eur. J. Pharm. Sci. 2017, 108, 1–12. [Google Scholar] [CrossRef]
- Otto, F.; Van Hoogevest, P.; Syrowatka, F.; Heinl, V.; Neubert, R.H.H. Assessment of the applicability of HLB values for natural phospholipid emulsifiers for preparation of stable emulsions. Pharmazie 2020, 75, 365–370. [Google Scholar]
- Smejkal, G.B.; Ting, E.Y.; Arul Nambi, K.; Schumacher, R.T.; Lazarev, A.V. Characterization of astaxanthin nanoemulsions produced by intense fluid shear through a self-throttling nanometer range annular orifice valve-based high pressure homogenizer. Molecules 2021, 26, 2856. [Google Scholar] [CrossRef]
- Janahar, J.J.; Marciniak, A.; Balasubramaniam, V.M.; Jimenez-Flores, R.; Ting, E. Effects of pressure, shear, temperature, and their interactions on selected milk quality attributes. J. Dairy Sci. 2021, 104, 1531–1547. [Google Scholar] [CrossRef]
- Rasband, W.S. ImageJ, U.S. National Institutes of Health, Bethesda, Maryland, USA. 1997–2018. Available online: https://imagej.nih.gov/ij/ (accessed on 30 January 2023).
- Yaghmur, A.; Aserin, A.; Mizrahi, Y.; Nerd, A.; Garti, N. Argan oil-in-water emulsions: Preparation and stabilization. J. Am. Oil Chem. Soc. 1999, 76, 15–18. [Google Scholar] [CrossRef]
- American Lecithin Company. Lipids and Phospholipids: A Simple Guide to Use and Selection. Product Brochure. 2020, pp. 1–23. Available online: https://americanlecithin.us/wp-content/uploads/2022/08/ALC-Lecithin-and-Phopholipids-Brochure.pdf (accessed on 30 January 2023).
- Mohd Nor, N.H.; Mohd Shafri, M.A.; Mohamed, F. Preparation and characterization of nigella sativa microemulsions. Int. J. Pharm. Pharm. Sci. 2014, 6, 485–489. [Google Scholar]
- Khader, M.; Eckl, P.M. Thymoquinone: An emerging natural drug with a wide range of medical applications. Iran. J. Basic Med. Sci. 2014, 17, 950–957. [Google Scholar]
- Akram Khan, M.; Afzal, M. Chemical composition of Nigella sativa Linn: Part 2 Recent advances. Inflammopharmacol 2016, 24, 67–79. [Google Scholar] [CrossRef]
- Legen, I.; Peternel, L.; Novak, S.; Homar, M.; Rozman, P.; Klancar, U. Self-Microemulsifying Drug Delivery System of Abiraterone or Abiraterone Acetate. Patent WO2014009434, 10 July 2013. [Google Scholar]
- Smail, S.S.; Ghareeb, M.M.; Omer, H.K.; Al-Kinani, A.A.; Alany, R.G. Studies on Surfactants, Cosurfactants, and Oils for Prospective Use in Formulation of Ketorolac Tromethamine Ophthalmic Nanoemulsions. Pharmaceutics 2021, 13, 467. [Google Scholar] [CrossRef]
- Pharma, B.A.S.F.; Kolliphor, E.L. Technical Bulletin. 2019, pp. 1–5. Available online: https://pharma.basf.com/products/kolliphor-el (accessed on 30 January 2023).
- Einstein, A. Über einen die Erzeugung und Verwandlung des Lichtes betreffenden heuristischen Gesichtspunkt. Ann. Der. Phys. 1905, 322, 132–148. [Google Scholar] [CrossRef]
- Stetefeld, J.; McKenna, S.A.; Patel, T.R. Dynamic light scattering: A practical guide and applications in biomedical sciences. Biophys. Rev. 2016, 8, 409–427. [Google Scholar] [CrossRef]
- Mikulcová, V.; Kašpárková, V.; Humpolíček, P.; Buňková, L. Formulation, Characterization and Properties of Hemp Seed Oil and Its Emulsions. Molecules 2017, 22, 700. [Google Scholar] [CrossRef]
- Meor Mohd Affandi, M.M.R.; Julianto, T.; Majeed, A.B.A. Enhanced Oral Bioavailability of Astaxanthin with Droplet Size Reduction. Food Sci. Technol. Res. 2012, 18, 549–554. [Google Scholar] [CrossRef]
- Onodera, T.; Kuriyama, I.; Andoh, T.; Ichikawa, H.; Sakamoto, Y.; Lee-Hiraiwa, E.; Mizushina, Y. Influence of particle size on the in vitro and in vivo anti-inflammatory and anti-allergic activities of a curcumin lipid nanoemulsion. Int. J. Mol. Med. 2015, 35, 1720–1728. [Google Scholar] [CrossRef]
- Khattab, A.; Hassanin, L.; Zaki, N. Self-Nanoemulsifying Drug Delivery System of Coenzyme (Q10) with Improved Dissolution, Bioavailability, and Protective Efficiency on Liver Fibrosis. AAPS PharmSciTech 2017, 18, 1657–1672. [Google Scholar] [CrossRef]
- Nakano, Y.; Tajima, M.; Sigiyama, E.; Sato, V.H.; Sato, H. Development of a Novel Nanoemulsion Formulation to Improve Intestinal Absorption of Cannabidiol. Med. Cannabis Cannabinoids 2019, 2019, 2. [Google Scholar]
- Elsohly, M.A.; Shahzadi, I.; Waseem Gul, W. Absorption and Bioavailability of Novel UltraShear Nanoemulsion of Cannabidiol in Rats. Med. Cannabis Cannabinoids 2023, 6, 148–159. [Google Scholar] [CrossRef]
- Yen, C.C.; Chen, Y.C.; Wu, M.T.; Wang, C.C.; Wu, Y.T. Nanoemulsion as a strategy for improving the oral bioavailability and anti-inflammatory activity of andrographolide. Int. J. Nanomed. 2018, 13, 669–680. [Google Scholar] [CrossRef]
- Murphy, D.J.; Goggin, K.; Paterson, R.R.M. Oil palm in the 2020s and beyond: Challenges and solutions. CABI Agric. Biosci. 2021, 2, 39. [Google Scholar] [CrossRef]
- Guerin, C.; Joët, T.; Serret, J.; Lashermes, P.; Vaissayre, V.; Agbessi, M.D.; Beule, T.; Severac, D.; Amblard, P.; Tregear, J.; et al. Gene coexpression network analysis of oil biosynthesis in an interspecific backcross of oil palm. Plant J. 2016, 87, 423–441. [Google Scholar] [CrossRef]
- Yi, Y.; Jin, Y.; Menon, R.; Yeung, B. Polysorbate, the Good, the Bad, and the Ugly. American Pharmaceutical Review 2020. Available online: https://www.americanpharmaceuticalreview.com/Featured-Articles/569560-Polysorbate-the-Good-the-Bad-and-the-Ugly/ (accessed on 30 January 2023).
- Lv, G.; Wang, F.; Cai, W.; Zhang, X. Characterization of the addition of lipophilic Span 80 to the hydrophilic Tween 80-stabilized emulsions. Colloids Surf. A Physicochem. Eng. Asp. 2014, 447, 8–13. [Google Scholar] [CrossRef]
- Ben Hmida, R.; Gargouri, B.; Chtourou, F.; Abichou, M.; Sevim, D.; Bouaziz, M. Study on the Effect of Climate Changes on the Composition and Quality Parameters of Virgin Olive Oil “Zalmati” Harvested at Three Consecutive Crop Seasons: Chemometric Discrimination. ACS Omega 2022, 7, 40078–40090. [Google Scholar] [CrossRef] [PubMed]
Figure 1.
(A) Phase contrast microscopy showing large oil droplets of roughly Gaussian size distribution in AsX-AO coarse emulsion produced by rotor-stator homogenization. Mean droplet size was 5.2 ± 4.2 microns (CV = 0.802, n = 419). (B) Same sample following nanoemulsification by UST at 45,000 psi. Mean oil droplet size was decreased nearly two orders of magnitude after four passes, reaching 91.8 ± 1.8 nm (CV = 0.020, PDI = 0.321), rendering the droplets essentially invisible at this magnification. Bars represent 50 microns.
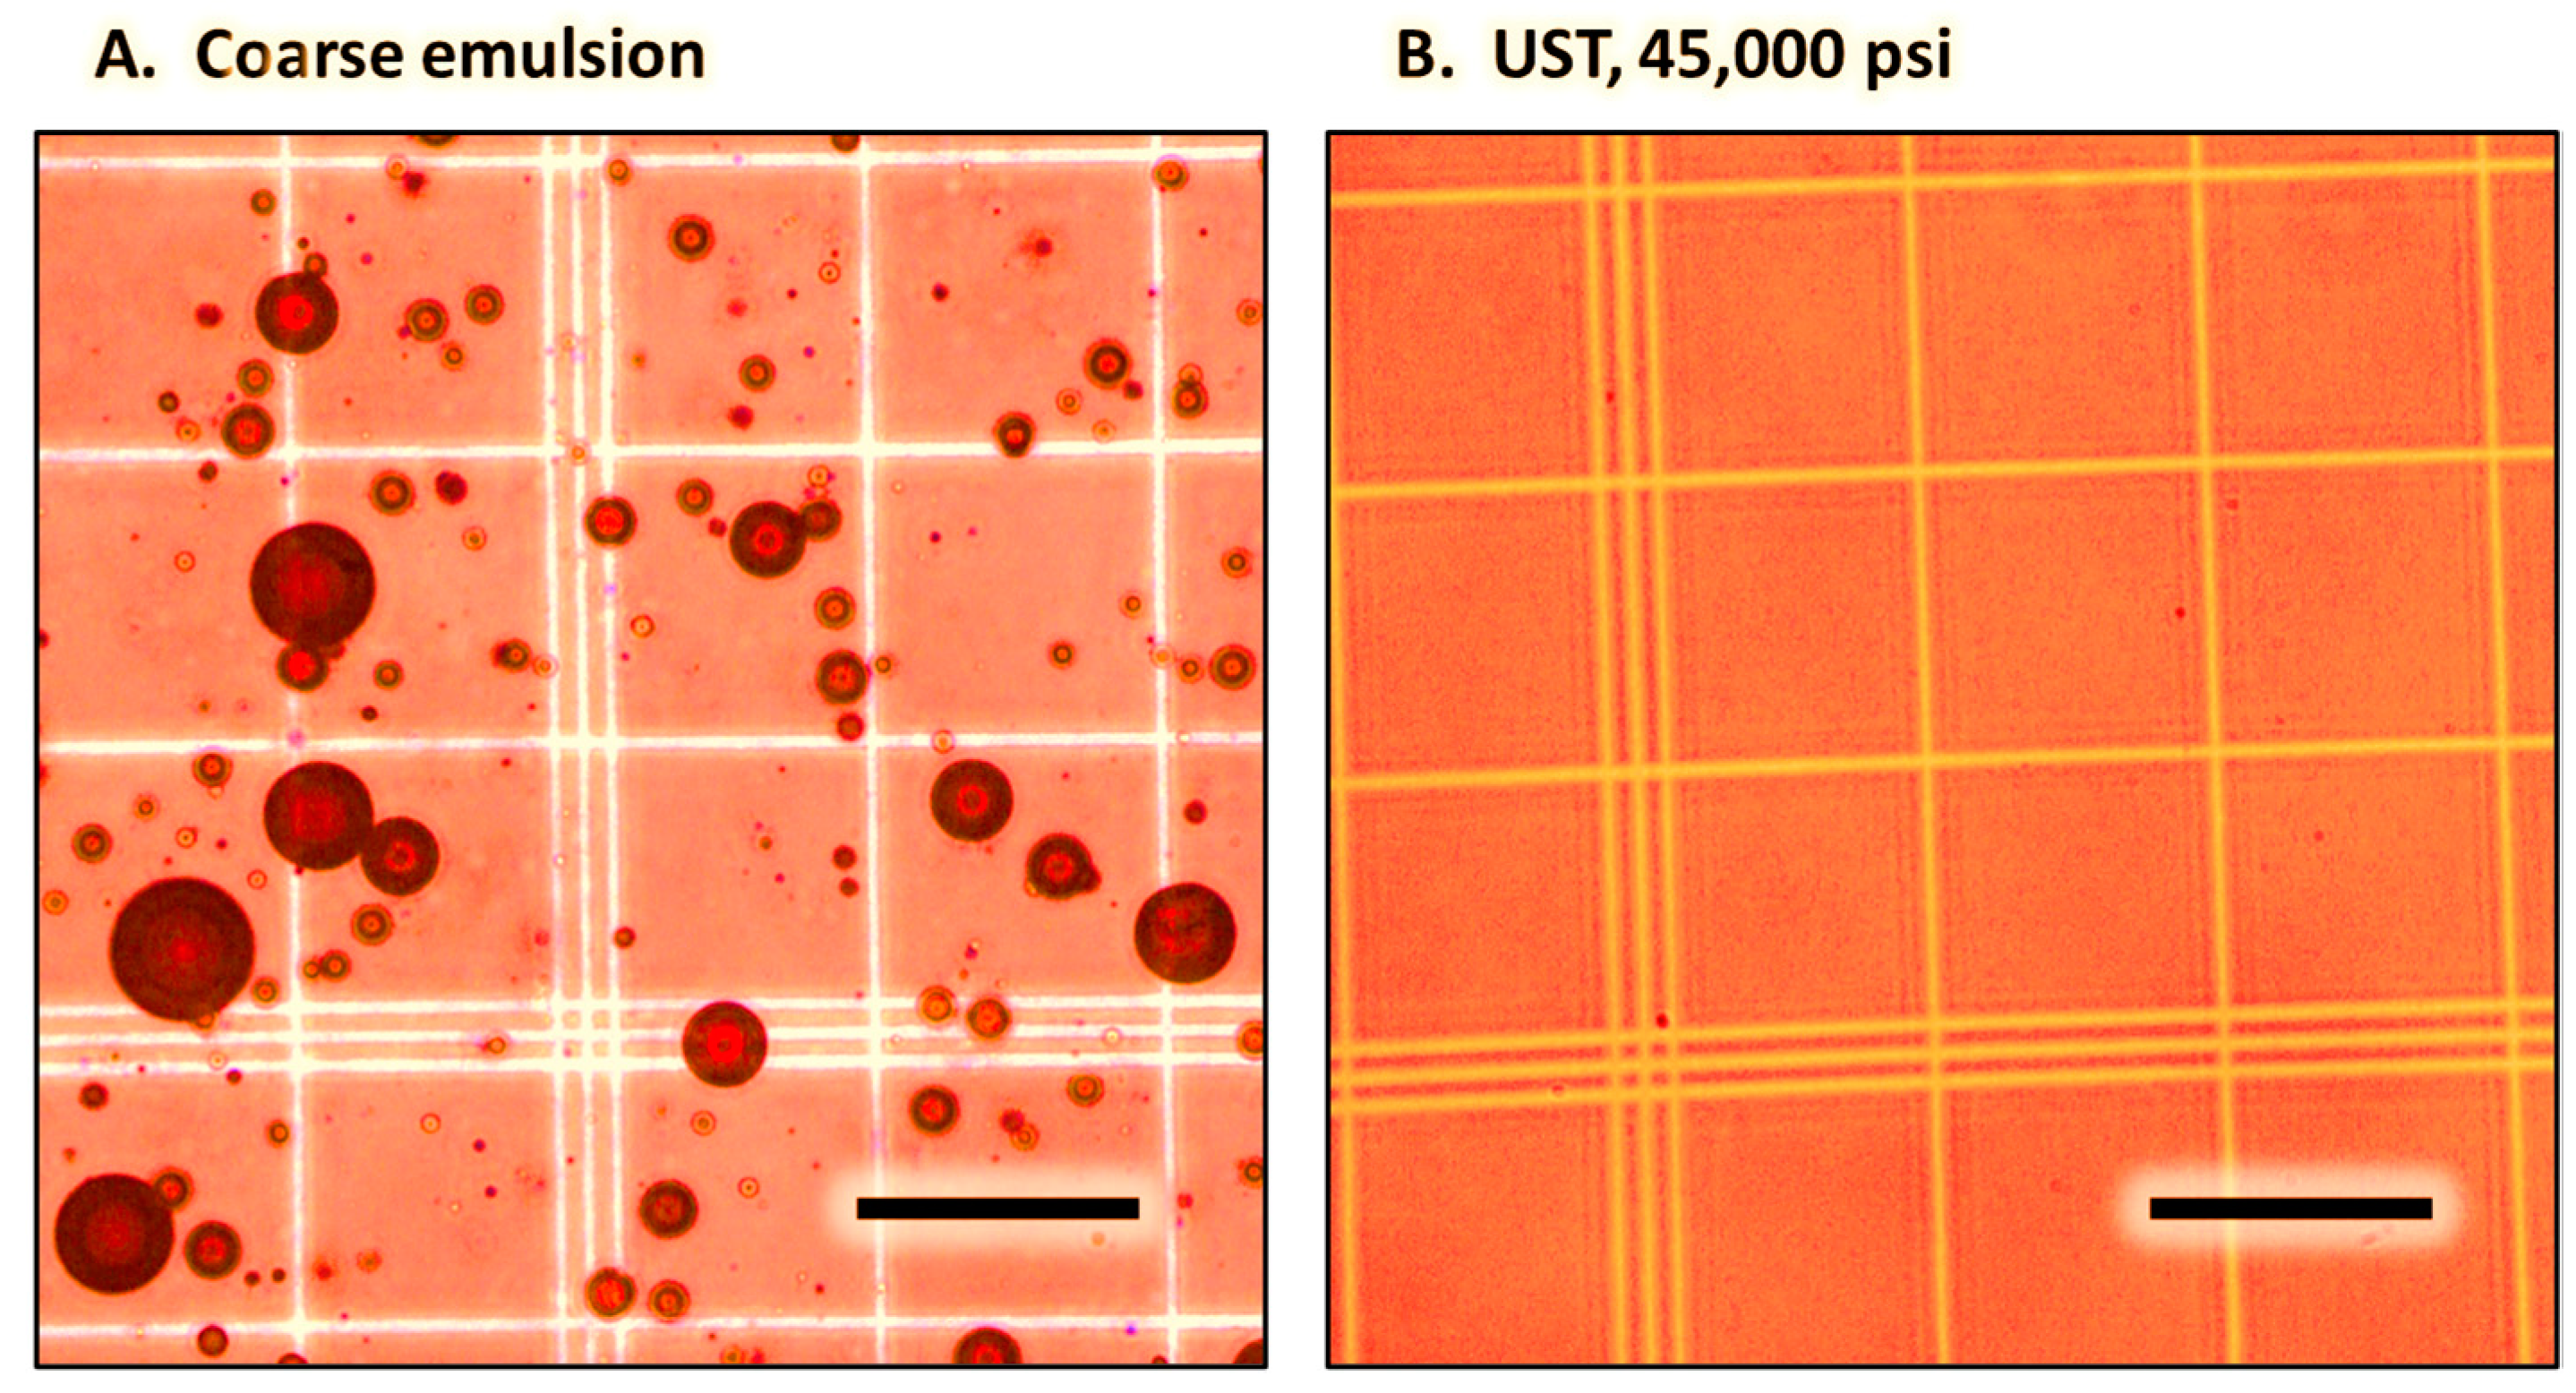
Figure 2.
Validation of the method using 10% argan oil. Experimentally, minimum droplet size was observed at an HLB of 11.12. Theoretically, the HLB calculated by interpolation of the best fit polynomial regression line predicts a local minimum at HLB 11.19, which is in close agreement with the value at which the minimum droplet size is observed.
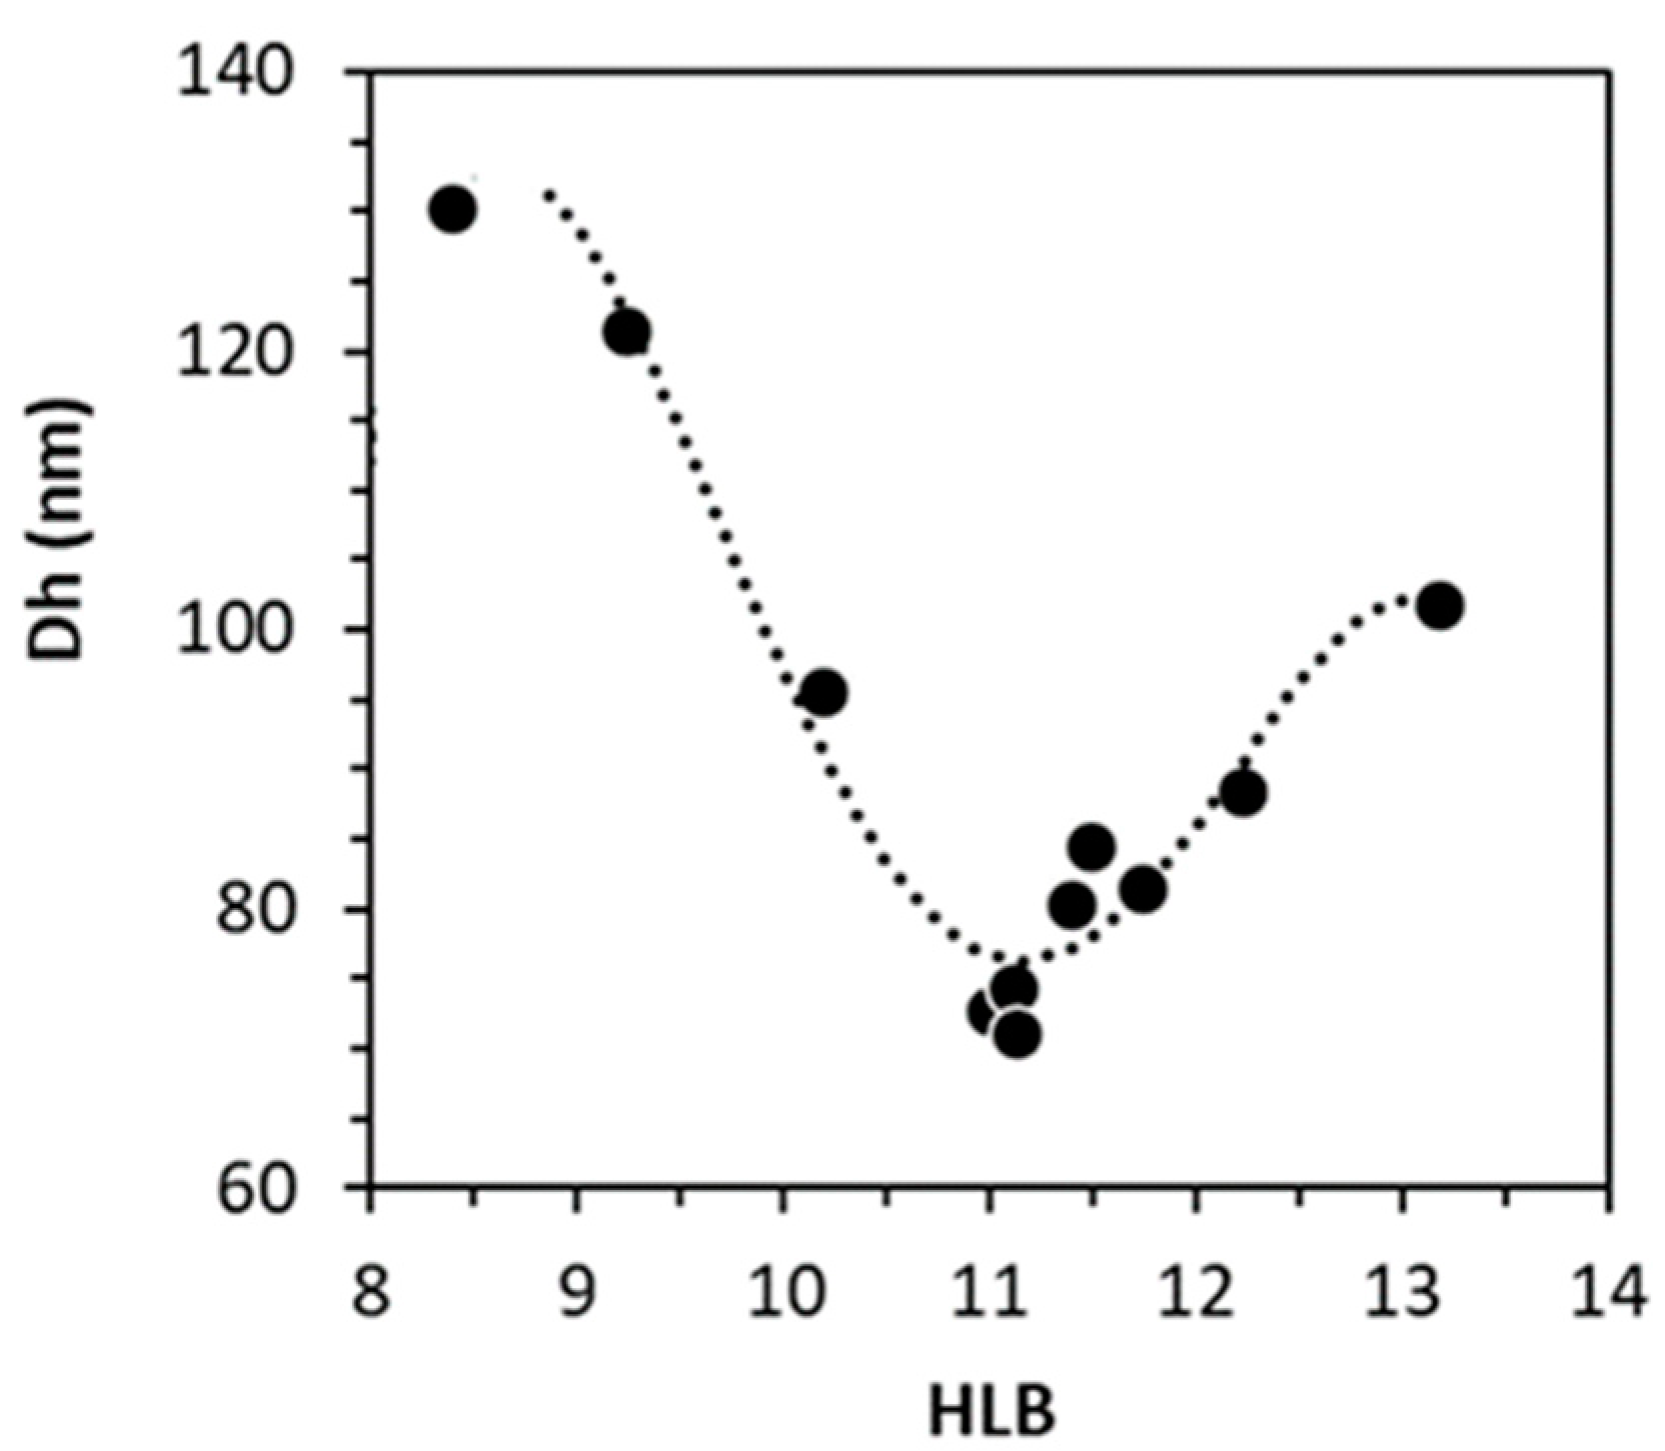
Figure 3.
Determination of Alcolec S HLB. (A) Plot of droplet size as a function of the HLB of argan oil () and PS20 () mixtures, where the HLB of Alcolec S () is unknown. (B) An HLB of 6.08 was determined for Alcolec S using Equation (2). The smallest droplet size was observed where the HLB of combined surfactants closely matched the HLB of argan oil.
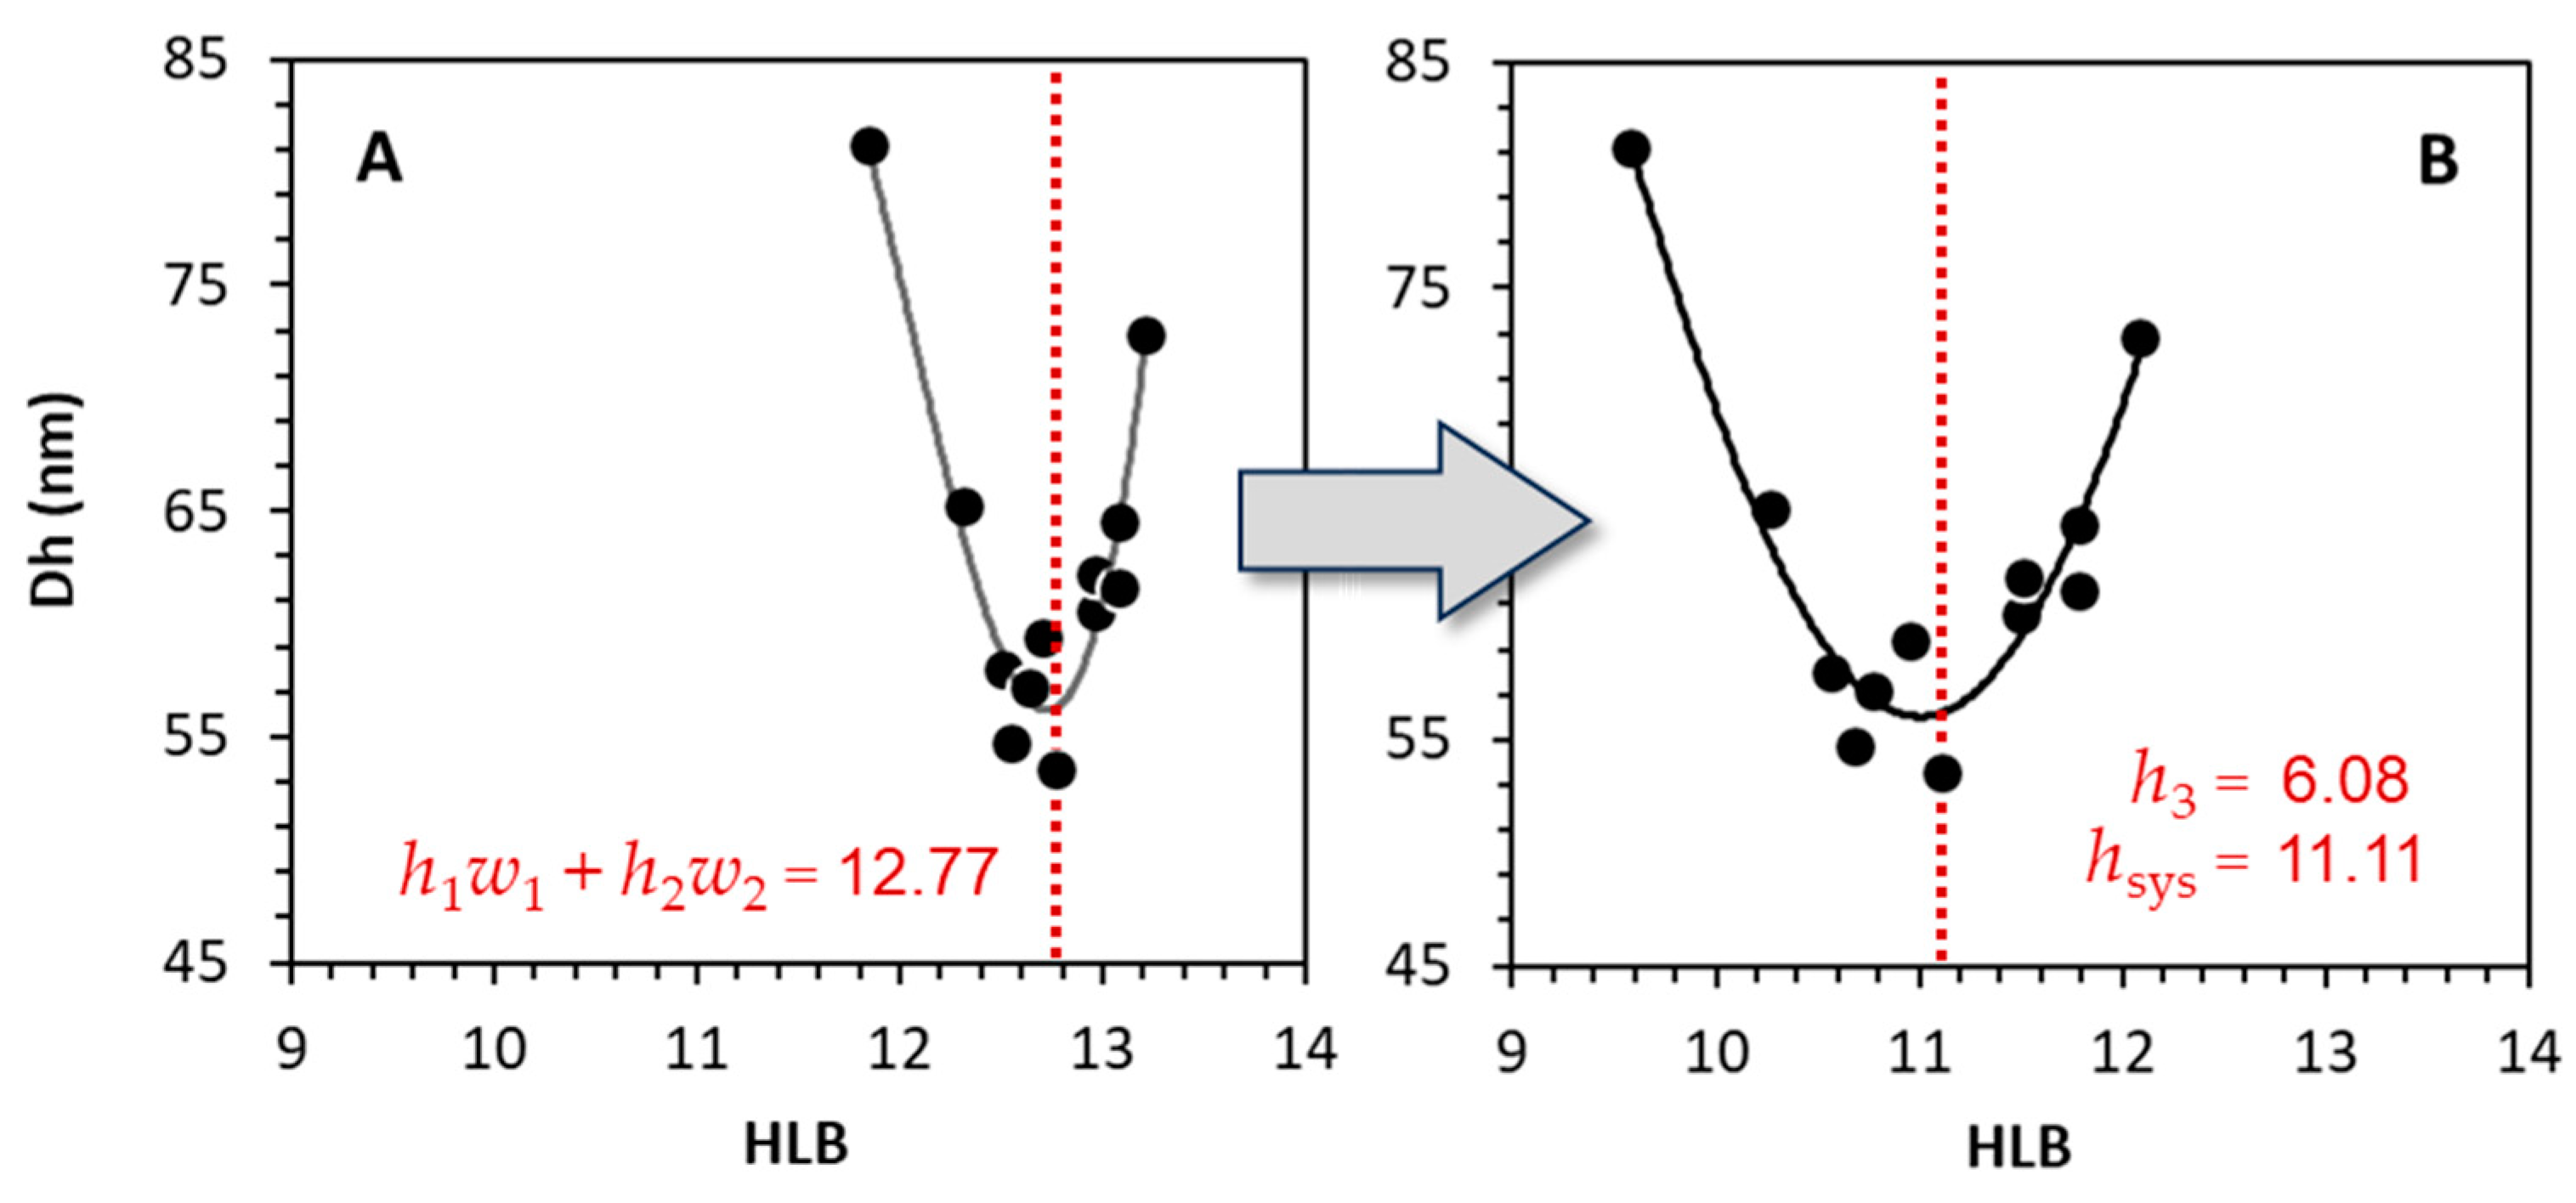
Figure 4.
Determination of BCSO HLB. Experimentally, the smallest droplet size was observed at HLB 16.1. Theoretically, polynomial regression analysis predicted a local minimum at HLB 16.0.
Figure 4.
Determination of BCSO HLB. Experimentally, the smallest droplet size was observed at HLB 16.1. Theoretically, polynomial regression analysis predicted a local minimum at HLB 16.0.
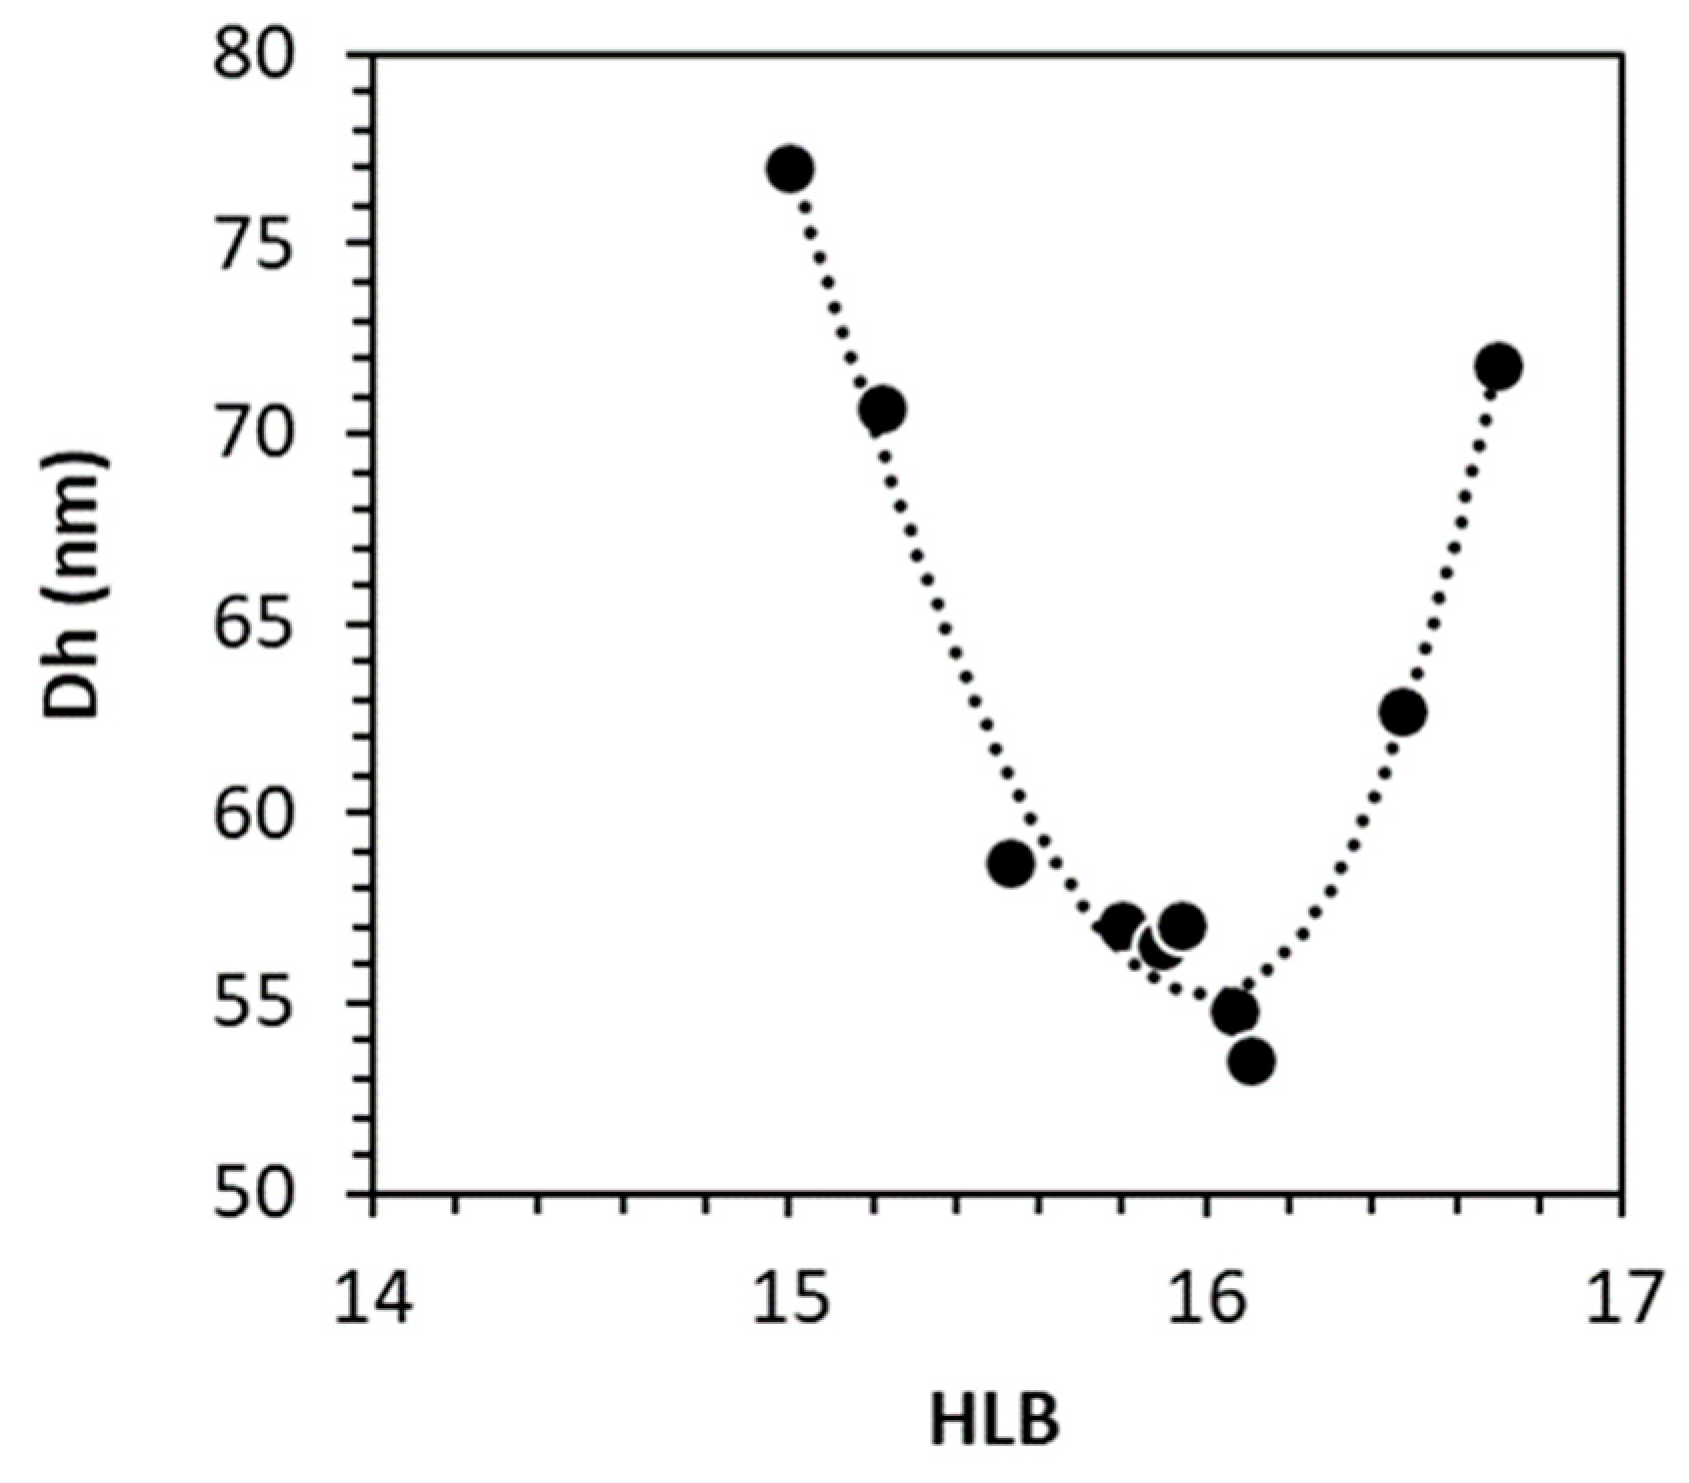
Figure 5.
(A) Determining HLB of the AsX-AO oil phase. Experimentally, the smallest droplet size was observed at HLB 10.81. Interpolation of the best fit polynomial regression line predicted a minimal droplet size occurring at a system HLB of 10.84. (B) Predicted HLB of algae oleoresins (AsX-AO) as a function of AsX concentration.

Figure 6.
Determination of P-LPC-80 HLB in AsX-AO nanoemulsion. An HLB of P-LPC-80 of 12.23 was determined by Equation (2). Interpolation of polynomial regression line showed a local minimum at HLB of 10.8, closely matching the previously determined HLB of AsX-AO.
Figure 6.
Determination of P-LPC-80 HLB in AsX-AO nanoemulsion. An HLB of P-LPC-80 of 12.23 was determined by Equation (2). Interpolation of polynomial regression line showed a local minimum at HLB of 10.8, closely matching the previously determined HLB of AsX-AO.
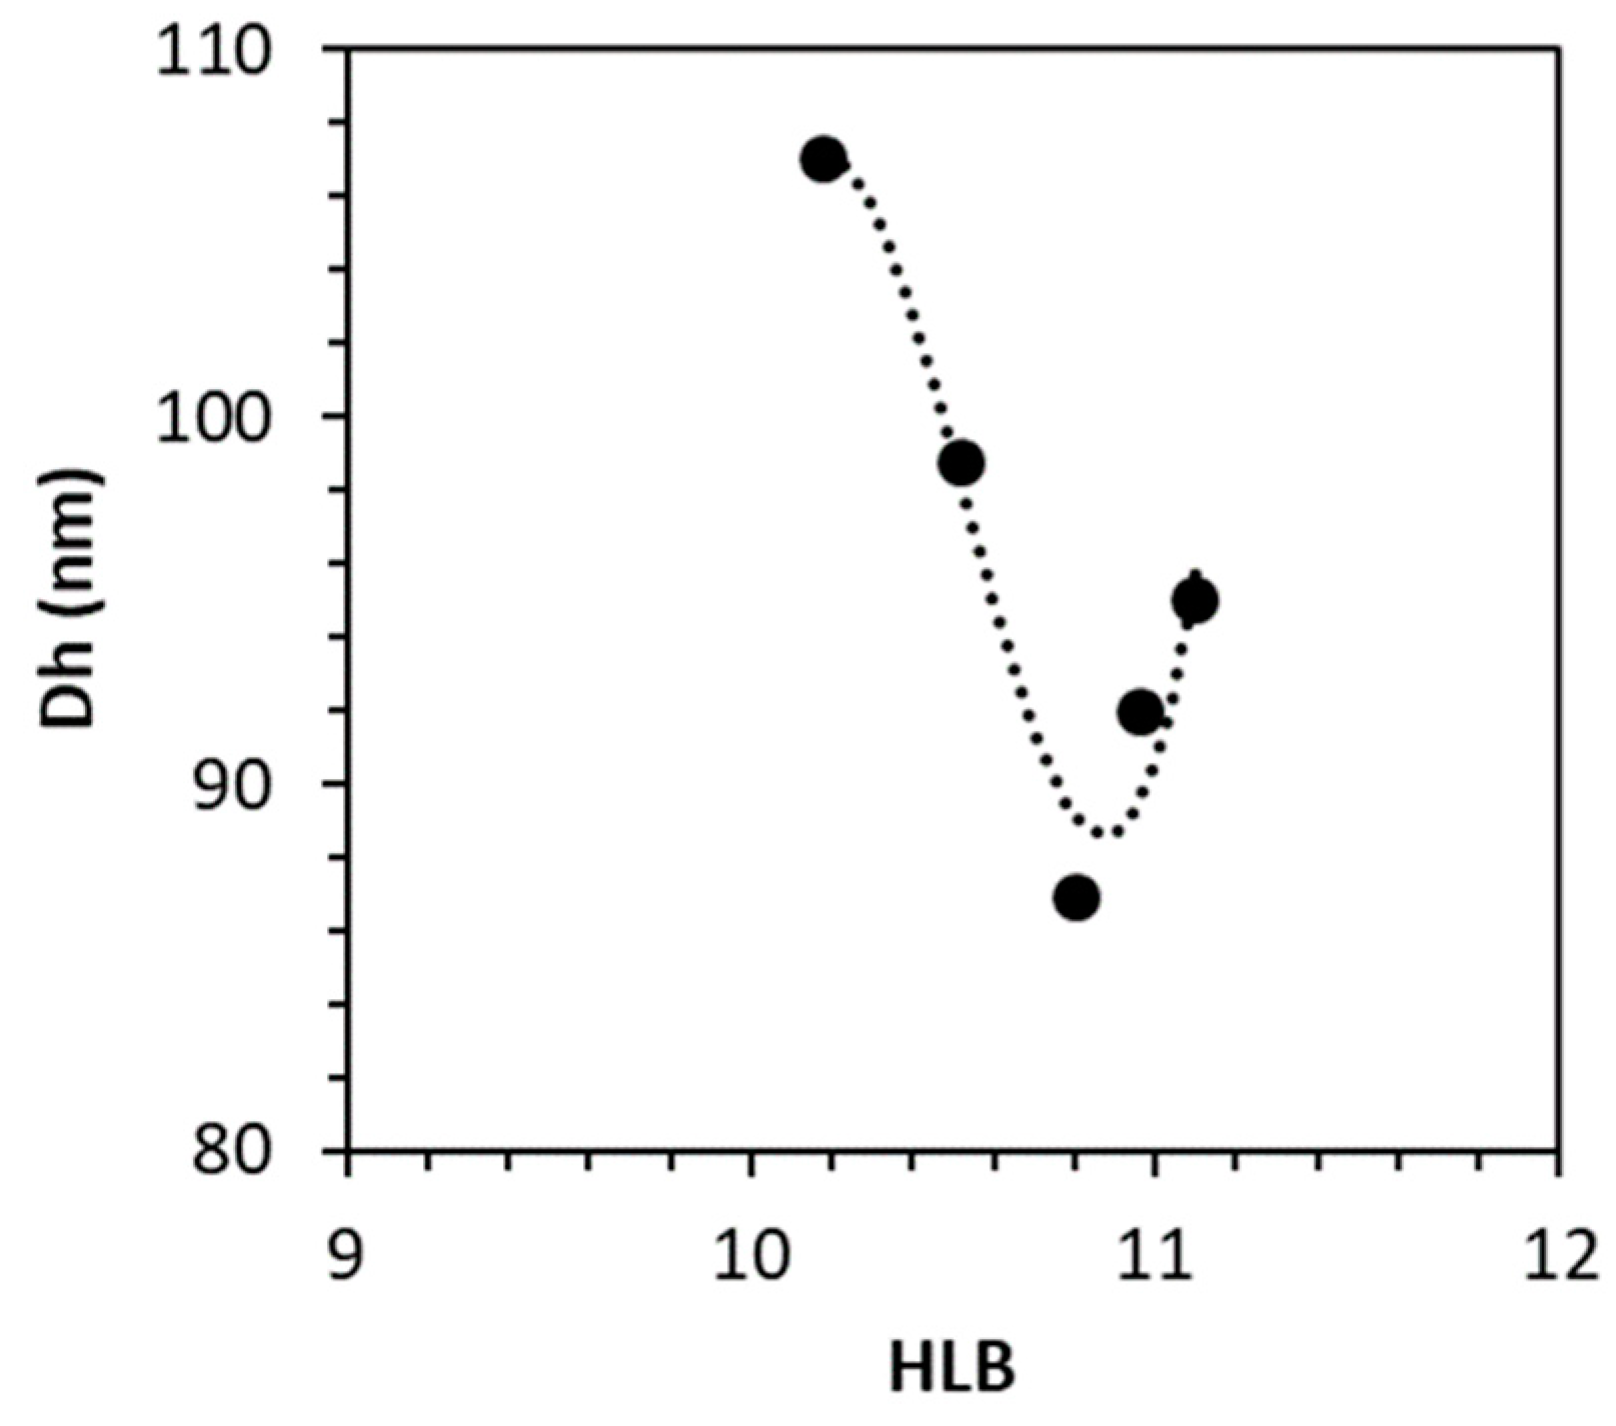
Figure 7.
Determination of Kolliphor EL HLB in BCSO nanoemulsions.

Figure 8.
(A) Linear correlation between turbidity and mean oil droplet size determined by DLS. (B) Absorbance of 10% hemp seed oil nanoemulsions prepared with Phospholipon 85G (HLB = 4.4) adjusted with PS80 to the targeted HLB value. Interpolation of polynomial regression line (r2 = 0.794, n = 11) predicts a local minimum at HLB 9.38 for the virgin hemp seed oil.

Table 1.
HLBs of oils and surfactants used in these experiments.
| Observed * | Interpolated ** | Published rHLB | Reference | |
|---|---|---|---|---|
| oils | ||||
| argan oil | 11.12 | 11.19 | 11.0 | [27] |
| black cumin seed oil | 16.1 | 16.0 | 16.0 | [30] |
| astaxanthin oleoresin | 10.81 | 10.84 | - | - |
| hemp seed oil | 9.5 | 9.38 | 9.0 | [37] |
| lecithins | ||||
| Alcolec S | 6.08 | 5.72 | 4.0 | [28] |
| P-LPC-80 | 12.23 | 12.38 | 9–12 | [14] |
| synthetic surfactants | ||||
| Kolliphor EL | 16.12 | 16.15 | 13–14 | [32,33] |
| PS20 | - | - | 16.7 | [46] |
| PS80 | - | - | 15.0 | [46] |
| Span 80 | - | - | 4.3 | [47] |
* HLB where smallest oil droplet size coincides with matching oil and surfactant phases. Calculated using Equation (2). ** Local minimum from interpolation of polynomial regression line.
Disclaimer/Publisher’s Note: The statements, opinions and data contained in all publications are solely those of the individual author(s) and contributor(s) and not of MDPI and/or the editor(s). MDPI and/or the editor(s) disclaim responsibility for any injury to people or property resulting from any ideas, methods, instructions or products referred to in the content. |
© 2024 by the authors. Licensee MDPI, Basel, Switzerland. This article is an open access article distributed under the terms and conditions of the Creative Commons Attribution (CC BY) license (https://creativecommons.org/licenses/by/4.0/).
Share and Cite
MDPI and ACS Style
Smejkal, G.; Gross, V.; Lazarev, A. Theoretical and Experimental Determinations of the Hydrophilic–Lipophilic Balance (HLB) of Representative Oils and Lecithins. Colloids Interfaces 2024, 8, 21. https://doi.org/10.3390/colloids8020021
AMA Style
Smejkal G, Gross V, Lazarev A. Theoretical and Experimental Determinations of the Hydrophilic–Lipophilic Balance (HLB) of Representative Oils and Lecithins. Colloids and Interfaces. 2024; 8(2):21. https://doi.org/10.3390/colloids8020021
Chicago/Turabian StyleSmejkal, Gary, Vera Gross, and Alexander Lazarev. 2024. "Theoretical and Experimental Determinations of the Hydrophilic–Lipophilic Balance (HLB) of Representative Oils and Lecithins" Colloids and Interfaces 8, no. 2: 21. https://doi.org/10.3390/colloids8020021