
Influence of Surface Roughness on Interfacial Properties of Particle Networks


Department of Sustainable Chemical, Biological, and Materials Engineering, University of Oklahoma, Norman, OK 73072, USA
*
Author to whom correspondence should be addressed.
Colloids Interfaces 2024, 8(2), 17; https://doi.org/10.3390/colloids8020017
Submission received: 15 January 2024
/
Revised: 19 February 2024
/
Accepted: 27 February 2024
/
Published: 4 March 2024
Abstract
:The behavior of colloidal particles near fluid interfaces has attracted significant scientific interest, as particles minimize the contact area between the two fluid phases, stabilizing interfacial systems. This study explores the influence of surface roughness on the properties of particle monolayers at the air–water interface, focusing on colloidal silica particles and fumed silica particles of similar hydrodynamic diameter. This research involves comparing low-surface-area (LSA) and medium-surface-area (MSA) fumed silica particles with spherical colloidal silica particles (250 nm in diameter). Utilizing a Langmuir trough, the interfacial particle networks are compressed and expanded. Analysis of surface pressure isotherms reveals that fumed silica particle monolayers form networks at a lower particle surface coverage compared to spherical particles. The spherical particle monolayer exhibits a higher apparent surface elasticity, indicating greater resistance to the applied compression compared to fumed silica networks. Additionally, monolayers formed by fumed silica particles display hysteresis even after successive compressions and expansions due to irreversible particle interlocking and the formation of multilayered aggregates. These findings provide insights into the impact of surface roughness on the behavior of particle monolayers at fluid interfaces, offering valuable information for designing and optimizing mechanisms involved in emulsion and foam stabilization.
1. Introduction
Studying the behavior of colloidal particles near fluid interfaces has been a subject of great interest among scientists since the initial discovery that the binding of particles to the surface of droplets and bubbles can be used in the stabilization of emulsions and foams [1,2]. Particles can stabilize fluid interfaces by removing the energetically costly contact area between the two fluid phases [3]. For a spherical particle straddling a fluid–fluid interface, the energy input required for particle desorption can be calculated as follows:
where is the particle radius, is the equilibrium contact angle of the particle at the interface, and is the surface (or interfacial) tension between the fluids. For instance, calculating the energy required to desorb a particle of 250 nm diameter straddling the air–water surface at 90° results in 105, where is the thermal energy ( is the Boltzmann constant and T is the absolute temperature). Such high energy associated with the desorption of the particles can lead to their irreversible binding to the fluid interface and can be utilized in the design of ultrastable Pickering emulsions and foams [4,5,6,7,8,9,10,11,12].
In addition to parameters such as particle size and surface chemistry that can be used to enhance their binding energy to fluid interfaces [13,14,15,16,17,18,19,20,21,22,23,24,25,26,27,28], particle geometry can also be exploited as another design parameter in tuning the stability of Pickering emulsions and foams [29,30,31,32,33,34,35]. Examples of anisotropic particle shapes, the performance of which has been studied at fluid interfaces, are ellipsoids [36], nanotubes [34], and fractal-like particles (e.g., fumed silica) [37,38]. Such systems of non-spherical particles are usually dominated by capillary interactions due to the irregular shape of the contact line surrounding the particle surface [39]. These interactions have been shown to be attractive at large interparticle separations [40,41]. Nevertheless, as the interparticle distance becomes smaller, if the direction of surface deformations generated by the contact line pinning around the two approaching particles is not matched, the near field capillary interaction becomes repulsive, as shown by Stebe et al. for microparticle rafts at fluid interfaces [42]. However, not much is known about the impact of surface roughness on the response of the particle monolayer to stresses applied at the interface. Particle-stabilized surfaces are often subjected to different types of stresses; thus, it is important to understand the effects of such roughness on the particle surface in the overall self-assembly and on the dynamics of the resulting monolayer.
Multiphase systems such as foams and emulsions may experience interfacial compressions caused by processes such as Ostwald ripening. Upon extreme compressions, particle-laden interfaces undergo a phenomenon known as collapse, which is defined as the yielding of the particle network upon compression and has been previously associated with the stability of interfacial systems. The mode of collapse upon compression has been studied for particle populated interfaces [43,44,45,46,47]. Horozov et al. found that fumed silica particles have a similar collapse mode to spherical particles at an oil–water interface [47]. However, in contrast to spherical particles, the authors found that fumed silica particles form wrinkles at the inflection point rather than at the collapse point. Finally, they found that regardless of the hydrophobicity, all fumed silica particles possessed similar short wavelengths when collapsed. In contrast, the wettability of spherical silica particles was found to be a governing factor for the collapse mode of the particle monolayer upon compression [43]. While hydrophilic silica particles experienced particle expulsion from the interface as the available area was decreased, hydrophobic particles generated a solid-like network, which collapsed through reversible wrinkle and fold formation. Moreover, it was found that by increasing the ionic strength of the subphase, the expulsion of hydrophilic particles to the bulk was arrested and multilayer creation took place, indicating that particle interactions through the bulk phase also influence the mode of collapse. Additionally, the impact of particle shape anisotropy under extreme compressions has been investigated [48]. It was shown that for ellipsoids of different aspect ratios, a percolation threshold existed under applied compressions, where higher aspect ratios yielded smaller percolation thresholds. Upon further compression, monolayer jamming occurred, locking the particles in their position. After the jamming point, sustained compression resulted in local collapse by ellipsoids, by means of flipping, to accommodate more deformation followed by desorption of the flipped particles from the interface. At later stages of compression, the monolayer exhibited buckling as a whole.
In this work, we have investigated the consequences of surface roughness for the interparticle interactions at the air–water interface and the stability of the resulting particle network under applied stresses. We studied the intrinsic differences between the properties of the resulting interfacial networks formed by spherical particles (250 nm of diameter) compared to monolayers formed by fumed silica particles of a similar hydrodynamic diameter. In order to systematically investigate the impact of particle texture, two types of fumed silica particles were used in these studies, i.e., a low specific surface area (LSA) and a medium specific surface area (MSA). Finally, we examined the surface pressure isotherms obtained from successive compressions and expansions of the monolayers and studied the hysteresis associated with each particle system.
2. Materials and Methods
2.1. Silica Particles
Hydrophilic colloidal silica particles (Fiber Optic Center, New Bedford, MA, USA, nominal diameter of D = 250 nm, calculated specific surface area of 10.5 m2g−1) were hydrophobically modified with Dimethyldichlorosilane (DMDCS, Sigma Aldrich, St. Louis, MO, USA). The modification was performed following a silanization procedure as follows [49]. Briefly, 1 g of the spherical particles was oven dried at 60 °C overnight and dispersed in 10 mL of cyclohexane (Fischer Scientific, Waltham, MA, USA). Next, DMDCS was added (0.1 M) and the dispersion was sonicated in an ultrasonic bath (Fisherbrand™ 11203 Series Advanced Ultrasonic, Waltham, MA, USA) for 30 min. The resulting dispersion was then centrifuged (Legend X1R, Thermo Scientific, Waltham, MA, USA) at 7000 rpm for 5 min and the supernatant was removed via a vacuum line. An additional 10 mL of cyclohexane was added, and the dispersion was sonicated again for 30 min followed by centrifugation and supernatant removal. This process was repeated twice with chloroform and anhydrous ethanol (both purchased from Fischer Scientific), followed by drying the particles in a vacuum desiccator. Hydrophobic fumed (low bulk density) silica particles of low surface area, LSA (CAB-O-SIL® TS610, 125 ± 20 m2g−1), and medium surface area, MSA (CAB-O-SIL® TS622, 195 ± 20 m2g−1), from Cabot Corporation were used as received. All glassware used in this study was base cleaned by a 1 wt% potassium hydroxide solution (KOH, Fischer Scientific) in isopropyl alcohol (Fisher Scientific) overnight before its use. Deionized (DI) water (18.2 MΩ.cm) used throughout the study was generated via Milli-Q® IQ 7000 Ultrapure Lab Water System (Millipore Sigma, Burlington, MA, USA).
2.2. Contact Angle Measurements
Particle-coated slides were prepared by depositing monolayers on the glass substrate via a convective assembly technique [50], which consists of dispersing the particles (either spherical or fumed particles) in ethanol and spreading the dispersion over a glass slide using a syringe pump. Dispersions of 30 wt%, 5 wt%, and 3 wt% were used for the spherical, LSA, and MSA particles, respectively. To perform contact angle measurements, DI water droplets (5 µL) were deposited on the particle monolayer and the resulting droplet contact angle was measured using a tensiometer (Attension Theta, Biolin Scientific, Linthicum Heights, MD, USA) by fitting the drop shape profile.
2.3. Scanning Electron Microscopy
For scanning electron microscopy (SEM, Thermo Quattro S field-emission, Waltham, MA, USA), a drop of particle dispersion at 0.005 wt% was added to a silicon wafer substrate and allowed to evaporate overnight. The resulting wafer was subjected to a sputter coating of iridium (~5 nm) to reduce the charging effects and imaged with SEM under a voltage of 5 kV.
2.4. Dynamic Light Scattering and Zeta Potential Measurements
A 5 mL aqueous particle dispersion was prepared by diluting particles to 0.005 wt.% through the addition of 100 µL of ethanol to 0.25 mg of particles contained in a 20 mL vial. The mixture was stirred, and subsequently 5 mL of DI water was added. The solution underwent sonication for 30 min to achieve complete particle dispersion, ensuring the absence of visible aggregates. Following sonication, the sample was allowed to stand for 1.5 h to facilitate ethanol evaporation. The resulting dispersion was then loaded into a 4.5 mL cuvette and analyzed using a NanoBrook Omni Dynamic Light Scattering instrument (DLS, Brookhaven Instruments, Holtsville, NY, USA) to determine both the hydrodynamic radius and the zeta potential of the particles.
2.5. Langmuir Trough Measurements
A custom-designed Langmuir trough (Nanoscience instruments, Phoenix, AZ, USA) equipped with a microscopy window was integrated with an inverted optical microscope (Olympus IX73 Research Inverted Microscope equipped with Olympus U-LH100-3 12 V 100 W Halogen Lamphouse, Tokyo, Japan) to investigate the response and accompanying microstructural changes in interfacially bound particles to the compression and expansion of the air–water interface carried out by Teflon barriers. The total surface area () at open- and closed-barrier states was 180 cm2 and 25 cm2, respectively. A platinum Wilhelmy plate, oriented parallel to the barriers and attached to a pressure sensor, was utilized to measure the apparent surface pressure ()—defined as the difference between the air–water surface tension () and the effective surface tension in the presence of particles ()—in response to the applied compressions. It should be noted that in the case of complex interfaces, the surface pressure reading results from the combined contributions of thermodynamic (isotropic) and mechanical (anisotropic) responses of the interface to the imposed compression. In order to deconvolute the thermodynamic and mechanical contributions, one may measure the apparent surface pressure with an additional Wilhelmy plate perpendicular to the compression barriers, examine the response of the network as the surface concentration of deposited particles is varied, or measure the characteristic relaxation time of the monolayer [51,52,53]. Moreover, one way of minimizing shear stress contributions is to use a radial trough [53]. Before the addition of particles, the surface area between the barriers was reduced while the apparent surface pressure was monitored. If the apparent surface pressure remained below 0.3 mN/m, we would consider the surface to be clean and the experiment would proceed. The particle dispersion was then deposited at the air–water interface in a dropwise fashion using a 50 μL syringe (Hamilton, Reno, NV, USA), which then spread via the action of Marangoni flows. Ethanol (Fischer Scientific) was used as the spreading solvent. Different amounts of particles were deposited at the interface to achieve a similar range of apparent surface pressures, between the open- and closed-barrier states, across all samples. For spherical silica particles, a total of 2.5 mg of particles was added to the surface, whereas for the case of fumed silica particles, the amount deposited was reduced to 0.5 mg. This adjustment was made due to the fact that the fumed silica samples have a lower bulk density than the spherical silica particles due to their porosity [54]. The particle concentration in the dispersions used in these experiments was 7.5 mg/mL for fumed silica particles and 37.5 mg/mL for spherical particles so that the same amount of ethanol was added to the surface. Evaporation was allowed to take place for 30 min prior to the compression of the interface at a rate of 15 cm2/min. The mode of collapse was determined by extreme compressions of the particle monolayer at the interface, while the resulting microstructural changes were imaged via the inverted optical microscope. From the measured apparent surface pressure isotherms, the apparent isothermal compressional modulus of the interface, defined as , was calculated [55].
2.6. Interparticle Interactions
To estimate the overall interparticle interactions experienced by the particles within the network, and the resulting apparent surface pressures, a surface equation of state was used to interpret the surface pressure isotherms [56]. It is important to note that this analysis assumes that all the contributions to the apparent surface pressure are of a thermodynamic nature and disregards the contributions from the mechanical properties of the network. As shown by Fainerman et al., the surface pressure of a particle monolayer can be related to the particle surface coverage and interparticle interaction parameter via the following equation:
where is the molecular area of the solvent, is the fluid–fluid interfacial area occupied per particle, and is the total surface coverage of the particles at the fluid interface. Therefore, using the information on the total area occupied by the particles at any time, and the corresponding surface area of the trough, one can calculate . We estimated the total area occupied by particles assuming the surface coverage at the inflection point () of the isotherm as a fitting parameter. The inflection point of the isotherm corresponds to the point at which the monolayer has reached the maximum coverage that can be achieved in two dimensions; any further compression beyond this point will cause the monolayer to collapse. The Frumkin interaction parameter () captures the nonideality of interactions (i.e., positive for attractive and negative for repulsive interactions), and is related to the enthalpic contribution to the interactions [56]. We assumed that the ratio goes to 0 since , and used both and as fitting parameters to estimate the limiting surface coverage and interaction parameter that best represents the apparent surface pressure data obtained for the studied monolayers. From the maximum surface coverage (i.e., ) that best fits the experimental data, the area occupied by the particles at the inflection point of the isotherm can be estimated. From the total interfacial area occupied by the particles, we can calculate the number of spherical particles trapped at the interface. Next, the binding efficacy of the spherical particles can be estimated by dividing the total number of particles trapped at the interface by the total number of particles deposited at the interface from the spreading solution (calculated based on the added mass of particles to the interface, their size and density). Due to the complexity associated with the fumed silica particles, such an analysis is not possible to be performed on their respective monolayers.
2.7. Hysteresis Analysis
For a quantitative hysteresis analysis associated with each particle system, the difference between the areas under the compression and expansion curves was evaluated (). This can be understood as calculating the work that is “dissipated” from the system after the completion of the cycle. In addition, since the monolayer might lose some particles after the first cycle, which could reduce the particle surface coverage below the amount required for reaching the collapse point on the subsequent cycles, we define a normalized hysteresis parameter (), by dividing by the product between the total apparent surface pressure () and the total area variation (), as follows:
3. Results
3.1. Surface Characterization of Particles
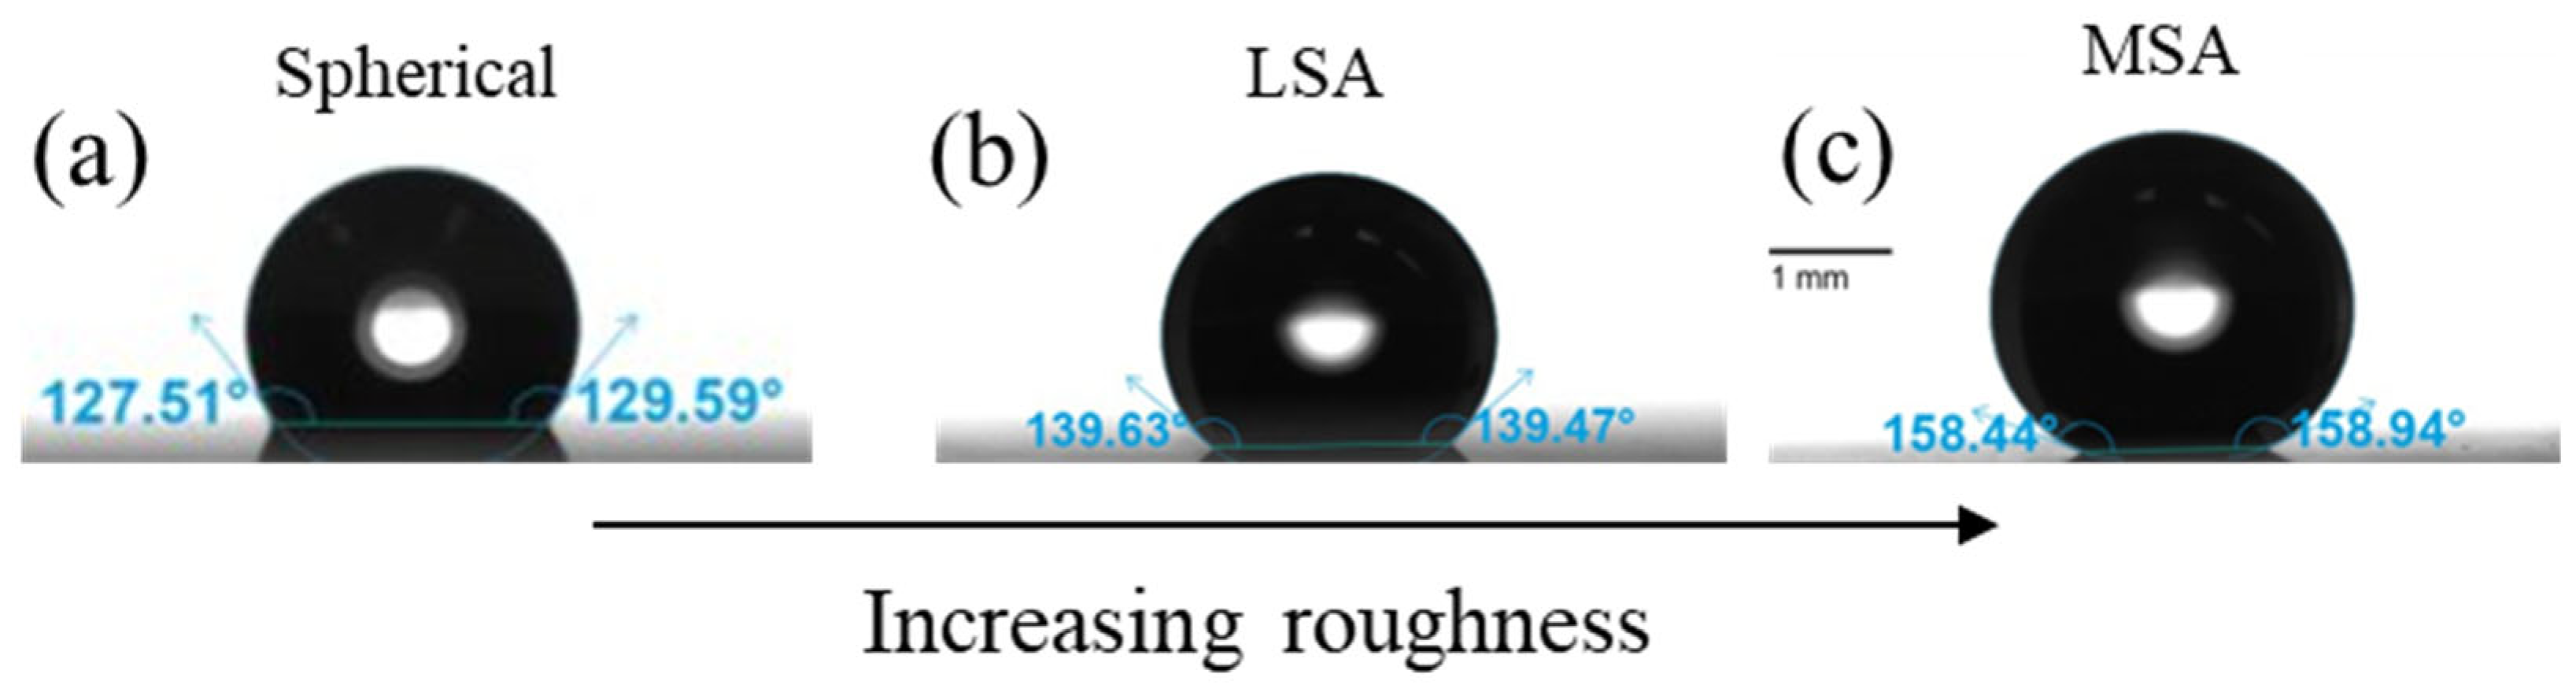
As a means of characterizing the wettability of the particle systems under study, the contact angle of water droplets on a deposited monolayer of particles was measured, the results of which are provided in Figure 1. All particles used in this study exhibit a hydrophobic character, which originates from the replacement of the silanol groups on the surface of silica particles with silane. Since the contact angle measurements were carried out on a particle-coated slide, the roughness associated with the particle monolayer enhances the measured wettability of the surface as expected [57]. Since the surface is far from smooth, the measured contact angle () can be represented by the Cassie–Baxter equation (, where is the relative surface fraction of either solid or air in percent), which considers the air that is trapped between the particle surface and the drop and how it enhances the hydrophobic character of the surface, changing the actual contact angle of the solid surface () [57]. This effect is expected to be more prominent on surfaces with higher roughness, which is the observed trend in Figure 1; as the specific surface area increases from spherical to LSA and MSA particles, the measured contact angle also increases.
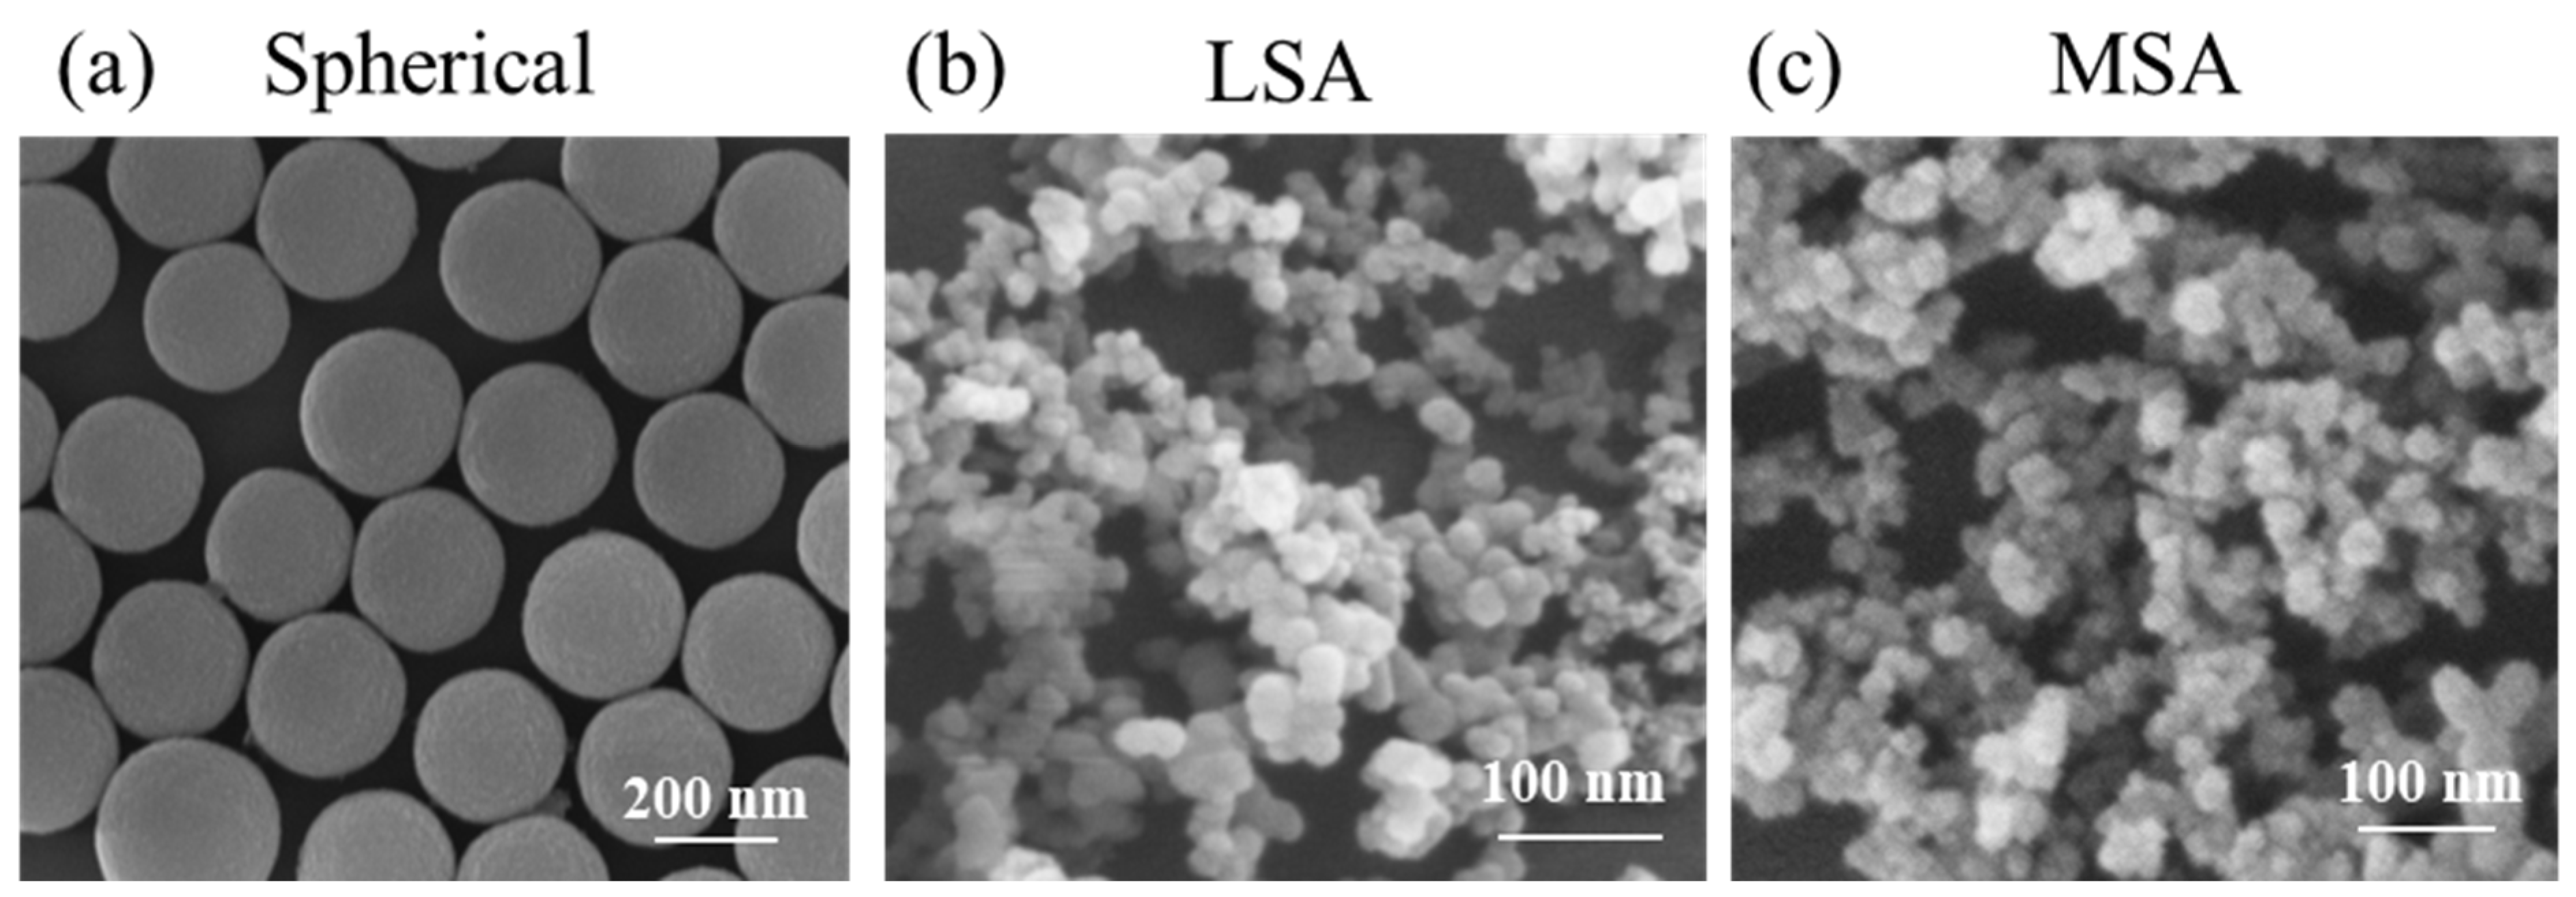
SEM pictures of the particles used in this study are shown in Figure 2. The spherical particles are highly monodispersed with a diameter of 283 ± 30 nm, whereas the fumed silica particles are made from smaller nanoparticles (~20 nm) that are fused together, forming a fractal-like structure. Figure 2b,c shows a magnified image of the fumed particles in which the individual entities that form the particles and the larger aggregates are visible. Since a size estimation cannot be achieved for fumed silica particles based on the SEM images, we investigated their hydrodynamic size via DLS measurements (see Table 1). From this perspective, it is possible to note that even though remarkably different in their surface area and roughness, when dispersed in water, spherical and fumed silica particles used in this study possess a similar hydrodynamic diameter (in the range of 190–320 nm). Additionally, all particle systems exhibit a zeta potential of comparable magnitude and thus their electrostatic interactions at the interface are assumed to be comparable.
3.2. Monolayer Formation and Response to Compression
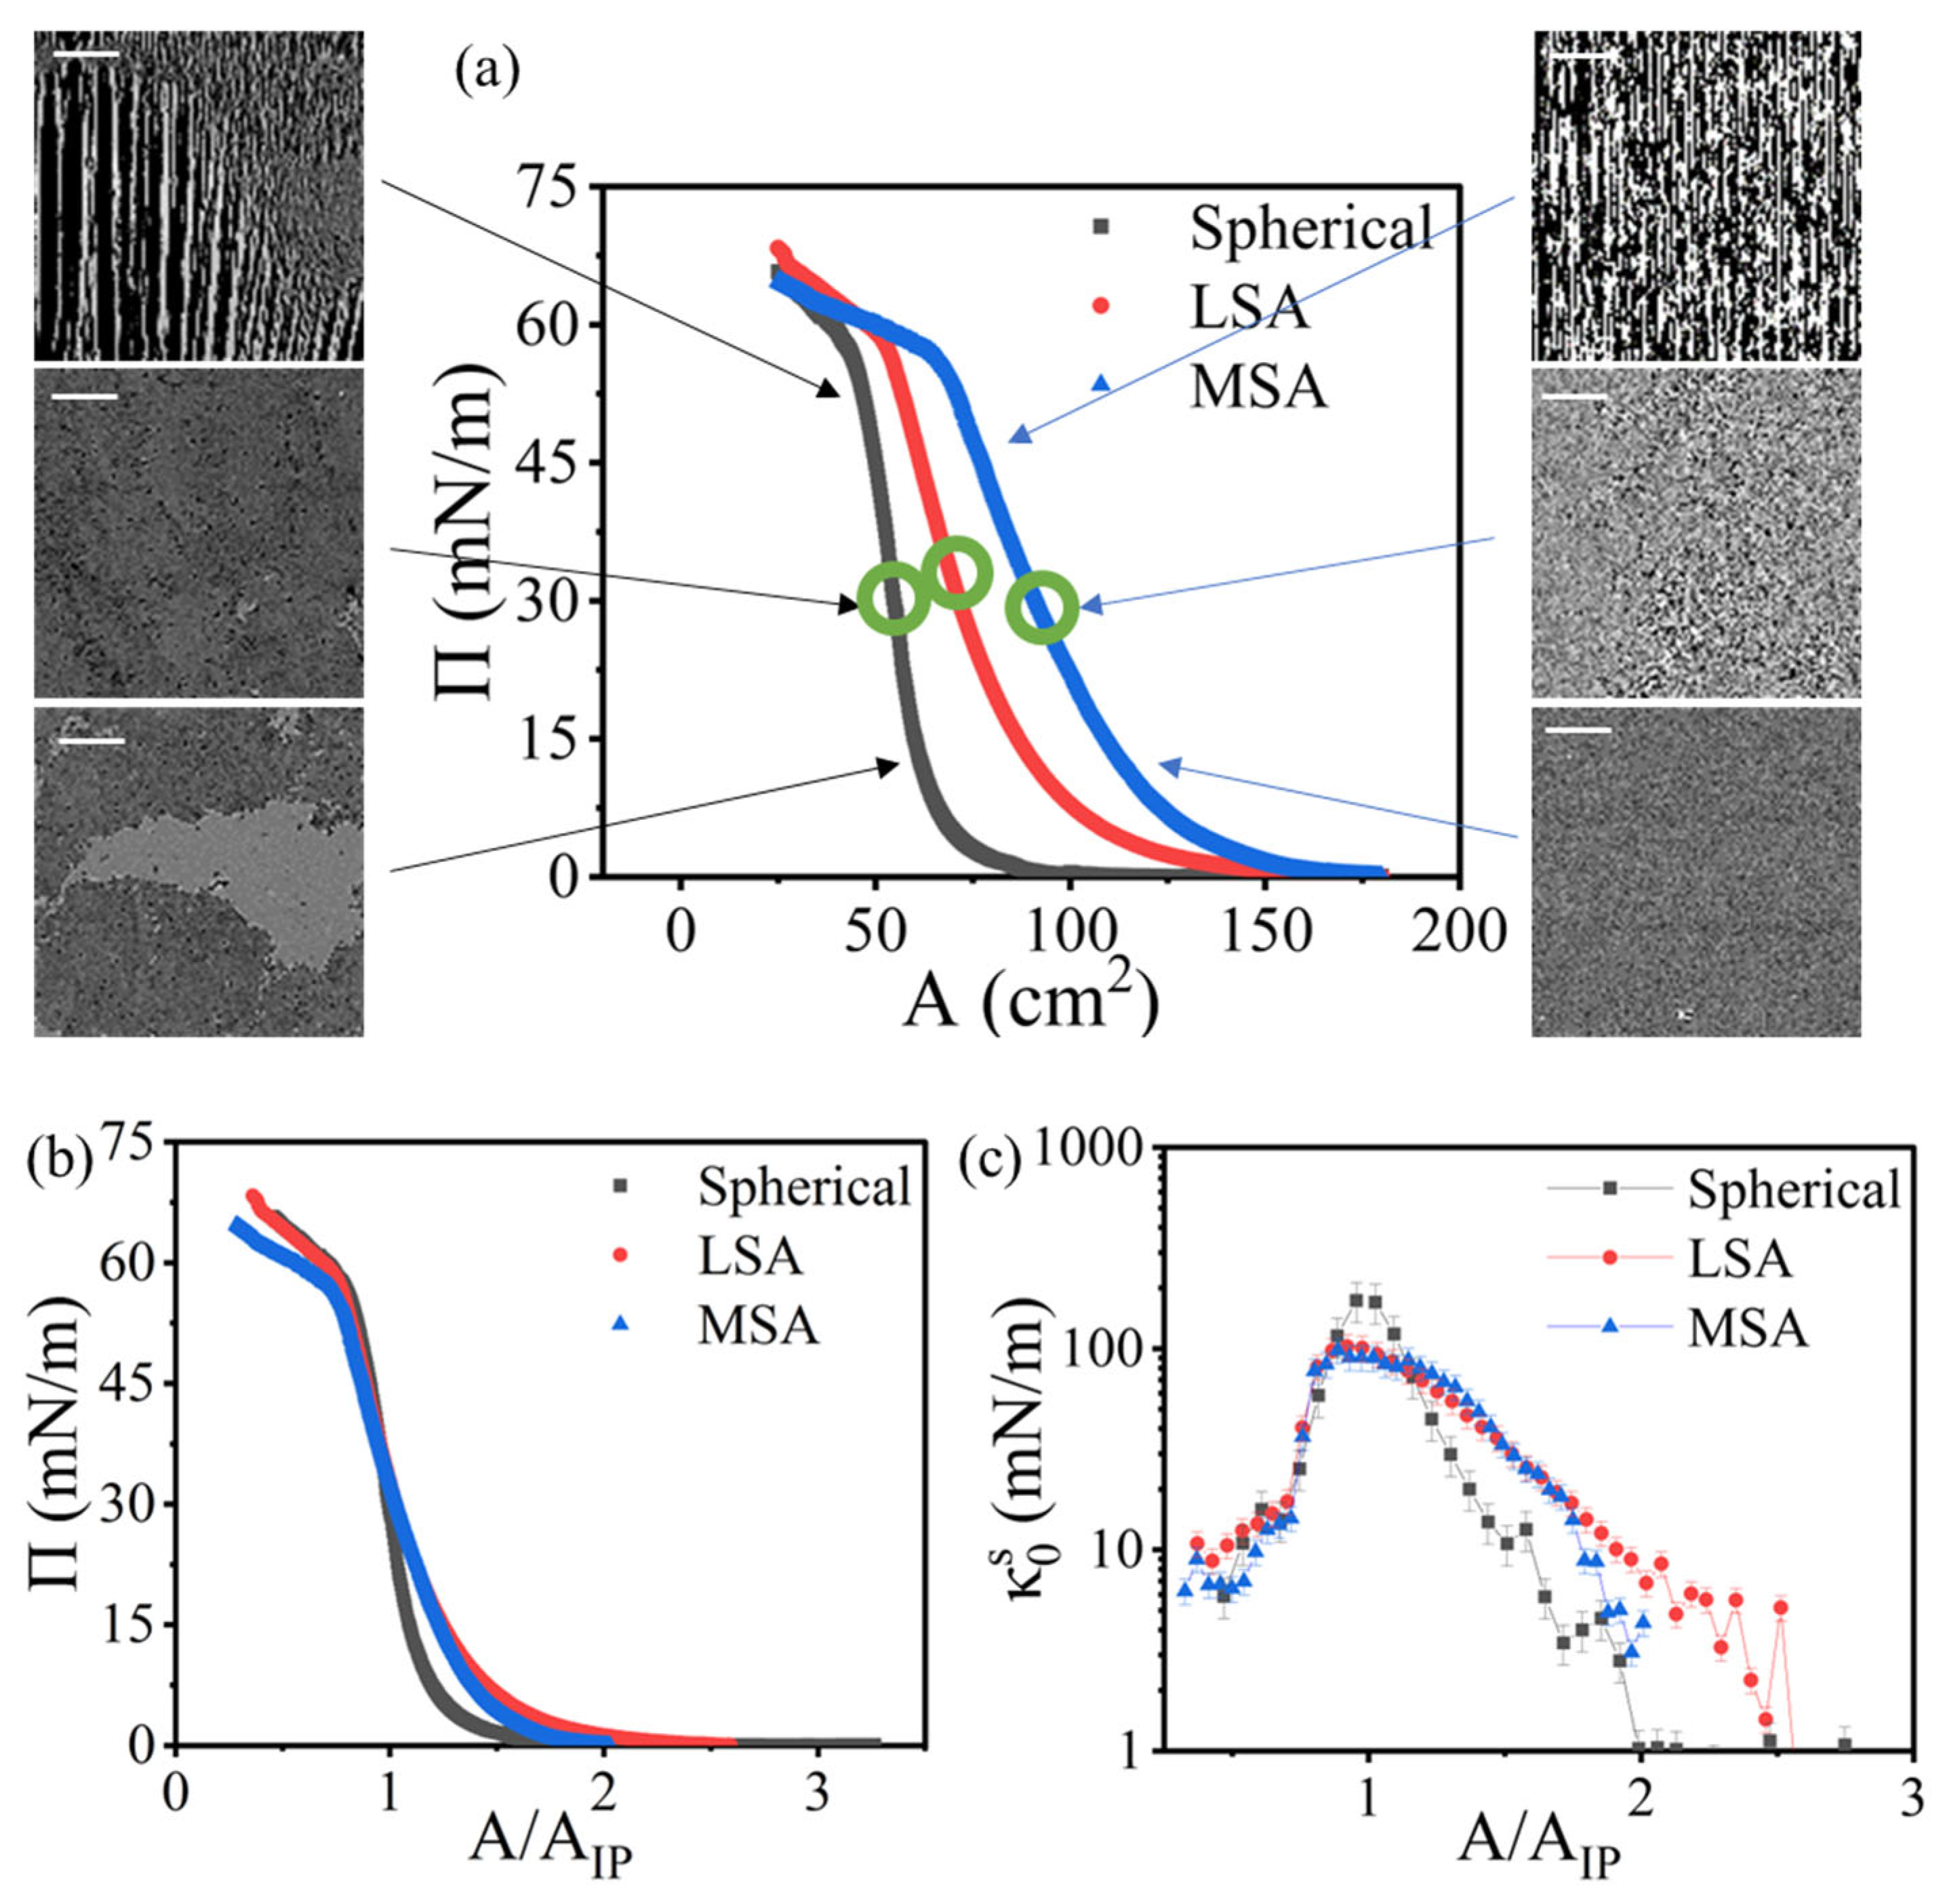
The surface pressure isotherms for the three particle systems are shown in Figure 3a. The reason for the different amounts of deposited particles at the interface is to capture and compare the entire phase space upon compression, from a gaseous state where the apparent surface pressure is negligible up to the collapse of the monolayer upon compression and beyond, as indicated by the kink present in all the curves at high apparent surface pressures. Figure 3b depicts the same isotherms normalized with their area at the inflection point. The inflection point can be associated with the maximum surface packing of the monolayer prior to collapse. In Figure 3c, the corresponding isothermal compressibility modulus () is plotted with the normalized area.
It is worth noting that despite depositing the same mass of particles for both fumed silica particles, the MSA sample exhibited an apparent surface pressure that was higher than LSA at similar trough areas. This indicates that either the amount of MSA particles trapped was higher or that they were able to form a network at a lower surface coverage (i.e., at a larger trough area). It is possible to determine the percentage of trapped particles for the spherical sample, since its cross-sectional area is known (Table 2), as described in the methods section. However, this is not a trivial task for the case of fumed silica particles due to their irregular shape. From the perspective of the normalized isotherms (Figure 3b), it is possible to state that there is indeed a network formation for both fumed silica particles occurring at less compressed, more open area states when compared to the spherical sample. However, both LSA and MSA curves overlap throughout the normalized area span, which indicates that the generated monolayers have similar structural properties. This is further shown in Figure 3c. From this analysis, it can be deduced that MSA particles have indeed a better trapping efficiency than LSA particles. This might be due to the fact that MSA particles are more porous than LSA particles, which decreases their overall bulk density [58]. It can be observed that the spherical particles reach a higher than both fumed silica particles, indicative of a network that exhibits a higher resistance to compression (Table 2). This behavior can be explained by the fact that the fumed silica particles are inherently porous, thus allowing for particle interpenetration and flexing of the network (see the Supplementary Video S1 on MSA compression).
3.3. Thermodynamic Model Fit to the Measured Surface Pressure Isotherms
As depicted in Figure 3a, as the monolayer is compressed, the particles populating the interface are pushed closer together, which forces them to interact at closer ranges. These interactions give rise to the apparent surface pressure rise recorded by the Wilhelmy plate. For colloidal particles straddling fluid interfaces, both attractive and repulsive interactions may be experienced, depending on a number of factors, such as particle characteristics and fluid properties. An earlier study on interfacially trapped hydrophobically modified spherical particles (250 nm) revealed that the predominant interaction influencing the network formation is the capillary interaction arising from the non-uniform pinning of the three-phase contact line [59]. These interactions are usually more prominent as we move away from isotropic particles towards systems containing chemically anisotropic particles (i.e., Janus or patchy particles) [40,60,61,62,63,64], or shape anisotropic particles [65], as well as the rough silica particles used in this study.
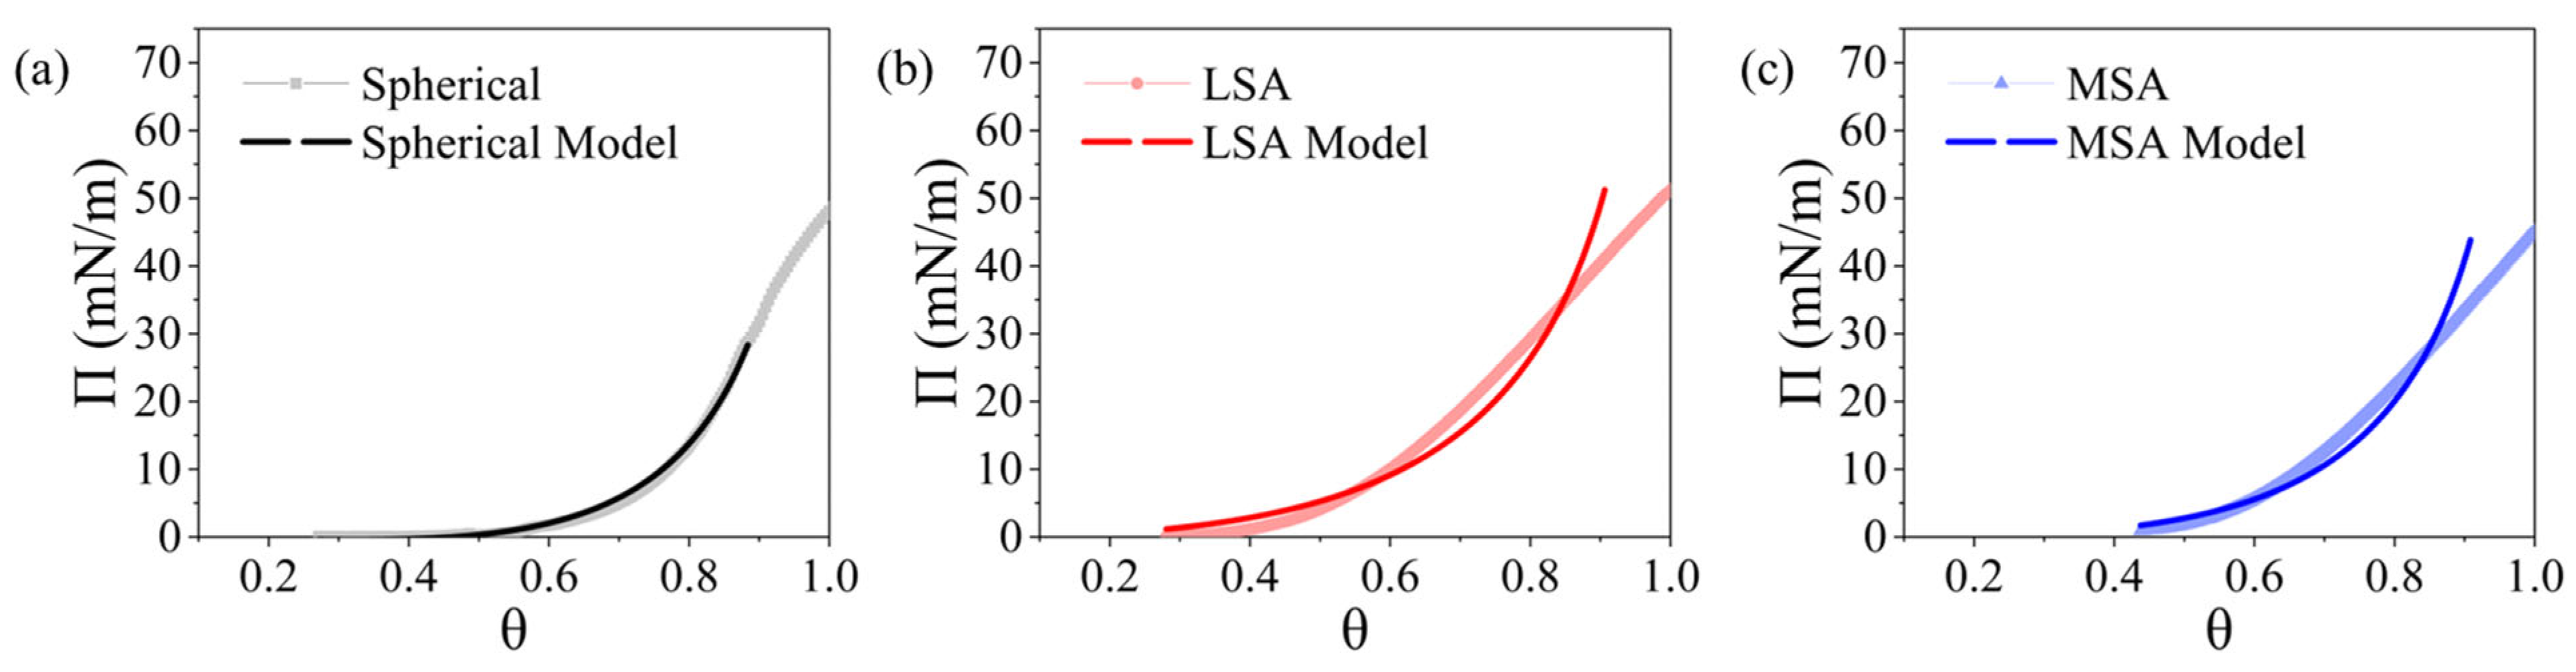
By utilizing an equation of state, one can estimate some physical parameters of relevance for the particle monolayers. Figure 4 depicts the best fit results to the experimentally obtained apparent surface pressure isotherms that were generated via Equation (2) as a function of the particle surface coverage () with the resulting best fit parameters provided in Table 2. For the case of spherical particles (Figure 4a), there is a good agreement between the fit to the model and the experimental isotherm, indicating that the model can adequately represent the physics of the system in this case. Since the model in Equation (2) is based on an equation of state that depends on thermodynamic state variables (e.g., and ), from the good agreement between the model and the experimental data, it can be further deduced that the observed surface stress response is dominated by thermodynamic contributions, as opposed to rheological properties, in the case of spherical particles. In contrast, the equation of state lacks the important features to capture the behavior exhibited by monolayers of fumed silica particles, especially at high surface coverages. Therefore, the measured surface stress is not only due to the thermodynamic state of the monolayer but also encompasses the rheological properties of the network [51]. As such, a constitutive model and proper material functions are needed to accurately describe the obtained response in case of a network formed by fumed silica particles. As the particle clusters are brought closer upon compression, the undulated contact lines pinned around the particle rafts begin to overlap, creating a complex network of capillary interactions for the case of fumed silica particles.
With respect to their estimated highest surface coverage, the monolayer formed by the spherical particles occupies ~88.5% of the available surface, which is close to the maximum hexagonal close packing of 90.7% (hcp) arrangement at the interface, indicating a uniform packing in this case [66]. For fumed silica particles, both LSA and MSA samples converged to the maximum allowed packing of 90.7%, or the hcp. This value was set as the upper bound limit for the packing of fumed silica particles to avoid any non-physical results for the packing fraction. However, it is important to note that due to the interpenetration of fumed silica particles, which could take place under the applied compressions, these particles are likely to pack more densely than the assumed value of hcp used as the upper bound.
When comparing their interaction parameter , the spherical particles exhibited the highest value, followed by MSA and LSA. This can be explained by the magnitude of interactions being experienced by these particles when brought closer together as a result of the applied compression. Spherical particles are likely to experience interactions of higher magnitude given the fact that their hydrodynamic size is bigger than the fumed silica particles and that they act as a rigid body. In contrast, fumed silica particles can accommodate some of the stresses with deformation since they are porous structures. Additionally, we expect the overall fumed silica network to behave less attractively and more repulsively due to the higher likelihood of mismatch between contact line undulations as the particles approach each other. It is important to note that even though the capillary interactions are complex at small distances, with regions being attractive and regions being repulsive, at larger distances, they are more likely to be attractive since there is room for particle rotation and rearrangements, as estimated from the fittings [41]. Since we are assuming a single value for throughout the compression, these factors are convoluted and an overall average is considered.
3.4. Collapse and Hysteresis
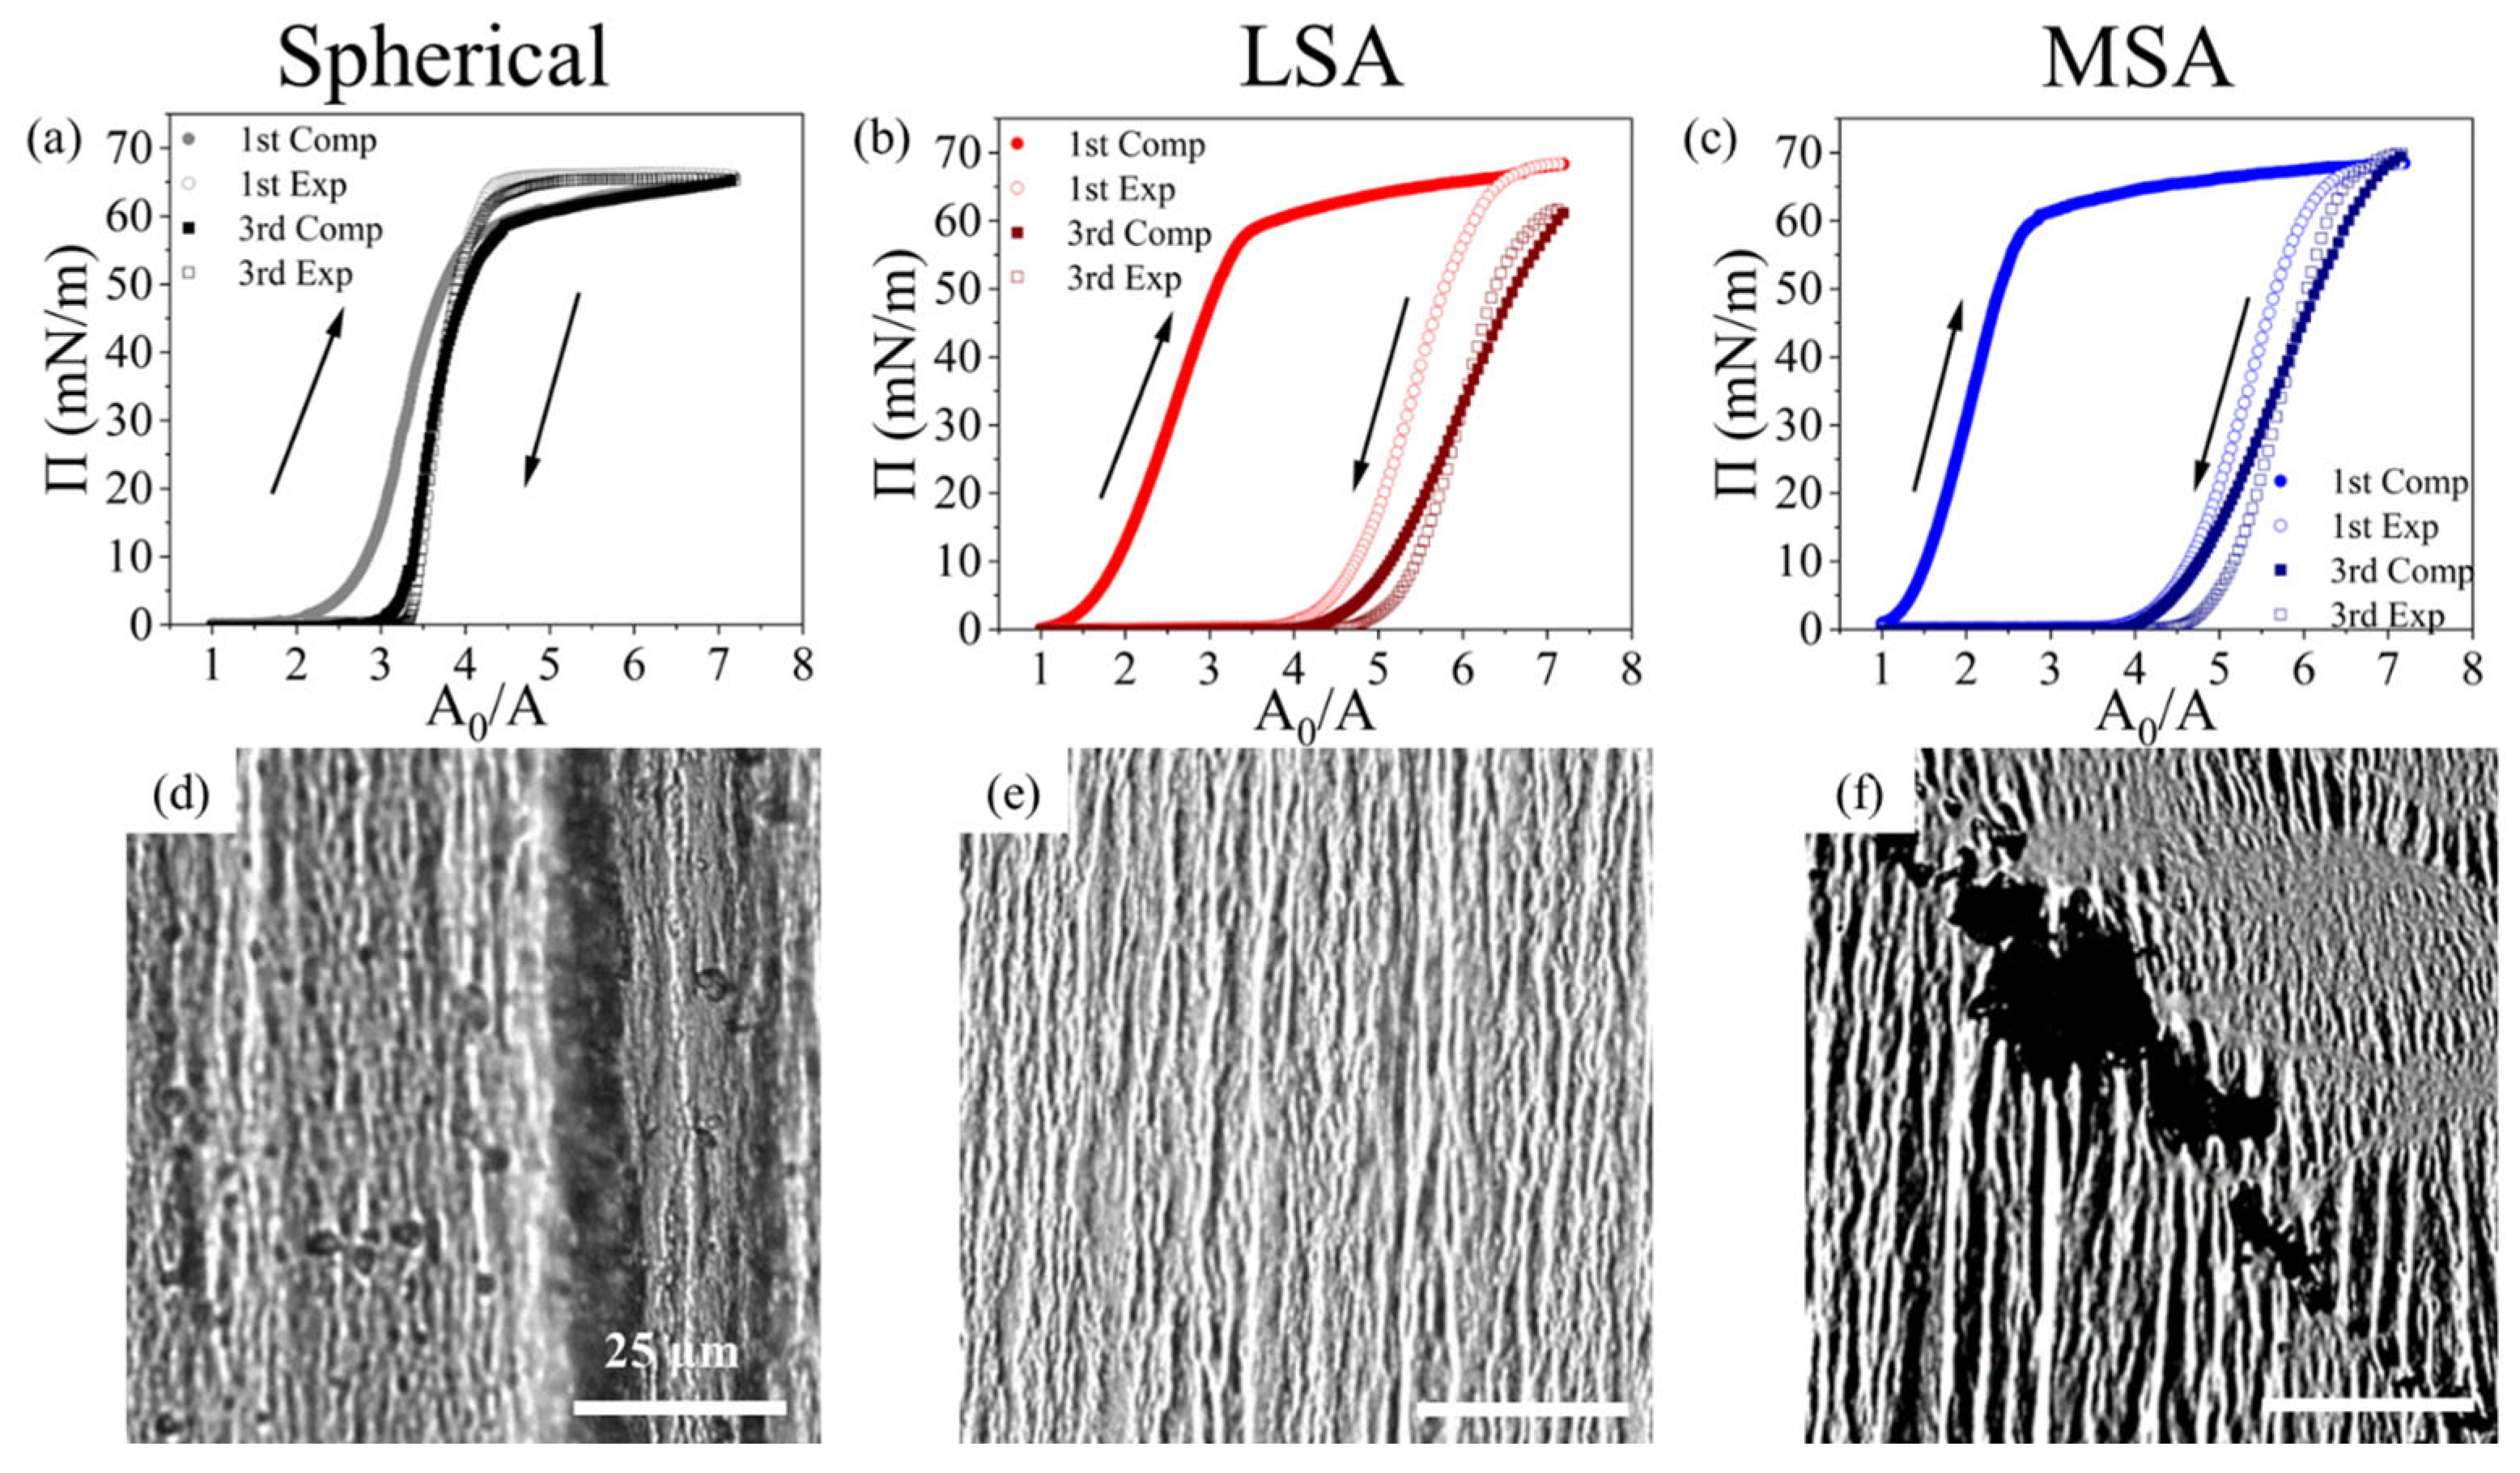
Analysis of the isotherm hysteresis obtained for the particle networks undergoing compressions and expansions can inform us on the nature of interparticle interactions. When subjected to compression and expansion cycles, the monolayers might experience hysteresis since the applied work during the compression part of cycle might be lost, which could lead to the expansion leg of the cycle taking a different path. This behavior is illustrated in Figure 5, which shows the first and third cycle of compression and expansion for all systems under study.
One can quantify the amount of shift on the inflection point from one compression to another, which is associated with either particle desorption or monolayer compaction by calculating the relative difference between the inflection point area. For the systems under study, the spherical particles depict the least difference, with only a 5.9% shift in the inflection point after the first compression. However, fumed silica samples show much higher inflection point shifts estimated to be 54.2% and 66.4% for LSA and MSA, respectively. Therefore, there is a 10-fold increase in the shift when comparing the data for spherical particles to those of fumed silica particles, likely caused by particle interpenetration followed by interlocking in the latter case.
For the spherical particles, it is possible to note in Figure 5a that there is hysteresis between the first compression and expansion. However, for the third cycle, the difference between the compression and expansion curves is minimized, indicating that the monolayer was compacted during the first cycle. Figure 5b shows the same curves for LSA samples, where it is possible to notice two major differences in comparison to the spherical sample. The first contrast is that there is a much larger difference between the first compression and the first expansion curves in the case of fumed silica particles. A similar behavior was captured for MSA monolayers shown in Figure 5c. The second difference between the round and rough particles is that for the latter, even at the third compression and expansion cycle, the two curves are not overlapping, in contrast to what is observed for the case of spherical particles. The bigger hysteresis experienced by both fumed silica monolayers indicates that they are undergoing a larger irreversible change than the one experienced by the spherical particles.
To further investigate the processes that are taking place within the monolayer, in response to the applied compressions and expansions, direct visualization via an optical microscope was carried out in tandem with the experiments on the Langmuir trough. By analyzing the images of the monolayer beyond the collapse point, we can see that the monolayer formed by spherical particles collapses via buckling, generating large folds (Figure 5d). However, both fumed silica monolayers show a smaller degree of wrinkling upon compression (Figure 5e), accompanied by the appearance of darker patches. These regions form at the edge of two rafts that are being pushed together where the particles undergo subduction, followed by the generation of multilayers (Figure 5f). This behavior has been previously reported for Janus particles and attributed to anisotropic stresses present at the interface caused by the random orientation of Janus particles [44]. It is likely that, in our case, fumed silica particles are able to interlock with themselves, forming denser aggregates and generating a state of anisotropic stresses in the monolayer, which are visible in Figure 5f, characterized by the various orientations of the wrinkles present in the frame. These aggregates, once formed, do not separate during the expansion leg of the cycle as discussed before, which corroborates the interlocking idea. Both factors contribute to the irreversible character of the process imposed on the monolayers.
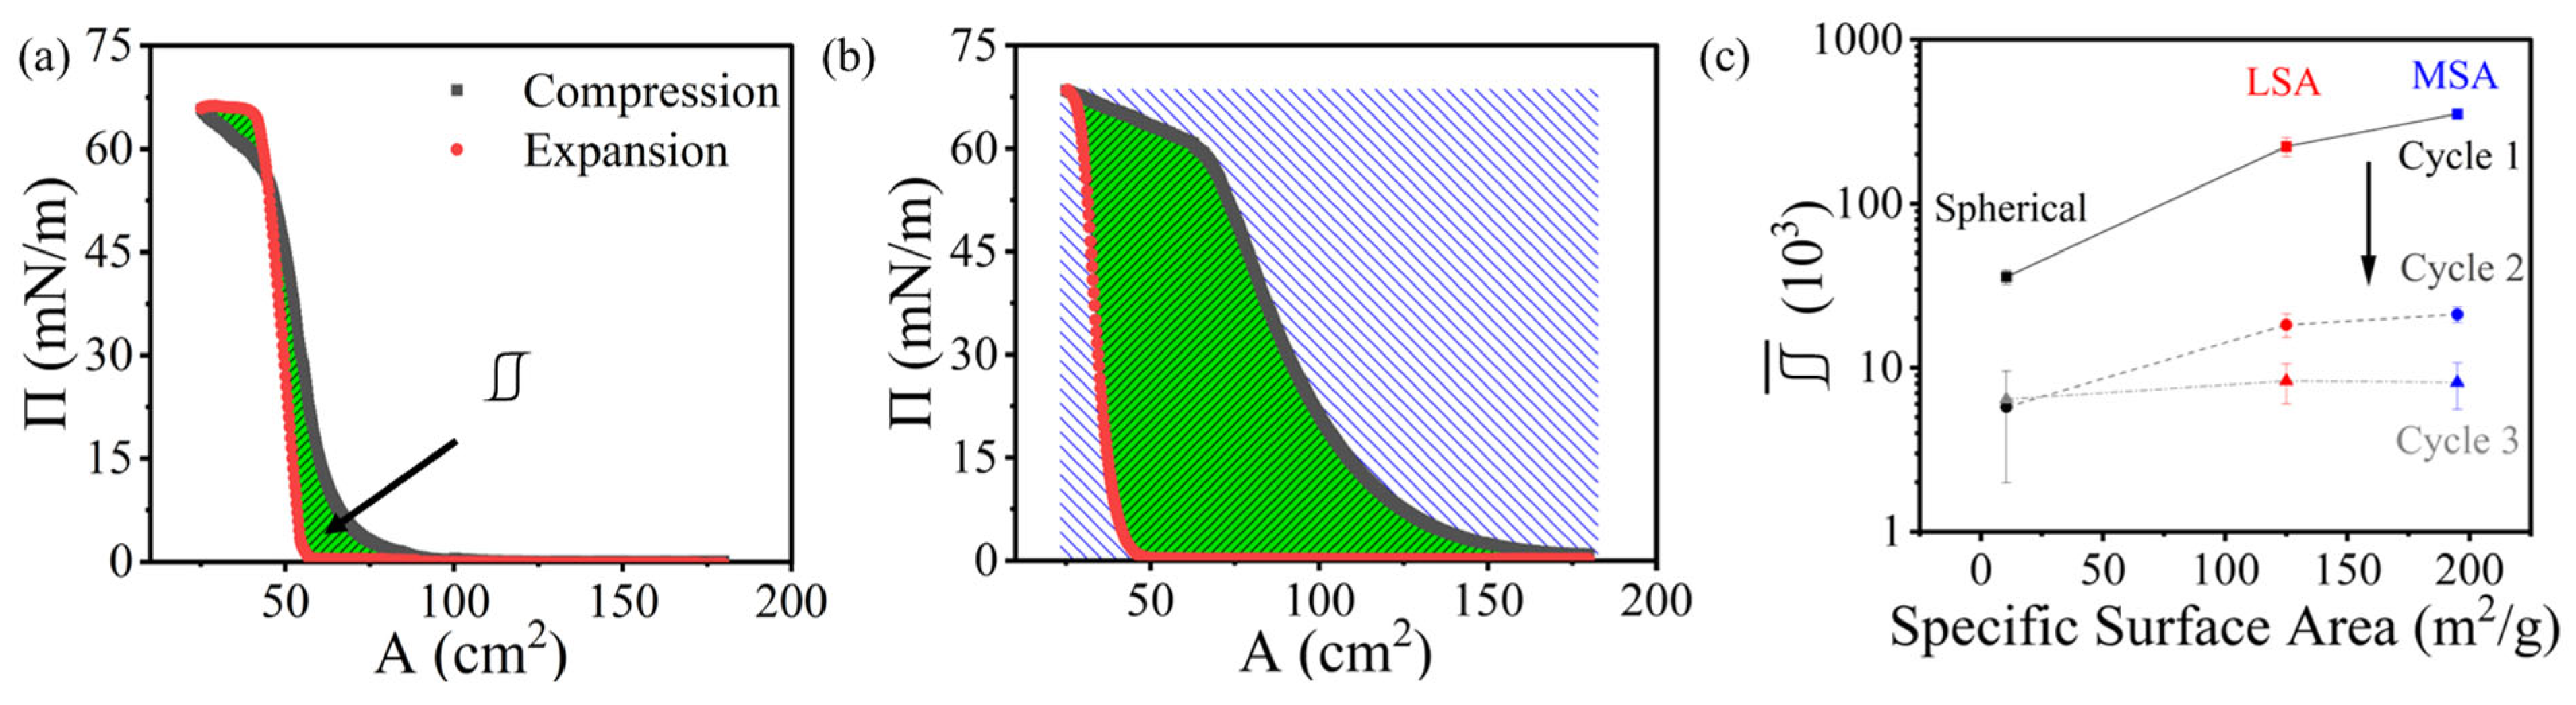
The hysteresis experienced by each particle network can be quantified by calculating the work that is added to the system upon compression and “retrieved” from the expansion (Equation (3)). This is analogous to a piston cell in 3D, where the work applied to compress a gas can be calculated based on the pressure and volume differences from start to finish. However, it is important to highlight that unlike the 3D analogue, the monolayer is not carrying out work to open the barriers on the expansion leg of the isotherm. Figure 6 shows examples of how the hysteresis coefficient was calculated for monolayers formed with the spherical particles (Figure 6a) and MSA particles (Figure 6b). Figure 6c shows the results for the normalized hysteresis parameter () as a function of the specific surface areas for each sample at different cycles of the isotherm. For all cycles, there is a direct dependency between and the specific surface area, where MSA particles show hysteresis one order of magnitude larger when compared to the spherical particles. After the first cycle, cycle 2 shows a decrease in the areas between the compression and expansion curves for all particles. By going from cycle 2 to 3, no change is observed in for spherical particles, whereas there is a consistent reduction in with the cycle number for fumed particle samples. From these results, we can infer that once the monolayer of spherical particles undergoes the first round of compression and expansion, it remains unchanged upon further compressions. However, fumed silica particles show a persistent decrease in as the cycles of compression and expansion are performed, which could be attributed to microstructural changes taking place that are of irreversible character (Figure 5f).
4. Conclusions
In this work, we examined the consequences of introducing surface roughness into colloidal particles on their resulting behavior at the air–water interface. We illustrated that there are differences between the interfacial properties of the monolayer when comparing spherical particles to two types of fumed silica particles (LSA and MSA). It was found that MSA particles are more surface active than LSA particles; however, both fumed silica particles generate a monolayer that behaves similarly upon compression. When compared to the monolayer formed by the spherical particles, fumed silica particles create a network that has a lower magnitude of the apparent surface modulus, possibly due to its porous structure. In addition, the network formed with fumed silica particles spans over larger trough areas, which could be attributed to the complex long-range capillary interactions taking place due to the roughness of particles. We analyzed the obtained surface pressure isotherms using a thermodynamic model. It was found that the employed equation of state is proper for modeling the behavior spherical particles, indicating that the thermodynamics is the governing factor in their interfacial response. In contrast, the thermodynamic model could not capture the physics taking place within the monolayers of fumed silica particles, especially at smaller particle distances. Since fumed silica particles possess an irregular structure, they create a complex network of capillary interactions, especially at high particle surface coverages. The rheological contributions to the surface stress cannot be captured by the thermodynamic model; as such, qualitative comparisons based on the model need to be made with caution. The measured apparent surface pressure isotherm from successive compression and expansion cycles depicted that the monolayer formed by spherical particles collapses reversibly and can recover the same network behavior between cycles, whereas monolayers created by both fumed silica particles exhibit a more pronounced hysteric behavior. Finally, we demonstrated that that there is a relationship between the specific surface area of the particle and the hysteresis experienced by the successive compressions and expansions.
Our experimental results show that the particle roughness affects the state of stresses present in a highly compressed monolayer. We show that the particle type affects the monolayer compressibility. Furthermore, it drastically increases the hysteresis experienced by the monolayer upon compression and expansion cycles. These results are relevant in the design of interfacial systems stabilized by colloidal particles.
Supplementary Materials
The following supporting information can be downloaded at: https://www.mdpi.com/article/10.3390/colloids8020017/s1, Video S1: MSA fumed silica compression sped up 8×.
Author Contributions
Conceptualization, S.R.; methodology, E.L.C. and S.R.; validation, E.L.C. and N.B.; formal analysis, E.L.C.; investigation, E.L.C., D.V.P. and S.R.; resources, D.V.P. and S.R.; data curation, E.L.C. and N.B.; writing—original draft preparation, E.L.C.; writing—review and editing, E.L.C., D.V.P. and S.R.; visualization, E.L.C. and N.B.; supervision, D.V.P. and S.R.; project administration, S.R.; funding acquisition, D.V.P. and S.R. All authors have read and agreed to the published version of the manuscript.
Funding
This research was funded by the National Science Foundation, through the awards CBET-1934513 and CAREER CBET-2144020.
Data Availability Statement
The raw data supporting the conclusions of this article will be made available by the authors on request.
Conflicts of Interest
The authors declare no conflicts of interest.
References
- Ramsden, W. Separation of solids in the surface-layers of solutions and ‘suspensions’ (observations on surface-membranes, bubbles, emulsions, and mechanical coagulation)—Preliminary account. Proc. R. Soc. Lond. 1904, 72, 156–164. [Google Scholar]
- Pickering, S.U. CXCVI—Emulsions. J. Chem. Soc. Trans. 1907, 91, 2001–2021. [Google Scholar] [CrossRef]
- Binks, B.P.; Rodrigues, J.A.; Frith, W.J. Synergistic interaction in emulsions stabilized by a mixture of silica nanoparticles and cationic surfactant. Langmuir 2007, 23, 3626–3636. [Google Scholar]
- Park, B.J.; Lee, D. Particles at fluid–fluid interfaces: From single-particle behavior to hierarchical assembly of materials. MRS Bull. 2014, 39, 1089–1098. [Google Scholar] [CrossRef]
- Kaz, D.M. Colloidal Particles and Liquid Interfaces: A Spectrum of Interactions; Department of Physics, Harvard University: Cambridge, MA, USA; Manoharan Lab Publications: Stanford, CA, USA, 2011. [Google Scholar]
- Zang, D.Y.; Rio, E.; Langevin, D.; Wei, B.; Binks, B.P. Viscoelastic properties of silica nanoparticle monolayers at the air-water interface. Eur. Phys. J. E 2010, 31, 125–134. [Google Scholar]
- Böker, A.; He, J.; Emrick, T.; Russell, T.P. Self-assembly of nanoparticles at interfaces. Soft Matter 2007, 3, 1231–1248. [Google Scholar]
- Furst, E.M. Directing colloidal assembly at fluid interfaces. Proc. Natl. Acad. Sci. USA 2011, 108, 20853. [Google Scholar]
- Komura, S.; Hirose, Y.; Nonomura, Y. Adsorption of colloidal particles to curved interfaces. J. Chem. Phys. 2006, 124, 241104. [Google Scholar] [CrossRef]
- Bresme, F.; Oettel, M. Nanoparticles at fluid interfaces. J. Phys. Condens. Matter 2007, 19, 413101. [Google Scholar] [CrossRef]
- Chen, X.; Da, C.; Hatchell, D.C.; Daigle, H.; Ordonez-Varela, J.-R.; Blondeau, C.; Johnston, K.P. Ultra-stable CO2-in-water foam by generating switchable Janus nanoparticles in-situ. J. Colloid Interface Sci. 2023, 630, 828–843. [Google Scholar] [CrossRef]
- Lan, Y.; Choi, J.; Li, H.; Jia, Y.; Huang, R.; Stebe, K.J.; Lee, D. Janus particles with varying configurations for emulsion stabilization. Ind. Eng. Chem. Res. 2019, 58, 20961–20968. [Google Scholar] [CrossRef]
- Vishal, B.; Ghosh, P. The effect of silica nanoparticles on the stability of aqueous foams. J. Dispers. Sci. Technol. 2019, 40, 206–218. [Google Scholar] [CrossRef]
- Hu, N.; Li, Y.; Wu, Z.; Lu, K.; Huang, D.; Liu, W. Foams stabilization by silica nanoparticle with cationic and anionic surfactants in column flotation: Effects of particle size. J. Taiwan Inst. Chem. Eng. 2018, 88, 62–69. [Google Scholar] [CrossRef]
- Weston, J.S.; Jentoft, R.E.; Grady, B.P.; Resasco, D.E.; Harwell, J.H. Silica Nanoparticle Wettability: Characterization and Effects on the Emulsion Properties. Ind. Eng. Chem. Res. 2015, 54, 4274–4284. [Google Scholar]
- McGorty, R.; Fung, J.; Kaz, D.; Manoharan, V.N. Colloidal self-assembly at an interface. Mater. Today 2010, 13, 34–42. [Google Scholar] [CrossRef]
- Zhou, J.; Qiao, X.; Binks, B.P.; Sun, K.; Bai, M.; Li, Y.; Liu, Y. Magnetic Pickering emulsions stabilized by Fe3O4 nanoparticles. Langmuir 2011, 27, 3308–3316. [Google Scholar] [CrossRef]
- Owoseni, O.; Nyankson, E.; Zhang, Y.; Adams, D.J.; He, J.; Spinu, L.; McPherson, G.L.; Bose, A.; Gupta, R.B.; John, V.T. Interfacial adsorption and surfactant release characteristics of magnetically functionalized halloysite nanotubes for responsive emulsions. J. Colloid Interface Sci. 2016, 463, 288–298. [Google Scholar] [CrossRef]
- Abkarian, M.; Subramaniam, A.B.; Kim, S.-H.; Larsen, R.J.; Yang, S.-M.; Stone, H.A. Dissolution Arrest and Stability of Particle-Covered Bubbles. Phys. Rev. Lett. 2007, 99, 188301. [Google Scholar] [CrossRef]
- Rad, M.D.; Telmadarreie, A.; Xu, L.; Dong, M.; Bryant, S.L. Insight on Methane Foam Stability and Texture via Adsorption of Surfactants on Oppositely Charged Nanoparticles. Langmuir ACS J. Surf. Colloids 2018, 34, 14274–14285. [Google Scholar]
- Xue, Z.; Worthen, A.; Qajar, A.; Robert, I.; Bryant, S.L.; Huh, C.; Prodanović, M.; Johnston, K.P. Viscosity and stability of ultra-high internal phase CO2-in-water foams stabilized with surfactants and nanoparticles with or without polyelectrolytes. J. Colloid Interface Sci. 2016, 461, 383–395. [Google Scholar]
- Arab, D.; Kantzas, A.; Bryant, S.L. Nanoparticle stabilized oil in water emulsions: A critical review. J. Pet. Sci. Eng. 2018, 163, 217–242. [Google Scholar]
- Katepalli, H.; Bose, A. Response of surfactant stabilized oil-in-water emulsions to the addition of particles in an aqueous suspension. Langmuir 2014, 30, 12736–12742. [Google Scholar] [CrossRef]
- Katepalli, H.; Bose, A.; Hatton, T.A.; Blankschtein, D. Destabilization of Oil-in-Water Emulsions Stabilized by Non-ionic Surfactants: Effect of Particle Hydrophilicity. Langmuir 2016, 32, 10694–10698. [Google Scholar] [CrossRef]
- Fan, H.; Striolo, A. Mechanistic study of droplets coalescence in Pickering emulsions. Soft Matter 2012, 8, 9533–9538. [Google Scholar] [CrossRef]
- Hunter, T.N.; Pugh, R.J.; Franks, G.V.; Jameson, G.J. The role of particles in stabilising foams and emulsions. Adv. Colloid Interface Sci. 2008, 137, 57–81. [Google Scholar] [CrossRef]
- Lin, Y.; Skaff, H.; Emrick, T.; Dinsmore, A.D.; Russell, T.P. Nanoparticle assembly and transport at liquid-liquid interfaces. Science 2003, 299, 226–229. [Google Scholar] [CrossRef]
- Raman, A.K.Y.; Aichele, C.P. Influence of non-ionic surfactant addition on the stability and rheology of particle-stabilized emulsions. Colloids Surf. A Physicochem. Eng. Asp. 2020, 585, 124084. [Google Scholar] [CrossRef]
- Van Hooghten, R.; Imperiali, L.; Boeckx, V.; Sharma, R.; Vermant, J. Rough nanoparticles at the oil–water interfaces: Their structure, rheology and applications. Soft Matter 2013, 9, 10791–10798. [Google Scholar] [CrossRef]
- Liu, J.; Li, X.; Jia, W.; Li, Z.; Zhao, Y.; Ren, S. Demulsification of Crude Oil-in-Water Emulsions Driven by Graphene Oxide Nanosheets. Energy Fuels 2015, 29, 4644–4653. [Google Scholar] [CrossRef]
- Pawar, A.B.; Caggioni, M.; Hartel, R.W.; Spicer, P.T. Arrested coalescence of viscoelastic droplets with internal microstructure. Faraday Discuss. 2012, 158, 341–350. [Google Scholar] [CrossRef]
- Madivala, B.; Vandebril, S.; Fransaer, J.; Vermant, J. Exploiting particle shape in solid stabilized emulsions. Soft Matter 2009, 5, 1717–1727. [Google Scholar] [CrossRef]
- Sacanna, S.; Korpics, M.; Rodriguez, K.; Colón-Meléndez, L.; Kim, S.-H.; Pine, D.J.; Yi, G.-R. Shaping colloids for self-assembly. Nat. Commun. 2013, 4, 1688. [Google Scholar] [CrossRef]
- Vu, T.V.; Papavassiliou, D.V. Modification of Oil–Water Interfaces by Surfactant-Stabilized Carbon Nanotubes. J. Phys. Chem. C 2018, 122, 27734–27744. [Google Scholar] [CrossRef]
- Hou, H.; Yu, D.; Tian, Q.; Hu, G. Preparation, Characterization, and Properties of Hollow Janus Particles with Tailored Shapes. Langmuir 2014, 30, 1741–1747. [Google Scholar] [CrossRef]
- Beltramo, P.J.; Gupta, M.; Alicke, A.; Liascukiene, I.; Gunes, D.Z.; Baroud, C.N.; Vermant, J. Arresting dissolution by interfacial rheology design. Proc. Natl. Acad. Sci. USA 2017, 114, 10373–10378. [Google Scholar] [CrossRef]
- Katepalli, H.; John, V.T.; Tripathi, A.; Bose, A. Microstructure and rheology of particle stabilized emulsions: Effects of particle shape and inter-particle interactions. J. Colloid Interface Sci. 2017, 485, 11–17. [Google Scholar] [CrossRef]
- Brown, N.; de la Pena, A.; Razavi, S. Interfacial rheology insights: Particle texture and Pickering foam stability. J. Phys. Condens. Matter 2023, 35, 384002. [Google Scholar]
- Botto, L.; Lewandowski, E.P.; Cavallaro, M.; Stebe, K.J. Capillary interactions between anisotropic particles. Soft Matter 2012, 8, 9957–9971. [Google Scholar] [CrossRef]
- Danov, K.D.; Kralchevsky, P.A.; Naydenov, B.N.; Brenn, G. Interactions between particles with an undulated contact line at a fluid interface: Capillary multipoles of arbitrary order. J. Colloid Interface Sci. 2005, 287, 121–134. [Google Scholar]
- Stamou, D.; Duschl, C.; Johannsmann, D. Long-range attraction between colloidal spheres at the air-water interface: The consequence of an irregular meniscus. Phys. Rev. E 2000, 62, 5263. [Google Scholar] [CrossRef]
- Yao, L.; Botto, L.; Cavallaro, J.M.; Bleier, B.J.; Garbin, V.; Stebe, K.J. Near field capillary repulsion. Soft Matter 2013, 9, 779–786. [Google Scholar] [CrossRef]
- Razavi, S.; Cao, K.D.; Lin, B.; Lee, K.Y.C.; Tu, R.S.; Kretzschmar, I. Collapse of Particle-Laden Interfaces under Compression: Buckling vs. Particle Expulsion. Langmuir 2015, 31, 7764–7775. [Google Scholar] [CrossRef]
- Lenis, J.; Razavi, S.; Cao, K.D.; Lin, B.; Lee, K.Y.C.; Tu, R.S.; Kretzschmar, I. Mechanical stability of polystyrene and janus particle monolayers at the air/water interface. J. Am. Chem. Soc. 2015, 137, 15370–15373. [Google Scholar] [CrossRef]
- Aveyard, R.; Clint, J.H.; Nees, D.; Quirke, N. Structure and collapse of particle monolayers under lateral pressure at the octane/aqueous surfactant solution interface. Langmuir 2000, 16, 8820–8828. [Google Scholar] [CrossRef]
- Bordács, S.; Agod, A.; Hórvölgyi, Z. Compression of Langmuir films composed of fine particles: Collapse mechanism and wettability. Langmuir 2006, 22, 6944–6950. [Google Scholar] [CrossRef]
- Horozov, T.S.; Binks, B.P.; Aveyard, R.; Clint, J.H. Effect of particle hydrophobicity on the formation and collapse of fumed silica particle monolayers at the oil–water interface. Colloids Surf. A Physicochem. Eng. Asp. 2006, 282, 377–386. [Google Scholar] [CrossRef]
- Basavaraj, M.G.; Fuller, G.G.; Fransaer, J.; Vermant, J. Packing, flipping, and buckling transitions in compressed monolayers of ellipsoidal latex particles. Langmuir 2006, 22, 6605–6612. [Google Scholar]
- Horozov, T.S.; Aveyard, R.; Clint, J.H.; Binks, B.P. Order−disorder transition in monolayers of modified monodisperse silica particles at the octane−water interface. Langmuir 2003, 19, 2822–2829. [Google Scholar] [CrossRef]
- Prevo, B.G.; Velev, O.D. Controlled, rapid deposition of structured coatings from micro-and nanoparticle suspensions. Langmuir 2004, 20, 2099–2107. [Google Scholar] [CrossRef]
- Verwijlen, T.; Imperiali, L.; Vermant, J. Separating viscoelastic and compressibility contributions in pressure-area isotherm measurements. Adv. Colloid Interface Sci. 2014, 206, 428–436. [Google Scholar] [CrossRef]
- Rodríguez-Hakim, M.; Oblak, L.; Vermant, J. Facile and Robust Production of Ultrastable Micrometer-Sized Foams. ACS Eng. Au 2023, 3, 235–248. [Google Scholar]
- Pepicelli, M.; Verwijlen, T.; Tervoort, T.A.; Vermant, J. Characterization and modelling of Langmuir interfaces with finite elasticity. Soft Matter 2017, 13, 5977–5990. [Google Scholar]
- Barthel, H.; Heinemann, M.; Stintz, M.; Wessely, B. Particle sizes of fumed silica. In Particle & Particle Systems Characterization: Measurement and Description of Particle Properties and Behavior in Powders and Other Disperse Systems; Wiley: Hoboken, NJ, USA, 1999; Volume 16, pp. 169–176. [Google Scholar]
- Alicke, A.; Simon, S.; Sjöblom, J.; Vermant, J. Assessing the interfacial activity of insoluble asphaltene layers: Interfacial rheology versus interfacial tension. Langmuir 2020, 36, 14942–14959. [Google Scholar] [CrossRef]
- Fainerman, V.B.; Kovalchuk, V.I.; Lucassen-Reynders, E.H.; Grigoriev, D.O.; Ferri, J.K.; Leser, M.E.; Michel, M.; Miller, R.; Möhwald, H. Surface-pressure isotherms of monolayers formed by microsize and nanosize particles. Langmuir 2006, 22, 1701–1705. [Google Scholar] [CrossRef]
- Cassie, A.; Baxter, S. Wettability of porous surfaces. Trans. Faraday Soc. 1944, 40, 546–551. [Google Scholar]
- Gun’Ko, V.; Mironyuk, I.; Zarko, V.; Voronin, E.; Turov, V.; Pakhlov, E.; Goncharuk, E.; Nychiporuk, Y.; Vlasova, N.; Gorbik, P.; et al. Morphology and surface properties of fumed silicas. J. Colloid Interface Sci. 2005, 289, 427–445. [Google Scholar]
- Thakur, S.; Razavi, S. Particle Size and Rheology of Silica Particle Networks at the Air–Water Interface. Nanomaterials 2023, 13, 2114. [Google Scholar] [CrossRef]
- Correia, E.L.; Brown, N.; Razavi, S. Janus particles at fluid interfaces: Stability and interfacial rheology. Nanomaterials 2021, 11, 374. [Google Scholar] [CrossRef]
- Correia, E.L.; Razavi, S. Janus particle amphiphilicity and capillary interactions at a fluid interface. AIChE J. 2023, 69, e18241. [Google Scholar]
- Lewandowski, E.P.; Cavallaro, M.; Botto, L.; Bernate, J.C.; Garbin, V.; Stebe, K.J. Orientation and Self-Assembly of Cylindrical Particles by Anisotropic Capillary Interactions. Langmuir 2010, 26, 15142–15154. [Google Scholar] [CrossRef]
- Kang, D.W.; Choi, K.H.; Lee, S.J.; Park, B.J. Mapping Anisotropic and Heterogeneous Colloidal Interactions via Optical Laser Tweezers. J. Phys. Chem. Lett. 2019, 10, 1691–1697. [Google Scholar] [CrossRef]
- Liu, I.B.; Sharifi-Mood, N.; Stebe, K.J. Capillary Assembly of Colloids: Interactions on Planar and Curved Interfaces. Annu. Rev. Condens. Matter Phys. 2018, 9, 283–305. [Google Scholar] [CrossRef]
- Trevenen, S.; Rahman, A.; Hamilton, H.S.; Ribbe, A.E.; Bradley, L.C.; Beltramo, P.J. Nanoscale porosity in microellipsoids cloaks interparticle capillary attraction at fluid interfaces. ACS Nano 2023, 17, 11892–11904. [Google Scholar] [CrossRef]
- Wells, D. The Penguin Dictionary of Curious and Interesting Geometry; Penguin: London, UK, 1991. [Google Scholar]
Figure 1.
Contact angle of DI water droplets on glass slides coated with the particles under study. From left to right: (a) spherical colloidal particles; (b) LSA fumed silica particles; and (c) MSA fumed silica particles.
Figure 1.
Contact angle of DI water droplets on glass slides coated with the particles under study. From left to right: (a) spherical colloidal particles; (b) LSA fumed silica particles; and (c) MSA fumed silica particles.

Figure 2.
SEM pictures of (a) spherical colloidal particles; (b) LSA fumed silica particles; and (c) MSA fumed silica particles.
Figure 2.
SEM pictures of (a) spherical colloidal particles; (b) LSA fumed silica particles; and (c) MSA fumed silica particles.
Figure 3.
(a) Surface pressure isotherm of spherical particles, low-surface-area (LSA), and medium-surface-area (MSA) fumed silica particles. Green circles indicate the inflection point for each isotherm. Images on the side panels show the microstructures obtained at different apparent surface pressures for both spherical (left panel) and MSA particles (right panel). It should be noted that given the imaging resolution of the microscopy setup, the microstructure obtained for LSA particles resembles that captured for MSA and therefore is not provided; (b) isotherm normalized with the area at the inflection point; (c) isothermal compressibility of the monolayers as a function of the area normalized with the inflection point. Black squares, red circles, and blue triangles represent spherical particles, LSA and MSA fumed silica particles, respectively. Scale bar in images of the microstructure is 10 µm.
Figure 4.
Surface pressure () isotherms as a function of surface coverage of particle () obtained for different particles monolayers. (a) Spherical particles are shown in black squares, (b) LSA fumed silica particles in red circles, and (c) MSA fumed silica particles in blue triangles. The experimental data is shown in lighter tones and the best fit from the Frumkin equation of state (Equation (2)) is shown in a darker tone. The function only fits the data for since at higher surface coverages, the monolayer is not a 2D structure.
Figure 5.
Surface pressure () isotherm plotted as a function of the compression ratio () for compression (closed symbols) and expansion (open symbols) legs of cycles 1 (circles) and 3 (squares) carried out on monolayers formed by (a) spherical, (b) LSA, and (c) MSA silica particles. Note that the direction of compression corresponds to moving from left to right on the x-axis. Microstructure images of the monolayer beyond the collapse point are shown for (d) spherical, (e) LSA, and (f) MSA silica particles. Scale bars in (d–f) is 25 μm.
Figure 6.
Illustration of hysteresis coefficient () calculation for (a) spherical and (b) MSA particles based on the compression and expansion isotherms; (c) normalized hysteresis coefficient () for different cycles of compression and expansions as a function of the specific surface area of the particles used in this study. Black squares, dark grey circles, and grey triangles represent the 1st, 2nd and 3rd cycle, respectively. The green area represents the area difference between the compression and the expansion isotherms, whereas the blue area represents the product of the variation in area and apparent surface pressure, which is used to normalize the data as shown in Equation (3).


Table 1.
Results for the particle size from SEM (DSEM), hydrodynamic size (DH), and zeta potential (ζ) measurements for samples under study.
Table 1.
Results for the particle size from SEM (DSEM), hydrodynamic size (DH), and zeta potential (ζ) measurements for samples under study.
| Sample | DSEM (nm) | DH (nm) | ζ (mV) |
|---|---|---|---|
| Spherical | 283 ± 30 | 322 ± 100 | −31 ± 2 |
| LSA | - | 189 ± 16 | −23 ± 2 |
| MSA | - | 196 ± 70 | −26 ± 1 |
Table 2.
Characterization of the networks formed by spherical and fumed silica particles under study as follows: the maximum isothermal compressibility () achieved by the monolayer and obtained from the analysis of surface pressure isotherms; the parameters obtained from the fitting of the surface pressure isotherms to the Frumkin equation of state, the surface coverage at the inflection point () and the overall interparticle interaction parameter ().
| Particle | (mN/m) | ||
|---|---|---|---|
| Spherical | 160 ± 12 | 88.5% | 0.74 |
| LSA Fumed | 105 ± 5 | 90.7% | 0.26 |
| MSA Fumed | 105 ± 5 | 90.7% | 0.50 |
Disclaimer/Publisher’s Note: The statements, opinions and data contained in all publications are solely those of the individual author(s) and contributor(s) and not of MDPI and/or the editor(s). MDPI and/or the editor(s) disclaim responsibility for any injury to people or property resulting from any ideas, methods, instructions or products referred to in the content. |
© 2024 by the authors. Licensee MDPI, Basel, Switzerland. This article is an open access article distributed under the terms and conditions of the Creative Commons Attribution (CC BY) license (https://creativecommons.org/licenses/by/4.0/).
Share and Cite
MDPI and ACS Style
Correia, E.L.; Brown, N.; Papavassiliou, D.V.; Razavi, S. Influence of Surface Roughness on Interfacial Properties of Particle Networks. Colloids Interfaces 2024, 8, 17. https://doi.org/10.3390/colloids8020017
AMA Style
Correia EL, Brown N, Papavassiliou DV, Razavi S. Influence of Surface Roughness on Interfacial Properties of Particle Networks. Colloids and Interfaces. 2024; 8(2):17. https://doi.org/10.3390/colloids8020017
Chicago/Turabian StyleCorreia, Elton L., Nick Brown, Dimitrios V. Papavassiliou, and Sepideh Razavi. 2024. "Influence of Surface Roughness on Interfacial Properties of Particle Networks" Colloids and Interfaces 8, no. 2: 17. https://doi.org/10.3390/colloids8020017