


Continuous Electrophoretic Separation of Charged Dyes in Liquid Foam
by
 , and
, and
Matthieu Fauvel
1,
Anna Trybala
1,
Dmitri Tseluiko
2,
Victor Mikhilovich Starov
1 and
and
Himiyage Chaminda Hemaka Bandulasena
1,*
1
Department of Chemical Engineering, Loughborough University, Loughborough LE11 3TU, UK
2
Department of Mathematics, Loughborough University, Loughborough LE11 3TU, UK
*
Author to whom correspondence should be addressed.
Colloids Interfaces 2023, 7(2), 44; https://doi.org/10.3390/colloids7020044
Submission received: 30 January 2023
/
Revised: 19 May 2023
/
Accepted: 26 May 2023
/
Published: 2 June 2023
Abstract
:A novel electrophoretic separation technique is presented, where continuous electrophoretic separation is demonstrated using free flowing liquid foams. Continuous foam electrophoresis combines the principle of capillary electrophoresis and interactions between analytes and the electrical double layer, with the ability of Free Flow Electrophoresis to continuously separate and recover analytes automatically. A liquid foam is used to provide a network of deformable micro and nano channels with a high surface area, presenting a novel platform for electrophoresis, where interfacial phenomena could be exploited to modify analyte migration. The main purpose of this paper is to present a proof-of-concept study and provide fundamental understanding of a complex foam system in continuous separation mode, i.e., flowing liquid foam under an external electric field with electrophoresis and chemical reactions at the electrodes continuously changing the system. Liquid foam is generated using a mixture of anionic and non-ionic surfactants and pumped through a microfluidic separation chamber between two electrodes. The effectiveness of the device is demonstrated using a dye mixture containing a neutral dye and an anionic dye. At the outlet, the foam is separated and collected into five fractions which are individually probed for the concentration of the two dyes used. The anionic dye was concentrated up to 1.75 (±0.05) times the initial concentration in a select outlet, while the neutral dye concentration remained unchanged in all outlets, demonstrating the potential for electrophoretic foam separations.
1. Introduction
Separating complex biological samples into their constituent components is a vital step in studying proteins and other biological components. Electrophoresis is a common separation technique used to isolate charged biomolecules based on their migration under external electric fields [1], and is used to separate biological components ranging from proteins [2], DNA, and RNA [3,4] to entire cells [5]. Electrophoresis has been applied via different techniques, most commonly in gel electrophoresis, where analytes are suspended in a polymer matrix [6]. Capillary electrophoresis is a common alternative, offering greater dissipation of Joule heating, enabling high electric field strengths to be applied [1], with its primary drawback being its limited volume. Both methods are primarily batch operations, though continuous electrophoretic separation techniques have been reported with Free Flow Electrophoresis, where a sample stream is driven through a separation chamber by pressure, with the electric field applied perpendicular to the flow direction [7]. As the direction of separation is perpendicular to the flow direction, injection, separation, and collection may take place simultaneously, meaning the system can be operated continuously and achieve a high throughput. Continuous operation may also allow for separation efficiency to be enhanced through techniques such as recycling [8]. However, large cross-sectional areas and low surface-to-volume ratios make heat dissipation difficult; therefore, Free Flow Electrophoresis is typically limited by Joule heating. Liquid foams may provide an alternative platform for separations, allowing continuous separation similar to Free Flow Electrophoresis, but with the added advantage of enhanced separations due to interactions between the biological molecules and the electrical double layer (EDL) of the charged gas–liquid interfaces.
Liquid foams are composed of gas bubbles suspended in a continuous liquid medium. The lamellae, plateau borders, and nodes of liquid foams effectively provide a network of deformable micro and nano channels, bound by the gas–liquid interfaces instead of solid walls. Thin films between bubbles can have thicknesses in the order of 10 nm [9]. At this scale interactions with the interface could affect the migration of analytes through the system, steric interactions with the interface, as well as polarization effects and adsorption kinetics affect the motion of molecules. Unique separation techniques have been proposed that take advantage of these effects to modify analyte migration [10]. Liquid foams could provide a novel platform for electrophoretic separations, providing a cheap and flexible platform with a high interfacial area, without the need for complex and expensive solid channels. Liquid foams may also be pumped similar to liquids [11], presenting a further opportunity as a platform for continuous electrophoretic separation, while taking advantage of the high surface-to-volume ratio of liquid foams. This approach may effectively take the operation of capillary electrophoresis, but most importantly gives an opportunity to exploit interactions between analytes and charges in the EDL to enhance separation. The foam electrokinetic separation concept was recently demonstrated in batch mode for a charged dye mixture by [12]. However, measurements were limited to visual observations as direct concentration measurements inside the chip were difficult with batch operation. In addition, the effect of foam flow on separation efficiency needs to be explored for continuous operation. The transition from batch mode to continuous flow operation is not straightforward, and many engineering processes tend to fail during this transition. In this work, a continuously operated foam electrophoresis separation device was designed and constructed, and its operation was demonstrated by separating a dye mixture containing differently charged dyes. The main purpose of this proof-of-concept study is to provide fundamental understanding of a complex dynamical foam system operated in continuous separation mode, where flowing liquid foam is subjected to an external electric field with electrophoresis and chemical reactions at the electrodes continuously changing the system. By using cheap, easily visible dyes, the principles and key operating parameters can be identified and studied. This work directly quantifies dye concentrations at the outlets, which was not possible in the batch operation reported by [12]. In addition to the transition from batch to continuous mode, this paper presents experimental work detailing the separation current. These findings will be useful in designing further applications, such as the electrophoretic separation of proteins.
2. Materials and Methods
2.1. Solution Preparation
The test solution was prepared by first mixing 25 g of Milli-Q water (15 MΩ·cm deionised water) with 25 g of glycerol. Then glycerol was added to the solution to increase viscosity and reduce foam drainage. 118.2 mg of SDS was added to this mixture to bring the SDS concentration up to the Critical Micelle Concentration. Non-ionic surfactant Triton X-100 was added to the solution at its critical micelle concentration of 0.24 mM. 100 µL of 1 M phosphate buffer solution (Sigma-Aldrich, Gillingham, UK) was added to the solution, adjusting bulk molarity to 2 mM. 9.45 mg of Sodium Fluorescein was added to the solution to provide an anionic dye, bringing the concentration to 0.5 mM. 2.31 mg of Rhodamine B was added to provide a neutral dye, bring the concentration to 0.1 mM. The viscosity of the solutions is 4.01 × 10⁻³ Pa·s. Critical micelle concentrations of all surfactants are presented in Table 1.
2.2. Experimental Device
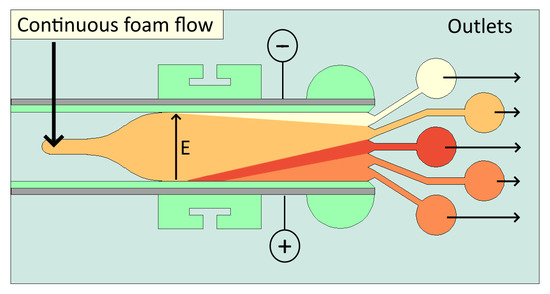
The experimental device used in this study was constructed as described in [12]. A schematic of the device with high level information is displayed in Figure 1. The device was designed to allow liquid foam to be pumped into the channel through a single inlet. Platinised titanium electrodes on either side of this chip provide an electric field for electrophoresis, while agar coating on the electrodes prevents electrochemical reactions from interfering with the process. Once the foam has passed through the channel it exits the device through a series of outlets, allowing the output to be split and collected into several fractions.
Operation of the device is as follows: foam is generated using the double syringe method [15], where one syringe is filled with 1 mL of the foaming solution, and the other filled with 3 mL of air (at standard temperature and pressure). The two syringes are connected through a tube (internal diameter 0.5 mm, length 80 mm), and fluid is passed between syringes for two minutes to generate foam. The bubble sizes generated through this method are initially microscopic with an average bubble diameter of 11.7 µm with a standard deviation of 4.25 µm. Once foam is generated, it is passed into a single syringe and attached to a syringe pump. The foam is then pumped into the chamber at a volumetric foam flowrate ranging between 4.71 and 7.85 µL/s. Once foam reaches the separation chamber electrodes are connected to a DC signal generator (Thurlby Thandar PL30QMD, Huntingdon, UK). A voltage of 25 V is applied across the 10 mm gap between electrodes, corresponding to an average electric field strength of 2500 V/m across the foam. The foam is continuously pumped through, until it reaches the outlets, where it is divided into fractions numbered 1–5 as shown in Figure 1 and collected in separate reservoirs for further analysis. To minimise foam decay in the syringe, a fresh syringe of foam is created by repeating the double syringe process with fresh syringes, and swapped into the system every 10 min, ensuring constant flow of newly generated foam. This also allows greater sample volumes to be collected continuously by removing the volume limitations of using a single syringe. The 10-min interval was decided based on our initial observations, where negligible foam collapse was observed within a 10-min interval [12]. The separation process was run for 40 min in total for each experiment.
2.3. Analytical Techniques
Samples retrieved from the device were analysed using fluorescent imaging. Rhodamine B has a peak excitation wavelength of ~553 nm, and a peak emission at ~627 nm, while fluorescein has a peak excitation of ~460 nm and a peak emission of ~515 nm. The samples were placed under a Nikon TE300 fluorescent microscope, where they were excited individually using different coloured fluorescent lamps with appropriate filters. Samples were placed between two microscope slides spaced 0.1 mm apart to maintain consistent path length. The peak intensity of each dye was recorded using a connected computer running Ximea camtool software, version 4.16. For both dyes, the exposure time was set to 5 ms, and the gain to 1 db. Fluorescein was excited using a blue lamp (450–495 nm) at 10% power, and a blue filter (band pass, 450–495 nm). Rhodamine B was excited using a green lamp (495–570 mm) at 100% power, and a green filter (band pass, 495–570 nm). To test interference, fluorescein was excited using the settings for rhodamine B, and vice versa. For both cases interference was found to be negligible.
Both fluorescent dyes are pH sensitive. The fluorescence of rhodamine B decreases with increasing pH [16,17,18], while the fluorescence of fluoresceine increases with increasing pH [19,20]. To maintain pH, dye samples were mixed with phosphate buffer at a ratio of 1:1, ensuring an initial pH of 7.4 for all samples. The intensity of each dye was recorded and compared to a series of calibrations generated by measuring the intensity of a series of solutions containing each dye at various known concentrations. The intensities of both Rhodamine B and Fluorescein increase linearly with concentration. The relationships can be given by Equations (1) and (2):
where CRB and CF are the concentrations of Rhodamine B and Fluoresceine, respectively, and I is the image intensity recorded by the microscope.
2.4. Mixed Surfactant Properties
A mixed surfactant system was used based on observations from [12], where a non-ionic surfactant was identified as the most suitable for electrophoretic separation, due to low electroosmotic flow and high stability under external electric fields, at the cost of inconsistent foamability. The addition of anionic surfactant SDS allowed consistent foamability, at the cost of re-introducing moderate electroosmotic flow. Surface tension measurements of solutions containing SDS and Triton X-100, mixed at a molar ratio of 8.2:0.2 (SDS:Triton X-100), at varying total concentrations in a 50% water/glycerol mixture are displayed in Figure 2. All measurements are taken at a temperature of 293.15 ± 2 K. Measurements were taken using the pendant drop utility of a Kruss Drop Shape Analyzer 100 (Kruss scientific, Bristol, UK).
The lowest surface tension reached is 36.7 mN/m, when the concentration of the mixture is 4.14 mM. The gradient of surface tension versus ln (C) below this concentration can be used to characterise the interfaces, namely maximum surface concentration and the area occupied by each surfactant molecule. The concentration and the distribution of surfactants at the interface may provide vital information when studying electrostatic properties of the interface, interaction with charged analytes and magnitude of electroosmotic flow. The maximum surface excess concentration (Γmax) can be calculated using Gibb’s isotherm [21].
where is the gas constant, is temperature, and is the surface tension gradient. Using Equation (3), the maximum surface excess concentration is thus calculated as 5.77 × 10⁻⁶ mol/m2. This concentration is higher than that for both pure SDS and Triton X-100 in pure water, 3.1 × 10⁻⁶ and 2.1 × 10⁻⁶, respectively. The average minimum area occupied by each surfactant molecule (Amin) is calculated using:
where N is Avogadro’s constant. Using Equation (4), Amin is calculated as 28.77 Å2 per molecule. The minimum area taken up by each molecule is lower than that for both pure SDS (53 Å2) and pure Triton X-100 (68 Å2) in pure water [22]. The addition of glycerol to the mixture is expected to increase critical micelle concentrations [23], thus reducing Amin compared to pure water. Molecular interaction parameters for Triton X-100 and SDS mixtures were studied by [22], noting that Triton X-100 and SDS molecules exhibited attractive interaction, leading to a decreased Amin compared to their calculated ideal mixtures. As a result, the ratio of ionic to non-ionic surfactant molecules at the interface is different to what is expected based on their molar ratio, which affects the overall charge of the interface and subsequent electrostatic interactions with the analytes and magnitude of electroosmotic flow (EOF).
3. Results and Discussion
Time lapse recordings were taken during operation of the device to understand flow inside the device and assess separation. Time lapse images are displayed in Figure 3.
The two dyes exhibit different dynamic behaviours when subjected to an external electric field. As rhodamine B is neutral, it is not affected by electrophoresis, and its concentration is expected to remain unchanged throughout the entire domain of the foam (Fauvel et al., 2022). The charge of fluorescein depends on the local pH; when pH is greater than 6.7 fluorescein is dianionic, between pH 6.7 and 4.3 fluorescein is monoanionic, between pH 4.3 and 2.1 it is neutrally charged, and below pH 2.1 it is cationic [20,24]. Upon entry to the device, the foam is at pH 7.4; therefore, fluorescein is negatively charged, and will initially migrate towards the anode (bottom electrode). This is observed in Figure 3 as a band of dark orange forming along the anode, gradually widening between the inlet and the outlets. When an external electric field is applied, electrochemical reactions cause pH changes within the foam [25], establishing a pH gradient across the device despite limited buffer solution, i.e., pH drops near the anode and raises near the cathode. The longer the foam remains inside the device, the more the pH gradient extends away from the electrodes, leading to uniform pH at the inlet and to a non-uniform pH at the outlets. This gradient causes widening of the dark orange fluorescein band at the anode, as pH drops below 4.3 and the fluorescein converts to its neutral form, halting electrophoretic migration. Direct visualisation of pH changes is provided in the Supplementary Materials: Figure S1. This corresponds with observations recorded in [12] for stagnant foam. Further visualisation of dye transport may be seen in the white band forming next to the cathode at around 20 min. This appears to be a region where the fluorescein concentration has dropped significantly, apparently leaving only rhodamine B, resulting in a white colour. According to the time lapse recordings, the residence time of a single bubble inside the device under an external electric field of 2500 V/m is estimated to be 10 min ± 30 s. Residence time is expected to vary depending on the rate of foam collapse inside the device and the foam flowrate.
It is important to consider liquid flow inside the foam, and the effects of charged interfaces on the charged dye molecules. SDS molecules adsorb onto the air–liquid interfaces, causing it to be negatively charged. The presence of non-ionic Triton X-100 is expected to decrease the negative charge in comparison to a pure SDS foam. Measurements of the zeta potential of the gas–liquid interfaces may provide useful data on how the introduction of non-ionic surfactant affects electroosmotic flows inside the system. Positive counterions are attracted to the negative interfaces, establishing the EDL. Under the influence of an external electric field, the positive counterions in the EDL are drawn towards the cathode by the resulting Coulomb force, causing fluid adjacent to the EDL to experience electroosmotic flow (EOF) towards the cathode. Given the initial average bubble size of 11 µm, with a standard deviation of 4.25 µm, and neglecting any foam collapse inside the device, the surface area of the air–liquid interface is estimated to be 0.41 m2, compared to the maximum possible surface area of the solid–liquid interfaces of 0.0007 m2. From this, it can be concluded that the electroosmotic flow at air–liquid interfaces dominates over that of solid–liquid interfaces, which may possess differing surface charges to the air–liquid interfaces. Fluid transported by EOF eventually reaches a solid wall at the electrode and a “backflow” develops as fluid moves away from the wall through the thicker regions of the film where electroosmotic flow is weaker, namely the plateau borders, away from the gas–liquid interfaces. As fluorescein is negatively charged in the bulk, it is expected to be positioned away from the gas–liquid interfaces and hence will be affected by the backflow. The magnitude of EOF and backflow will depend on the interfacial charge established by the surfactants. As a mixture of ionic/non-ionic surfactant was used, the magnitude of EOF is expected to be lower than that of pure SDS foam, but greater compared to that of pure Triton X-100 foam. Further investigation into the effect of surfactant blends on electroosmotic flow is outside the scope of this study but worth consideration in future work. The use of charged dye mixtures as models for separation provides an opportunity to understand this complex system using simple visual aids and will be useful in extending separations to future applications.
Foam collapse is another important aspect to consider when evaluating foam-based separation applications. Despite efforts to mitigate foam collapse, pockets of untimely collapse are observed within the device, with foam collapse being more noticeable at longer timescales (typically after 20–30 min from the initial foam formation). Collapse inside the separation chamber could lead to unwanted mixing of already separated components and could reduce separation efficiency. Collapse at the outlet channels may lead to outlets being blocked, visible after 10 min near the outlet in Figure 3. However, if foam collapse could be accounted for and timed accordingly, it may be possible to collapse after passing through the separation chamber and into the collection channels. In addition, foam rheology and foam flow can have significant effects on the behaviour of the system. Local topological rearrangements of individual bubbles, or T1 events, may also contribute to mixing, and may occur when the yield stress surpasses the limit defined by the plasticity of the foam [25]. This may place constraints on what volumetric flowrates could be used, as well as foam formulation, bubble size [26], and liquid fraction [27]. Setting the volumetric foam flowrate too low may result in long residence times and untimely foam collapse, whereas setting it too high may incur unacceptable levels of mixing due to the extra stresses. This aspect of the operation is still unexplored and presents an opportunity for in-depth analysis and further development.
To provide quantitative analysis of the separation, the concentration of fluorescein and rhodamine B relative to their initial concentration at each outlet stream is presented in Figure 4. Outlets are numbered such that outlet 1 is closest to the anode and outlet 5 is closest to the cathode. To analyse the effect of electric field strength, the experiment is repeated multiple times, varying electric field strength between 1500 and 3000 V/m.
Rhodamine B concentration only varies between 96% and 106% of the inlet concentration at all electric field strengths, which means it remains largely unaffected by the electric field as shown in Figure 4b. As rhodamine B is neutral, its concentration is expected to remain uniform across the device. Rhodamine B concentrations slightly differing from the initial concentrations may be caused by the absorption of rhodamine B into the agar gel coated at each electrode, which becomes visible as a pink stain on the surface of the gel during experiments. However, this would initially be expected to cause a drop in rhodamine B concentration in samples 1 and 5. The variation may potentially be caused by the foams structure, and how electroosmotic flows develop within, as well as the decay of the foam. Due to the difference in scale, electroosmotic flow is expected to dominate within the thin film lamellae between bubbles, while pressure driven backflow is expected to dominate within the thicker plateau borders away from the outlets [28,29,30,31]. Rhodamine B is neither attracted nor repelled by the charged interface, and is expected to be present throughout the foam, and so the electroosmotic flow and backflow will act to mix the rhodamine B throughout the device, potentially leading to uneven concentrations upon eventual foam collapse.
The variation of fluorescein dye at the outlets is shown in Figure 4a. In general, fluorescein concentration increases from the cathode to the anode, as negatively charged fluorescein is transported towards the anode by electrophoresis. Interestingly, for all electric field strengths less than 3000 V/m, the peak in fluorescein concentration is observed at outlet 3, halfway between the anode and the cathode. The fluorescein concentration achieved at this point is 1.49 times the original concentration, at an electric field strength of 1500 V/m. This mirrors observations made in [12] where fluorescein concentrates away from the electrodes. This is a consequence of the acidic front that develops from the anode, causing fluorescein to transition to its neutral form, stopping electrophoretic migration. This results in a fluorescein concentration peak a certain distance away from the anode, and this distance decreases as the external electric field strength increases. An anomaly to this is the high fluorescein concentration in outlet 1 at 1500 V/m. At lower voltages, the pH gradient is expected to develop slower, as it must first permeate through the agar gel layer before reaching the liquid foam. If fluorescein can migrate to the anode before this pH front reaches the liquid foam it may cause an increase in concentration in outlet 1. The formation of this pH gradient over time is an important factor when designing a system for a specific application and will require further investigation. At 3000 V/m, a different trend is observed, where fluorescein concentration increases linearly from the cathode to the anode, and no concentration peak is observed at the midpoint of the device. This suggests fluorescein can concentrate at the anode without being hindered by the pH gradient, most likely due to the greater electric field strength and faster electrophoretic migration overtaking the formation of the pH gradient. Interestingly, fluorescein concentration is below the inlet concentration for all points at 3000 V/m, which suggests a fraction of fluorescein get absorbed into the agar gel at the anode and is being removed from the system. In these experiments, full separation is not achieved, as the concentration gradient at the outlet takes time to establish. Figure 3 shows the colour intensity at the outlet changing over time between 15 min and 35 min. Between these times a white band forms near the cathode as fluorescein concentration is reduced. The delayed formation of this band is likely to be related to the formation of the pH gradient across the device.
To investigate the effects of foam flowrate on separation, the experiment was repeated by varying the foam volumetric flowrate between 4.71 µL/s and 7.85 µL/s. The electric field strength was kept constant at 2500 V/m. The results are displayed in Figure 5. Rhodamine B concentrations show no deviation from the trend shown in Figure 4b and are not shown here.
Increasing the flow rate from 4.71 to 6.28 µL/s shows little change in fluorescein concentrations, following the same trend, and with concentrations falling within error margins of each other, suggesting no significant effect. However, at 7.85 µL/s the trend changes, showing significantly more fluorescein in outlets 4 and 5. This suggests that greater flowrate does not allow fluorescein sufficient resident time to migrate, and so the concentration pattern does not fully develop, leading to a wider distribution of fluorescein across the device. This suggests that there may be an optimum flowrate, which allows the separation pattern to fully develop, while allowing the greatest possible throughput with least foam collapse. From all the experiments, the highest fluorescein concentration recovered was 1.75 times the initial concentration from outlet 1 under 1500 V/m electric field at a volumetric flowrate of 4.71 µm/s. This concentration is relatively low compared to similar experiments conducted using free flow zone electrophoresis. [32] reported total separation of rhodamine and fluorescein, with a residence time of 3.3 s under an electric field of 25,000 V/m. [33] reported successful separation and concentration of fluorescein from eosin G using free flow isotachophoresis, with a residence time of 93.7 s and an electric field strength of 35,000 V/m. There are two key differences between the two aforementioned studies and the work presented here. First, the width of the inlet stream relative to the separation chamber is small in our study, as opposed to evenly dispersed foam throughout the entire space before separation in the previous work. Second, the electric field strengths used in our study are substantially lower than the previous work mentioned, and so will have a lesser heating effect, reducing risk of damage to heat sensitive analytes. Ref. [34] reports partial separation and concentration of alexa fluor 591 and fluorescein through free flow isotachophoresis, noting the fluorescein concentration increased by 1.5-fold during the process. All approaches reported in the Literature and in this study have their own merits and limitations, but the suitability of a separation technique for a specific application depends on the analyte properties.
Although full separation is not demonstrated here, an interesting concept is presented. It may be possible to recycle specific outlet fractions, and continuously pass them through the device multiple times to enhance complete separation. This approach is not possible with conventional batch operated electrophoresis systems. Similarly, it may be possible to recycle output from the first 15–30 min of operation, where the separation pattern has not fully formed, further enhancing separation [8]. While recycling may offer enhanced separation, untimely foam decay near the outlets may cause unwanted mixing. This may be improved in future trials by tuning surfactant formulations, electric field strength, and foam flowrate. In this study, it was noted that some channels may become effectively blocked, with foam being redirected towards other channels, causing unwanted mixing of the separated fractions. Therefore, outlet design also requires further consideration in future designs to avoid blockages and efficient removal.
The separation current can provide valuable insights into the power consumption of the device, heat dissipation, electrolysis processes occurring at the electrodes, and reproducibility of the separation process. To measure the electrical current through the foam, the experiment was repeated using an electric field strength of 2500 V/m and a volumetric flowrate of 6.28 µL/s. This experiment was repeated four times and the average current over time is presented in Figure 6.
The electric current profile across the device can be split into three main regions. Region I corresponds to the period of time in which the device is filled with foam, and the current rises accordingly, as more foam becomes available to conduct the current. At around 6 min, the device is completely full of foam, where maximum current is reached. Then region II begins, where the current gradually drops, likely due to some foam collapse inside the device. Conductance may be used to give an indication of the liquid fraction within the device [35]. However, existing empirical relationships utilise alternating current [36] to negate electrochemical reactions at the electrodes. As this setup uses direct current (DC), such relationships do not hold, as the conductance of the foam will be affected by the electrochemical reactions. As a result of this, region III develops, where the current gradually rises with time and plateaus. During this stage, foam conductance increases slightly due to additional ions released by the electrochemical reactions and balances the decrease in conductance due to foam collapse. These ionic changes within the system were confirmed by pH measurements shown in the Supplementary Materials, Figure S1. However, this region experiences prominent fluctuations compared to regions I and II due to random foam collapse. The greatest variation between each individual run is seen in region III, but all runs exhibit similar trends, indicating reasonable reproducibility. The foam supply was refreshed at 10, 20, and 30 min during these runs. While the current profile trend changes after the 10-min mark, no noticeable change was observed after 20 and 30 min. This suggests that foam syringe changeover causes negligible effects on the experiment, and that foam decay is primarily driven by other factors, rather than the foam collapsing inside the syringe, outside of the device.
According to the electric current measurements, the device consumes 0.035 W of power on average for this separation. Assuming most of the power is used in heating the liquid foam, a temperature rise up to 8 °C can be expected. However, the heating effects of applied electric fields on liquid foam are known to be inhomogeneous [37]. As such, further study is required to investigate the local temperature changes caused by application of an electric field on continuously flowing foam. Of particular interest is the potential difference in temperature between the lamellae and plateau borders inside the foam, as this determines the dynamics of the whole system.
4. Conclusions
A continuous foam electrokinetic device is demonstrated for the separation of a charged dye mixture. Charged molecules suspended in a liquid foam undergo electrophoretic separation when subjected to an external electric field. In addition to electrophoresis, charged molecules interact with the charged gas–liquid interfaces of the liquid foam, leading to enhanced separation. This paper is focused on transition from batch operation to continuous flow operation, where many engineering processes fail during scale-up. The added complexities of introducing liquid foam flow into the system and collecting separated samples via several outlets warrants a fundamental study before progressing into practical applications. The concentration of neutral molecules remained relatively unchanged at the outlet, but the concentration of charged molecules varied, with concentration increasing up to 1.75 times the initial concentration due to electrophoretic transport. The concentration pattern of charged dye was affected by both the electric field applied and the volumetric flowrate of the foam. Foam decay is highlighted as a challenge in designing foam electrophoresis systems, as untimely decay causes unwanted mixing, and without sufficient pressure drop across the device may lead to outlet streams becoming effectively blocked. This presents an opportunity to further optimise surfactant formulation, as the interfacial properties and flow profiles are affected by the surfactant type. In particular, the surfactant type and interfacial properties could be tuned to modify analyte migration, resulting in novel separation dynamics. Recycling of the outlet streams through the device is suggested as another way to enhance separation, but foam must be regenerated after each cycle. While further work is recommended to realise the full potential of this technique, the process may eventually be extended to demonstrate useful applications, such as separation of complex protein mixtures and downstream separations in bioprocessing.
Supplementary Materials
The following supporting information can be downloaded at: https://www.mdpi.com/article/10.3390/colloids7020044/s1, Figure S1: pH changes in foam device under 2500 V/m at volumetric flowrate of 4.71 µL/s; Figure S2: Image intensity of Rhodamine B samples against concentration relative to inlet concentration; Figure S3: Image intensity of Fluorescein samples against concentration relative to inlet concentration; Table S1: Image intensity of Rhodamine B samples; Table S2: Image intensity of Rhodamine B samples.
Author Contributions
Conceptualization, H.C.H.B. and M.F.; methodology, M.F., H.C.H.B. and A.T.; software, M.F.; validation, M.F. and D.T.; formal analysis, M.F., H.C.H.B. and V.M.S.; investigation, M.F. and H.C.H.B.; resources, H.C.H.B., A.T. and D.T.; data curation, M.F.; writing—original draft preparation, M.F.; writing—review and editing, H.C.H.B., A.T., D.T. and V.M.S.; visualization, M.F.; supervision, H.C.H.B. and A.T.; project administration, H.C.H.B.; funding acquisition, H.C.H.B., A.T. and D.T. All authors have read and agreed to the published version of the manuscript.
Funding
This research received no external funding.
Data Availability Statement
Data is contained within the article or supplementary material.
Acknowledgments
The authors would like to acknowledge the Adventure mini-CDT on “Designed self-assembly of nanoparticles within fluids and at interfaces” at Loughborough University for the PhD studentship for MF. AT, HCHB, and VS’s research was supported by the Marie Curie NanoPaint grant and the MAP EVAPORATION project from the European Space Agency.
Conflicts of Interest
The authors declare no conflict of interest.
References
- Stastna, M. Continuous Flow Electrophoretic Separation—Recent Developments and Applications to Biological Sample Analysis. Electrophoresis 2020, 41, 36–55. [Google Scholar] [CrossRef] [PubMed]
- Dolník, V. Capillary Electrophoresis of Proteins 2005–2007. Electrophoresis 2008, 29, 143–156. [Google Scholar] [CrossRef] [PubMed]
- Dorfman, K.D. DNA Electrophoresis in Microfabricated Devices. Rev. Mod. Phys. 2010, 82, 2903–2947. [Google Scholar] [CrossRef] [Green Version]
- Lu, T.; Klein, L.J.; Ha, S.; Rustandi, R.R. High-Resolution Capillary Electrophoresis Separation of Large RNA under Non-Aqueous Conditions. J. Chromatogr. A 2020, 1618, 875. [Google Scholar] [CrossRef]
- Kostal, V.; Arriaga, E.A. Recent Advances in the Analysis of Biological Particles by Capillary Electrophoresis. Electrophoresis 2008, 29, 2578–2586. [Google Scholar] [CrossRef] [Green Version]
- Rudge, S.R.; Monnig, C.A. Electrophoresis Techniques. Sep. Purif. Methods 2000, 29, 129–148. [Google Scholar] [CrossRef]
- Turgeon, R.T.; Bowser, M.T. Micro Free-Flow Electrophoresis: Theory and Applications. Anal. Bioanal. Chem. 2009, 394, 187–198. [Google Scholar] [CrossRef] [Green Version]
- Zheng, S.N.; Hanai, T.; Yonemoto, T.; Tadaki, T. Separation of Amino Acids by Recycling Free Flow Electrophoresis. J. Chem. Eng. Jpn. 1992, 25, 686. [Google Scholar] [CrossRef] [Green Version]
- Breward, C.J.W.; Howell, P.D. The Drainage of a Foam Lamella. J. Fluid Mech. 2002, 458, 930. [Google Scholar] [CrossRef] [Green Version]
- Baldessari, F.; Santiago, J.G. Electrophoresis in Nanochannels: Brief Review and Speculation. J. Nanobiotechnol. 2006, 4, 12. [Google Scholar] [CrossRef] [Green Version]
- Deshpande, N.S.; Barigou, M. The Flow of Gas-Liquid Foams in Vertical Pipes. Chem. Eng. Sci. 2000, 55, 4297–4309. [Google Scholar] [CrossRef]
- Fauvel, M.; Trybala, A.; Tseluiko, D.; Mikhilovich Starov, V.; Chaminda Hemaka Bandulasena, H. Foam-Based Electrophoretic Separation of Charged Dyes. Langmuir 2022, 38, 13935–13942. [Google Scholar] [CrossRef]
- Moroi, Y.; Motomura, K.; Matuura, R. The Critical Micelle Concentration of Sodium Dodecyl Sulfate-Bivalent Metal Dodecyl Sulfate Mixtures in Aqueous Solutions. J. Colloid Interface Sci. 1974, 46, 111–117. [Google Scholar] [CrossRef]
- Zdziennicka, A.; Szymczyk, K.; Krawczyk, J.; Jańczuk, B. Critical Micelle Concentration of Some Surfactants and Thermodynamic Parameters of Their Micellization. Fluid Phase Equilib. 2012, 322–323, 126–134. [Google Scholar] [CrossRef]
- Gaillard, T.; Roché, M.; Honorez, C.; Jumeau, M.; Balan, A.; Jedrzejczyk, C.; Drenckhan, W. Controlled Foam Generation Using Cyclic Diphasic Flows through a Constriction. Int. J. Multiph. Flow 2017, 96, 173–187. [Google Scholar] [CrossRef]
- Rosenthal, I.; Peretz, P.; Muszkat, K.A. Thermochromic and Hyperchromic Effects in Rhodamine B Solutions. J. Phys. Chem. 1979, 83, 350–353. [Google Scholar] [CrossRef]
- Arbeloa, I.L.; Rohatgi-Mukherjee, K.K. Solvent Effect on Photophysics of the Molecular Forms of Rhodamine B. Solvation Models and Spectroscopic Parameters. Chem. Phys. Lett. 1986, 128, 656. [Google Scholar] [CrossRef]
- da Silva, A.A.; Flor, J.; Davolos, M.R. Rhodamine B-Containing Silica Films from TEOS Precursor: Substrate Surface Effects Detected by Photoluminescence. Surf. Sci. 2007, 601, 1118–1122. [Google Scholar] [CrossRef]
- Liu, M.; Jia, M.; Pan, H.; Li, L.; Chang, M.; Ren, H.; Argoul, F.; Zhang, S.; Xu, J. Instrument Response Standard in Time-Resolved Fluorescence Spectroscopy at Visible Wavelength: Quenched Fluorescein Sodium. Appl. Spectrosc. 2014, 68, 577–583. [Google Scholar] [CrossRef]
- Martin, M.M.; Lindqvist, L. The PH Dependence of Fluorescein Fluorescence. J. Lumin. 1975, 10, 381–390. [Google Scholar] [CrossRef]
- Parekh, P.; Varade, D.; Parikh, J.; Bahadur, P. Anionic-Cationic Mixed Surfactant Systems: Micellar Interaction of Sodium Dodecyl Trioxyethylene Sulfate with Cationic Gemini Surfactants. Colloids Surf. A Physicochem. Eng. Asp. 2011, 385, 57. [Google Scholar] [CrossRef]
- El-Aila, H.J.Y. Interaction of Nonionic Surfactant Triton-X-100 with Ionic Surfactants. J. Dispers. Sci. Technol. 2009, 30, 207. [Google Scholar] [CrossRef]
- Ruiz, C.C.; Díaz-López, L.; Aguiar, J. Micellization of Sodium Dodecyl Sulfate in Glycerol Aqueous Mixtures. J. Dispers. Sci. Technol. 2008, 29, 571. [Google Scholar] [CrossRef]
- Le Guern, F.; Mussard, V.; Gaucher, A.; Rottman, M.; Prim, D. Fluorescein Derivatives as Fluorescent Probes for Ph Monitoring along Recent Biological Applications. Int. J. Mol. Sci. 2020, 21, 9217. [Google Scholar] [CrossRef] [PubMed]
- Cantat, I.; Cohen-Addad, S.; Elias, F.; Graner, F.; Höhler, R.; Pitois, O.; Rouyer, F.; Saint-Jalmes, A.; Flatman, R. Foams: Structure and Dynamics; OUP Oxford: Oxford, UK, 2013; Volume 1. [Google Scholar]
- Dollet, B.; Raufaste, C. Rheology of Aqueous Foams. Comptes Rendus Phys. 2014, 15, 731–747. [Google Scholar] [CrossRef] [Green Version]
- Stennikova, O.; Shmakova, N.; Carrat, J.-B.; Ermanyuk, E. Liquid Fraction Effect on Foam Flow through a Local Obstacle. Polymers 2022, 14, 307. [Google Scholar] [CrossRef]
- Fauvel, M.; Trybala, A.; Tseluiko, D.; Mikhilovich Starov, V.; Chaminda Hemaka Bandulasena, H. Stability of Two-Dimensional Liquid Foams under Externally Applied Electric Fields. Langmuir 2022, 38, 6305–6321. [Google Scholar] [CrossRef]
- Hussein Sheik, A.; Bandulasena, H.C.H.; Starov, V.; Trybala, A. Electroosmotic Flow Measurements in a Freely Suspended Liquid Film: Experimhents and Numerical Simulations. Electrophoresis 2017, 38, 2554–2560. [Google Scholar] [CrossRef] [Green Version]
- Sheik, A.H.; Bandulasena, H.C.H.; Starov, V.; Trybala, A. Determining Electroosmotic Velocity in a Free Liquid Film. In Proceedings of the 20th International Conference on Miniaturized Systems for Chemistry and Life Sciences, MicroTAS 2016, Dublin, Ireland, 9–13 October 2016; pp. 766–767. [Google Scholar]
- Hussein Sheik, A.; Montazersadgh, F.; Starov, V.; Trybala, A.; Bandulasena, H.C.H. Procedures Used in Electrokinetic Investigations of Surfactant-Laden Interfaces, Liquid Films and Foam System. Curr. Opin. Colloid Interface Sci. 2018, 37, 128–135. [Google Scholar] [CrossRef] [Green Version]
- Kohlheyer, D.; Eijkel, J.C.T.; van den Berg, A.; Schasfoort, R.B.M. Miniaturizing Free-Flow Electrophoresis—A Critical Review. Electrophoresis 2008, 29, 977–993. [Google Scholar] [CrossRef]
- Novo, P.; Janasek, D. Current Advances and Challenges in Microfluidic Free-Flow Electrophoresis—A Critical Review. Anal. Chim. Acta 2017, 991, 9–29. [Google Scholar] [CrossRef] [PubMed]
- Fu, X.; Mavrogiannis, N.; Ibo, M.; Crivellari, F.; Gagnon, Z.R. Microfluidic Free-Flow Zone Electrophoresis and Isotachophoresis Using Carbon Black Nano-Composite PDMS Sidewall Membranes. Electrophoresis 2017, 38, 104. [Google Scholar] [CrossRef] [PubMed]
- Karapantsios, T.D.; Papara, M. On the Design of Electrical Conductance Probes for Foam Drainage Applications. Assessment of Ring Electrodes Performance and Bubble Size Effects on Measurements. Colloids Surf. A Physicochem. Eng. Asp. 2008, 323, 139–148. [Google Scholar] [CrossRef]
- Feitosa, K.; Marze, S.; Saint-Jalmes, A.; Durian, D.J. Electrical Conductivity of Dispersions: From Dry Foams to Dilute Suspensions. J. Phys. Condens. Matter 2005, 17, 6301–6305. [Google Scholar] [CrossRef]
- Bonhomme, O.; Peng, L.; Biance, A.L. Thermally Enhanced Electro-Osmosis to Control Foam Stability. Phys. Rev. X 2020, 10, 021015. [Google Scholar] [CrossRef] [Green Version]
Figure 1.
Foam separation cell (a): Separation chamber schematic (b): Photograph of the assembled device under operation.
Figure 1.
Foam separation cell (a): Separation chamber schematic (b): Photograph of the assembled device under operation.

Figure 2.
Plot of surface tension vs. total surfactant concentration of SDS and Triton X-100 mixture in 50% glycerol-water mixtures at 293.15 K.
Figure 2.
Plot of surface tension vs. total surfactant concentration of SDS and Triton X-100 mixture in 50% glycerol-water mixtures at 293.15 K.

Figure 3.
Time lapse of Rhodamine B and Fluorescein in mixed SDS/Triton X-100 foam under 2500 V/m electric field with foam volumetric flowrate of 4.71 µL/s. Inlet located on the (left), outlets on the (right). Orange colour represents the dye mixture, and darker regions correspond to elevated fluorescein concentrations.

Figure 4.
Concentrations of (a): fluorescein and (b): rhodamine B relative to inlet concentration in outlet channels 1–5 at electric field strengths between 1500 and 3000 V/m. Volumetric flowrate is 4.71 µL/s. All measurements are repeated four times. Each sample is collected cumulatively over 40 min. Sample number corresponds to the numbered well each sample was drawn from (sample 1 is closest to the anode and sample 5 is closest to the cathode).

Figure 5.
Concentrations of fluorescein relative to the inlet concentration in the outlet channels 1–5 at foam volumetric flowrates between 4.71 and 7.85 µL/s. Electric field strength is 2500 V/m. All measurements are repeated four times. Each sample is collected cumulatively over 40 min. Sample number corresponds to the numbered well each sample was drawn from.

Figure 6.
Current through liquid foam over time under electric field strength of 2500 V/m and volumetric flowrate of 6.28 µL/s. Experiment was repeated four times. Error bars represent one standard deviation.
Figure 6.
Current through liquid foam over time under electric field strength of 2500 V/m and volumetric flowrate of 6.28 µL/s. Experiment was repeated four times. Error bars represent one standard deviation.


Disclaimer/Publisher’s Note: The statements, opinions and data contained in all publications are solely those of the individual author(s) and contributor(s) and not of MDPI and/or the editor(s). MDPI and/or the editor(s) disclaim responsibility for any injury to people or property resulting from any ideas, methods, instructions or products referred to in the content. |
© 2023 by the authors. Licensee MDPI, Basel, Switzerland. This article is an open access article distributed under the terms and conditions of the Creative Commons Attribution (CC BY) license (https://creativecommons.org/licenses/by/4.0/).
Share and Cite
MDPI and ACS Style
Fauvel, M.; Trybala, A.; Tseluiko, D.; Starov, V.M.; Bandulasena, H.C.H. Continuous Electrophoretic Separation of Charged Dyes in Liquid Foam. Colloids Interfaces 2023, 7, 44. https://doi.org/10.3390/colloids7020044
AMA Style
Fauvel M, Trybala A, Tseluiko D, Starov VM, Bandulasena HCH. Continuous Electrophoretic Separation of Charged Dyes in Liquid Foam. Colloids and Interfaces. 2023; 7(2):44. https://doi.org/10.3390/colloids7020044
Chicago/Turabian StyleFauvel, Matthieu, Anna Trybala, Dmitri Tseluiko, Victor Mikhilovich Starov, and Himiyage Chaminda Hemaka Bandulasena. 2023. "Continuous Electrophoretic Separation of Charged Dyes in Liquid Foam" Colloids and Interfaces 7, no. 2: 44. https://doi.org/10.3390/colloids7020044