Effects of Bentonite Nanoclay and Cetyltrimethyl Ammonium Bromide Modified Bentonite Nanoclay on Phase Inversion of Water-in-Oil Emulsions

Department of Chemical Engineering, University of Waterloo, Waterloo, ON N2L 3G1, Canada
*
Author to whom correspondence should be addressed.
Colloids Interfaces 2020, 4(1), 2; https://doi.org/10.3390/colloids4010002
Submission received: 12 November 2019
/
Revised: 30 December 2019
/
Accepted: 31 December 2019
/
Published: 3 January 2020
(This article belongs to the Special Issue Emulsion Applications)
Abstract
:The effects of unmodified and modified bentonite nanoclays (with various degrees of surfactant modification) on the catastrophic phase inversion from water-in-oil (W/O) emulsion to oil-in-water (O/W) emulsion were determined experimentally. The bentonite nanoclay (NC-Bt) was suspended in the aqueous phase, and the critical volume fraction of water where phase inversion from W/O to O/W emulsion took place was determined through conductivity measurements. Cetyltrimethyl ammonium bromide (CTAB) was used as a surfactant to modify the nanoclay. The adsorption of CTAB onto nanoclay had a strong influence on the contact angle and the critical volume fraction of water where phase inversion took place. The modification of the nanoclay brought about by the adsorption of CTAB increased the three-phase contact angle (measured through the aqueous phase), thereby making it more hydrophobic, and prolonged the phase inversion point. CTAB alone and CTAB-modified nanoclay delayed the phase inversion process in a similar manner, showing a strong dependence on the CTAB concentration.
1. Introduction
Various types of solid materials have been used as particulate stabilizers for water-in-oil (W/O) or oil-in-water (O/W) emulsions, including clays, silica, iron oxides, barium sulfate, alumina, and calcium carbonate [1]. One of the crucial characteristics of these particles that impacts their effectiveness in stabilizing emulsions is their wettability [2,3]. Particles with contact angles slightly greater or smaller than 90° tend to stabilize W/O or O/W emulsions, respectively [4]. The wettability of the solid particles has been known to be altered by surface modification using surfactants [1]. The trapping of particles at the oil–water interface is controlled by the particle wettability. At the interface, the particle experiences a potential energy minimum, which is directly related to the contact angle. Equation (1) gives the Gibbs free energy () required to remove a particle (of radius r) from the oil–water interface to the potential energy reduction for attachment of the particle at the interface [3].
where γow is the interfacial tension of the oil–water interface and θow is the three-phase contact angle the particle makes with the oil–water interface measured through the water phase. The fluid into which the particle is removed dictates the sign on the cosθow. It is negative when the particle is removed into water.
Clays are a broad class of inorganic layered structures. Bentonite is a smectite clay mineral type, an absorbent aluminum phyllosilicate clay, also referred to as Montmorillonite (MMT) [5,6]. MMT is commonly used in research studies for the synthesis of organoclays due to its abundance, adsorption properties, high cation exchange capacity, nanometric dimensions, high aspect ratio, and its extreme water-swelling characteristics [7,8,9]. The stabilization effect of nanoclays in multicomponent systems has attracted interest in a wide range of applications in the industry due to its economic and environmental benefits [4,10,11,12,13].
The homogenization of a mixture of aqueous and non-aqueous phases by means of high-shear mechanical agitation, yielding either a W/O emulsion or an O/W emulsion, is mostly enhanced by the addition of particulate modifiers such as nanoclays. The particulate modifiers are able to migrate to the interface, forming a Pickering interface with a high interfacial shear modulus [14]. With the help of a surfactant, poorly hydrophobic nanoclays can be modified such that they can be preferentially located at the oil–water interface. The adsorption of cationic surfactants at low aqueous concentrations have been shown to alter the wettability of mineral surfaces by making them more hydrophobic [15,16,17]. A cationic surfactant, such as cetyltrimethyl ammonium bromide (CTAB), is hereby expected to readily attach itself to negatively charged clay surfaces via columbic attraction [15]. Figure 1 shows a schematic diagram illustrating the multiscale representation of the W/O emulsion stabilized by surfactant-modified nanoclay before the occurrence of phase inversion.
The aim of this study is to evaluate the stability of nanoclay-stabilized W/O emulsions formulated with various degrees of surfactant modification of nanoclay. The effects of unmodified and surfactant-modified nanoclay on catastrophic phase inversion from W/O emulsion to O/W emulsion are determined experimentally. The adsorption of CTAB onto the nanoclay has a strong influence on the three-phase contact angle, as well as the critical volume fraction of water where the phase inversion takes place from a W/O to O/W emulsion.
2. Materials and Methods
2.1. Materials
The hydrophilic bentonite nanoclay powder purchased from Sigma Aldrich consists of 98% sodium montmorillonite. The particles of untreated nanoclay powder are approximately 6 microns in size. The powder particles are agglomerates of the clay layer stacks, which disperse fully into a nano-sized dimension in water due to the strong hydrophilicity of clay. The exfoliated clay has a thickness of 1 nm and a lateral dimension 100–150 nm.
The cationic surfactant, cetyltrimethyl ammonium bromide (CTAB), was purchased from Sigma Aldrich chemicals. Both nanoclay and surfactant were used as received. White mineral oil (PetroCanada) was used to prepare the emulsions. Ultrapure water with a resistivity of 18.2 MΩ, surface tension of 71.5 mN/m, and pH of 6–7 at 25 °C was used for the preparation of emulsions.
2.2. Aqueous Dispersions of Nanoclay
The dispersions of various concentrations of the hydrophilic bentonite nanoclay powder were prepared using the Gifford-Wood homogenizer as previously described elsewhere [18]. In brief, a known amount of the nanoclay was dispersed into the ultrapure water without any chemical addition. Lower nanoclay concentrations were obtained by serial dilution. The emulsions were homogenized using a Gifford-Wood homogenizer at 5500 rpm for 45 min. Conductivity, temperature and pH parameters were recorded immediately after homogenization. Care was taken to ensure that the same condition was maintained for all experiments to allow a true comparison of data.
2.3. Preparation of CTAB-Modified Bentonite Nanoclay
The aqueous nanoclay-CTAB samples were prepared with a fixed nanoclay concentration of 1 wt%, followed by the dissolution of the cationic surfactant at room temperature in different concentrations ranging from 0.01 to 0.5 wt% to impact the hydrophobicity of the nanoclay. This mixture, which constituted the NC-Bt–CTAB, hybrid was stirred at 600 rpm for 20 h using a magnetic stirrer and kept at a temperature of 25 ± 0.9 °C. To ensure equilibration, an equilibrium time of 20 h was selected for all experiments. The NC-Bt–CTAB dispersions showed excessive coagulation beyond CTAB concentrations of 0.1 wt%. The conductivity, pH, and temperature of the solutions were recorded before further analysis.
2.4. Preparation of Emulsions
The W/O emulsions were prepared using the Gifford-Wood homogenizer by sequentially adding the aqueous phase (solutions of nanoclay, with and without surfactant) to a fixed volume of the agitated continuous oil phase. Conductivity and temperature data of the emulsion were taken after each addition.
2.5. Contact Angle Measurement
The contact angles of nanoclay dispersions with varying degrees of surfactant modifications were measured at 20 °C using the sessile drop method of the Axisymmetric Drop Shape Analysis-Profile (ADSA-P). The dispersions containing nanoclay–CTAB were spin-coated onto clean glass slides and were left to dry under vacuum at 80 °C. The three-phase advancing contact angle was measured through the water phase. The dispersion-coated glass slides were placed into a Hellma glass curvette containing mineral oil. A small drop was initially dispensed on the surface of the slide, then a continuous injection of water at a rate of 0.5 µL/s was added up to a volume of 40 µL using a programmed, motorized syringe pump. A simplified schematic of the experimental setup for contact angle measurement from a sessile drop is shown in Figure 2.
2.6. Dynamic Light Scattering and Zeta Potential Measurements
The particle size and zeta potential were measured using the Zetasizer Nano-ZS (Malvern Instruments Ltd., Worcestershire, UK) with a He-Ne laser operating at 633 nm frequency. A dip cell was used to measure the zeta potentials of nanoclay dispersion in the absence and presence of increasing amounts of CTAB, using the Smoluchowski equation for converting measured electrophoretic mobilities.
The lateral dimension of dry exfoliated nanoclay was 100–150 nm. The Dynamic Light Scattering (DLS) measurement gave a much larger size of 740 nm. The most likely reason for this discrepancy is the solvation of nanoclay particles. The strong attraction between the negatively charged nanoparticle surface, stabilized by CTAB, and the matrix fluid in the NC-Bt–CTAB system leads to the formation of a film of matrix fluid on the clay surface, as shown schematically in Figure 3. The solvation of nanoparticles is a common occurrence [19,20]. However, some aggregation of nanoclay particles cannot be ruled out.
The effect of CTAB concentration on the electrokinetic properties of bentonite nanoclay particles was measured at 25 °C, with an equilibration time of 120s and 20 runs of three measurement cycles per sample.
3. Results and Discussion
3.1. Electron Microscopy
A FEI QUANTA FEG 250 scanning electron microscope (SEM) was used to study the morphology of the samples. For analyses, dried aqueous dispersions of NC-Bt and NC-Bt–CTAB were mounted onto the equipment platform using carbon tape. Images of the surface morphology of the dispersions are shown in Figure 4.
The SEM images show the variation in the degrees of aggregation in the clay morphology, with or without surfactant. Figure 4a shows the clay morphology without surfactant, while Figure 4b,c show the clay morphology in the presence of 0.05 wt% CTAB and 0.1 wt% CTAB, respectively. In the absence of surfactant, the nanoclay shows a relatively more aggregated morphology with a greater surface area. However, in the presence of surfactant, the SEM images show a reduction in the aggregation and clay particle size. The variation in concentration of CTAB seems to have an effect on the aggregation of clay particles, and hence their particle size.
3.2. Dynamic Light Scattering and Zeta Potential Results
The particle size distribution was measured with at least three separate measurements per dispersion. The size distributions are shown in Figure 5 for two different nanoclay concentrations of 0.1 and 1 wt %. The particle size changes due to nanoclay concentration are negligible. The average particle diameter is 740 nm ± 30 nm.
Figure 6 presents the change of zeta potential values of nanoclay–CTAB dispersions as a function of CTAB. The zeta potential obtained for the NC-Bt dispersion in the absence of CTAB is −11.4 mV ± 0.9. A slight increase in this value was observed with the addition of a cationic surfactant. This can be explained by the adsorption of cationic CTAB onto negatively charged nanoclay. An eventual sign change noticed beyond the critical micelle concentration of CTAB is likely due to the formation of micelles.
3.3. Contact Angle
The wettability of particles is widely known to be a predictor of the stability of emulsions. To further elucidate n the stability of surfactant-stabilized nanoclay emulsions, the contact angles of water drops on the substrates in air and in oil were measured. The mean of the advancing contact angles of approximately 20 drops was taken for each sample. Figure 7 shows the advancing contact angles of water in air (squares) or in oil (circles) on the substrate coated onto the slides. The contact angle data are plotted as a function of the varying concentration of CTAB in 1 wt% nanoclay concentration. Figure 8 shows the selected images of the three-phase contact angle formed by 40 µL of water dispensed onto the surface of the glass slides coated with 1 wt% nanoclay with various degrees of CTAB modification (Figure 8a, 0; Figure 8b, 0.01, Figure 8c, 0.03; and Figure 8d, 0.05 wt%.
The advancing contact angle for the dispersion of 1 wt% nanoclay in air was estimated to be 15 ± 1.2° without surfactant, and increased to 50 ± 2.6° at the highest concentration of surfactant of 0.05 wt%. Upon immersion in the oil phase, the contact angle further increased from 20 ± 2.9° to 68 ± 3.2° of pure clay and surfactant-modified nanoclay, respectively. The increase in the contact angle with an increase in the degree of modification of nanoclay with CTAB can be attributed to the enhanced hydrophobicity of nanoclay resulting from adsorption of a cationic surfactant CTAB.
3.4. Emulsions Stabilized by Unmodified Bentonite Nanoclay
The influence of unmodified bentonite nanoclay dispersed in ultrapure water on the catastrophic phase inversion of a W/O emulsion was investigated. Figure 9 shows the variation of the electrical conductivity of the nanoclay-stabilized water–mineral oil emulsions with the volume fraction of the aqueous phase. The emulsions formed at the volume fractions with low conductivity are W/O type emulsions. As shown in Figure 9, the phase inversion from W/O to O/W emulsion is depicted by the sharp increase in the electrical conductivity, which occurred at water volume fractions between 0.22 and 0.31. Further sequential addition of the aqueous phase to the resulting O/W emulsion (after the phase inversion has occurred) led to higher conductivity values, which became more prominent with an increase in the weight % of the added clay. As can be seen in Figure 9, the slope of the electrical conductivity versus water volume fraction relationship, after phase inversion from W/O to O/W emulsion, increases with the increase in the concentration of nanoclay.
To expound the relationship between the critical phase inversion volume fraction of water and the nanoclay concentration, the volume fraction of water where phase inversion took place was plotted against the nanoclay concentration, as shown in in Figure 10. Figure 10 shows that the critical phase inversion volume fraction is reduced to lower water volume fractions as the concentration of the dispersed nanoclay is increased. The critical volume fraction decreases from 31% to 22% with an increase in the nanoclay concentration from 0 to 5 wt%. This was not unexpected, as the incorporation of hydrophilic clay into the emulsion system shifts the hydrophilic–lipophilic balance (HLB) of the system towards a higher value, hence favoring the formation of an O/W emulsion.
3.5. Emulsions Stabilized Solely by CTAB
The behavior of cationic surfactant CTAB dispersed in ultrapure water was investigated to determine its effect on the catastrophic phase inversion from W/O emulsion to O/W emulsion. Figure 11 shows the variation in conductivity of the CTAB-stabilized water–mineral oil emulsions with respect to the volume fraction of water. As shown in Figure 11, the phase inversion from W/O to O/W emulsion is depicted by the sharp increase in the conductivity, which occurred at water volume fractions between 0.31 and 0.52. Further sequential addition of the aqueous phase to the resulting O/W emulsion after the phase inversion led to higher conductivity values, which become more prominent with the increase in the weight % of the added CTAB. As shown in Figure 11, the slope of the relationship increases with increase in the concentration of CTAB. This behavior is similar to that observed when nanoclay was used as the emulsion stabilizer.
To illustrate the relationship between the phase inversion water volume fraction and the CTAB concentration, the critical water volume fraction is plotted against CTAB concentration in Figure 12.
The figure clearly shows that phase inversion from W/O to O/W emulsion is delayed initially to higher water volume fractions of up to 0.52 as the concentrations of the surfactant CTAB is increased. The trend of the critical volume fraction against CTAB concentration peaked at a CTAB concentration of 0.03 wt% (the critical micelle concentration of CTAB) and then decreased continuously to a critical volume fraction of 0.4 up to a CTAB concentration of 0.25 wt%. Higher CTAB concentrations beyond this point (0.25 wt%) had little effect on the critical volume fraction of phase inversion. This behavior is different from what was observed when nanoclay was used as the emulsion stabilizer, but it is important to note that the selected CTAB concentration range is lower than the nanoclay concentration range by an order of magnitude. When a higher concentration of CTAB was used, significant foaming of the emulsion was observed.
3.6. Comparing the Effects of CTAB Alone and Unmodified Nanoclay Alone on Catastrophic Phase Inversion of W/O Emulsions
Figure 9 and Figure 11 show a similar trend in the behavior of the stabilized emulsion regardless of whether nanoclay or CTAB was used as an emulsion stabilizer. The figures show a directly proportional relationship between the conductivity of the emulsion and the aqueous phase volume fraction for different weight percentages of the stabilizer, and the slope of the relationship increases with an increase in the weight percent of the stabilizer. To further investigate the relationship between the critical volume fraction and the concentration of the stabilizer, the stabilizer concentrations were normalized and plotted against the critical volume fraction of water, as depicted in Figure 13. C/Co is the normalized stabilizer concentration where C is the actual sample concentration at the nominal concentration of Co. Figure 13 shows that the critical volume fraction of the aqueous phase when CTAB was used as the stabilizer was higher when compared to unmodified nanoclay. Although they both follow similar trends, it can be concluded that using nanoclay as the stabilizer speeds up the phase inversion process of W/O to O/W emulsion in comparison with CTAB as the emulsion stabilizer.
3.7. Emulsions Stabilized by Surfactant-Modified Bentonite Nanoclay (NC-Bt–CTAB)
The interaction of a clay surface with a polymeric matrix is commonly enhanced by surface modification [21]. Therefore, we investigated the effects of 1 wt% nanoclay solution combined with various concentrations of CTAB on the catastrophic phase inversion of a W/O emulsion. Figure 14 shows the variations in the electrical conductivity of the nanoclay–CTAB emulsion mix with respect to the aqueous phase volume fraction. The CTAB concentration was increased up to 0.1 wt%. During the experiments, it was observed that the CTAB coagulates the nanoclay at CTAB concentrations beyond 0.1 wt% in the presence of oil. Hence, the phase inversion experiments were restricted to using nanoclay solutions containing CTAB in the concentration range of 0.01 to 0.1 wt%.
As shown in Figure 14, the phase inversion from W/O to O/W emulsion is depicted by a sharp increase in the electrical conductivity, which occurred at water volume fractions in the range of 0.25 to 0.42. Further sequential addition of the aqueous phase to the resulting O/W emulsion after the phase inversion occurred, which led to higher conductivity values that became more prominent with an increase in the weight % of CTAB at a constant concentration of nanoclay. This behavior is similar to what was observed when nanoclay or CTAB alone was used as the emulsion stabilizer, as shown previously in Figure 9 and Figure 11. However, it is evident that the adsorption of CTAB onto the surfaces of the nanoclay particles leads to the localization of nanoclay particles at the oil–water interface, resulting in the delayed inversion process.
Figure 15 shows the relationship between the critical volume fraction of water and CTAB concentrations for emulsions stabilized by CTAB-modified nanoclay. The critical water fraction increases from 0.24 to 0.41 with increasing CTAB concentration from 0 to 0.05 wt%. Although not shown in the figure, the critical volume fraction plateaued from CTAB concentrations of 0.05 wt% until 0.1 wt%. The linear relationship between the critical water fraction and the CTAB concentration shown up to 0.05 wt % concentration is seen to follow an equation:
where Y is the critical water volume fraction and C is the CTAB concentration in wt%. Thus, the surfactant-modified nanoclay delays the phase inversion from W/O to O/W emulsion up to a CTAB concentration of 0.05 wt%.
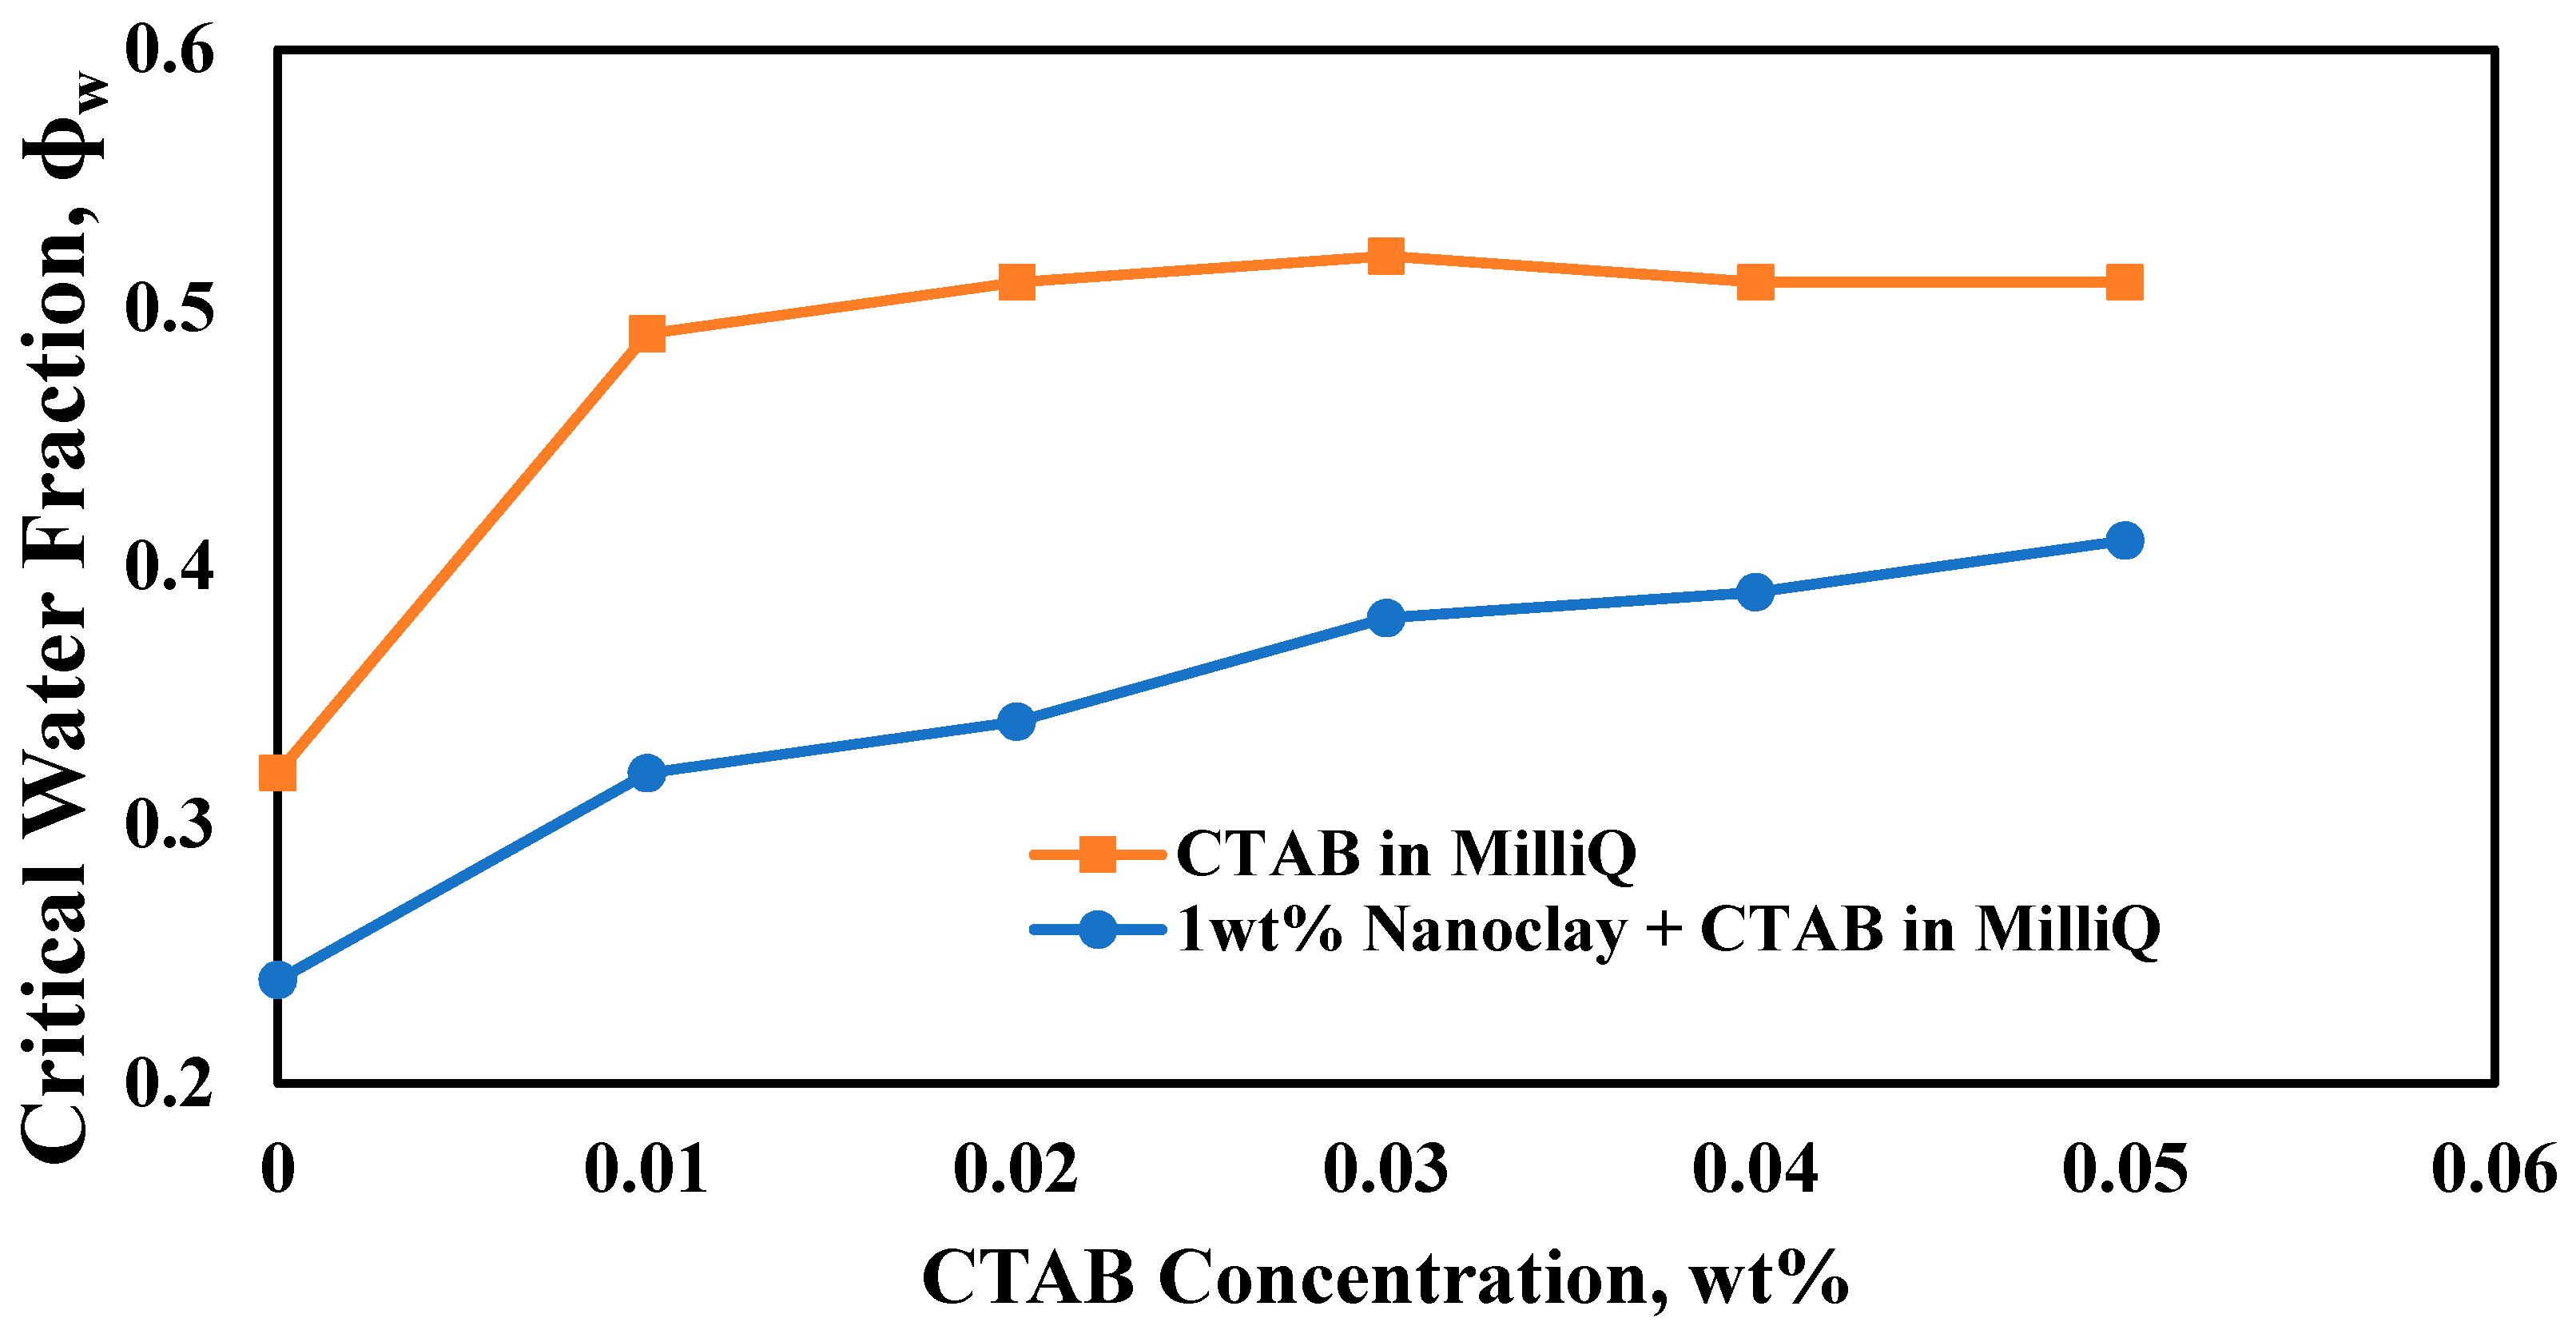
To further investigate the effects of nanoclay on the critical volume fraction of phase inversion from W/O to O/W emulsion, the critical volume fraction of water at varying CTAB concentrations was compared for an emulsion stabilized by pure CTAB and an emulsion stabilized by 1 wt% nanoclay–CTAB. The comparison plots shown in Figure 16 are limited to the dilute CTAB concentrations within the Critical Micelle Concentration (CMC) region up to 0.05 wt% CTAB. Figure 16 shows that the critical volume fraction of the aqueous phase when pure CTAB was employed as the stabilizer was higher in comparison with CTAB-modified nanoclay as the stabilizer. Although they both exhibit the same trends, it can be concluded that using the CTAB-modified nanoclay as the emulsion stabilizer speeds up the inversion process when compared to using CTAB alone as the emulsion stabilizer.
4. Conclusions
The emulsifying nature of hydrophilic bentonite nanoclay can be enhanced by modification with surfactants such as cationic CTAB. The zeta potential measurements confirm the alteration of the surface charge of nanoclay as a result of CTAB adsorption. The contact angle measurement confirms increased hydrophobicity of nanoclay particle surfaces due to the formation of a monolayer of cationic CTAB molecules. The critical volume fraction of the aqueous phase, where phase inversion from W/O to O/W emulsion takes place, was higher when CTAB alone was used as the stabilizer as compared with bentonite nanoclay alone. It was evident that the adsorption of CTAB onto the surfaces of the nanoclay particles led to the localization of clay particles at the oil–water interface, which resulted in the delayed inversion process from W/O to O/W emulsion.
Author Contributions
This project of phase inversion of emulsions with and without interfacial additives was conceived by R.P. All the experimental work was done by S.B.O. Data analysis was done by both S.B.O. and R.P. The manuscript was written by both S.B.O. and R.P. All authors have read and agreed to the published version of the manuscript.
Funding
This research was funded by Natural Sciences and Engineering Research Council of Canada (NSERC) Strategic Partnership Grant.
Conflicts of Interest
The authors declare no conflict of interest.
References
- Binks, B.P.; Lumsdon, S.O. Catastrophic Phase Inversion of Water-in-Oil Emulsions Stabilized by Hydrophobic Silica. Langmuir 2000, 16, 2539–2547. [Google Scholar] [CrossRef]
- Binks, B.P. Particles as surfactants—Similarities and differences. Curr. Opin. Colloid Interface Sci. 2002, 7, 21–41. [Google Scholar] [CrossRef]
- Aveyard, R.; Binks, B.P.; Clint, J.H. Emulsions Stabilised Solely by Colloidal Particles. Adv. Colloid Interface Sci. 2003, 102, 503–546. [Google Scholar] [CrossRef]
- Binks, B.P. Influence of Particle Wettability on the Type and Stability of Surfactant-Free Emulsions. Langmuir 2000, 16, 8622–8631. [Google Scholar] [CrossRef]
- Tunc, S.; Duman, O.; Kanci, B. Rheological measurements of Na-bentonite and sepiolite particles in the presence of tetradecyltrimethylammonium bromide, sodium tetradecyl sulfonate and Brij 30 surfactants. Colloids Surf. A Physicochem. Eng. Asp. 2012, 398, 37–47. [Google Scholar] [CrossRef]
- Moosavi, M. Bentonite clay as a natural remedy: A brief review. Iran. J. Public Health 2017, 46, 1176–1183. [Google Scholar]
- Perotti, G.F.; Barud, H.S.; Messaddeq, Y.; Ribeiro, S.J.L.; Constantino, V.R.L. Bacterial cellulose-laponite clay nanocomposites. Polymer 2001, 52, 157–163. [Google Scholar] [CrossRef]
- Karkamkar, A.; Aardahl, C.; Autrey, T. Advanced Applications of Engineered Nanomaterials. Mater. Matters 2007, 2, 10–15. [Google Scholar]
- Jian, X.; Xuebing, W.; Bingyao, D.; Qingsheng, L. Modification of montmorillonite by different surfactants and its use for the preparation of polyphenylene sulfide nanocomposites. High Perform. Polym. 2016, 28, 618–629. [Google Scholar] [CrossRef]
- Tsugita, A.; Takemoto, S.; Mori, K. Studies on O/W Emulsions Stabilized with Insoluble Montmorillonite-Organic Complexes. J. Colloid Interface Sci. 1983, 95, 551–560. [Google Scholar] [CrossRef]
- Tambe, D.; Paulis, J.; Sharma, M.M. Factors Controlling the Stability of Colloid-Stabilized Emulsions. J. Colloid Interface Sci. 2002, 171, 463–469. [Google Scholar] [CrossRef]
- Cui, Z.G.; Yang, L.L.; Cui, Y.Z.; Binks, B.P. Effects of surfactant structure on the phase inversion of emulsions stabilized by mixtures of silica nanoparticles and cationic surfactant. Langmuir 2010, 26, 4717–4724. [Google Scholar] [CrossRef] [PubMed]
- Yan, N.; Masliyah, J.H. Effect of pH on adsorption and desorption of clay particles at oil–water interface. J. Colloid Interface Sci. 1996, 181, 20–27. [Google Scholar] [CrossRef]
- Kim, J.K.; Rühs, P.A.; Fischer, P.; Hong, J.S. Interfacial localization of nanoclay particles in oil-in-water emulsions and its reflection in interfacial moduli. Rheol. Acta 2013, 52, 327–335. [Google Scholar] [CrossRef]
- Cipriano, B.H.; Raghavan, S.R.; McGuiggan, P.M. Surface tension and contact angle measurements of a hexadecyl imidazolium surfactant adsorbed on a clay surface. Colloids Surf. A Physicochem. Eng. Asp. 2005, 262, 8–13. [Google Scholar] [CrossRef]
- Desmond, A.; Desai, F.; Hayes, K. Effect of cationic surfactants on organic liquid-water capillary pressure-saturation relationships. Water Resour. Res. 1994, 30, 333–342. [Google Scholar] [CrossRef]
- Jouany, C.; Chassin, P. Determination of the Surface Energy of Materials by Using Contact Angle Measurements. Colloids Surf. 1987, 27, 289–303. [Google Scholar] [CrossRef]
- Ogunlaja, S.B.; Pal, R.; Sarikhani, K. Effects of starch nanoparticles on phase inversion of Pickering emulsions. Can. J. Chem. Eng. 2018, 96, 1089–1097. [Google Scholar] [CrossRef]
- Pal, R. Modeling of Sedimentation and Creaming in Suspensions and Pickering Emulsions. Fluids 2019, 4, 186. [Google Scholar] [CrossRef] [Green Version]
- Pal, R. A novel method to determine the thermal conductivity of interfacial layers surrounding the nanoparticles of a nanofluid. Nanomaterials 2014, 4, 844–855. [Google Scholar] [CrossRef] [Green Version]
- Gabr, M.H.; Phong, N.T.; Abdelkareem, M.A.; Okubo, K.; Uzawa, K.; Kimpara, I.; Fujii, T. Mechanical, thermal, and moisture absorption properties of nano-clay reinforced nano-cellulose biocomposites. Cellulose 2013, 20, 819–826. [Google Scholar] [CrossRef]
Figure 1.
Schematic of a multiscale water-in-oil (W/O) emulsion system, with an emphasis on water droplets stabilized by surfactant-modified nanoclay. Note: CTAB = cetyltrimethyl ammonium bromide.
Figure 1.
Schematic of a multiscale water-in-oil (W/O) emulsion system, with an emphasis on water droplets stabilized by surfactant-modified nanoclay. Note: CTAB = cetyltrimethyl ammonium bromide.
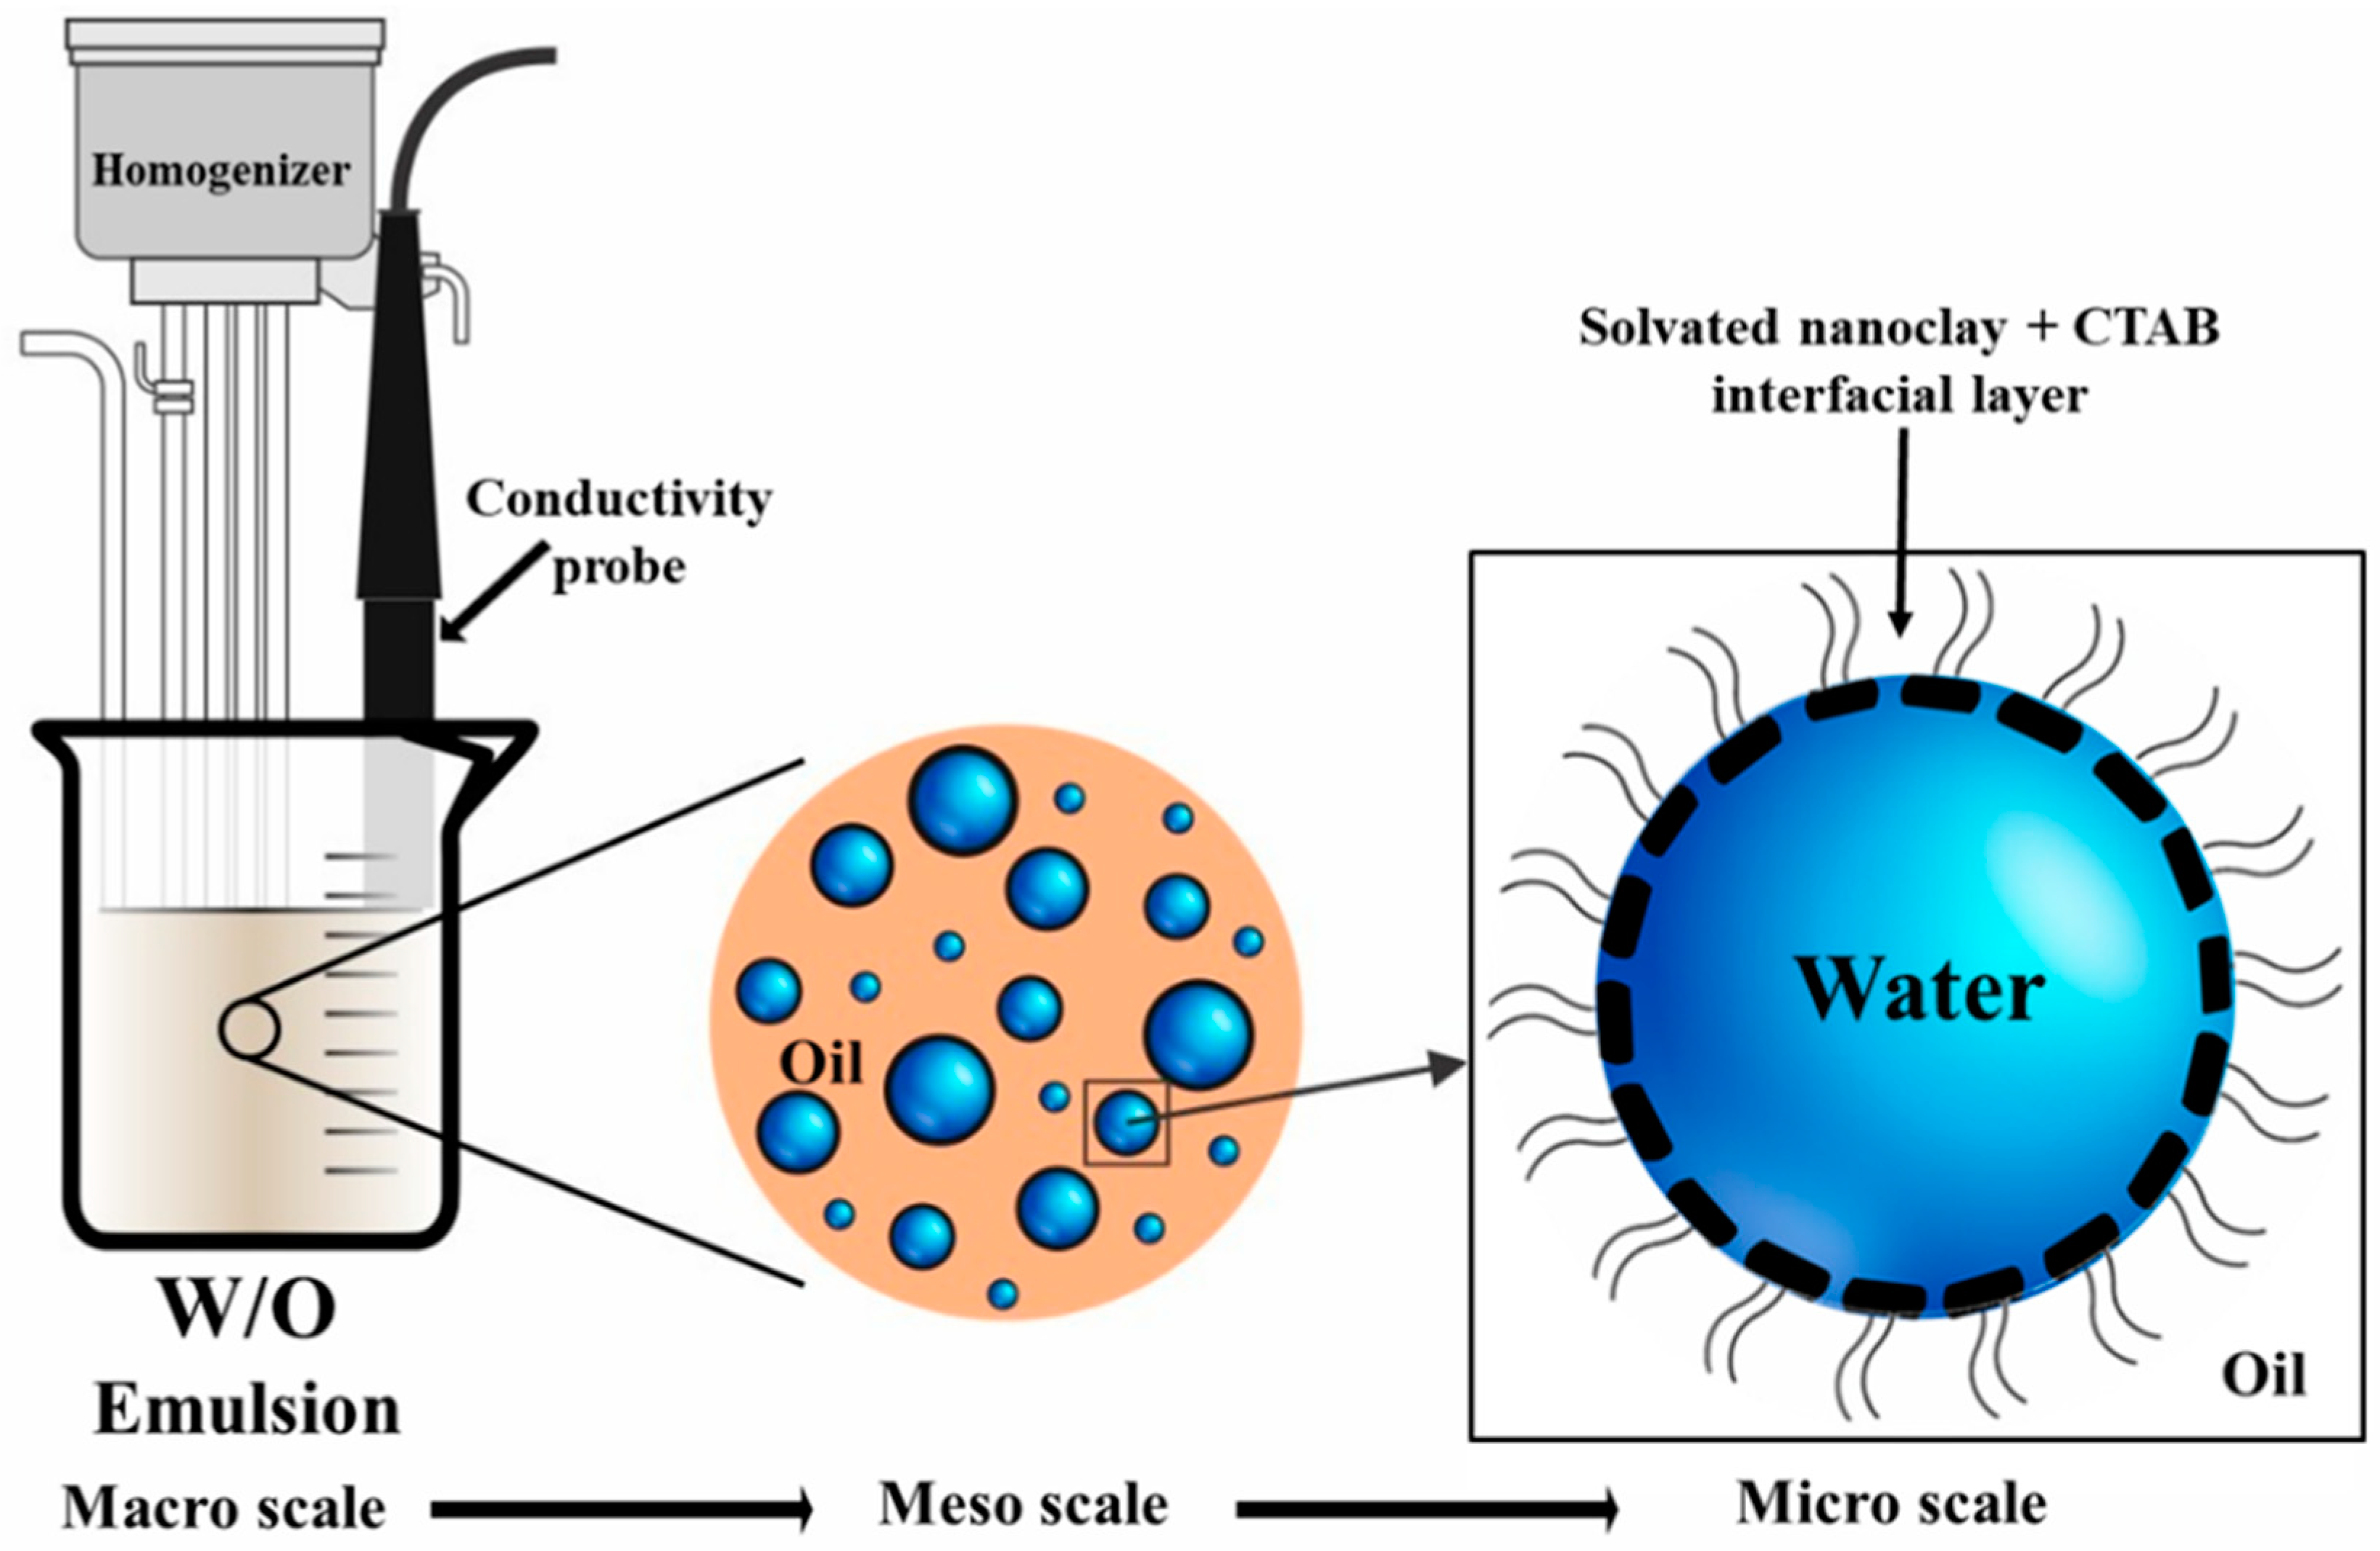
Figure 2.
Schematic of the sessile drop method for measuring contact angle.

Figure 3.
Nanoclay coated with immobilized dispersing aqueous film.
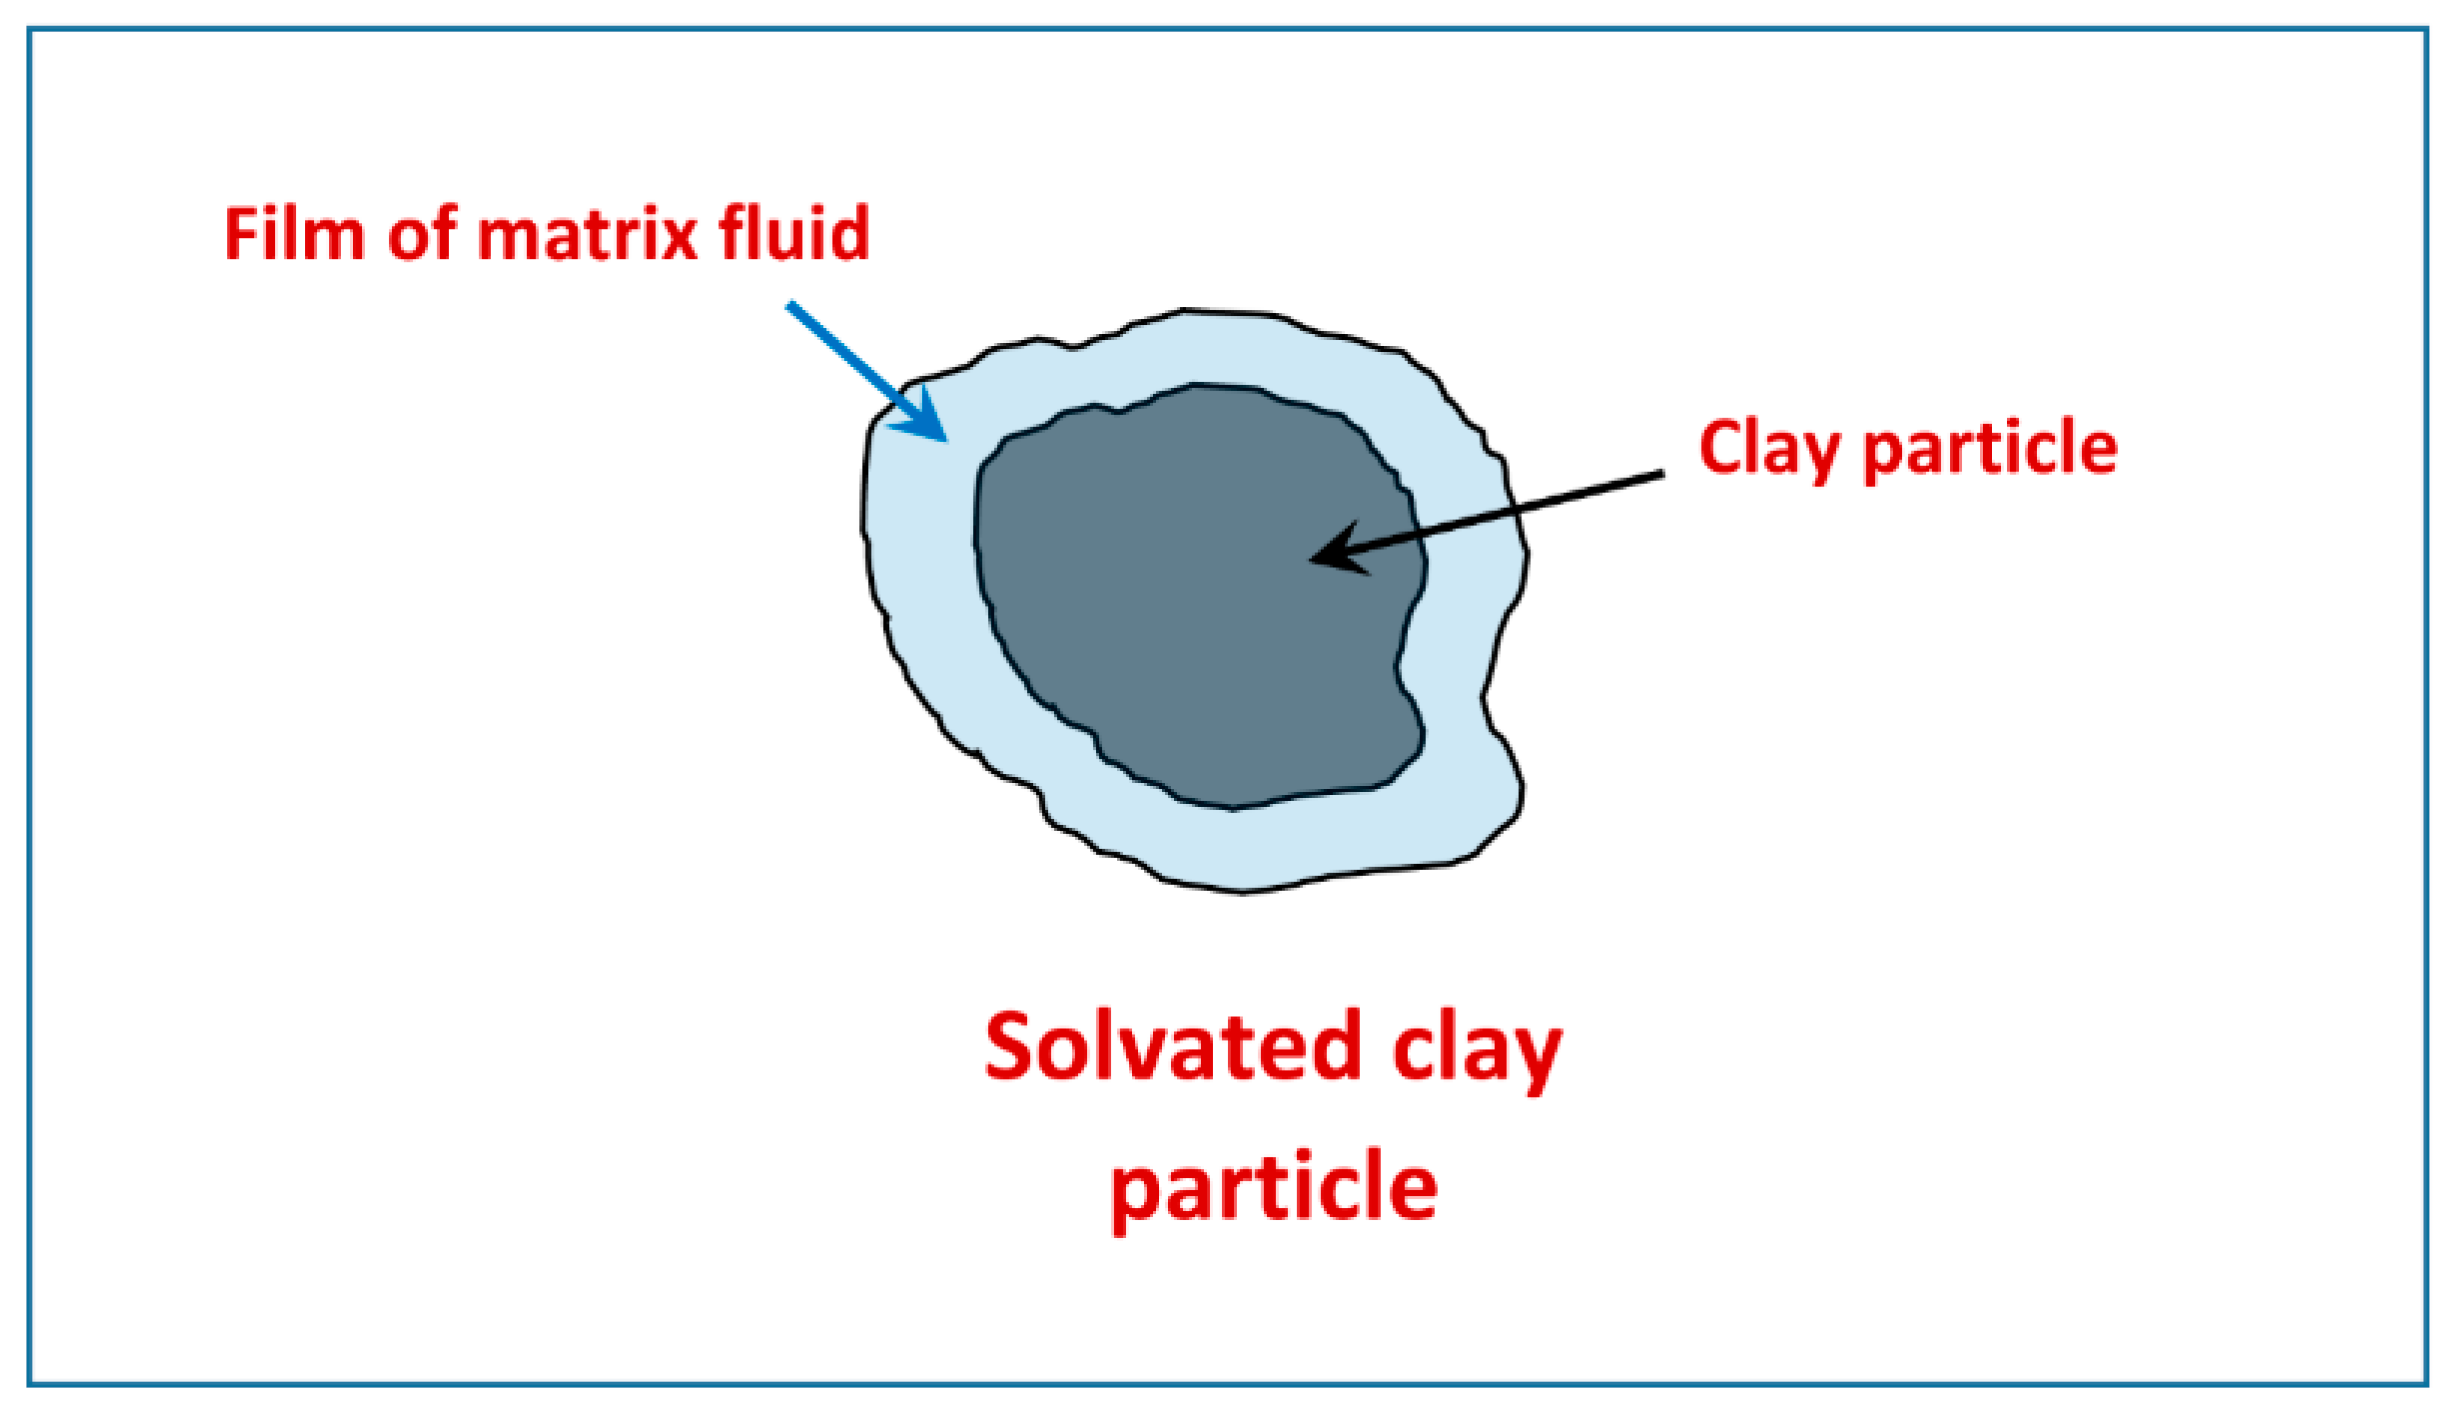
Figure 4.
Scanning electron microscopy (SEM) images of dried 1 wt% aqueous dispersions of bentonite nanoclay (NC-Bt)_ in the presence of (a) 0 wt%, (b) 0.05 wt%, and (c) 0.1 wt% CTAB. Scale bar = 40 µm.
Figure 4.
Scanning electron microscopy (SEM) images of dried 1 wt% aqueous dispersions of bentonite nanoclay (NC-Bt)_ in the presence of (a) 0 wt%, (b) 0.05 wt%, and (c) 0.1 wt% CTAB. Scale bar = 40 µm.

Figure 5.
Particle size distribution of 0.1 wt% and 1wt% nanoclay dispersions using DLS: 0.1 wt%, blue circle; 1 wt%, red square.
Figure 5.
Particle size distribution of 0.1 wt% and 1wt% nanoclay dispersions using DLS: 0.1 wt%, blue circle; 1 wt%, red square.
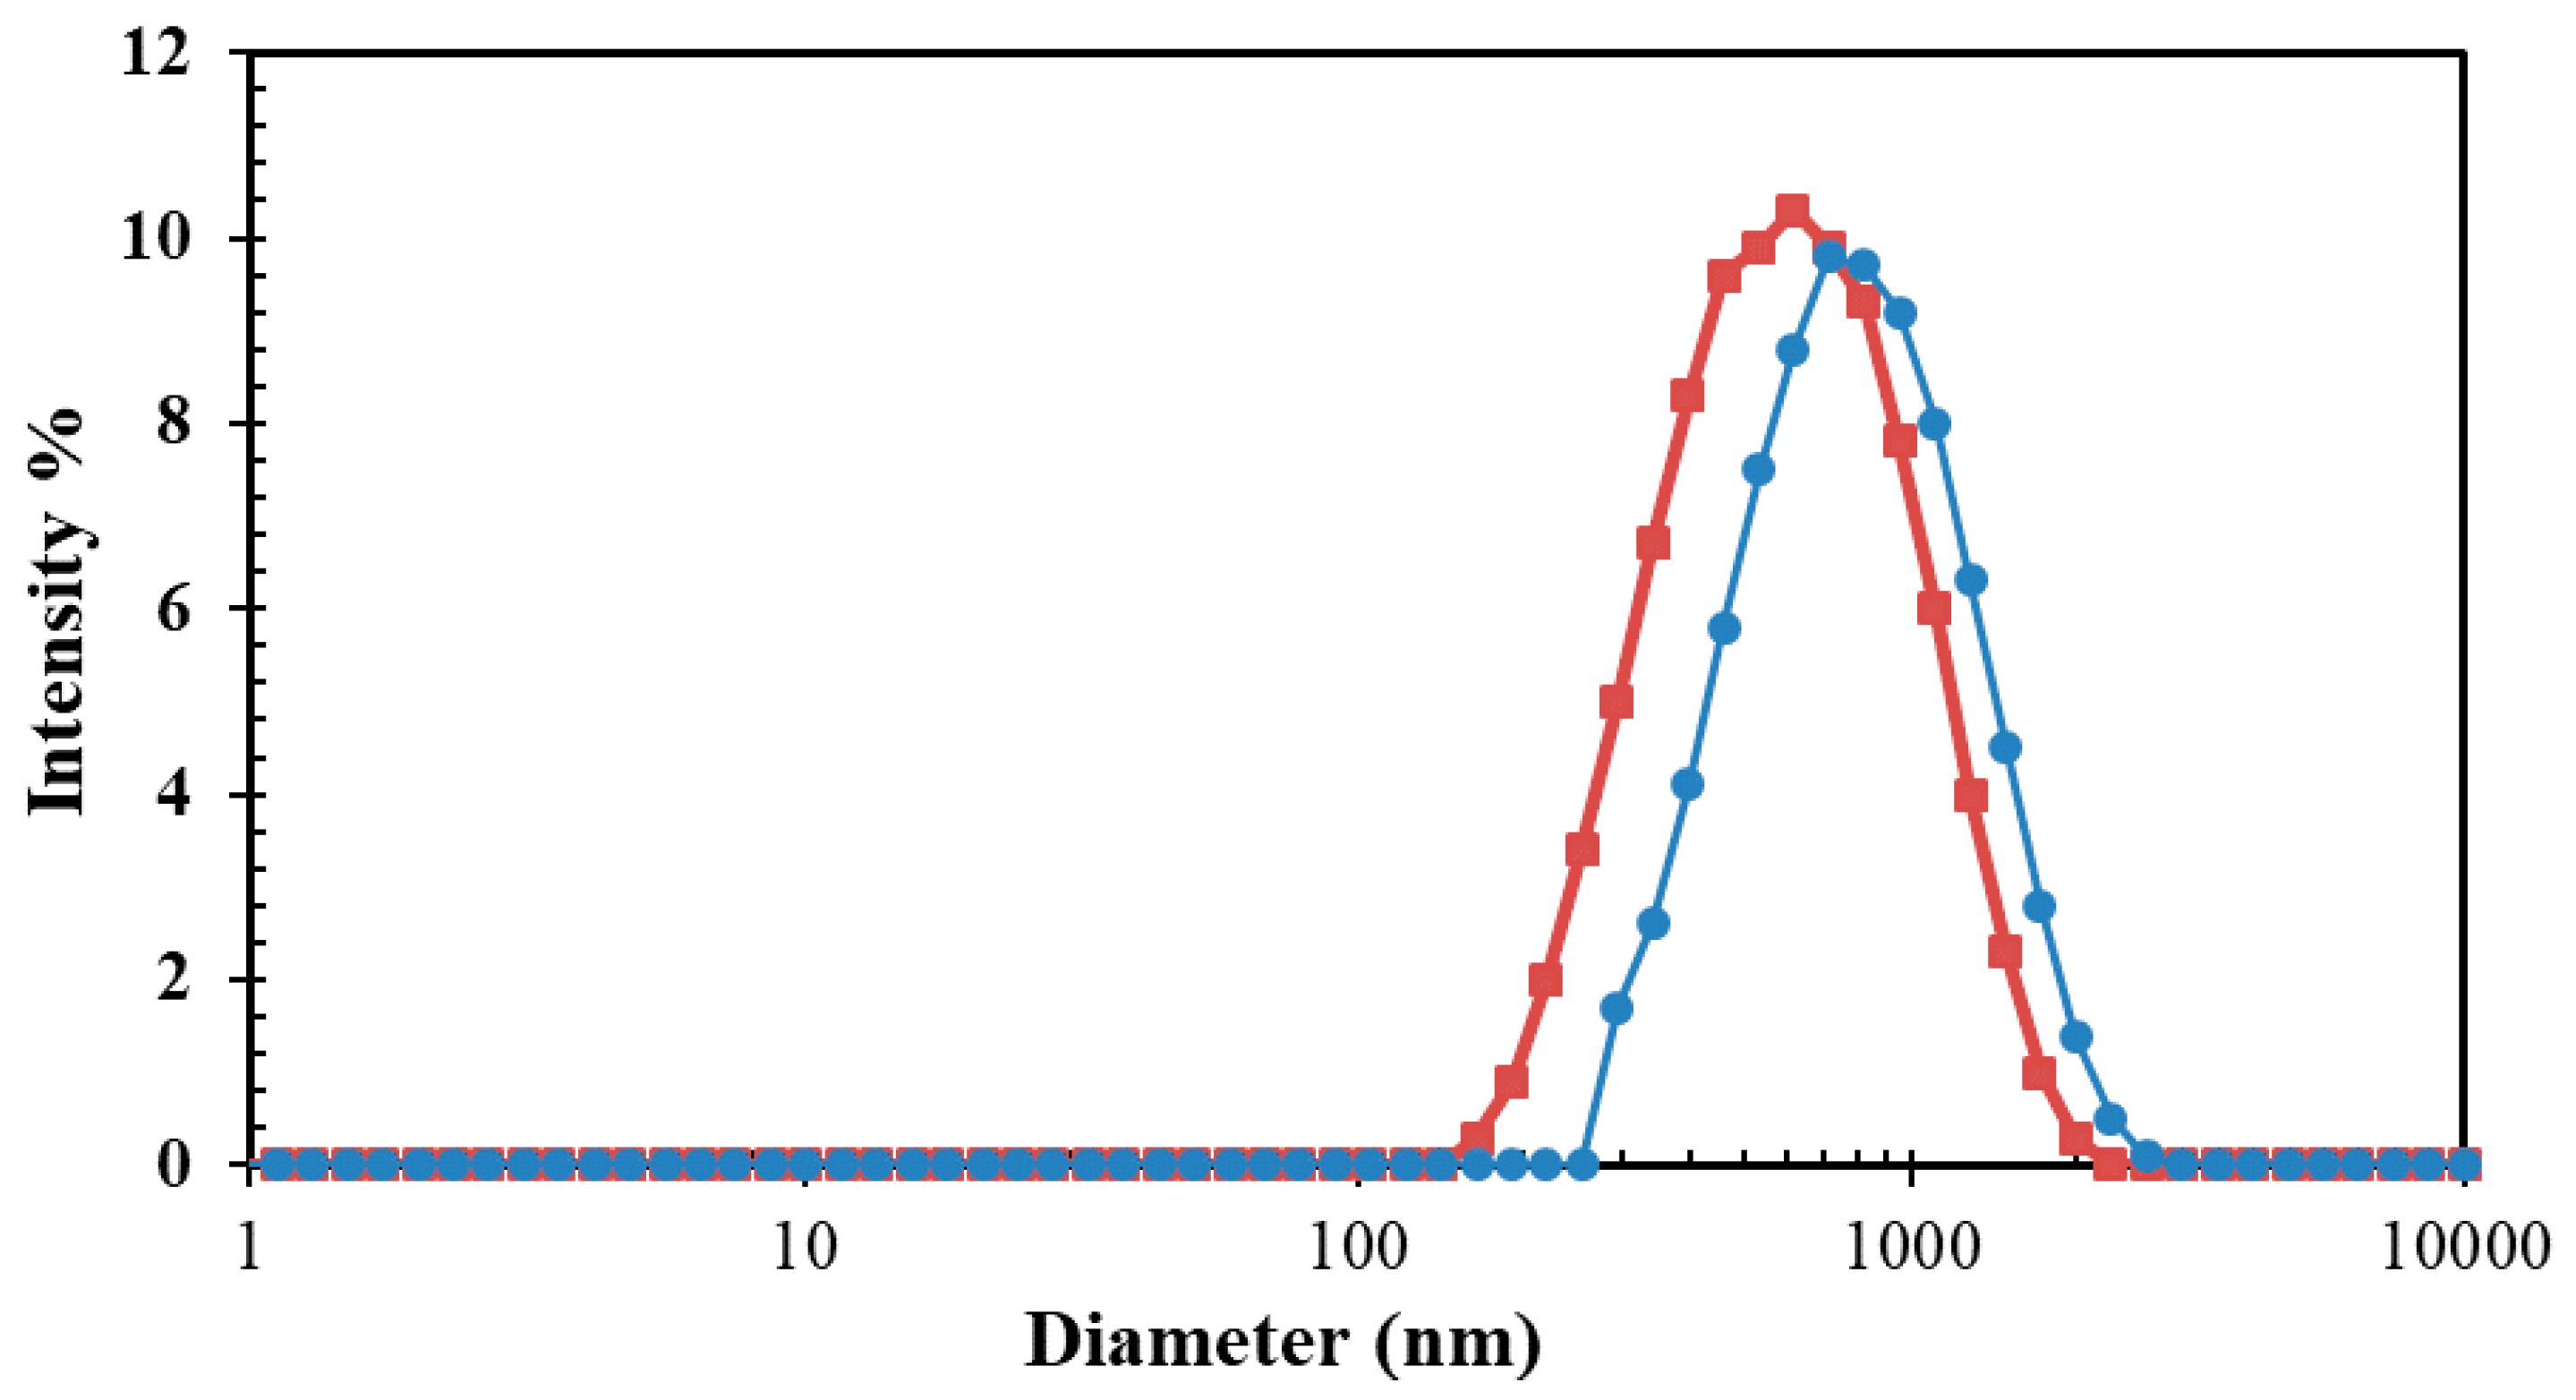
Figure 6.
Variation of zeta potential and 1 wt% nanoclay dispersions as a function of CTAB concentration.
Figure 6.
Variation of zeta potential and 1 wt% nanoclay dispersions as a function of CTAB concentration.
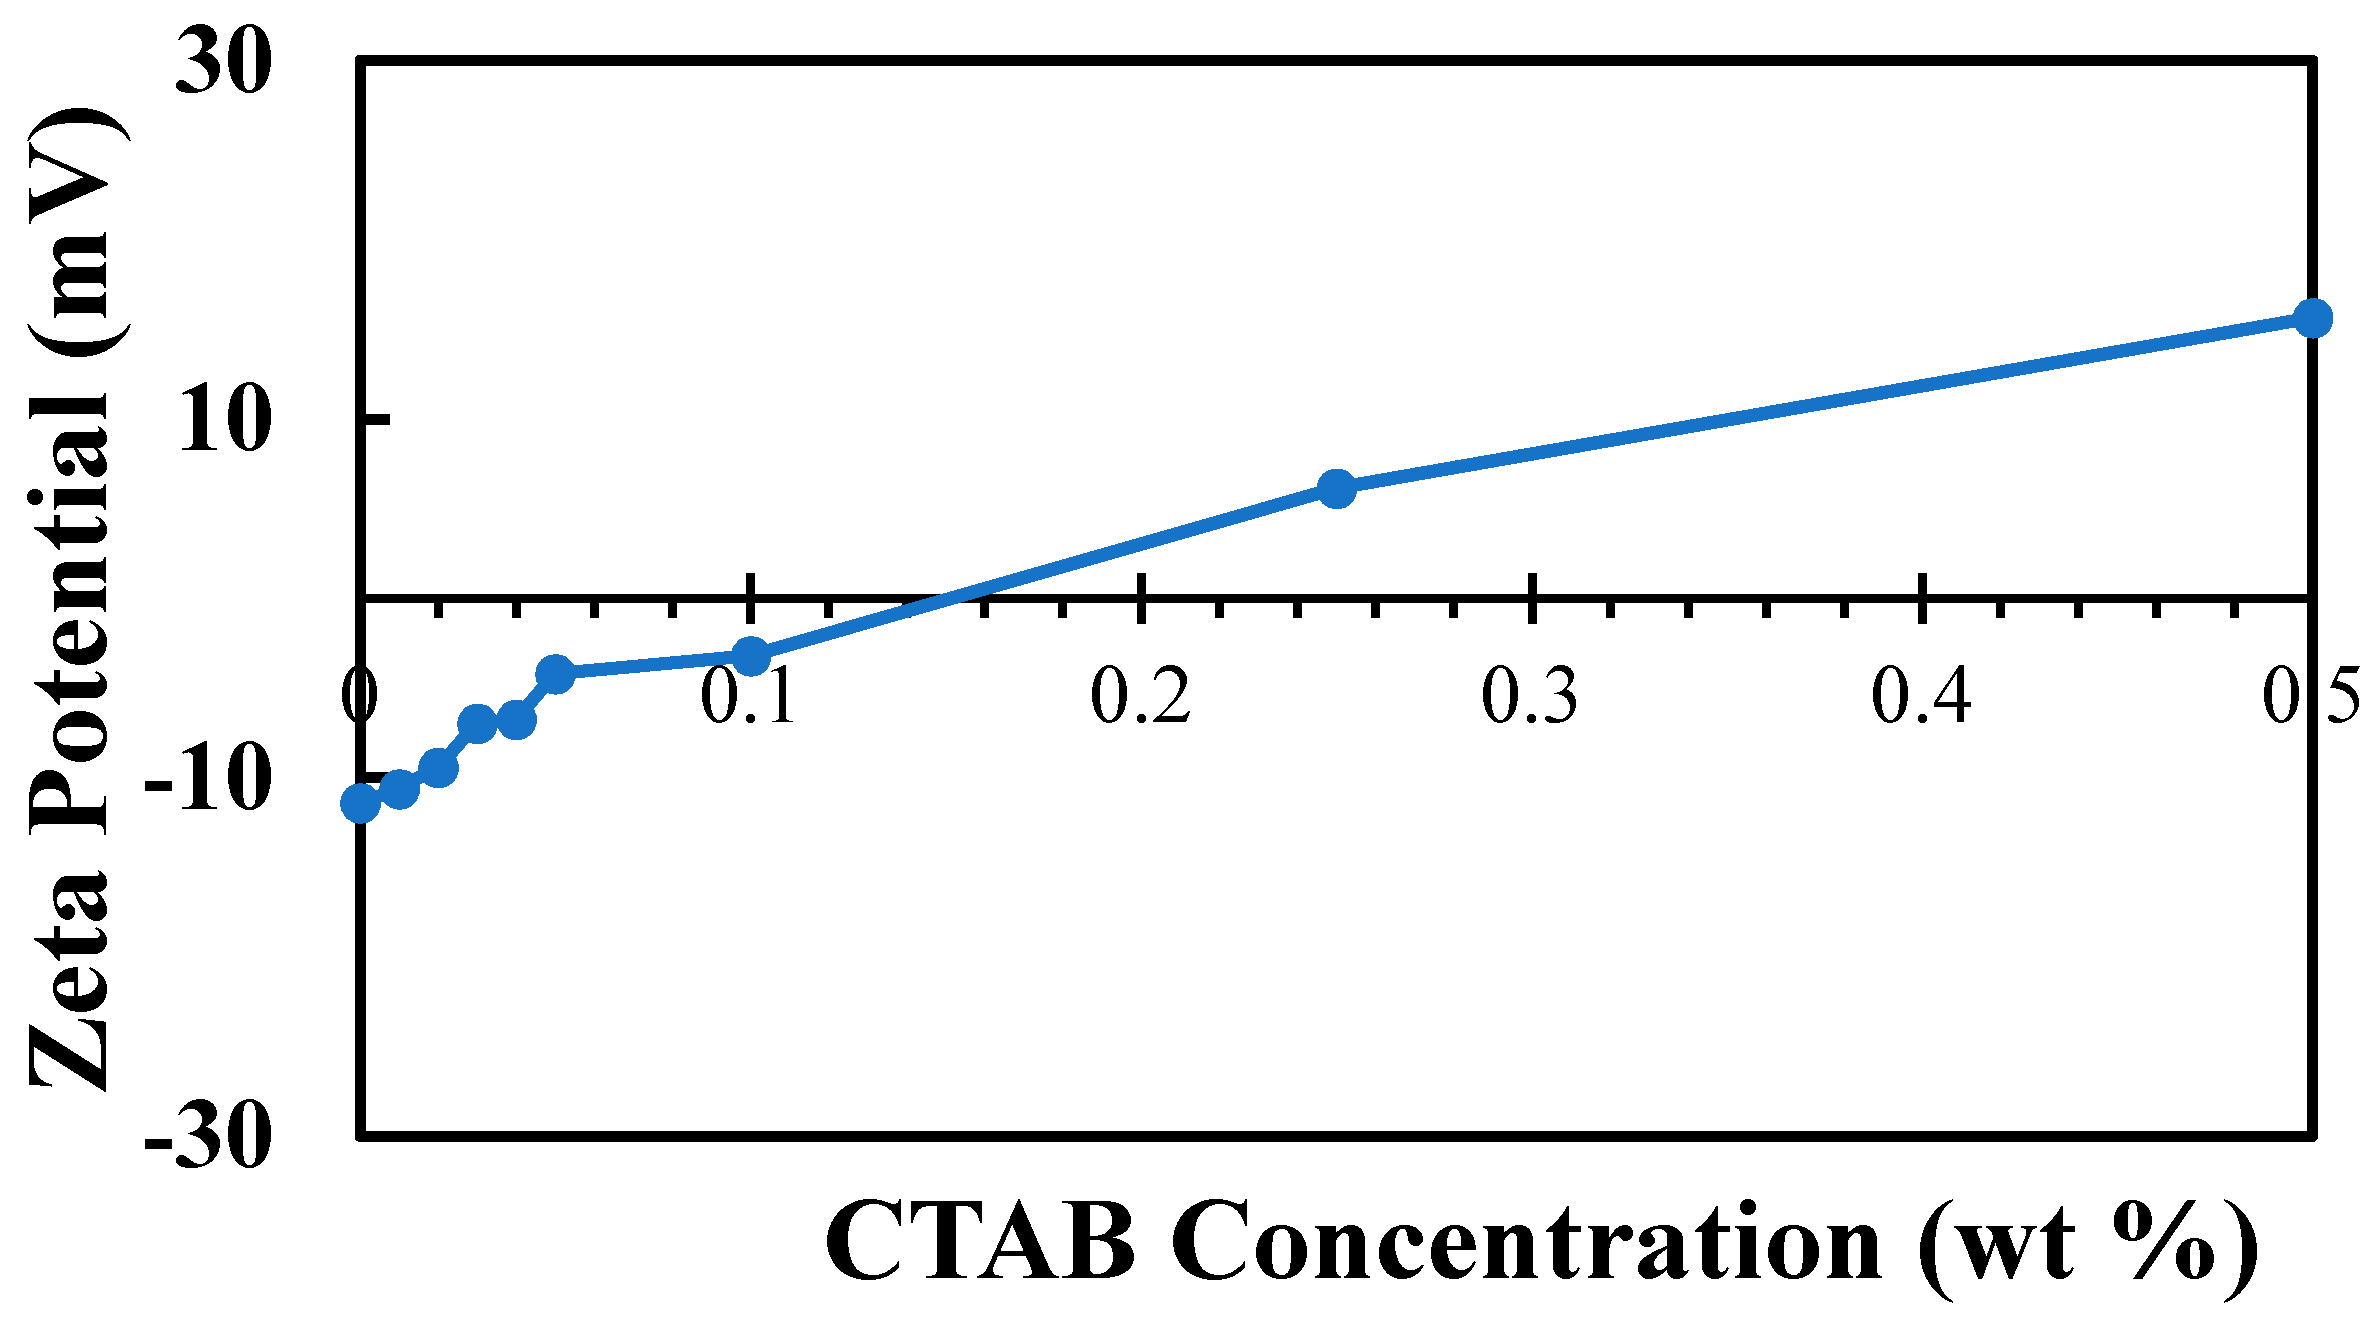
Figure 7.
Variation of contact angles measured of a water drop in air (squares) and in oil (circles) as a function of CTAB concentration in a 1 wt% nanoclay dispersion.
Figure 7.
Variation of contact angles measured of a water drop in air (squares) and in oil (circles) as a function of CTAB concentration in a 1 wt% nanoclay dispersion.

Figure 8.
Images of sessile drop on glass slides coated with 1 wt% nanoclay with CTAB concentrations of: (a) 0, (b) 0.01, (c) 0.03, and (d) 0.05, immersed in the oil phase.
Figure 8.
Images of sessile drop on glass slides coated with 1 wt% nanoclay with CTAB concentrations of: (a) 0, (b) 0.01, (c) 0.03, and (d) 0.05, immersed in the oil phase.
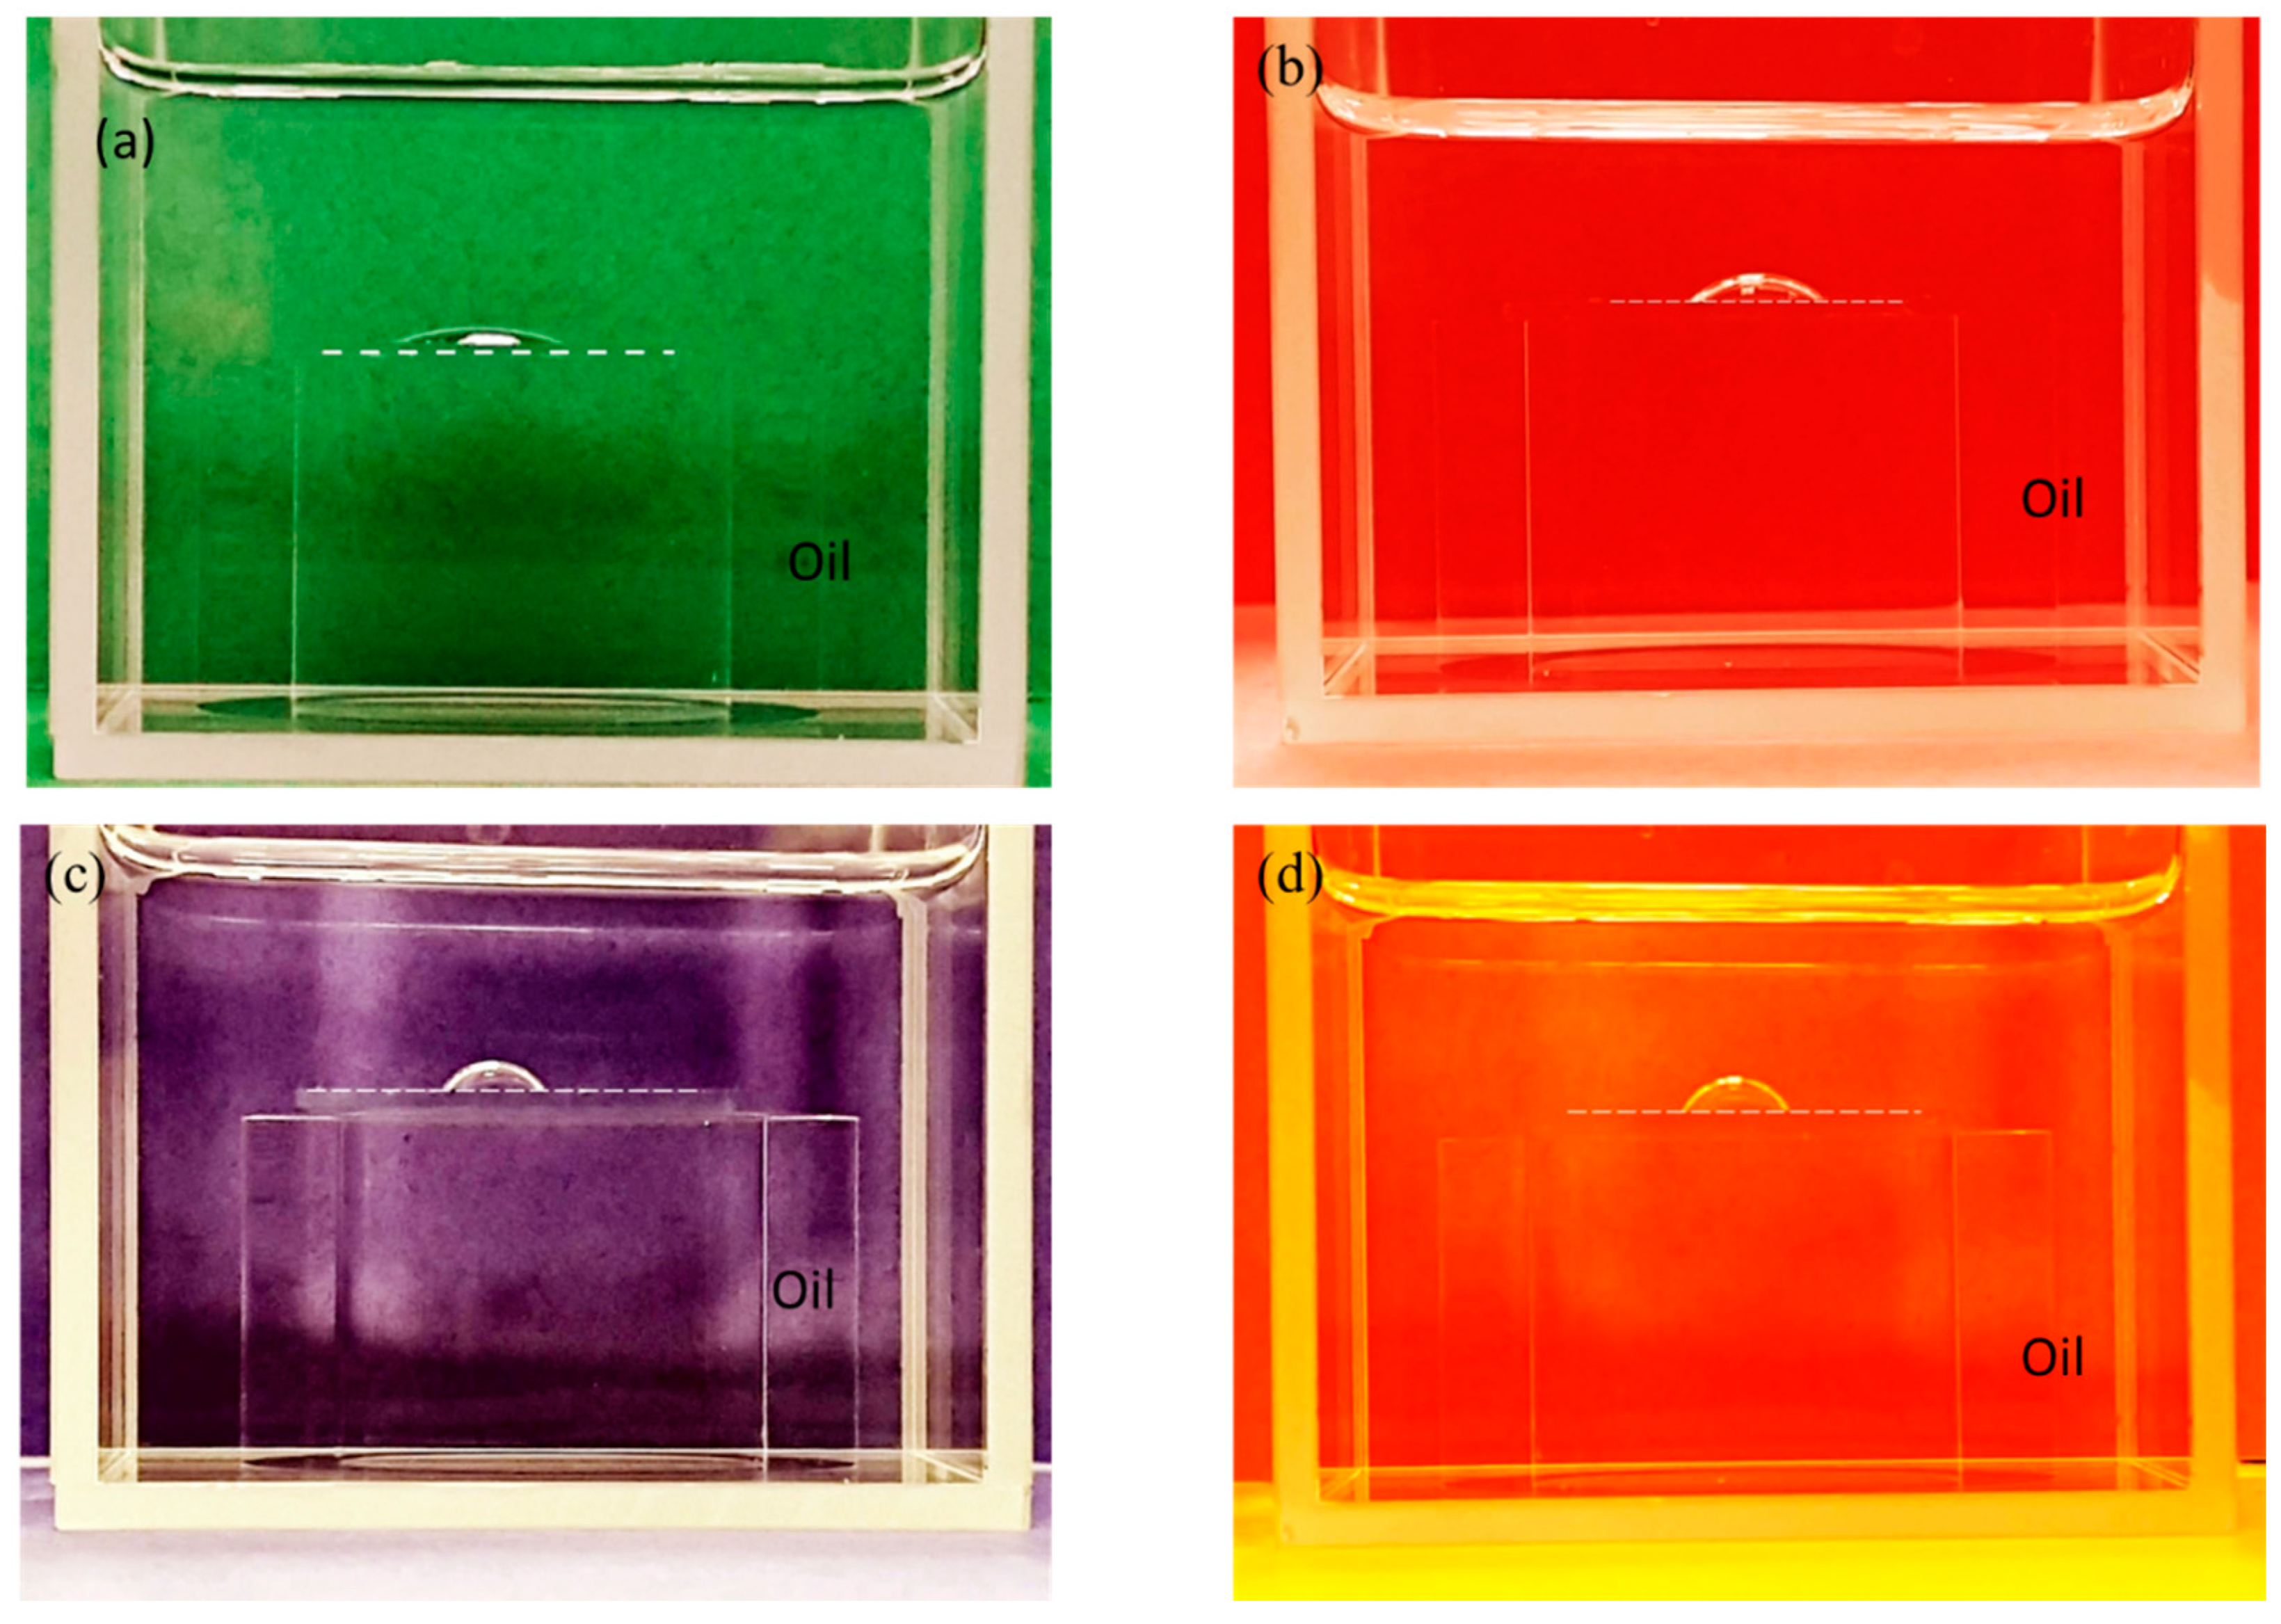
Figure 9.
Conductivity of water–mineral oil emulsions stabilized by nanoclay solutions (0, 0.25, 0.5, 1, 1.75, 2.5, and 5 wt%) as a function of the volume fraction of water. Note: VF = volume fraction of water where phase inversion is observed.
Figure 9.
Conductivity of water–mineral oil emulsions stabilized by nanoclay solutions (0, 0.25, 0.5, 1, 1.75, 2.5, and 5 wt%) as a function of the volume fraction of water. Note: VF = volume fraction of water where phase inversion is observed.

Figure 10.
Critical volume fraction of water versus nanoclay concentration.

Figure 11.
Conductivity of water-mineral oil emulsions stabilized by pure CTAB solutions (0, 0.01, 0.02, 0.03, 0.04, 0.05, 0.25, and 0.5 wt%) as a function of the volume fraction of water.
Figure 11.
Conductivity of water-mineral oil emulsions stabilized by pure CTAB solutions (0, 0.01, 0.02, 0.03, 0.04, 0.05, 0.25, and 0.5 wt%) as a function of the volume fraction of water.

Figure 12.
Critical volume fraction of water versus CTAB concentration.
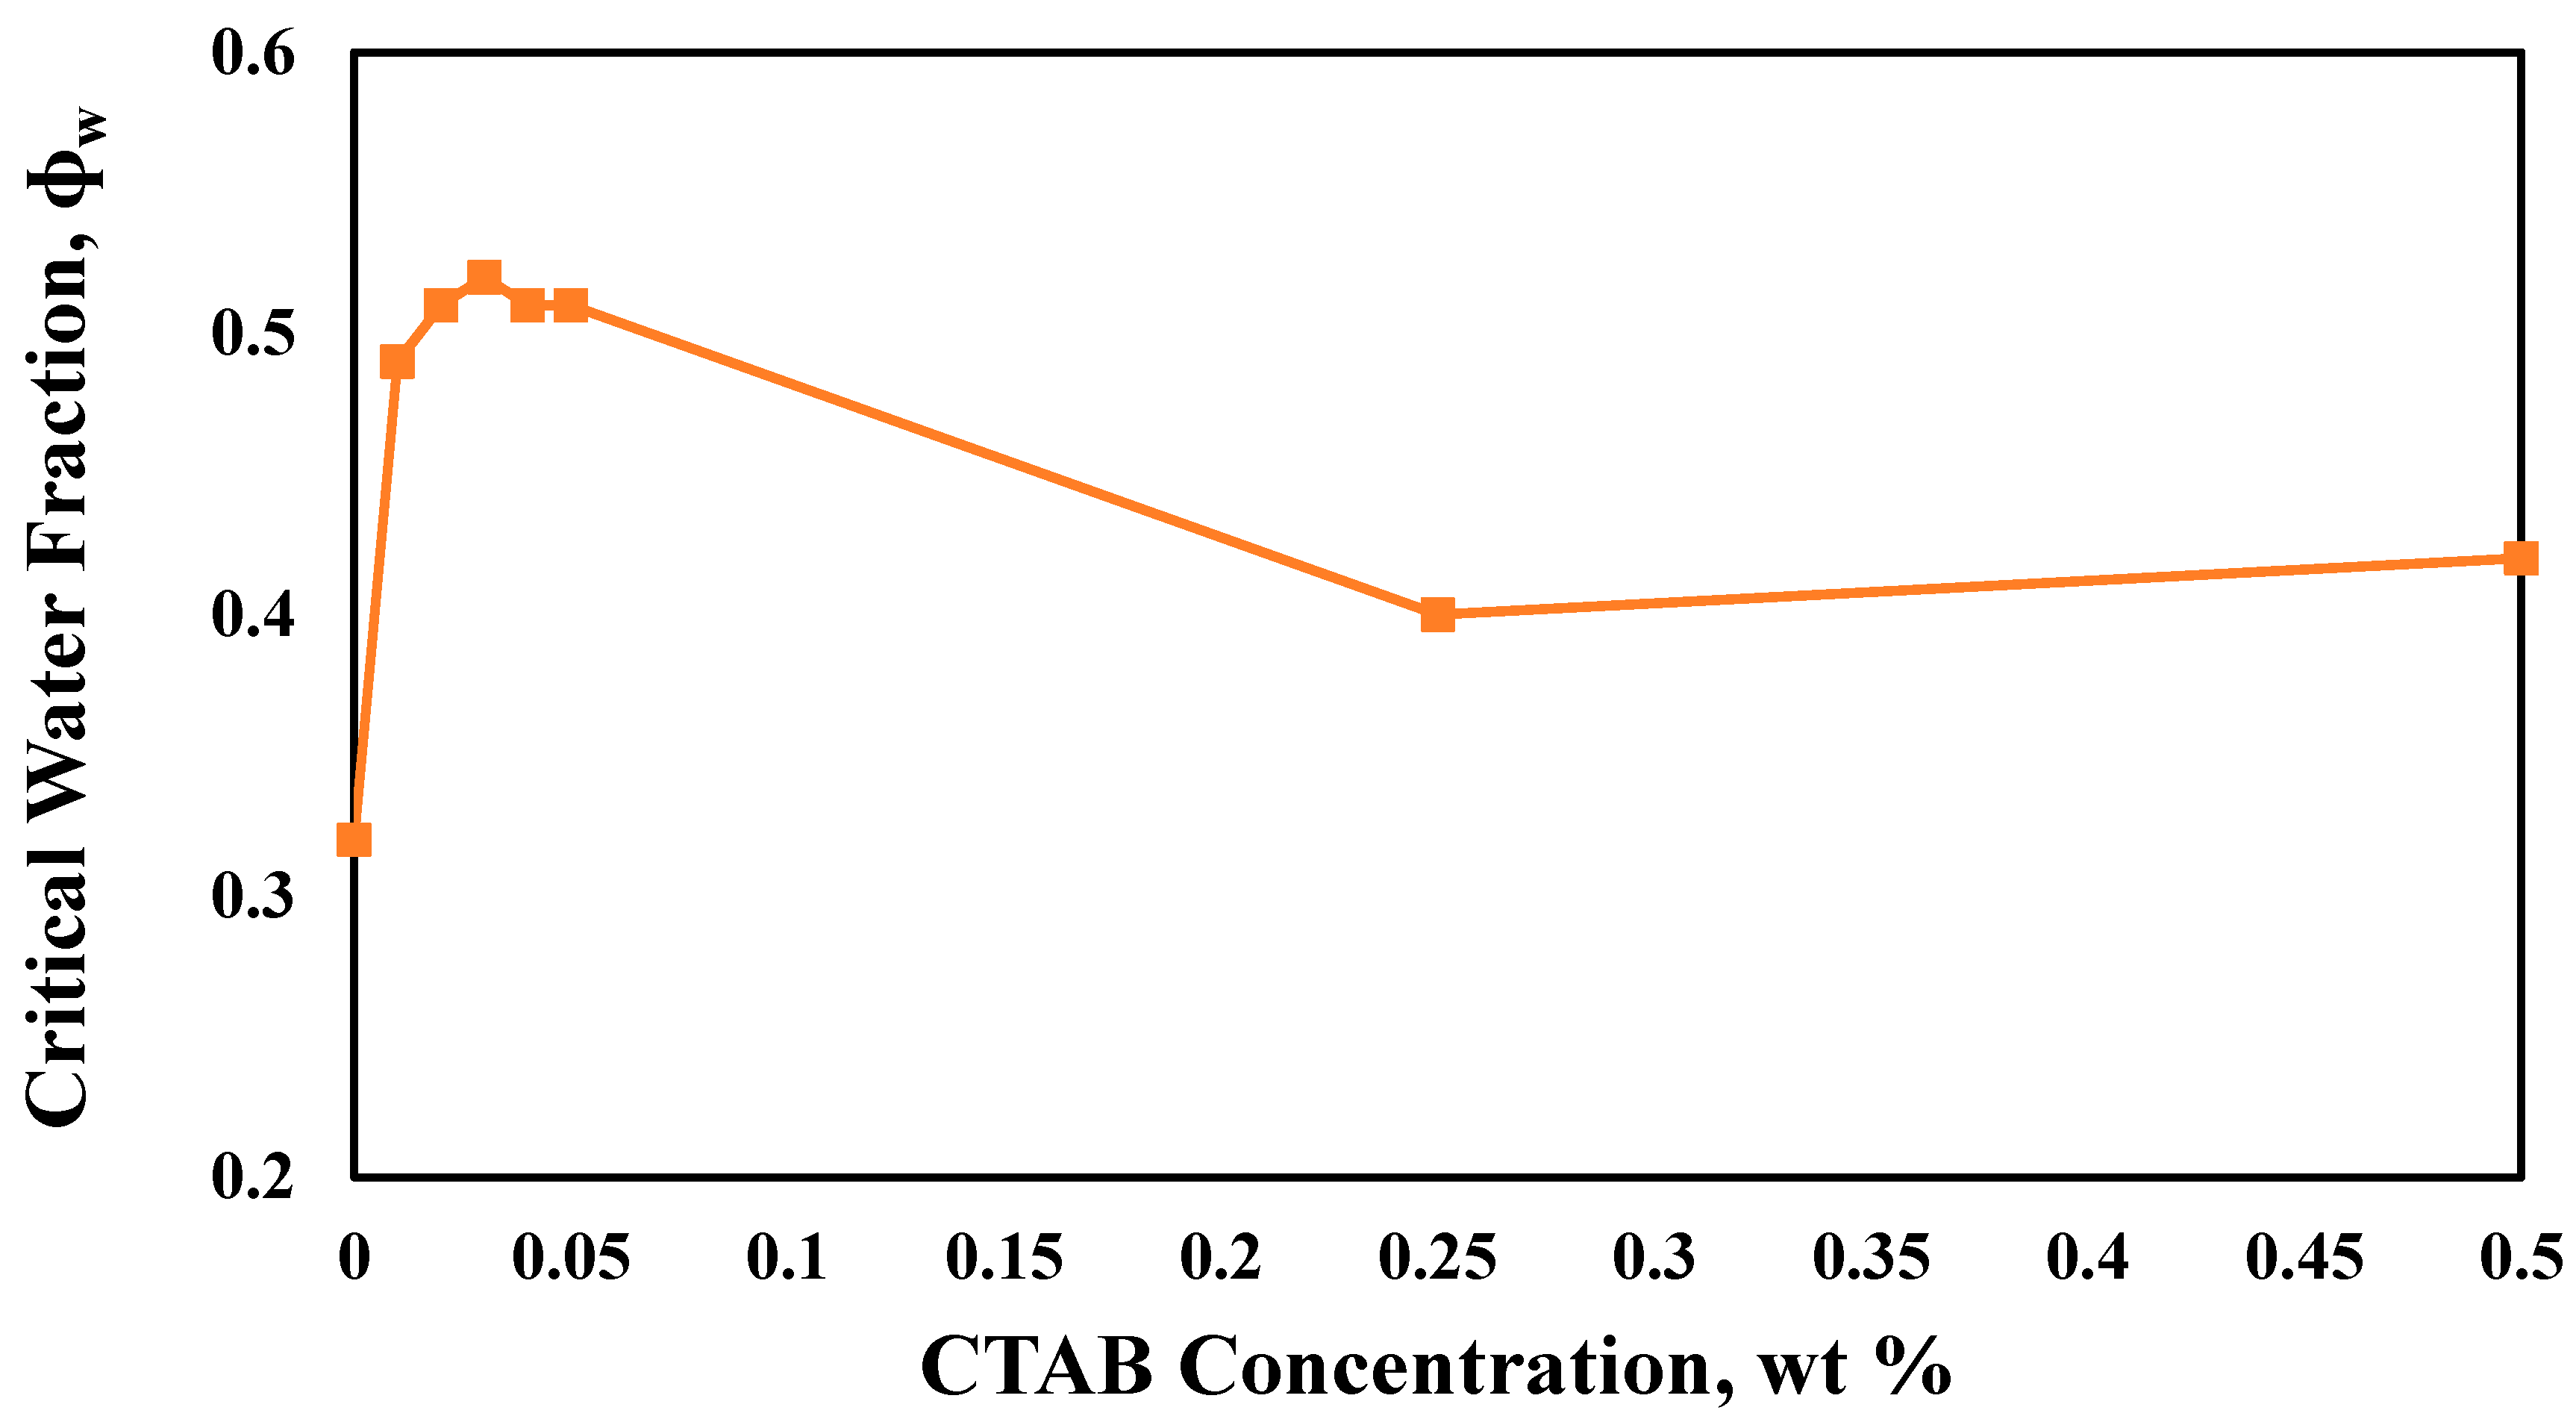
Figure 13.
Aqueous phase critical volume fraction as a function of normalized concentration for CTAB and nanoclay.
Figure 13.
Aqueous phase critical volume fraction as a function of normalized concentration for CTAB and nanoclay.
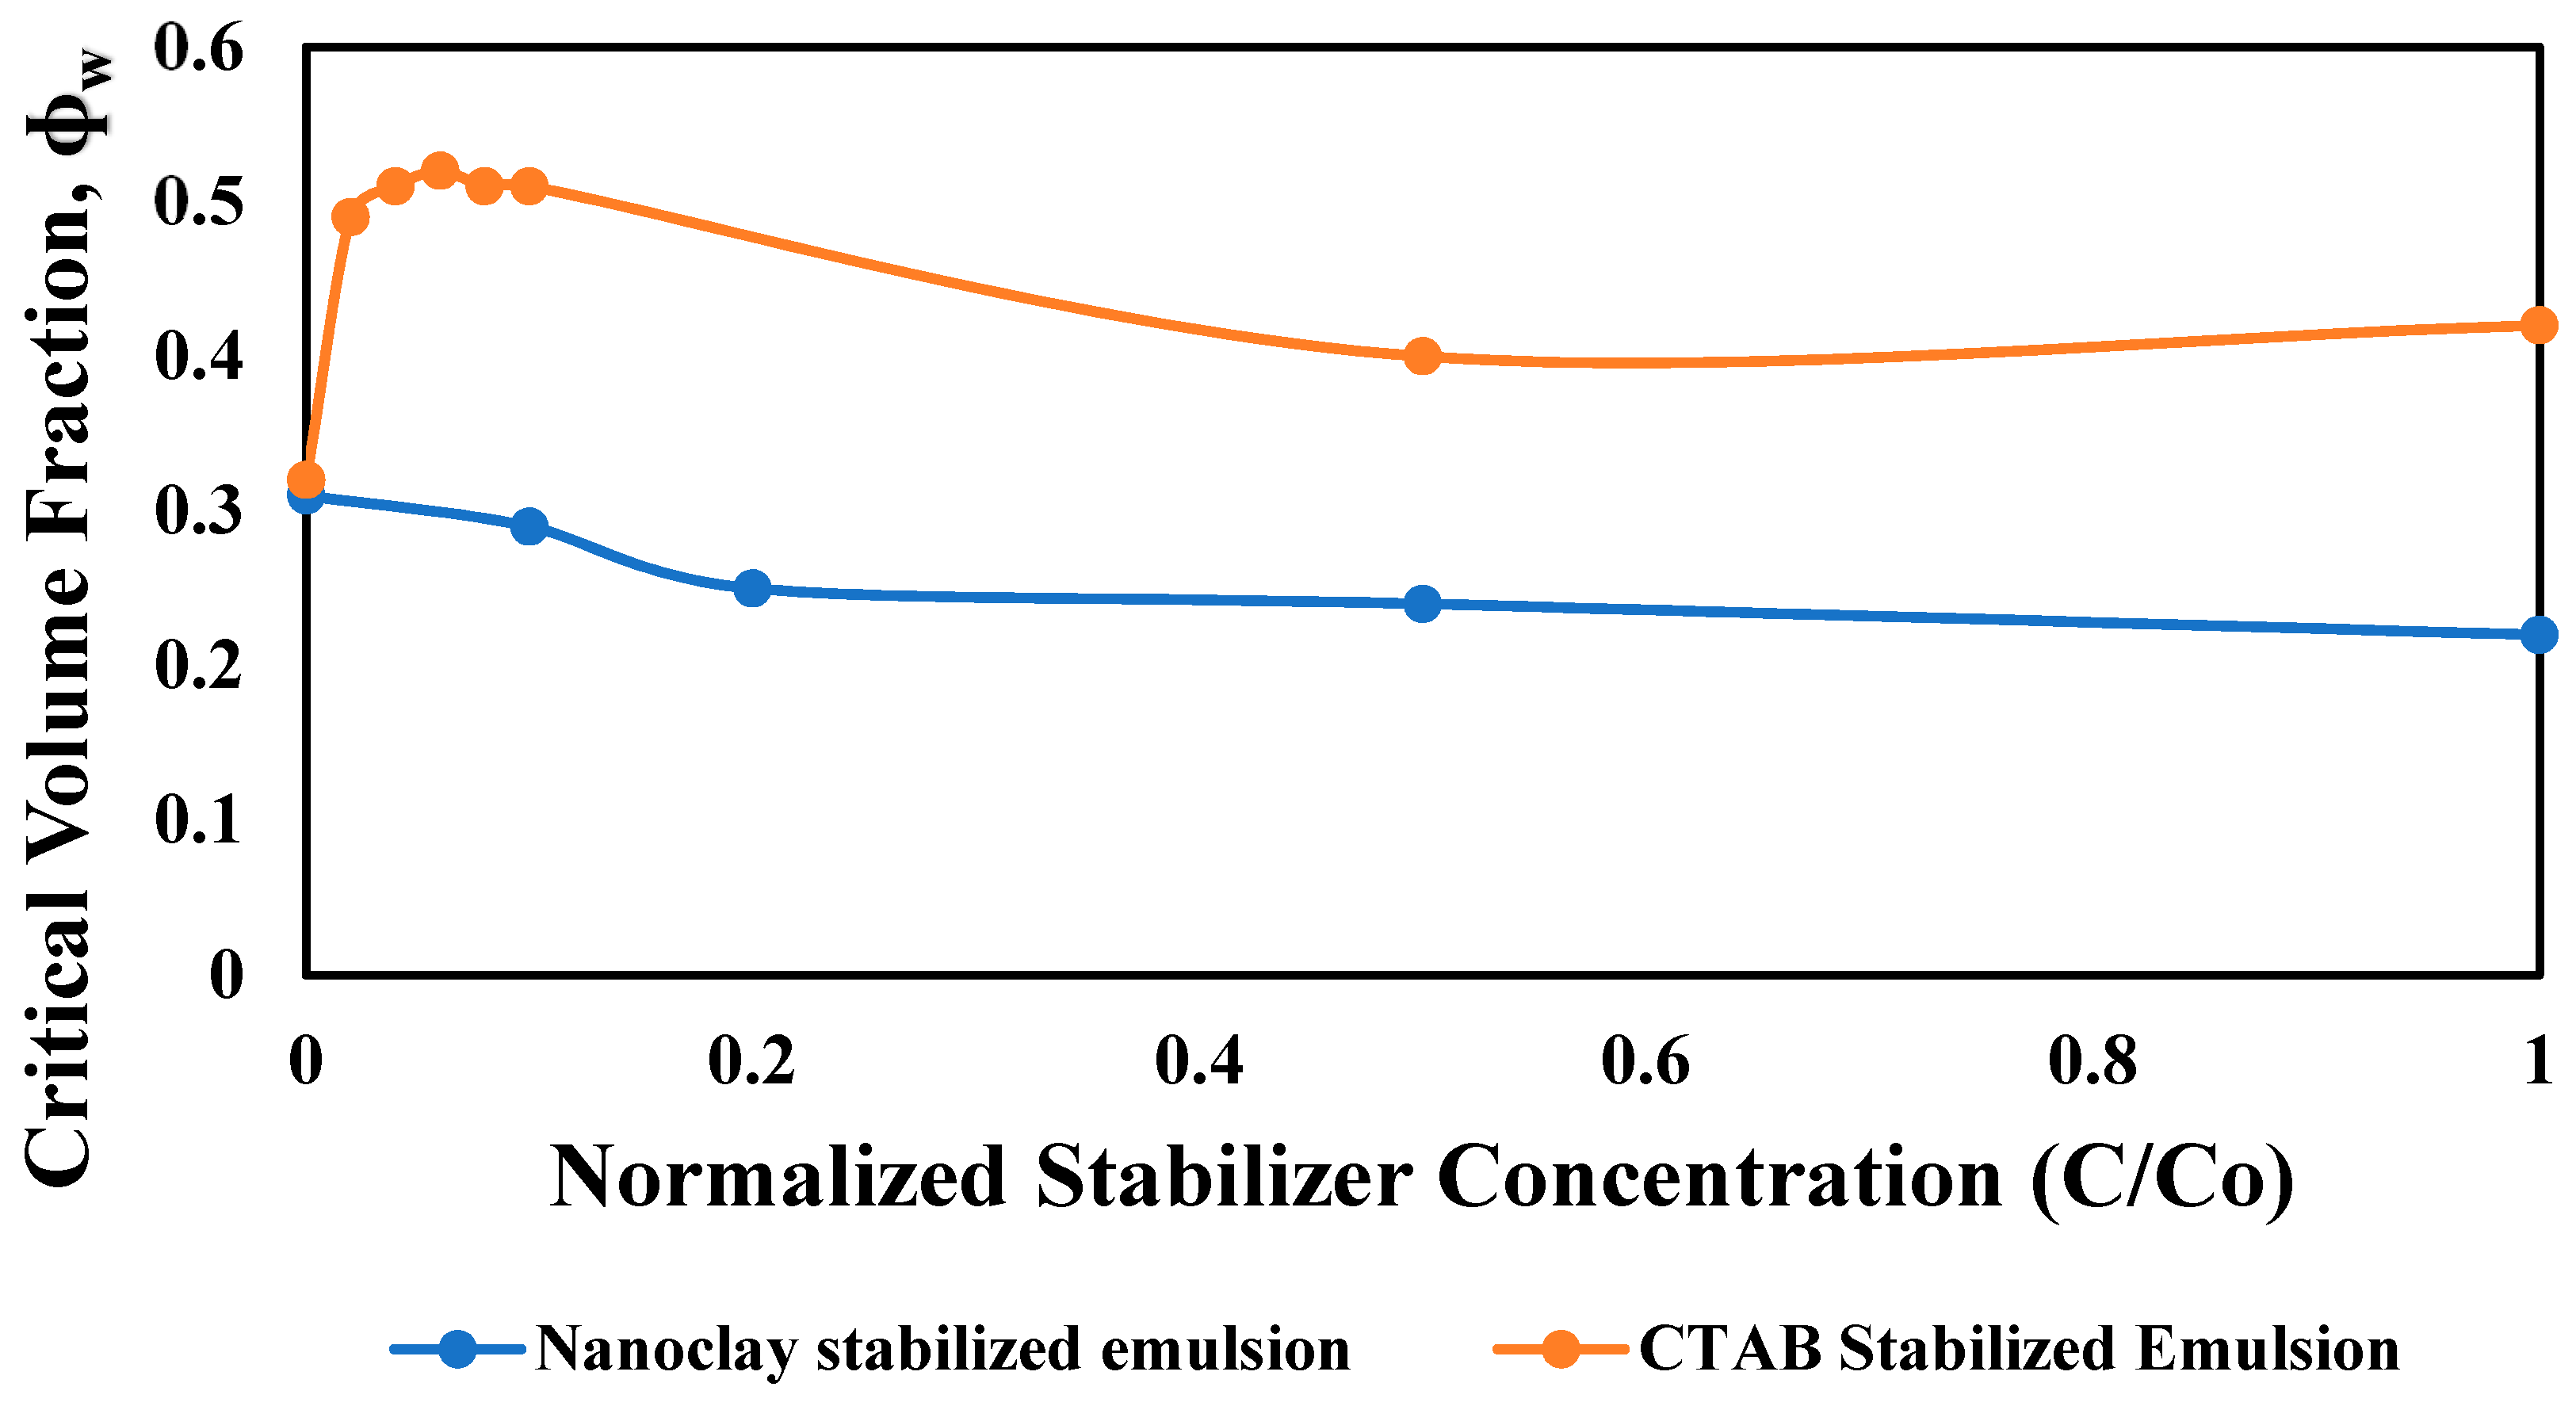
Figure 14.
Conductivity of water–mineral oil emulsions stabilized by 1 wt% nanoclay at varying CTAB concentrations as a function of the volume fraction of water.
Figure 14.
Conductivity of water–mineral oil emulsions stabilized by 1 wt% nanoclay at varying CTAB concentrations as a function of the volume fraction of water.
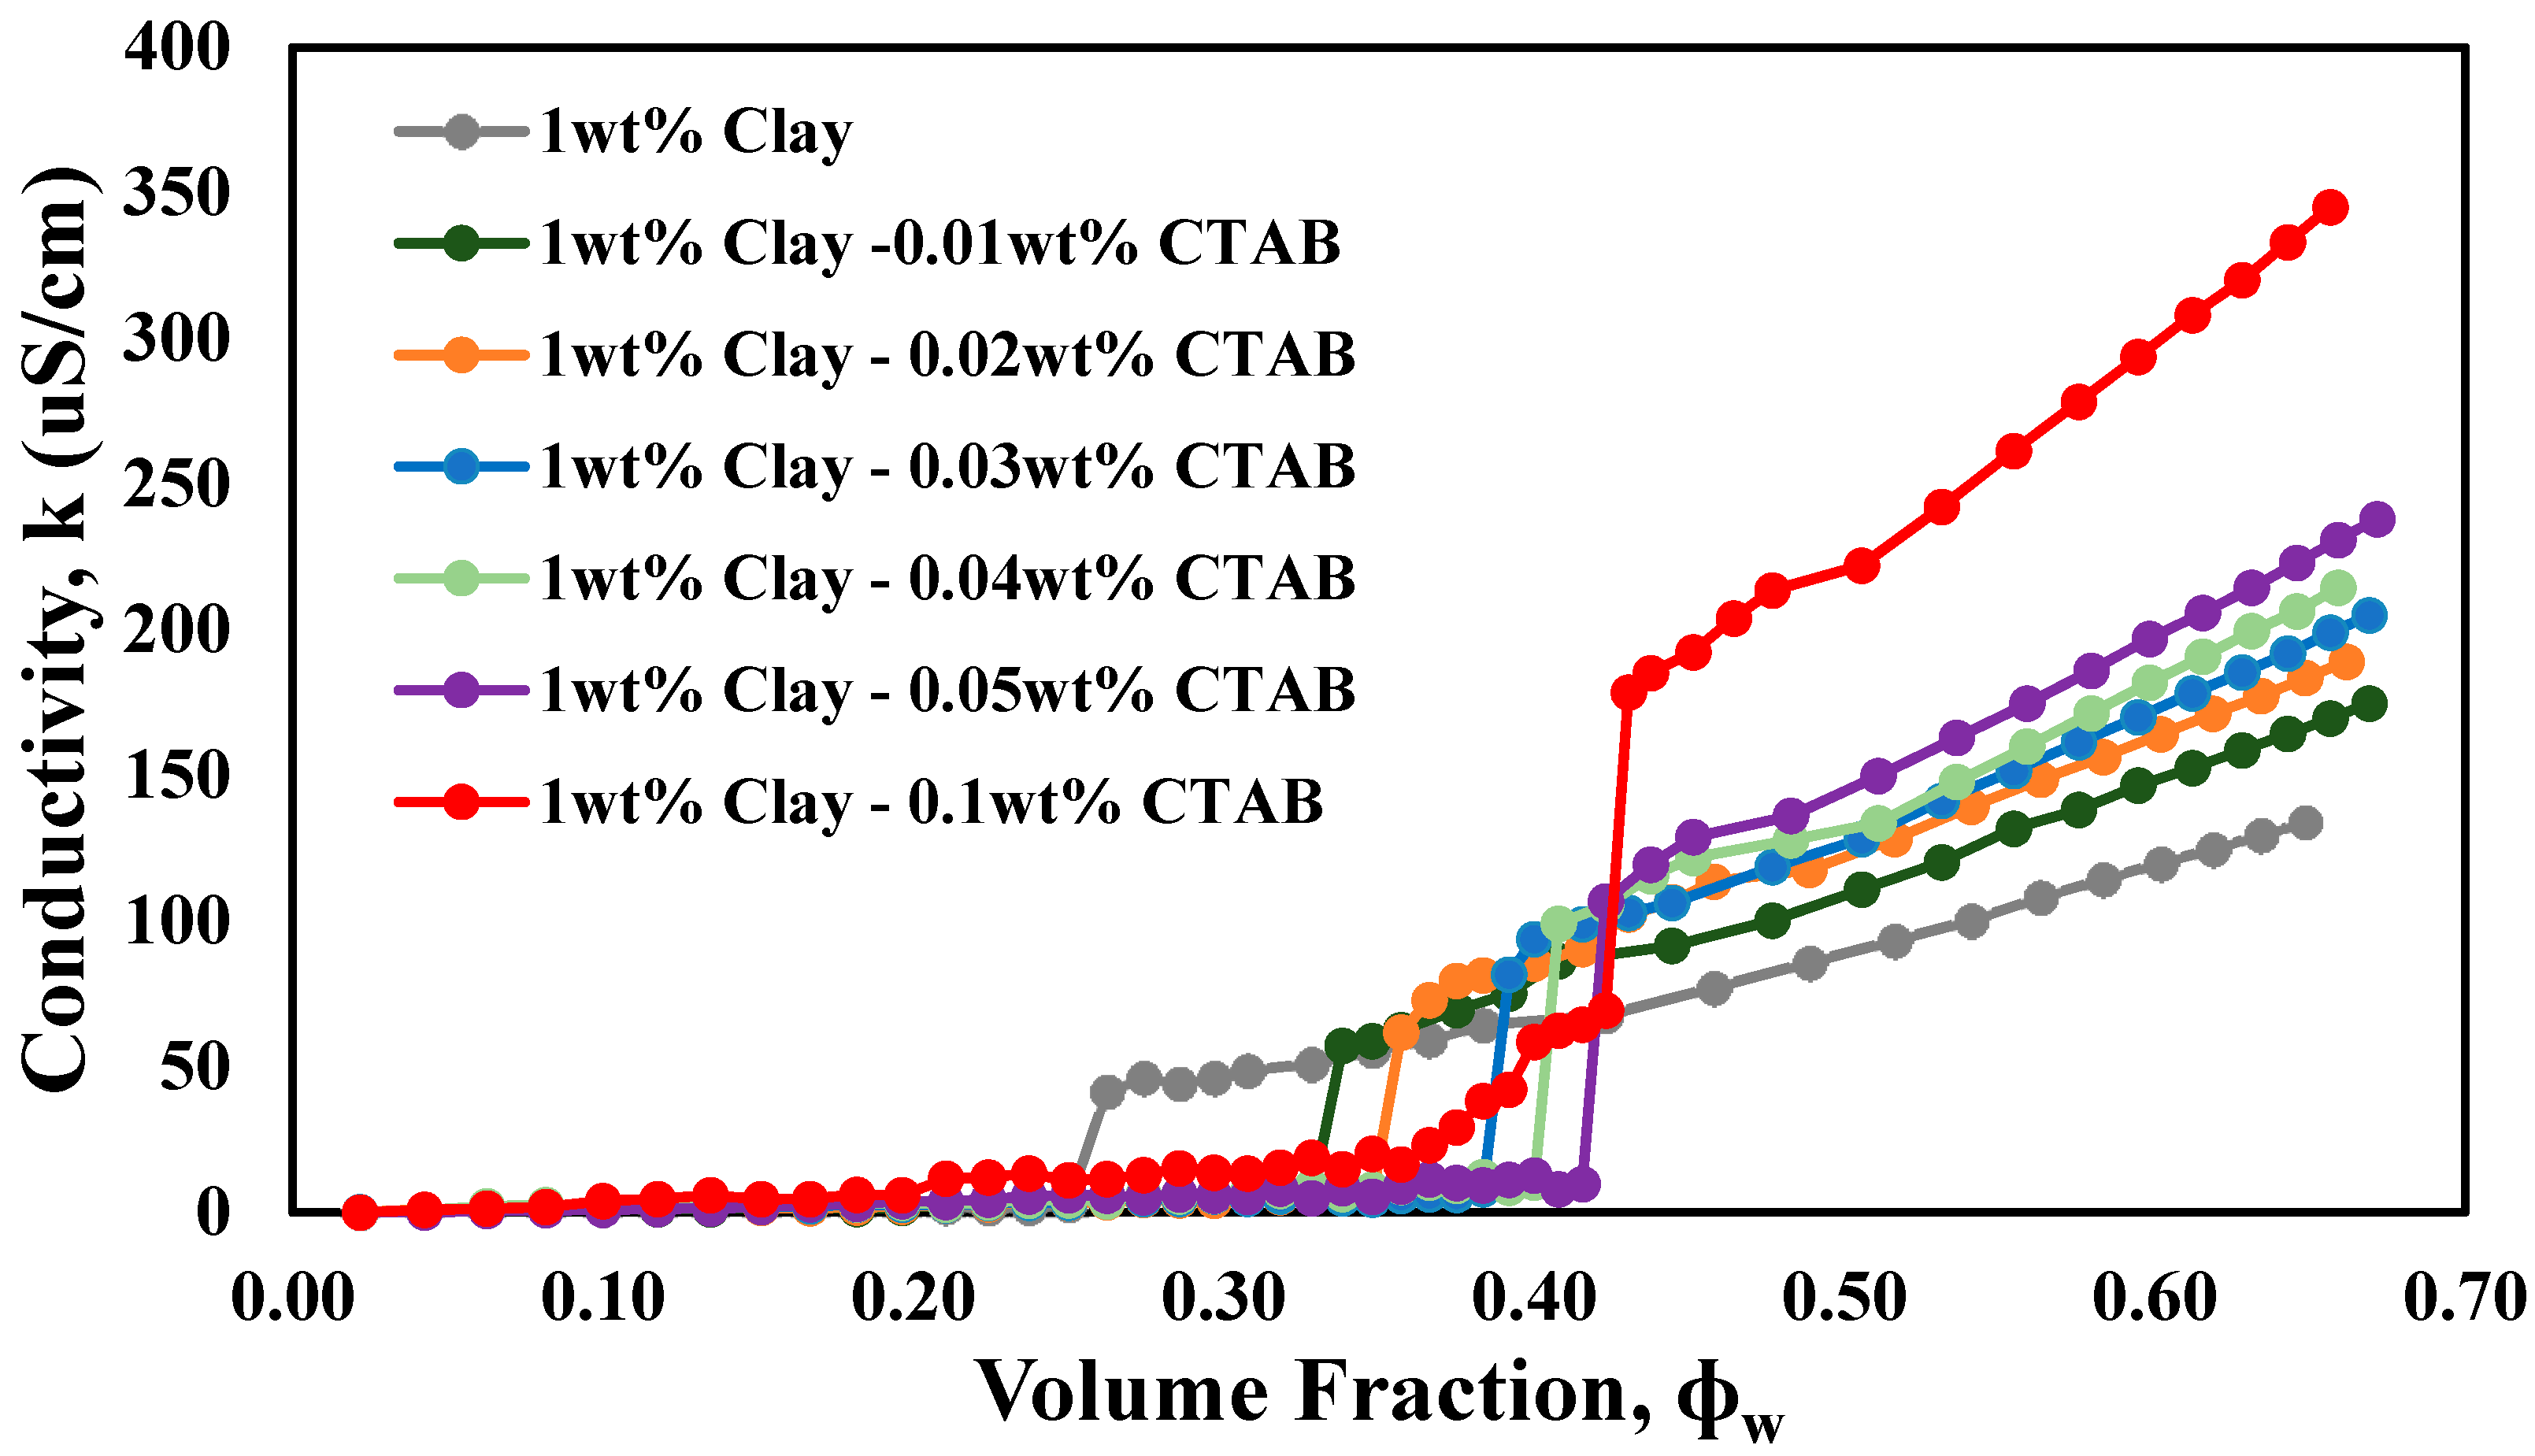
Figure 15.
Critical volume fraction of water versus CTAB concentration in 1 wt% nanoclay–CTAB mixture.
Figure 15.
Critical volume fraction of water versus CTAB concentration in 1 wt% nanoclay–CTAB mixture.
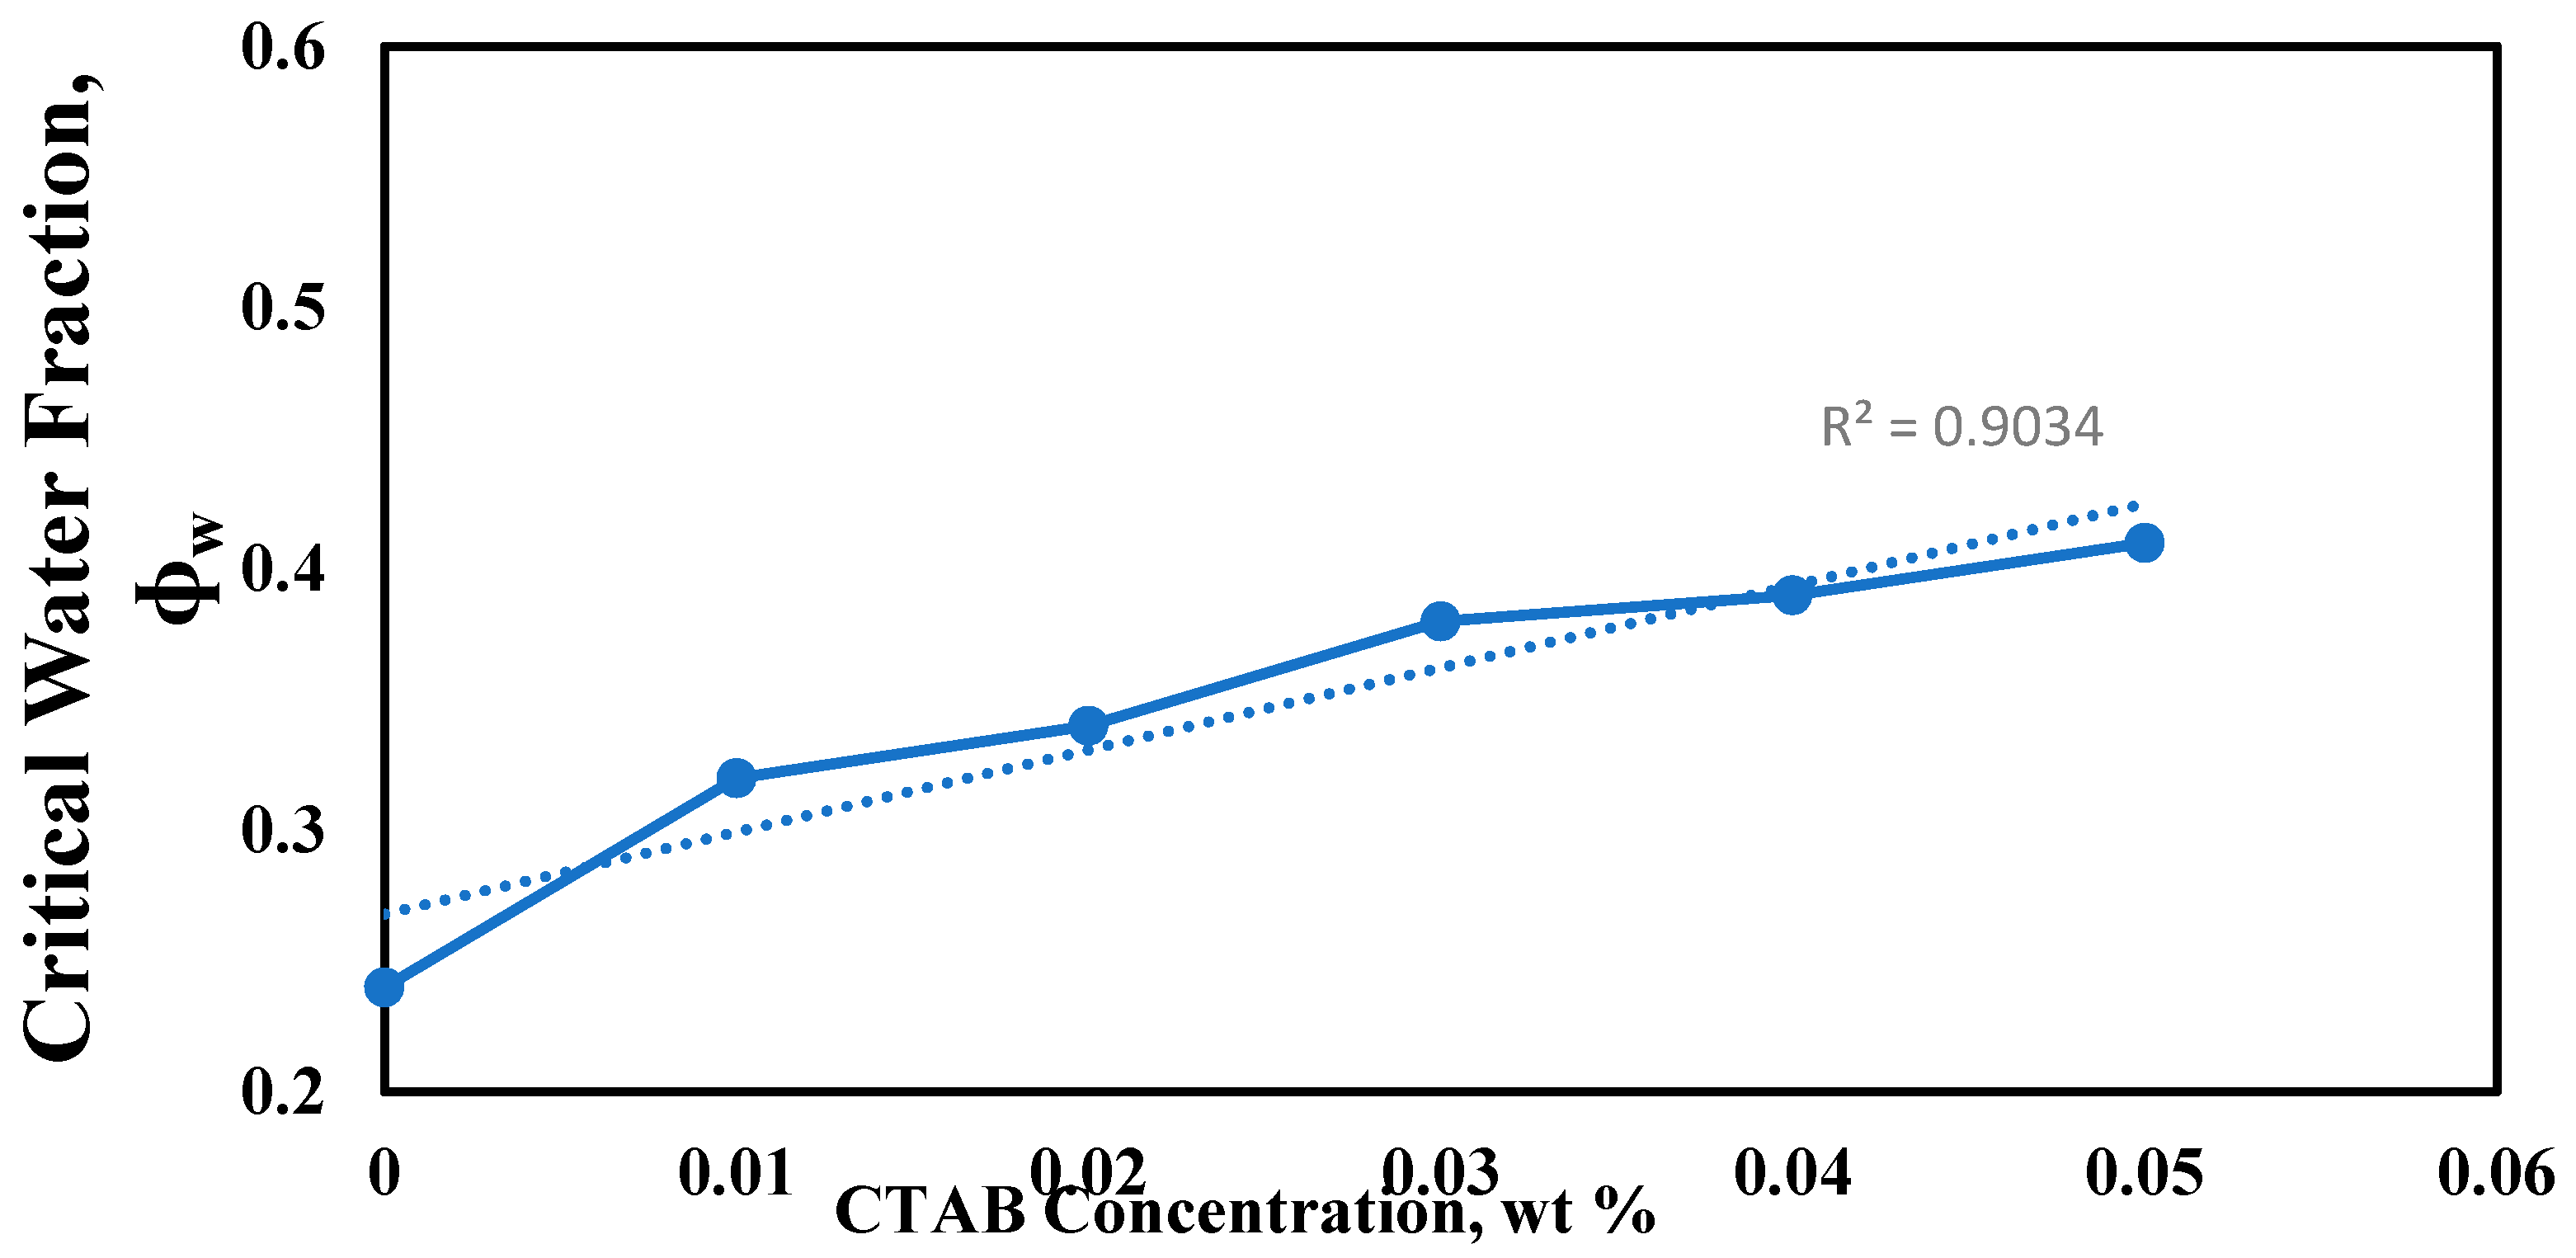
Figure 16.
Comparison between plots of critical volume fraction of water versus varying CTAB concentrations for pure CTAB and 1 wt% nanoclay –CTAB mixture, respectively.
Figure 16.
Comparison between plots of critical volume fraction of water versus varying CTAB concentrations for pure CTAB and 1 wt% nanoclay –CTAB mixture, respectively.
© 2020 by the authors. Licensee MDPI, Basel, Switzerland. This article is an open access article distributed under the terms and conditions of the Creative Commons Attribution (CC BY) license (http://creativecommons.org/licenses/by/4.0/).
Share and Cite
MDPI and ACS Style
Ogunlaja, S.B.; Pal, R. Effects of Bentonite Nanoclay and Cetyltrimethyl Ammonium Bromide Modified Bentonite Nanoclay on Phase Inversion of Water-in-Oil Emulsions. Colloids Interfaces 2020, 4, 2. https://doi.org/10.3390/colloids4010002
AMA Style
Ogunlaja SB, Pal R. Effects of Bentonite Nanoclay and Cetyltrimethyl Ammonium Bromide Modified Bentonite Nanoclay on Phase Inversion of Water-in-Oil Emulsions. Colloids and Interfaces. 2020; 4(1):2. https://doi.org/10.3390/colloids4010002
Chicago/Turabian StyleOgunlaja, Sileola B., and Rajinder Pal. 2020. "Effects of Bentonite Nanoclay and Cetyltrimethyl Ammonium Bromide Modified Bentonite Nanoclay on Phase Inversion of Water-in-Oil Emulsions" Colloids and Interfaces 4, no. 1: 2. https://doi.org/10.3390/colloids4010002