Scaling Behavior of Pattern Formation in the Flexographic Ink Splitting Process

Institute of Printing Science and Technology (IDD), Technische Universität Darmstadt, Magdalenenstraße 2, 64289 Darmstadt, Germany
*
Author to whom correspondence should be addressed.
Colloids Interfaces 2019, 3(1), 37; https://doi.org/10.3390/colloids3010037
Submission received: 31 January 2019
/
Revised: 8 March 2019
/
Accepted: 8 March 2019
/
Published: 13 March 2019
(This article belongs to the Special Issue Colloids and Interfaces in Printing Technology)
Abstract
:We considered pattern formation, i.e. viscous fingering, in the ink splitting process between an elastic flexographic printing plate and the substrate. We observed an unexpected scaling behavior of the emerging pattern length scale (i.e., finger width) as a function of printing velocity, fluid viscosity, surface tension, and plate elasticity coefficients. Scaling exponents depended on the ratio of the capillary number of the fluid flow, and the elastocapillary number defined by plate elasticity and surface tension. The exponents significantly differed from rigid printing plates, which depend on the capillary number only. A dynamic model is proposed to predict the scaling exponents. The results indicate that flexo printing corresponded to a self-regulating dynamical equilibrium of viscous, capillary, and elastic forces. We argue that these forces stabilize the process conditions in a flexo printing unit over a wide range of printing velocities, ink viscosities, and mechanical process settings.
1. Introduction
Printing is the technology of fast manufacturing and structuring of solid surfaces by wetting with printing liquids or inks. It serves the reproduction of visual information, of text, images, or patterns for any other technical purpose. Structuring means that the border line between the inked areas and the non-inked parts of the printing substrate is well-defined and reproducible on length scales down to few m. As this structuring proceeds with velocities v of several, sometimes up to 15 , the relevant wetting and fluid dynamics takes place on a time scale of s. Our aim here was to understand the delicate force equilibrium in the nip of a printing press by which the printer keeps the printing process under control. In daily practice, printing is handled on the industrial scale with great precision. Nevertheless, a precise understanding of the physics at the interfaces which are in contact in the printing nip is still lacking. Recent results on interface science, on wetting and liquid bridge dynamics, together with a new generation of digitally controlled high-precision printing technology have created the opportunity to bring these two fields together, and to obtain a new, scientifically rigorous view on an industrial process that has grown from, and is still coined by a long empirical tradition.
We wanted to demonstrate that the printing process, specifically flexography, can be viewed as a non-linear self-regulating dynamical system. The specific feature of flexography is the use of flexible, mostly photopolymeric printing plates, and the peculiar feature is that the static impression force on the printing substrate is kept small, in contrast to printing technologies as offset lithography and gravure printing. Typical applications come from packaging industry: printing on corrugated cardboard, recycled paper, or styrofoam. Enormous quantities of food packages and packaging foils receive their full-color branding and design by this technique every day, frequently using cost efficient and sustainable water-based inks. Not only the low-cost applications, but also highly specific energy and communication technologies define benchmarks for the development of flexography: printing conductive current-collecting grids on brittle silicon solar cells, or on transparent front electrodes for displays (see, e.g., [1]).
Despite the small static pressure between printing plate and substrate, the elastic deformation of printing plate or substrate cannot be neglected compared to the viscous and capillary force in the nip, and are in a delicate equilibrium. The dynamics of ink transport, the wetting of the substrate, and elastic response of the printing plate can be assigned to a specific fixed point in printing parameter space. Mechanical and hydrodynamical conditions in the printing nip are thus stabilized even though the transferred ink quantities and the reproduced patterns are continuously varying. However, this fixed point is not entirely stable. It is unstable with respect to specific perturbations which are known as the finger instability, and which the printer calls the ribbing defect. The point of view of dynamical fixed point theory is not new, but has been elaborated by Casademunt [2]. It defines the onset of a pattern formation phenomenon which, in the mature phase, can be recognized as a branched stochastic network of surface undulations on a thin printed layer. We would also like to convince the reader that this type of pattern formation, although not desired in printing practice, can be a valuable tool to examine the physics in the nip of a fast printing process, which is very hard to access by other means.
The finger instability was first demonstrated by Saffman and Taylor [3], who supplanted the water contained in a shallow Hele–Shaw cell of height h by inflating air on one side of the cell. In contrast to the expectation that the retracting meniscus between air and water would be kept straight by surface tension, air fingers protruded into the liquid volume, with a characteristic size of
where is the capillary number, v the meniscus velocity, and the viscosity and the surface tension of the liquid. A straight meniscus only forms in the static limit, or at very small retraction velocities. The Saffman–Taylor experiment is also a common model explaining pattern formation at the meniscus in an ink splitting process in a fast gravure or flexographic printing press. Typically, the scales are somewhat different here, as h is of order of few m, and . Even at one finds that which is due to the peculiar cylindric geometry of the printing nip (see Figure 1).
Not only for printing, but also for other applications, the finger instability is of broad interest, as pointed out by Saffman and Taylor [3]: exploitation of mineral oil sources by inflating a thin fluid into a subterestrial deposit of highly viscous raw oil is challenged by such finger formation as discussed by Brailovsky et al. [4]. For an overview of this phenomenon and its relation to other pattern formation effects, we refer the reader to the review of Sahimi [5]. Drying of porous media from imbibed liquids by inflating air will fail for the same reason (see Wooding and Morel-Seytoux [6], and Chen et al. [7]).
Lifting off the printing form from the printing substrate air fingers penetrate in the wedge between the surfaces along the whole liquid meniscus. The liquid ink bridges between these air fingers form the origin of the ribbing pattern, with a dominant pattern wavelength . The liquid bridges are expanded between the rotating cylinder and substrate, and finally break down. They leave the more or less pronounced parallel ink stripes oriented in printing direction, as shown in Figure 1. Kitsomboonloha et al. [8], and Bornemann et al. [9] studied the velocity scaling of the finger instability in a gravure printing process. They used a rigid cylinder with a fine regular raster of period of gravure cells laden with printing liquid. The liquid drops from the cells were deposited on the substrate and partially spreading. As soon as spreading liquid created a closed liquid meniscus in the nip, with height , the finger instability was observed, and the fingering wavelength scaled as . This was independent of the raster period of the gravure pattern, at least when , and scaled with v in the same way as observed in the experiment of Saffman and Taylor. This is remarkable as the boundary conditions of the flows are quite distinct.
In a different setup, Voss [10] studied the ink splitting in the contact zone of rotating elastic and rigid cylinders. The cylinders were pressed together with significant force such that an indentation was formed in the surface of the elastic cylinder. The ink splitting flow was located in the wedge at the contact line between the cylinder surfaces. The opening angle of this wedge is finite, and determined by the cylinder radii and the indentation depth of the rigid cylinder in the soft one. Even though the boundary conditions were completely distinct from those of the Hele–Shaw and the gravure cylinder geometries, the same scaling law of the dominant pattern wavelength was found.
Printing inks, however, are typically non-Newtonian liquids characterized by finite yield stress and shear thinning behavior. Lindner et al. [11,12] studied the consequences for the fingering phenomenon. It became evident that pattern formation was modified in many respects, but also that important aspects of scaling survived. In our study, relatively thin flexographic inks were used, and partially diluted. In addition, gravure experiments have shown that non-Newtonian effects on scaling are less pronounced.
In printing technology, scaling behavior is important process information since contemporary machine design is no longer restricted to a narrow process window. With the introduction of digital drive control, inline inspection, and web surveillance technology flexographic presses can be operated in a wide range of velocities from 10 to 800 , in some cases. Scaling observations from Hele–Shaw and rigid-cylinder geometries are puzzling here and do not meet with practical observation. If the scaling were true, the finger distance in the ribbing pattern of full-area flexographic printouts should shrink by a factor of 3 when printing speed is raised from, e.g., 20 to 180 . Although the skilled printer knows that indeed finger distance and visibility of the ribbing pattern can be reduced by speeding up the machine, the observed effect is much more humble. This also applies for other ink-related imperfections in the reproduction as, e.g., the “outline” effect, the ink agglomeration at the rim of a printed subject. In view of the considerable viscous forces that necessarily evolve in the such fast ink-splitting processes, one may suspect that this discrepancy could be related to the finite elasticity of printing plate and substrate. Another clue concerns the capillary forces in the nip. Differently from the cuvette experiment of Saffman and Taylor where the height of the cuvette was macroscopic, the thickness of a liquid film in the printing nip is of order of 1 m. Accordingly, the capillary pressure behind the ink meniscus is larger by orders of magnitude than in the cuvette experiment, and could significantly contribute to the deformation of the printing plate on the m-scale.
For this reason, we performed a series of flexographic printing experiments, using soft printing plates, and unstructured plain-area printing layouts. Our aim was to verify the validity of scaling arguments on pattern formation in the ink splitting process, and, if successful, to determine the relevant scaling exponents relating finger width, printing velocity, fluid viscosity and surface tension, and printing plate elasticity coefficients.
The interactions of viscous, elastic, and capillary forces have been well-studied in different geometries in the past two decades. Bico et al. [13], and Roman and Bico [14] considered the contact adhesion between hair that appears in the presence of water. The analogous case of attractive force between two elastic sheets was considered by Kim and Mahadevan [15].
It is physically reasonable to believe that an algebraic scaling of pattern length scales as a function of these parameters could apply, as long as no system-immanent length scale comparable to the expected pattern wavelength is introduced in the relevant range of few 100 m. It is larger by orders of magnitude than the microscopic scale of surface roughnesses, but smaller than printing width and cylinder diameters by a comparable ratio.
Sauer et al. [16] proposed a model combining lubrication theory and sheet elasticity to explain ink splitting phenomena on soft rotating printing cylinders. Based on perturbation theory scaling exponents were predicted which are in tentative agreement with some observations. Relations between the various exponents have been identified as well. It has been difficult, however, to extract substantial data from existing studies. Moreover, the nature of the elastic response of flexographic printing plates was not addressed. Compressible and incompressible materials are in use, and it is not obvious whether their interactions with a liquid film under intense shear and high pressure are comparable.
The paper proceeds as follows. In Section 2, we briefly outline the arguments of the model from [16] leading to the estimates on scaling exponents. In Section 3, the experimental setup is described. We also present our procedure to characterize the elasticity of the flexographic plates, and viscosity and surface tension of our printing liquids. For evaluation of the pattern formation, the printed samples were digitalized, and evaluated using concepts of FFT-based spectral analysis. This is shown in Section 4. The results are discussed in Section 5, considering the scaling concept and the predictions from the theory section. Additional information on the experiment is given in Appendix A.
2. Theory
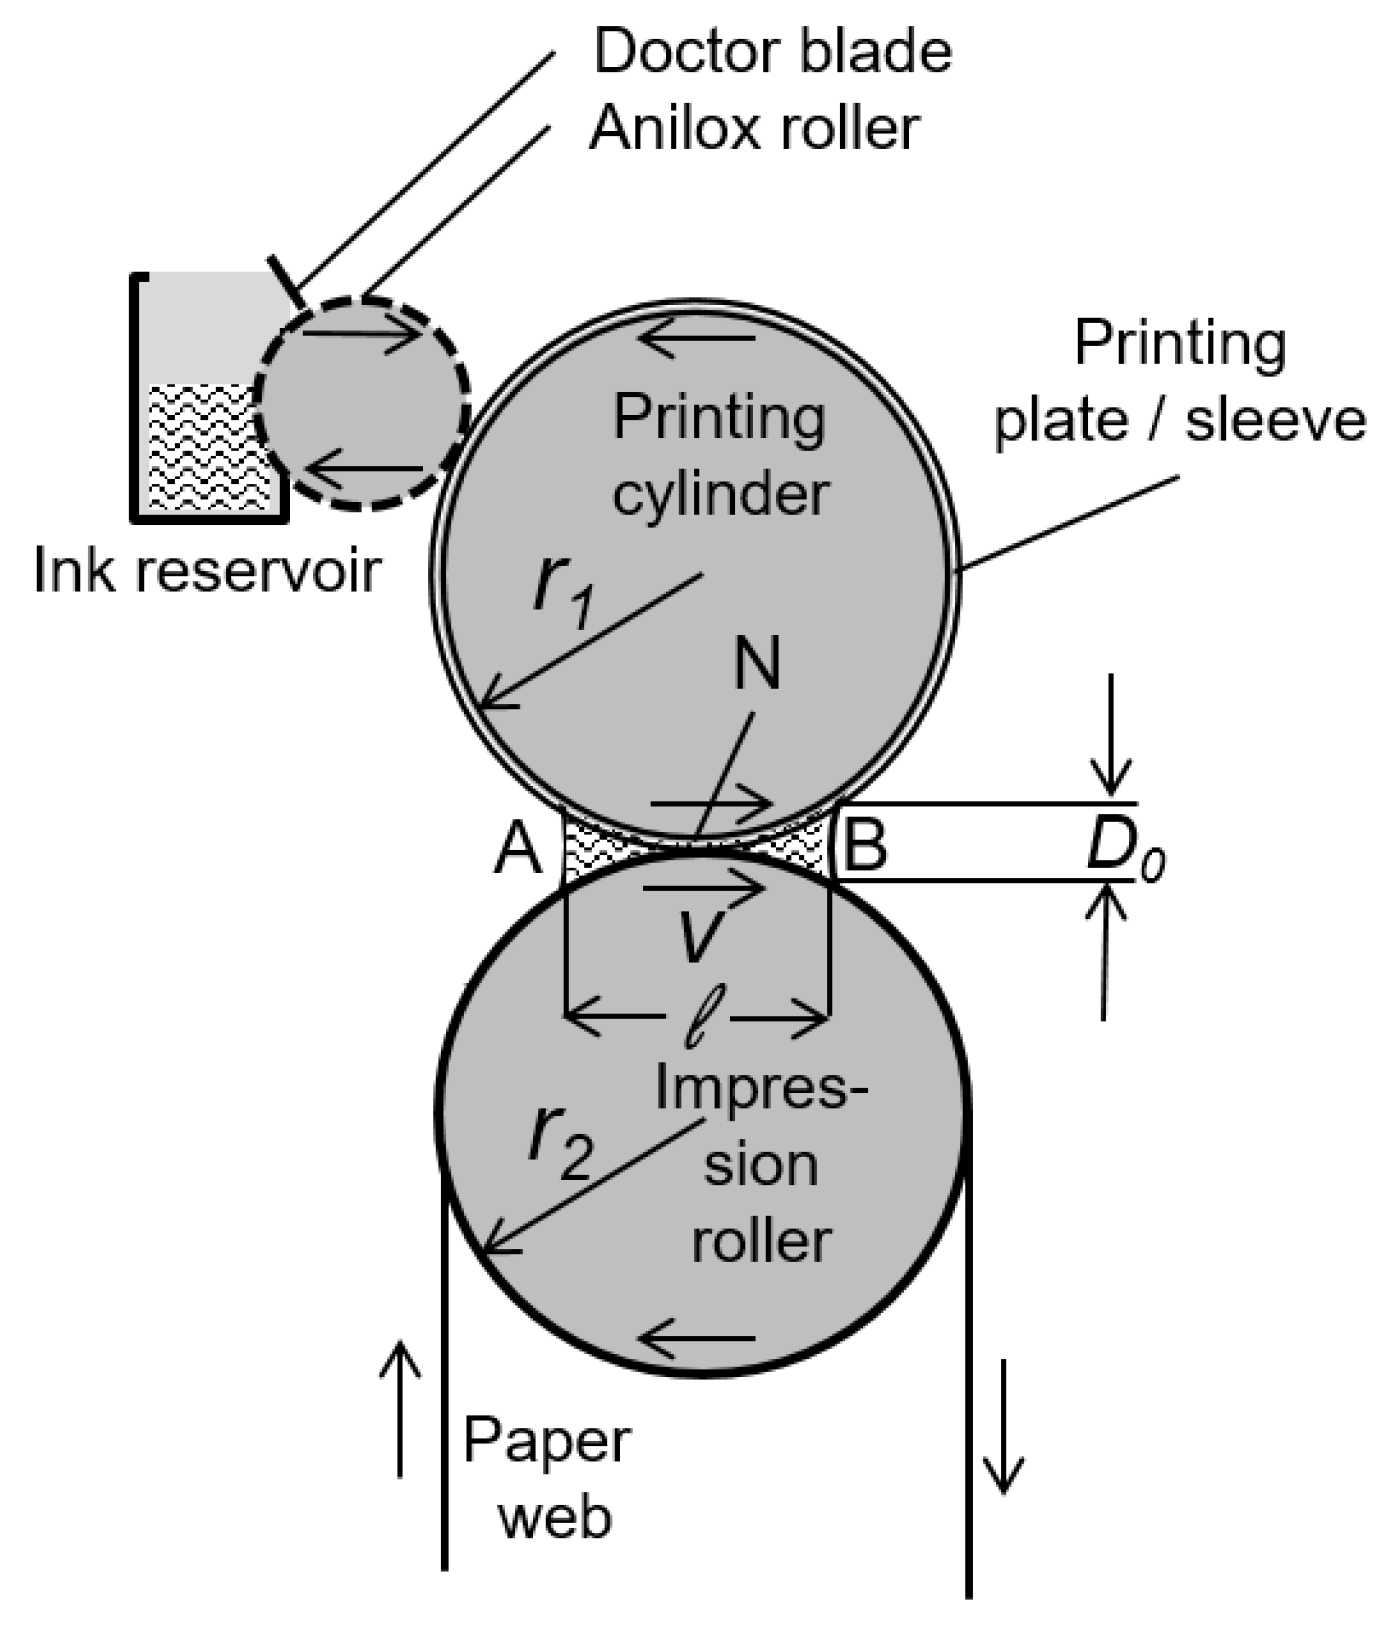
We briefly summarize the principal design of a flexograpic printing unit, and the essential points in [16] on the fluid dynamics therein. The schematics of a flexographic printing unit is shown in Figure 2. Ink is supplied to the printing plate by the anilox roller. This is a metal or ceramic cylinder with a fine gravure raster on its surface. The gravure transfers ink from the reservoir to the printing plate. The components we focused on are the printing cylinder, carrying the printing plate or sleeve, and the impression roller, which conducts the paper web through the unit. Consider the printing cylinder, with radius , and the impression roller with radius which supports the web. They are rotating with the same circumferential velocity v and are in mutual contact along the nip line, which is indicated as N.
When one places a drop of liquid in the nip, it will fill the narrow wedges between the menisci A and B in front of and behind N. This is due to the capillary forces. The liquid will fill a zone of width ℓ between the cylinders. Provided that the wetting contact angles are finite, that contact angle hysteresis is absent, and that viscous friction is negligible (i.e., capillary number is small), the liquid volume will almost preserve its shape under rotation. The length ℓ of the wetted zone remains constant as the velocity v is raised. The height of the two menisci at points A and B is given by
where is the sum of the cylinder curvatures. Note that this is true for rigid cylinders. If the surfaces are elastic, hydrodynamical forces will cause deformation of the cylinder surface in the wetted area. The shape of the liquid volume is then depending on v as well.
Even though the lifting velocities of the co-rotating cylinder surfaces are smaller than v by a ratio of , the relative velocities in the fluid flow profile are still of order of v. Liquid is dragged with the two moving surfaces, but has to reflow in opposite direction with almost the same velocity. This implies a significant shear of the liquid of order of . The fluid flow is reversed in the nip and at the stagnation points A and B. The outer shape of the fluid volume remains stationary. Gaskell et al. [17] demonstrated such flows by particle tracking in a gravure coater. In a liquid of finite viscosity , this implies the presence of a pressure gradient. According to Darcy’s law, the pressure gradient in the nip is related to this flow by . Neglecting capillary pressure at the two menisci, we can estimate the pressure gradient as where is the amplitude of the pressure distribution in the liquid volume. One thus obtains
For elastic, i.e., linearly compressible surfaces, and under the condition that the mechanical stress in the wetted zone disappears when the fluid volume and pressure p vanish, the average film thickness in the wetted zone and the pressure p are linearly related by some constant , and of order of the meniscus height :
The gap widening coefficient depends on the elastic properties of the surfaces. Eliminating and by mutual insertion of the last three equations, one obtains the following relation for the length ℓ of the wetted zone as a function of the rotation velocity v:
Intuitively one might expect that the amount of fluid supplied to the printing plate by the inking unit should appear in Equation (5). This is not the case under equilibrium conditions. The key observation is that Equation (4) for the gap height already imposes a condition which fully determines the fluid quantity in the nip. We refer to this as the excess ink volume conducted in the nip. Printing liquid is continuously added at the incoming wedge (B), and removed at the outgoing one (A). The excess volume is completely determined by the equilibrium of elastic, viscous and capillary forces. Equation (5) could be considered as a fixed point solution in a highly non-linear dynamical system.
The fixed point is stable to various external perturbations (e.g., adding variable amounts of ink per time), but it is not stable with respect to the hydrodynamical mode that causes the finger instability. The excess volume will not spread uniformly along the width of the nip, but tend to gather in finger-shaped undulations with average period . The reason the printing nip remains under control is the short period of time that the fluid spends in the nip: the pattern growth phase is cut off by film rupture into liquid bridges, as, e.g., discussed in [18]. This happens on a completely different time scale. Nevertheless, the initially created length scale remains visible on the printouts.
Summarizing the relation between the characteristic wavelength of the finger instability, and employing Equations (1) and (2) for , one obtains the scaling relation
where the dimensionless ratio can be understood as the static capillary pressure acting on the curved printing cylinder surface in units of the elastic strength of the printing plate. The elastocapillary number of the system could be estimated as which is, as , of order of unity.
3. Experimental
3.1. Elastic Printing Plates
We used two different types of flexo printing plates, compressible and incompressible ones. The compressible ones consisted of a photopolymeric plate (Nyloflex FAH Digital, hardness 60 ShA, thickness 1.14 mm, from Repro-Form, Dieburg, Germany). These plates were attached to the printing cylinder. Details of the printing setup are shown in the Appendix A. For attachment, adhesive foam tape with a thickness of 0.38 mm was used. Actually, we used two different types of such tape, a hard and a soft version of Softprint 52015/52017 Steel Master from Tesa SE, Kiel, Germany. This was done to obtain two different values of the nip widening coefficient . As incompressible printing plates, we used EPDM and NBR rubber sleeves (nominal hardnesses of 61–69 ShA from F. Böttcher GmbH & Co. KG, Cologne, Germany). The printing sleeves did not require any taping, as they were held on the steel cylinder by their own elastic tension. As the printing substrate, we used supercalendered paper (reel width 33 cm) traded by IGEPA (www.igepa.com), type Maxisatin. Grammage was 90 , thickness was 77 m, and surface smoothness (according to ISO 8791-4) was 2.0 m.
The motivation to use both compressible and incompressible printing plates was that they exhibit different internal distributions of stress and strain, and it was not clear whether this would have impact on their elastic response in the printing nip. When a normal force is exerted on a compressible printing plate, the surface can elastically recede without substantial squeezing in lateral direction. The Poisson ratio of the compressible stack is almost 0. In contrast, an incompressible plate (with a Poisson ratio close to 0.5) can only recede if it simultaneously extends in lateral direction. This, in turn, depends on the shape of the compression zone. If the compression zone in the nip were infinitely wide and uniform, no elastic deformation could occur at all, and one would expect that pattern formation might be similar to the case of rigid (i.e., gravure) rather than to elastic compressible printing plates.
We specified the elastic properties of both types of printing forms by a gap widening coefficient . It is defined as the thickness reduction of the printing plate surface by a printing liquid when its hydrostatic pressure is increased by . Reducing plate thickness would increase the height h of the flow channel of the printing liquid by . This implies that pressure gradients in the liquid channel would not only cause a lateral liquid flow through the printing nip, but also a proportional modulation of the height h of the flow channel. We defined the gap widening coefficient as
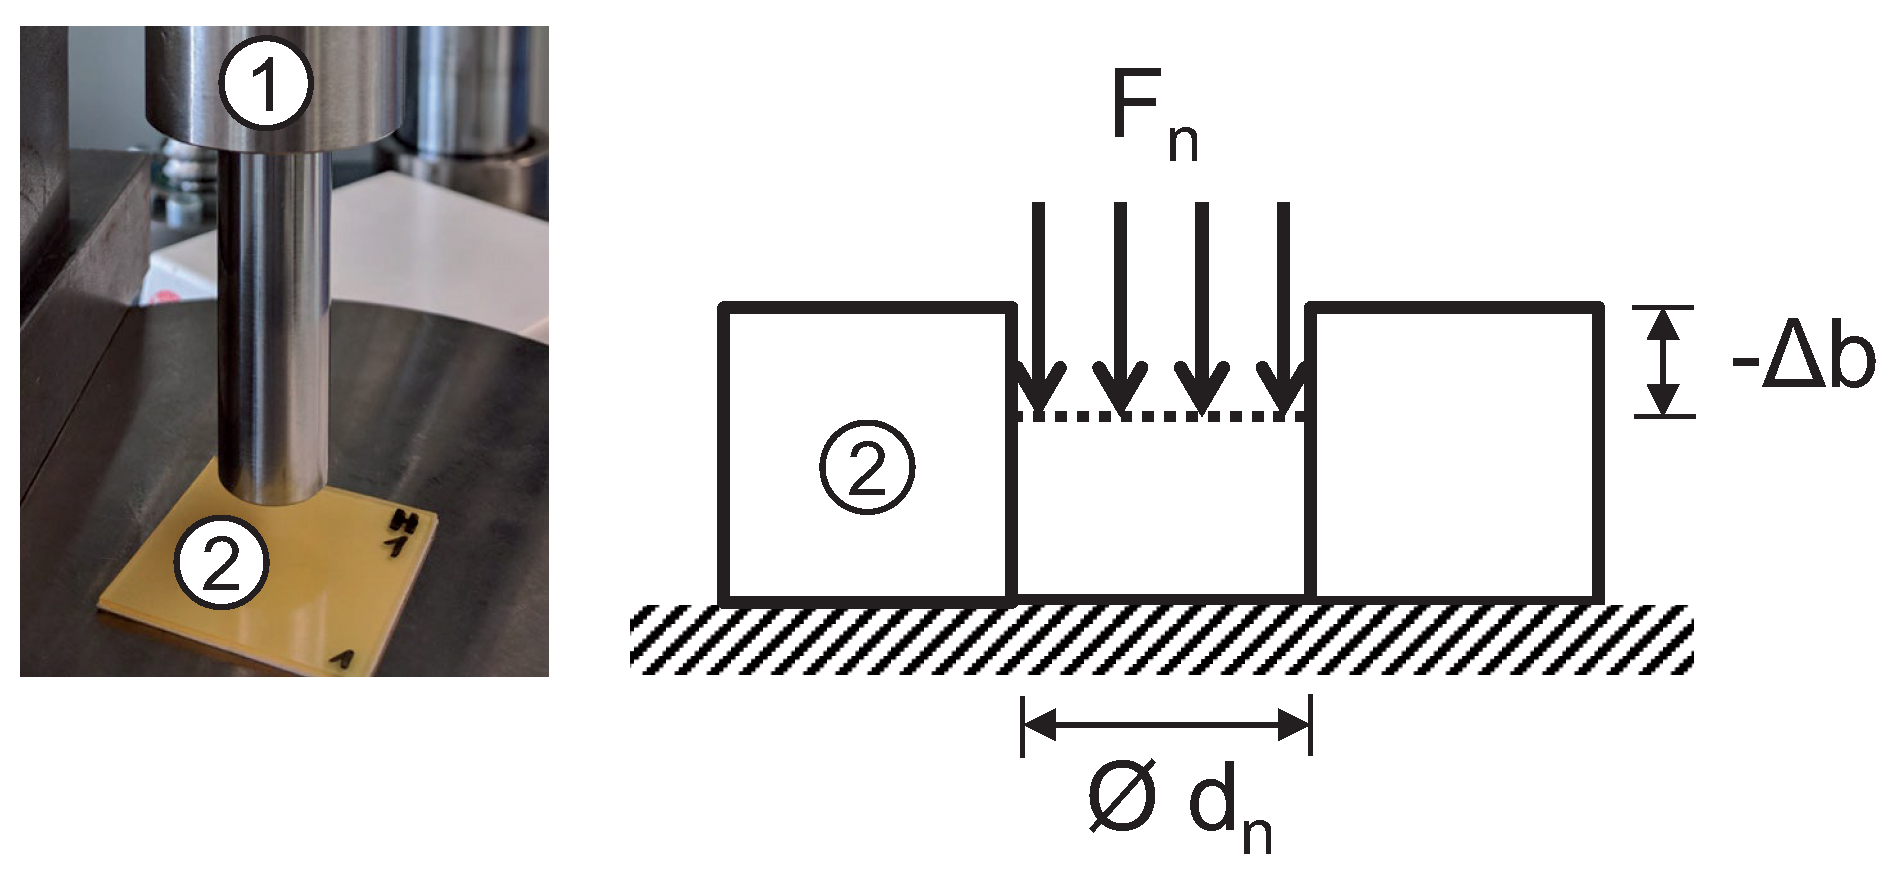
We determined this coefficient using a Zwick-Roell Z050 stress-strain measurement device (see Figure 3). Stacks of pieces of the printing plates were placed under the face of a cylindric heading tool with a diameter of mm. Air entrainments were carefully removed from the adhesive interfaces in the elastic stack by pressure treatment. Deformation was recorded as a function of the impression force . At not too high impression forces, the curves clearly showed reversible linear elastic behavior with constant slope . The gap widening coefficient was then calculated by . With pressures of up to 0.9 MPa, a relative deformation of up to 12 % was observed for the compressible plates. We ignored possible local inhomogeneities of the stress distribution in our samples as far as they were related to the finite aspect ratio of sample thickness and diameter. This would have lead to a constant overall correction factor to of order of unity. We considered this correction as irrelevant as we were interested in the relative scaling features of only.
For the reason of defining b-independent material parameters, we also calculated an apparent compressibility of the plate which is related to by . We obtained apparent compressibilities of MPa and MPa for the plates with harder and softer adhesive tape, respectively. With a total thickness of printing plate and adhesive tape of mm, this yielded gap widening coefficients of and , respectively. Results are displayed in Table 1. Finally, we observed that the apparent compressibilities of compressible and incompressible printing forms were, in fact, not too far apart. This can be assigned to the feature that the Young’s and shear moduli of the incompressible rubber plates may be much smaller than those of the photopolymeric material such as to admit an easy lateral squeezing in the nip.
3.2. Printing Liquids
We used two types of water based flexo printing inks for our experiments, as indicated in Table 2. For printing runs at variable velocities, we used Aqualabel Processmagenta HK from Siegwerk, Siegburg, Germany, in the as-delivered (LS1) and in a formulation (LS2) diluted 4:1 with deionized water. The experiments where the surface tension had to be varied used standard (LK1) and customer-tailored (LK2) versions of Kappaflex ink from Kapp Chemie, Miehlen, Germany, with and .
Samples of the printing liquids were drawn from the printing unit before and after each printing run, and characterized with respect to viscosity and surface tension. This provision was suggested to countercheck whether the fluid properties had changed within the printing runs, e.g., by water evaporation from the ink reservoir or by pigment aggregation. Within the accuracy of our measurements, however, no such effect was observed.
We used printing liquids with viscosities between 20 mPas and 480 mPas at a temperature of 26 C. This corresponded to the average operation temperature of our printing unit. Viscosities were determined with a Brookfield DV III ULTRA rotational rheometer in a shear range between 1 and 100 s. The results are shown in Table 2.
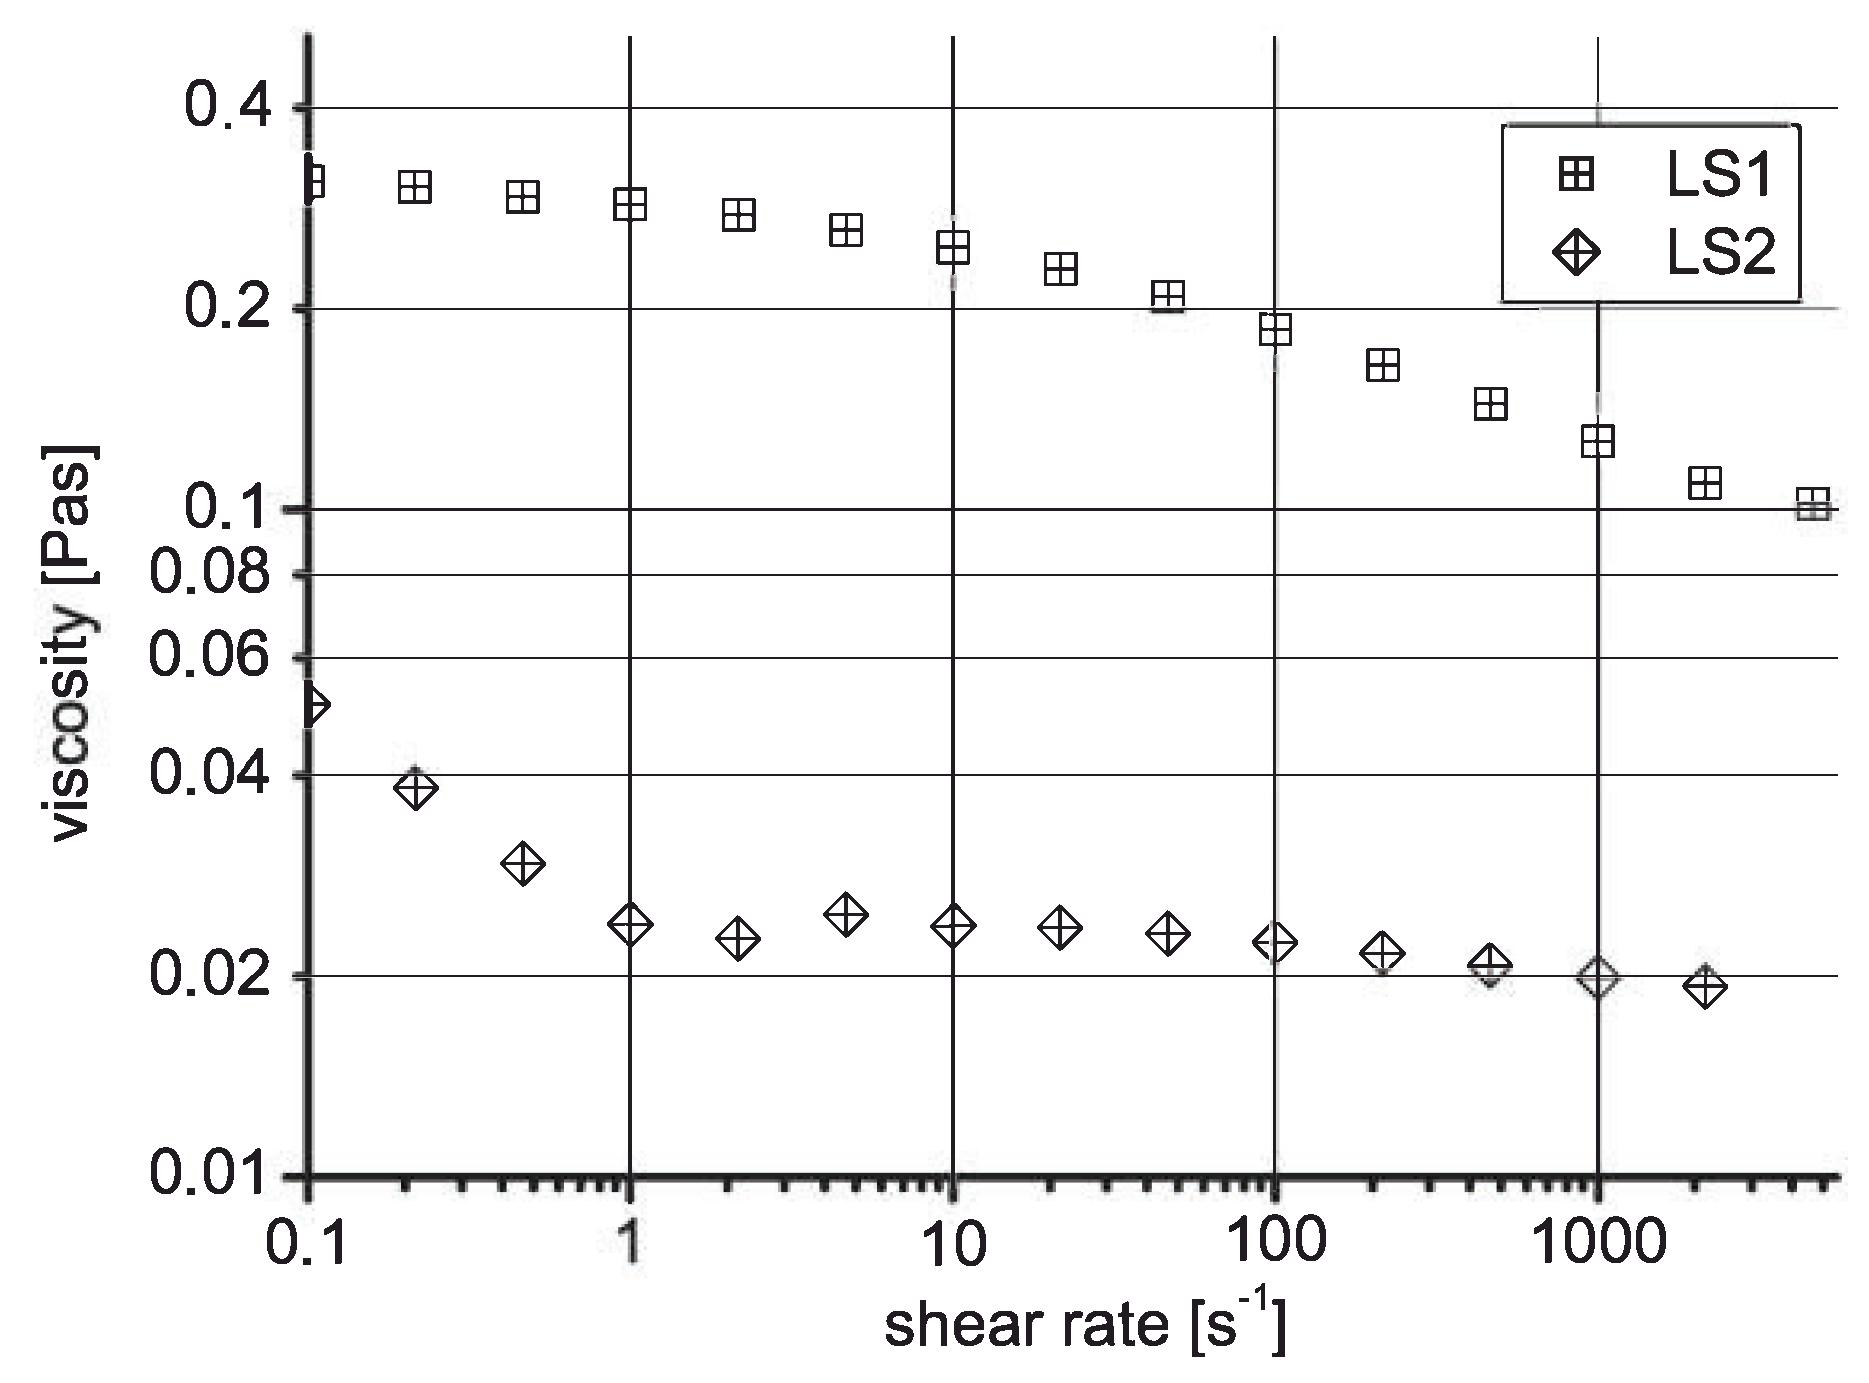
In an additional sequence of viscosity measurements of selected liquids, we checked that printing fluids were Newtonian also in a range of shear rates up to 5000 s, as shown in Figure 4. The additional measurements were done with a Malvern Kinexus rotational rheometer. For water-diluted printing inks, we indeed found Newtonian behavior over a broad range of shear rates. However, using as-prepared industrial ink products, we observed considerable shear thinning: viscosity drops with raising shear rate even at several 1000 s. We therefore expected deviations from our ink splitting theory when using such printing liquids.
Surface tensions were determined by the pendant-drop method using a Krüss DSA 100 contact angle measurement device. Flexographic inks, by industrial standard, usually have surface tensions of 37–39 . We resigned from formulating inks with a largely different surface tension ourselves, but used a customer-specific preparation from Kapp Chemie with (LK2) for our studies. Reformulation of existing inks would have meant to extensively change the ingredients, e.g., replacing water and multiple alcohols by chemically very distinct organic solvents. This, in turn, would have caused various technical risks as, e.g., aggregate formation in the ink, or swelling of the printing plates, with possible effect on their shape and their elastic properties.
4. Results
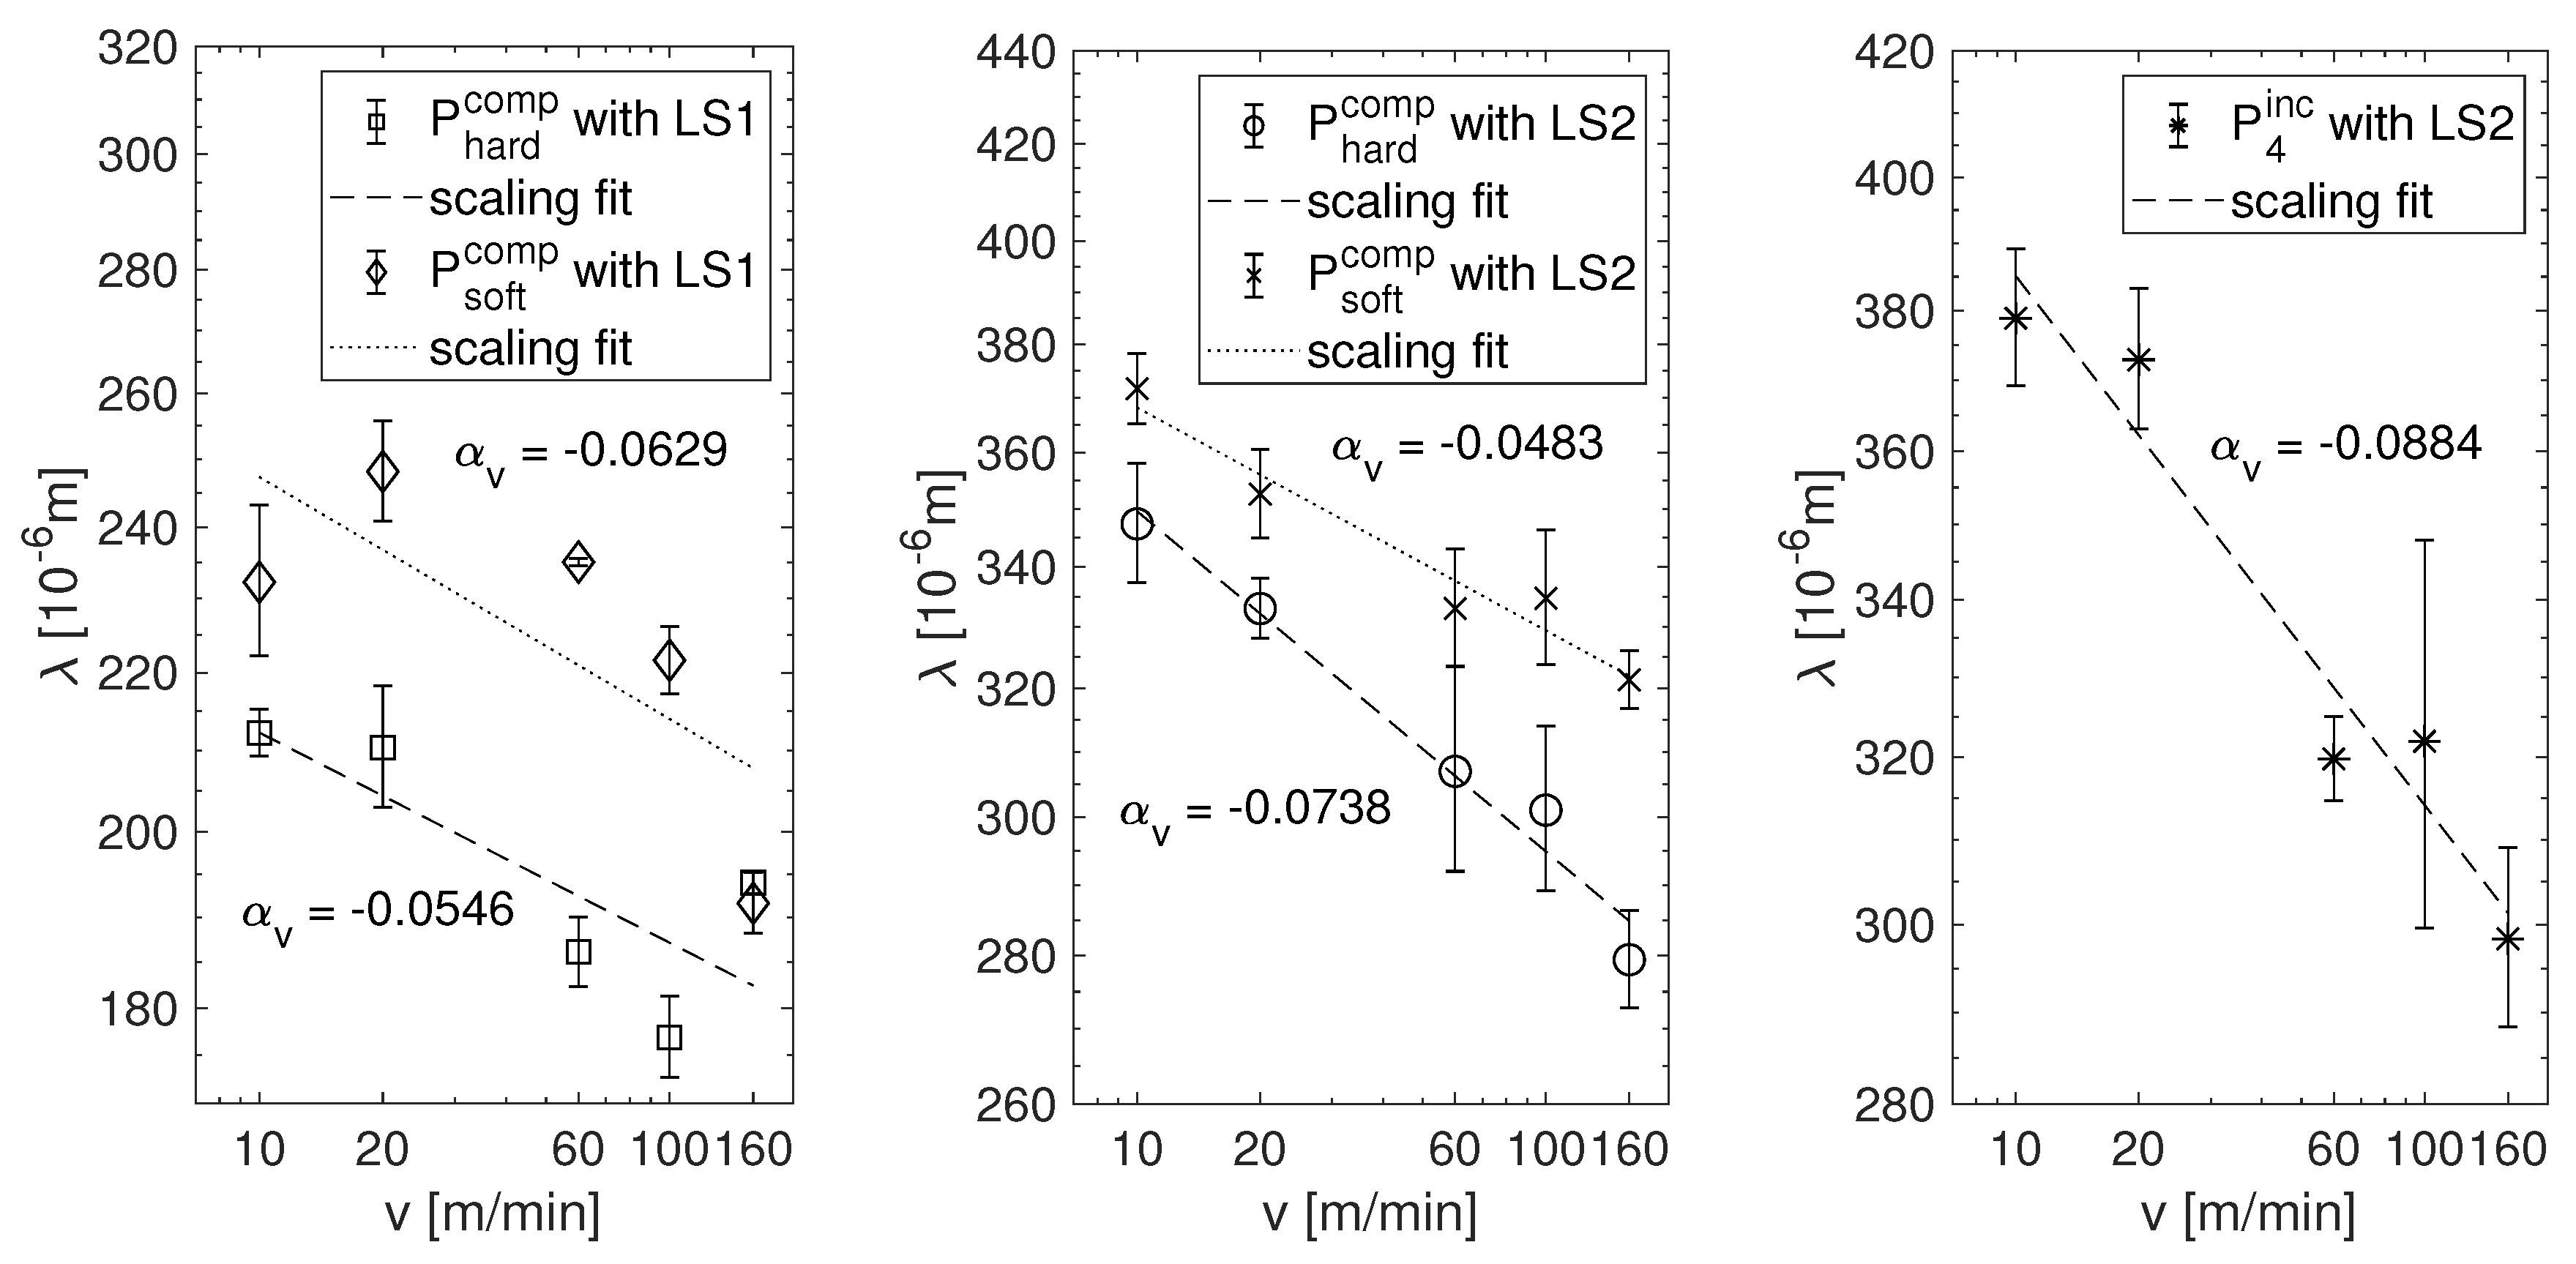
We plotted the obtained finger wavelengths for printing velocities , using different printing forms and fluids. The plots in Figure 5 (left and middle) show the results for hard and soft compressible printing plates and using either the printing fluid at standard formulation LS1 or the diluted (Newtonian) version LS2, whereas Figure 5 (right) is from the incompressible elastomer printing plate and the diluted printing fluid LS2.
First, we considered the fingering wavelengths from printing runs with diluted (Newtonian) printing inks using different printing plates, as shown in Figure 5 (middle and right). The plots show an approximate scaling behavior, with correlation measures between and . The best-fit exponents are , , and , respectively. The scaling exponents for the compressible and the incompressible printing plates do not significantly differ.
The experiments where non-diluted printing inks with a slight tendency to non-Newtonian shear-thinning were used yield a less conclusive result. The fingering wavelengths obtained with the compressible printing plates and the non-diluted ink are displayed as a function of printing velocity in Figure 5 (left). The general tendency that drops with increasing printing velocity persists, but the fit to a scaling profile is much less convincing than for the diluted ink. The correlation coefficient drops to values between and , although the estimates for the scaling exponents and are still in a range compatible with the above findings. It is worth mentioning that the coloring capability of printing inks drastically drops when diluting them. We took advantage of this feature when preparing ink formulation LS2, as dilution makes the ink viscosity more Newtonian and increases the optical contrast of the printed finger pattern. Considering the finger patterns that are evolving in both cases, the optical contrast of the pattern as detected by the scanner is therefore lower for the original ink formulation. This may partially be the origin of the correlation loss.
Moreover, we observed that the ratios of dominant pattern wavelengths between two samples i and j printed with inks LS1 and LS2 of different viscosity, but at identical velocities v, gap widening coefficients , and surface tensions , did coincide within an accuracy of . This indicates that scaling also applied with respect to ink viscosity. We can thus obtain an estimate on the exponent . As the viscosity of LS1 was not very well determined because of shear thinning, the calculated exponent is not accurate. With , one obtains . The detailed findings are shown in Table 3.
Table 4 summarizes the scaling exponents
of the finger wavelength as a function of the printing parameters as extracted linear regression of the double logarithmic data plots, and compare them to the predictions from Equation (6). We found that the velocity and viscosity exponents are in reasonable agreement with the theory from Section 2. Specifically, the values are clearly distinct from exponents measured in the analogous gravure printing experiment using rigid printing surfaces (). Here, one would expect substantially different values of , the scaling exponents for gravure printing. We did not determine , as it was not possible to insert printing cylinders of different radii.
5. Discussion and Conclusions
From our measurements, we could derive estimates on further scaling exponents of quantities, which we were not able to measure directly, i.e., the length ℓ of the wetting zone, the height of the meniscus, the pressure amplitude , and the shear rate of the printing liquid in the nip. First, we consider the theoretical predictions. Equation (5) implies that . Further, as according to Equation (2), the meniscus height should scale as . The same holds for the pressure amplitude as it is proportional to . The shear rate in the nip is proportional to .
Assuming that the relation from Equation (1) is exact, as it has experimentally been well-established in the Hele–Shaw cell [3] and in the rigid rotating cylinder geometry [8,9], predictions on the additional parameters become possible. From the relation , one can relate the exponents and to the measured value of (which we know with good precision):
This implies that , and , whereas we expect these exponents to vanish in the case of rigid cylinders. Note that has been determined in [16] to be by measuring the excess volume in the flexographic nip. Note that these estimates are all independent of our dynamical model, and only make use of the geometrical features of the rotating cylinder geometry.
If one accepts that Equation (4) is also valid, the exponents and for pressure amplitude and shear rate, respectively, can be obtained: and . An overview is given in Table 5.
We emphasize that the validity of Equation (4) is not out of question as it is motivated by considerations on pressure distribution in the nip between rigid cylinders [16]. Moreover, its applicability to flexographic printing plates is limited by viscoelastic effects. The elastic strain response to an applied stress is usually not immediate but delayed on a certain time scale. One would thus suppose that itself might depend on the printing velocity v.
In summary, we could give evidence that scaling arguments are useful for the understanding of the highly non-linear physics in the flexographic printing nip. Doubling the printing velocity of a flexographic machine would not reduce viscous finger wave length by a ratio of , i.e., by , but only by . Doing so, the length ℓ of the wetting zone between printing plate and substrate will not be unaffected, but increase by . The shear rate of the printing ink, even if Newtonian, is far from being a linear function of printing velocity. It raises by only. This is quite different from gravure printing where rigid metal printing cylinders are used. Here, linearity is a reasonable approximation. Interestingly, we did not observe a significant difference in the exponents obtained with compressible and incompressible printing plates. This may be caused by the feature that the relevant parameter, the gap widening coefficient, is not too different for these plates. Moreover, many of our observations are in qualitative agreement with the theoretical model described in Section 2. There are still open questions that should be considered in future studies, as they most likely have impact on scaling: the role of non-Newtonian behavior of the printing ink, and the viscoelastic properties of the printing plates.
Author Contributions
P.B., experimental and data analysis; H.M.S., theory and (most of) writing; and E.D., topic exposition and communication.
Funding
This research was supported by the German Research Foundation (DFG) within the Collaborative Research Center 1194 “Interaction between Transport and Processes” by a PhD research grant for P.B.
Acknowledgments
The authors are indebted to M. Schmitt-Lewen from Heidelberger Druckmaschinen AG for the opportunity to include our experiment into their printing schedule on the Gallus printing press, to T. Euler from our lab for setting up and operating the machine, and to R. Graßler from Felix Böttcher GmbH & Co. KG and to M. Müller from Kapp Chemie GmbH & Co. KG for their generously granted printing sleeve materials and customized printing inks, respectively. We appreciate the fruitful discussions and the valuable advice of all these colleagues.
Conflicts of Interest
The authors declare no conflict of interest. The funders had no role in the design of the study; in the collection, analyses, or interpretation of data; in the writing of the manuscript, or in the decision to publish the results.
Abbreviations
The following abbreviations are used in this manuscript:
| RGB | digital image color encoding format (red-green-blue) |
| TIFF | Tagged image file format using lossless image data compression |
| FFT | Fast Fourier transform algorithm |
| EPDM | Ethylene propylene diene rubber (synthetic) |
| NBR | Acrylonitrile butadiene rubber (synthetic) |
Appendix A
Appendix A.1. Printing Setup
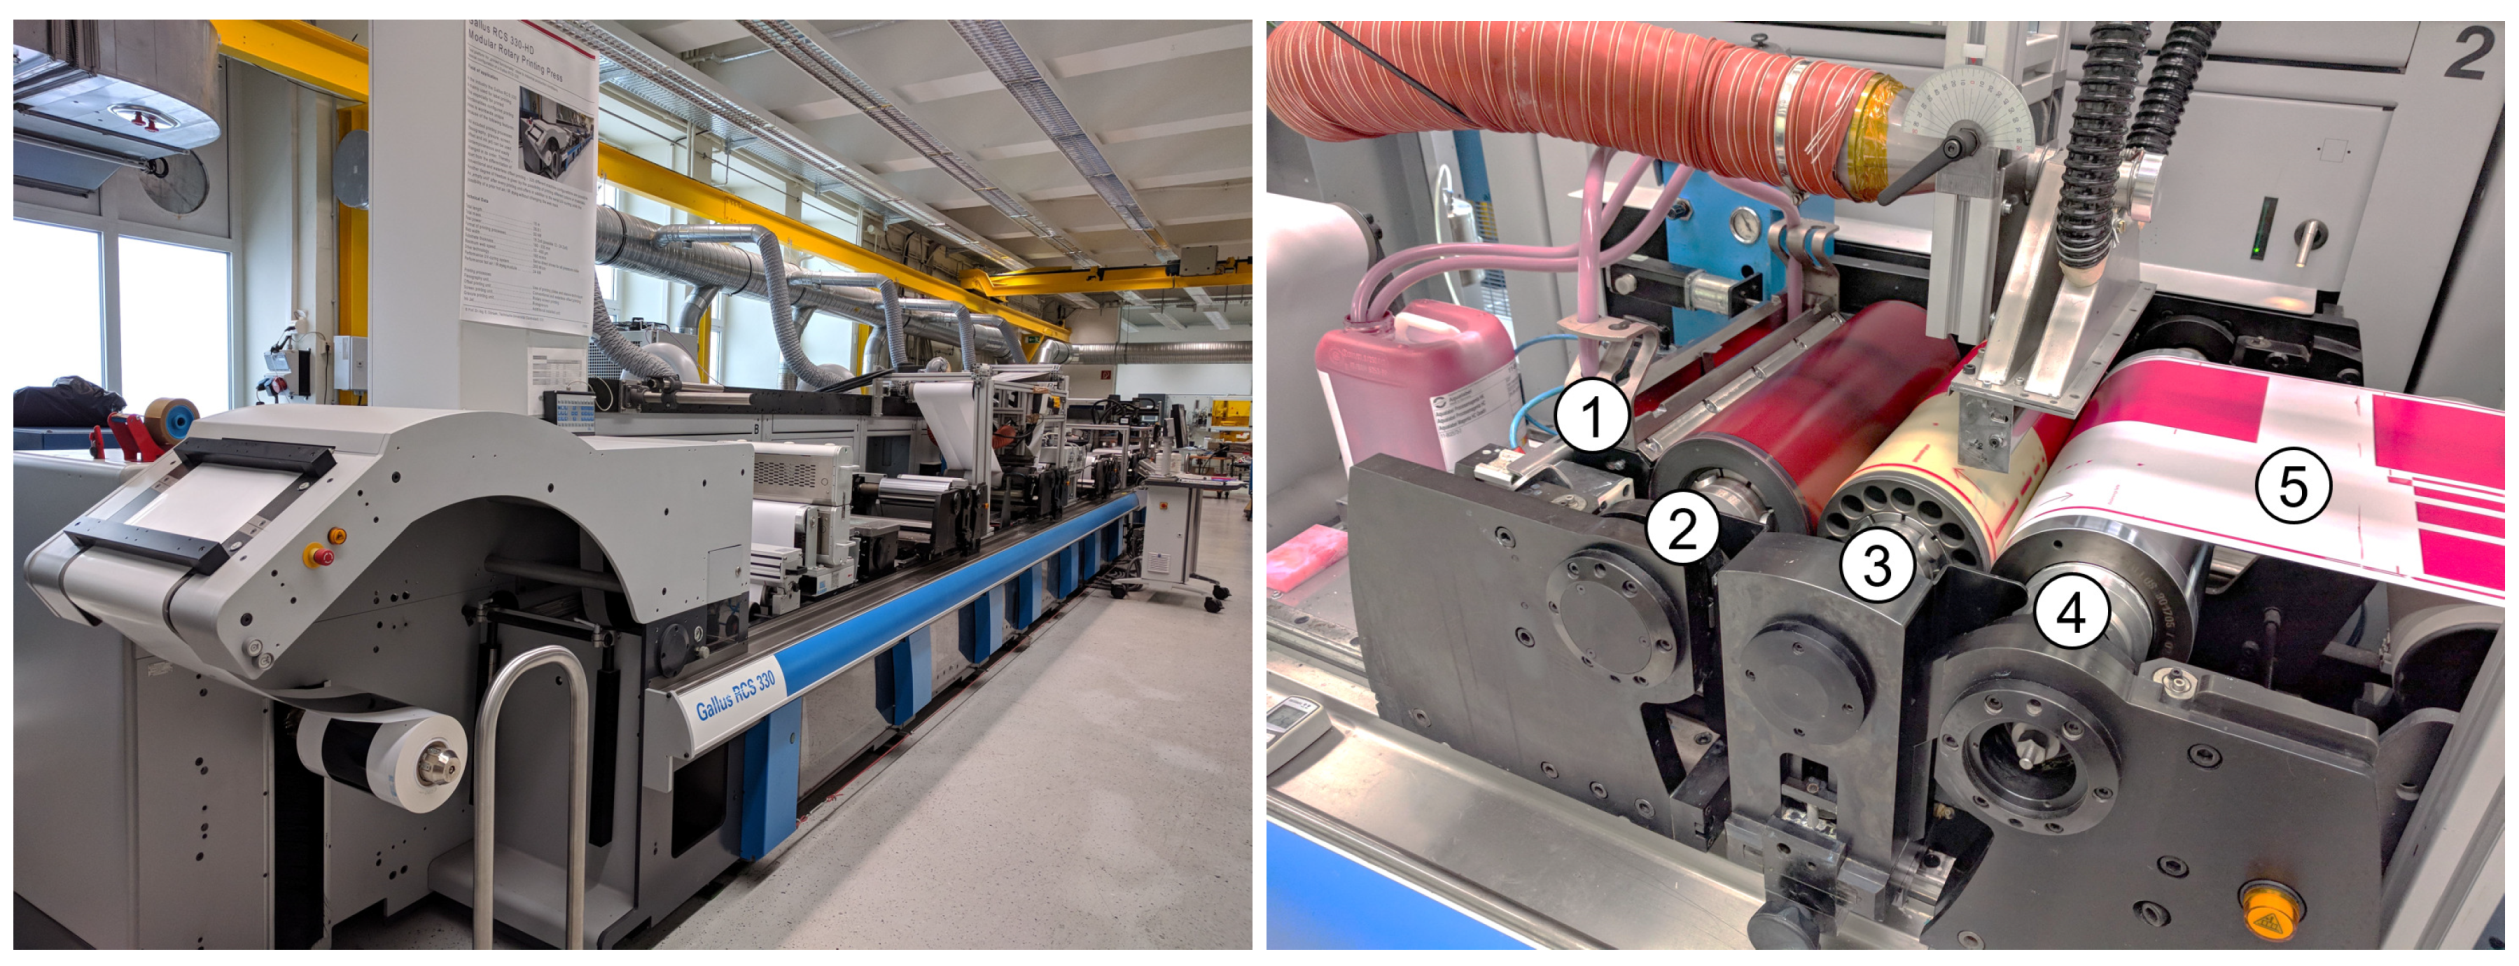
For the printing experiment, we used the industrial-scale web-fed label printing press Gallus RCS 330-HD in our printing lab. The printing press consisted of an unwinding unit for the paper web, four subsequent printing terminals, which could individually be equipped with independent printing units, and a recoiling unit. Our experiment was installed on the second of the four terminals. It consisted of a 18-inch (330 mm) flexo printing module from Gallus, two IST HID hot air driers of proper width, and an additional inkjet unit for individually labeling the printing samples on the reel. The Gallus printing press and flexo printing module are shown in Figure A1. Each sample corresponded to a paper web section of 457.2 mm in length, according to the circumference of the printing cylinder. Each sample thus showed a complete image of the printing plate. The anilox cylinder, which dosed the ink from the blade-chamber reservoir to the printing plate, had a ceramic surface with a laser-engraved rhombic cell raster of 130 lines per cm, a raster angle of 45, and a nominal transfer volume of 13.2 . Moreover, a frame of metal brushes was suspended over the web before it entered the printing unit in order to remove possible electrostatic surface charges.
Figure A1.
(Left) Gallus RCS 330-HD printing press; and (Right) Flexo printing module with printing with blade-chamber reservoir (1), anilox roller (2), printing cylinder (3), impression roller (4) and substrate (5).
Figure A1.
(Left) Gallus RCS 330-HD printing press; and (Right) Flexo printing module with printing with blade-chamber reservoir (1), anilox roller (2), printing cylinder (3), impression roller (4) and substrate (5).
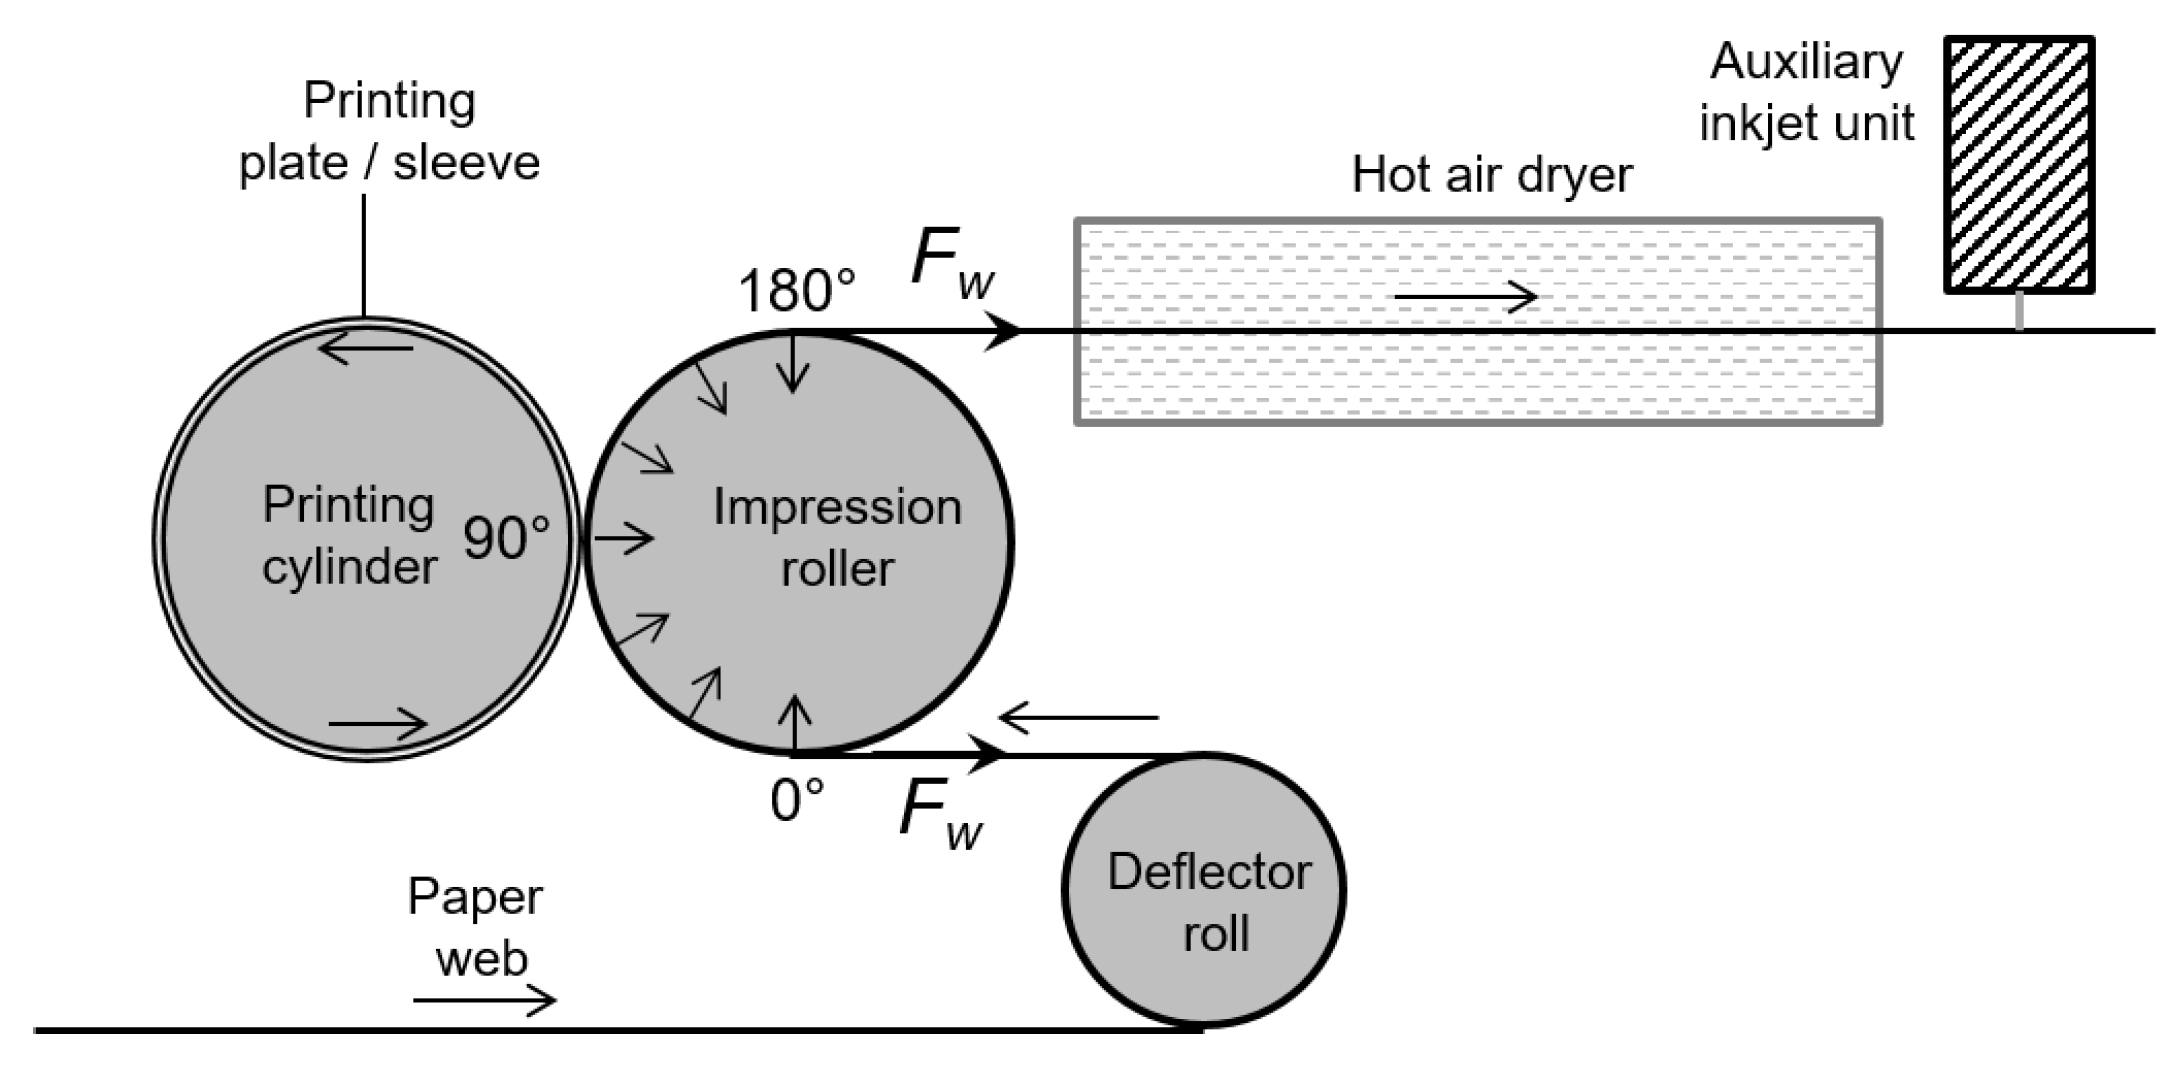
Inside the unit, the paper web was conducted over a steel with a diameter equal to that of the printing cylinder, with a deflection of 180, as shown in Figure A2. The printing nip was located at the central 90-position of the web support zone on the impression roller. Paper web tension was adjusted to . In this way, it could be avoided that the paper was lifted from the impression roller by its adhesion with the printing plate at the instant of fluid splitting.
Figure A2.
Web transport and roller arrangement in the used printing unit. The paper web is held under tension with a constant force of .
Figure A2.
Web transport and roller arrangement in the used printing unit. The paper web is held under tension with a constant force of .
The 33 subsequent printing runs were distributed over three days. The surface temperature of the printing form and relative air humidity in the lab were 26 ± 1 C, and 35 to 62 % r.H., and all material was taken from the same reel. Hot drying air was moderately applied to the paper web that left the printing unit when required, i.e., at elevated printing velocities when ink imbibition and drying were insufficient for recoiling. The temperature of the inking reservoir was stabilized. For determination of ink viscosity and surface tension, samples were taken from the reservoir before and after each printing run. The printing velocity of the unit was digitally controlled using a compulsory servo drive. Thus, we cannot specify any significant errors in the printing velocities. From the total printout, we only evaluated material produced under steady-state conditions of the experiment.
Appendix A.2. Sample Digitalization and Spectral Analysis
For evaluating the samples, the web was cut into pieces of 165 mm × 297 mm in size, and defined full-tone areas of 110 mm × 260 mm were scanned with an Epson Perfection V800 Photo flatbed scanner using the software SilverFast Ai Studio 8. Nominal scanner resolution was 2400 dpi, actual resolution was determined to 1825 dpi, using a standard USAF-1951 resolution target. A Kodak IT8 target was used for color calibration. The digital data were saved as lossless 48 bit RGB TIFF files. The width and height of each image corresponded to = 10,394 pixels and = 24,568 pixels, respectively. The size of a pixel is 10.58 m. Calibration was necessary to guarantee reproducibility and to ensure that the digital RGB signal generated by the scanner was comparable amongst our samples, i.e., the digital R, G, and B signals should shift proportionally with the tone value of the printed samples, but preserve constant mutual ratios. For the evaluation of the finger patterns, the data from red color channel were used exclusively (blue would have been possible as well), whereas the green color channel was void of any pattern information. In view of the spectral absorption of the red ink pigments that we used, this was physically consistent. Thus, within each sample, differences of the digital color signal of each image pixel could be considered as being proportional to differences in the amount of ink deposited in this point of the printed sample. Consequently, the Fourier amplitudes of the digital image could be interpreted in terms of a linear superposition of harmonic waves in local ink quantities.
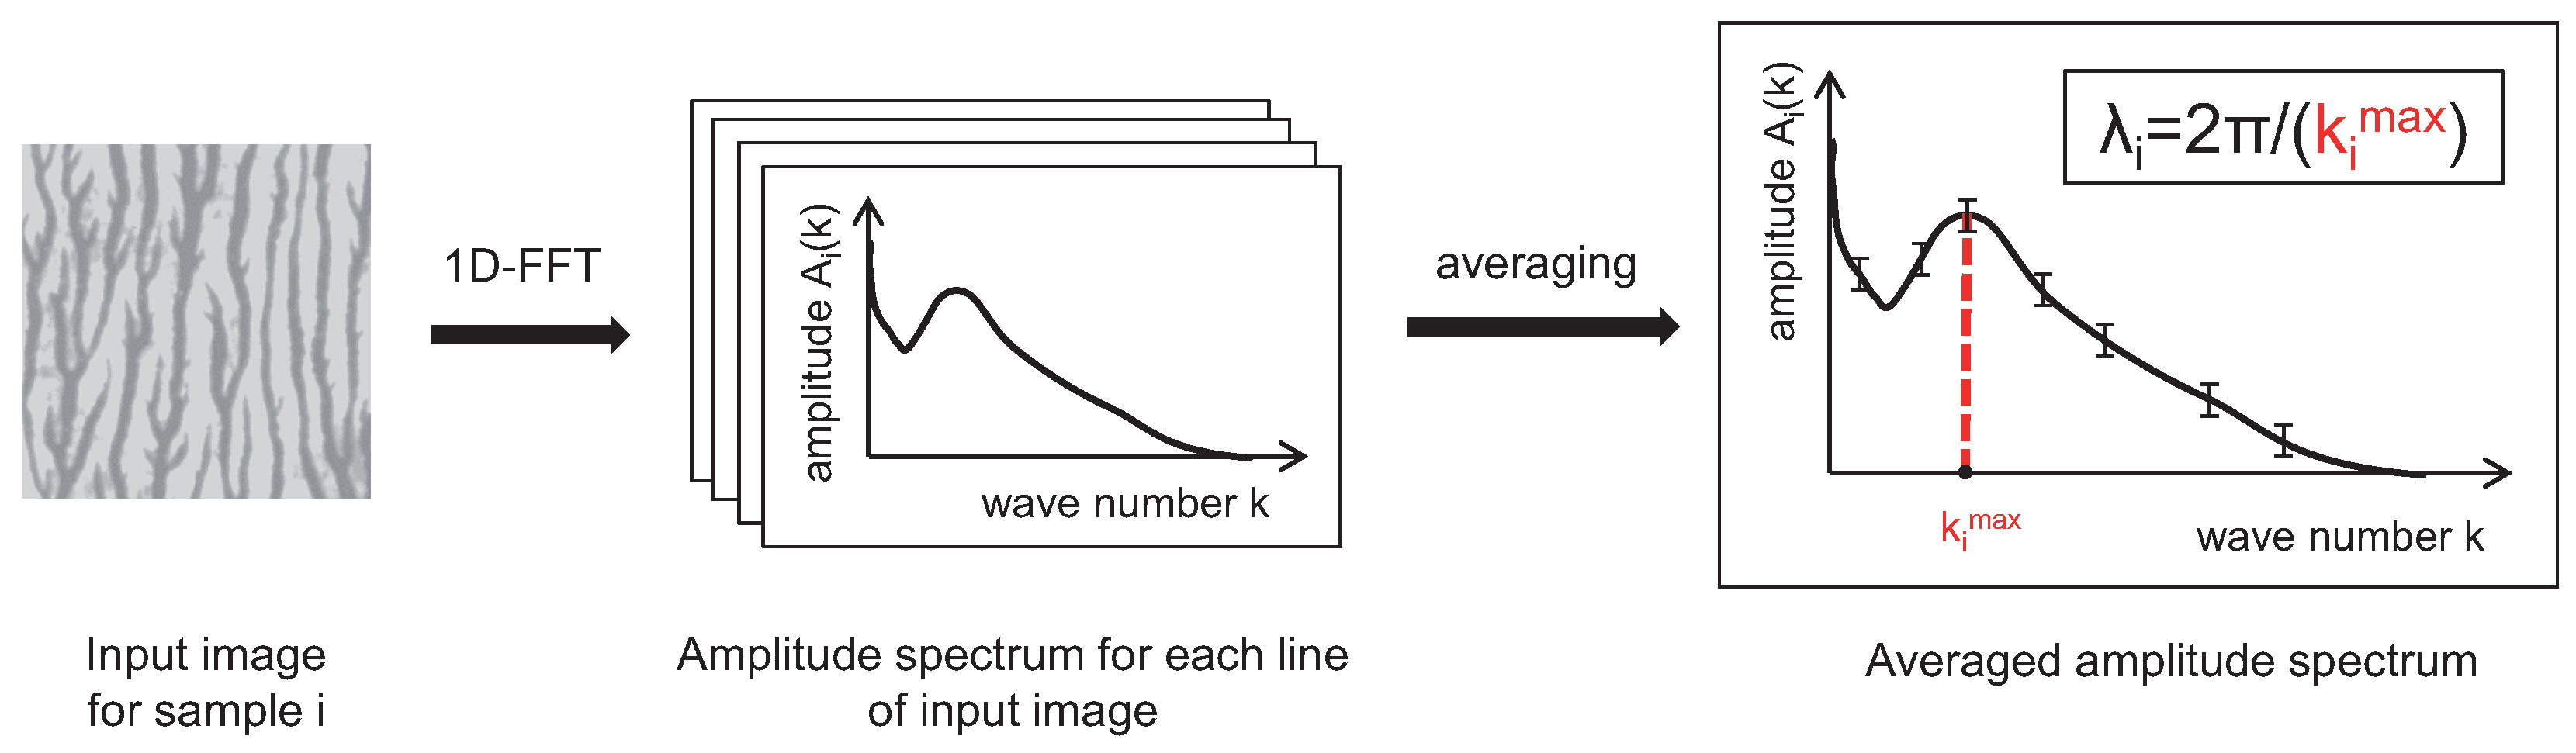
The 99 digital images of our samples (3 images for each of the 33 printing runs) were finally digitally aligned with the printing direction using the MATLAB 2018b Hough transform function, and 1D-FFT-transformed line by line, see Figure A3. On average, each line comprised a continuous section through 300–600 individual fingers, with dominant pattern wavelength of 180–370 m on the different samples. The Fourier transforms of each line were finally added up and divided by the total number of lines , yielding a sample-averaged non-negative spectral amplitude for each sample i. No window algorithm was applied for sake of preserving the structure of the FFT amplitude spectrum for later evaluation. Artifacts resulting from the FFT boundary conditions could be identified as well. As they were located in predictable positions of the spectra, they could be excluded from further analysis.
Plotting the spectral amplitudes against their wave numbers , where W is the image width, clear maxima could be identified in the predefined region of interest. Note that the amplitude is an even function of k, thus we omitted negative values of k. corresponds to the average tone value of the sample. The dominant pattern wavelength in a sample is defined by , where is the number of fingers per image width W. The positions of spectra from different samples were converted to and plotted against printing velocity, ink viscosity, etc. according to the selection of the samples.
Figure A3.
Measurement procedure for the dominant pattern wavelength of each sample i. In the first step, a one-dimensional Fast Fourier Transform Algorithm (1D-FFT) is applied to each line of the input image in MATLAB 2018b. The 1D-FFT delivers = 24,568 amplitude spectra. Each amplitude spectrum shows the spectral amplitudes versus their wave numbers k. In the second step, a sample-averaged amplitude spectrum is calculated from which a clear maximum is obtained in the predefined region of interest. Finally, the dominant pattern wavelength is calculated from .
Appendix A.3. Symbols
Table A1 contains a short explanation of all symbols used in the text.

Table A1.
List of symbols. In the text, physical parameters are sometimes given in derived units (e.g., mm and MPa).
Table A1.
List of symbols. In the text, physical parameters are sometimes given in derived units (e.g., mm and MPa).
| Symbol | Quantity | Units (SI) |
|---|---|---|
| Spectral amplitude function of the Fourier transformed digital image of sample i | - | |
| Scaling exponent expressing pattern wavelength as a function of a quantity x | - | |
| Scaling exponent in a gravure printing setup | - | |
| Scaling exponent expressing a quantity y as a function of velocity v | - | |
| b | Thickness of the flexo printing plate | m |
| Raster period of the gravure cells on a gravure printing plate | m | |
| Capillary number | - | |
| d | Typical lateral printing resolution | m |
| Height of the fluid menisci of the nip | m | |
| Average liquid film thickness in the nip | m | |
| Heading tool diameter in the stress-strain measurement system | m | |
| Typical contact time of printing plate and substrate | s | |
| Compression force exerted on printing plate pieces in the stress-strain measurement system | n | |
| Web tension of the paper substrate in the printing press | ||
| Shear rate of the printing liquid | ||
| h | Thickness of the liquid layer in a Hele–Shaw cell, or between printing plate and substrate | m |
| Dynamical viscosity of the printing fluid | ||
| k | Wave number defined for spectral image evaluation | |
| Wave number corresponding to the dominant pattern wavelength | ||
| Apparent compressibility modulus of the printing plate | ||
| Gap widening coefficient | ||
| ℓ | Distance between incoming and outgoing fluid menisci of the nip | m |
| , | Dominant pattern wavelength of the instability, on sample i | m |
| Ratio of capillary versus elastic forces | - | |
| , | Pixel numbers of the digitalized images of the printed samples | - |
| Number of fingers across a printed sample | - | |
| p, | Fluid pressure, pressure amplitude in the nip | |
| , | Radii of printing cylinder, impression roller | m |
| Statistical correlation coefficient | - | |
| Radius corresponding to the total curvature of printing cylinder and substrate | m | |
| Surface tension of the printing fluid | N/m | |
| v | Cylinder revolution and substrate velocity | |
| W | Physical width of the evaluated sector of a printed sample | m |
References
- Wegener, M.; Spiehl, D.; Sauer, H.M.; Mikschl, F.; Liu, X.; Kölpin, N.; Schmidt, M.; Jank, M.P.M.; Dörsam, E.; Roosen, A. Flexographic printing of nanoparticulate tin-doped indium oxide inks on PET foils and glass substrates. J. Mater. Sci. 2016, 51, 4588–4600. [Google Scholar] [CrossRef] [Green Version]
- Casademunt, J. Viscous fingering as a paradigm of interfacial pattern formation: Recent results and new challenges. Chaos 2004, 14, 809–824. [Google Scholar] [CrossRef] [PubMed]
- Saffman, P.G.; Taylor, G.I. The penetration of a fluid into a porous medium or a Hele-Shaw cell containing a more viscous liquid. Proc. R. Soc. Lond. Ser. A 1958, 245, 312–329. [Google Scholar]
- Brailovsky, I.; Babchin, A.; Frankel, M.; Shivashinsky, G. Finger Instability in Water-Oil Displacement. Transp. Porous Media 2006, 63, 363–380. [Google Scholar] [CrossRef]
- Sahimi, M. Flow phenomena in rocks: From continuum models to fractals, percolation, cellular automata, and simulated annealing. Rev. Mod. Phys. 1993, 65, 1393. [Google Scholar] [CrossRef]
- Wooding, R.A.; Morel-Seytoux, H.J. Multiphase fluid flow in porous media. Annu. Rev. Fluid Mech. 1976, 8, 233–274. [Google Scholar] [CrossRef]
- Chen, J.-D.; Wilkinson, D. Pore-Scale Viscous Fingering in Porous Media. Phys. Rev. Lett. 1985, 55, 1892–1895. [Google Scholar] [CrossRef] [PubMed]
- Kitsomboonloha, R.; Subramanian, V. Lubrication-Related Residue as a Fundamental Process Scaling Limit to Gravure Printed Electronics. Langmuir 2014, 30, 3612–3624. [Google Scholar] [CrossRef] [PubMed]
- Bornemann, N.; Sauer, H.M.; Dörsam, E. Gravure Printed Ultrathin Layers of Small-Molecule Semiconductors on Glass. J. Imaging Sci. Technol. 2011, 55, 040201. [Google Scholar] [CrossRef]
- Voß, C. Analytische Modellierung, Experimentelle Untersuchungen und Dreidimensionale Gitter-Boltzmann Simulation der Quasistatischen und Instabilen Farbspaltung. Ph.D. Thesis, Bergische Universität Gesamthochschule, Wuppertal, Germany, 2002. [Google Scholar]
- Lindner, A.; Coussot, P.; Bonn, D. Viscous Fingering in a Yield Stress Fluid. Phys. Rev. Lett. 2000, 85, 314–317. [Google Scholar] [CrossRef] [PubMed]
- Lindner, A.; Bonn, D.; Poiré, E.C.; Amar, M.B.; Meunier, J. Viscous fingering in non-Newtonian fluids. J. Fluid Mech. 2002, 469, 237–256. [Google Scholar] [CrossRef]
- Bico, J.; Roman, B.; Moulin, L.; Aoudaoud, A. Elastocapillary coalescence in wet hair. Nature 2004, 432, 690. [Google Scholar] [CrossRef] [PubMed]
- Roman, B.; Bico, J. Elasto-capillarity: Deforming an elastic structure with a droplet. J. Phys. Condens. Matter 2010, 22, 493101. [Google Scholar] [CrossRef] [PubMed]
- Kim, H.-Y.; Mahadevan, L. Capillary rise between elastic sheets. J. Fluid Mech. 2006, 548, 141–150. [Google Scholar] [CrossRef]
- Sauer, H.M.; Daume, D.; Dörsam, E. Lubrication theory of ink hydrodynamics in the flexographic printing nip. J. Print Media Technol. Res. 2015, 4, 163–172. [Google Scholar]
- Gaskell, P.H.; Innes, G.E.; Savage, M.D. An experimental investigation of meniscus roll coating. J. Fluid Mech. 1998, 355, 17–44. [Google Scholar] [CrossRef] [Green Version]
- Sauer, H.M.; Roisman, I.V.; Dörsam, E.; Tropea, C. Fast liquid sheet and filament dynamics in the fluid splitting process. Colloids Surf. A 2018, 557, 20–27. [Google Scholar] [CrossRef]
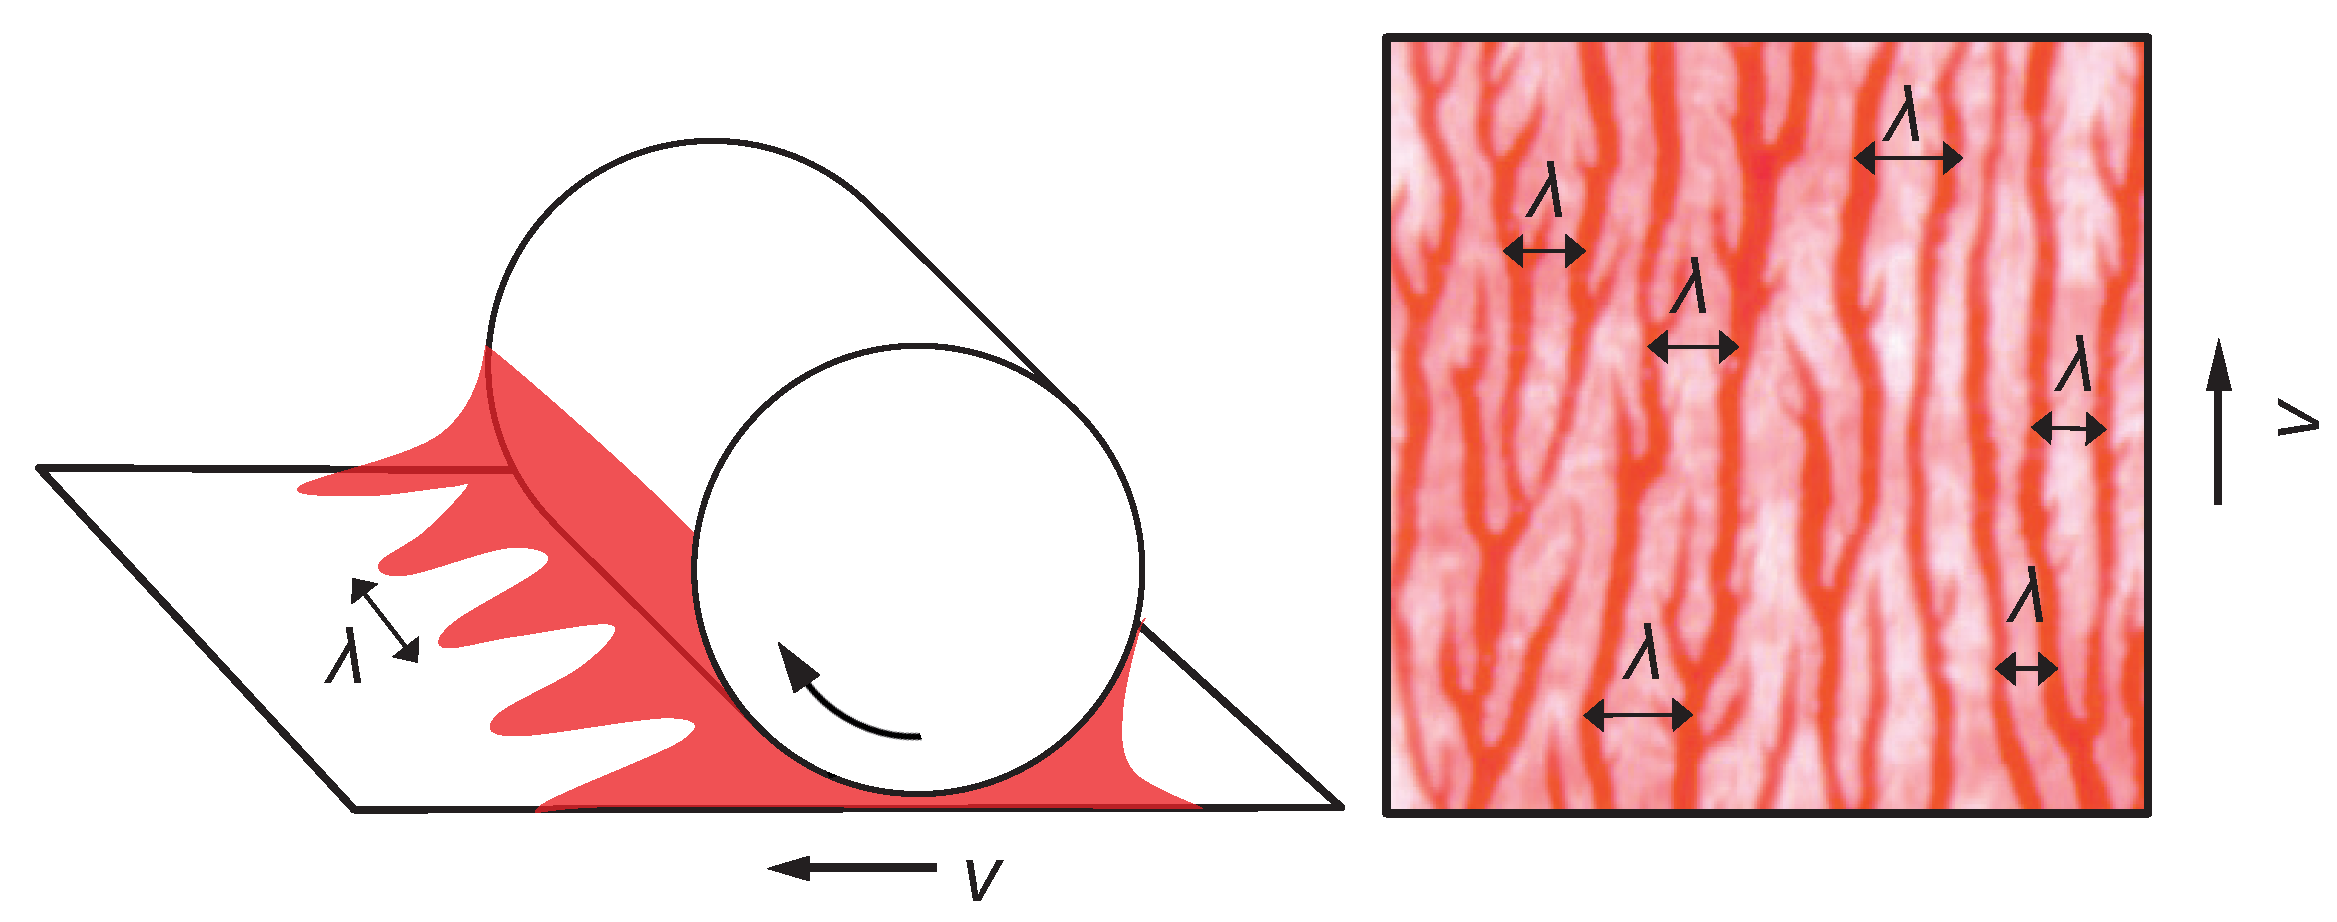
Figure 1.
Viscous fingering instability in the printing nip creates ribbing defect on the printed sample. The cylinder revolution and substrate velocity v affects the dominant pattern wavelength .
Figure 1.
Viscous fingering instability in the printing nip creates ribbing defect on the printed sample. The cylinder revolution and substrate velocity v affects the dominant pattern wavelength .
Figure 2.
Principal design of a flexographic printing unit. A, B, incoming and outgoing ink meniscus; N, printing nip; , meniscus height; ℓ, width of the wetted zone.
Figure 2.
Principal design of a flexographic printing unit. A, B, incoming and outgoing ink meniscus; N, printing nip; , meniscus height; ℓ, width of the wetted zone.
Figure 3.
Experimental setup to determine the gap widening coefficient . A cylindric heading tool (1) with diameter is used to deform the printing plate (2) by . The applied force is .
Figure 3.
Experimental setup to determine the gap widening coefficient . A cylindric heading tool (1) with diameter is used to deform the printing plate (2) by . The applied force is .
Figure 4.
The viscosities of printing inks LS1 and LS2 versus shear rate.
Figure 5.
The finger wavelength as a function of printing velocity v for different printing forms and fluids in double logarithmic plots: (Left) compressible printing plates with printing fluid at standard formulation; (Middle) compressible printing plates with diluted fluid; and (Right) incompressible elastomer printing plate with diluted fluid.
Table 1.
Measured apparent compressibilities and gap widening coefficients of the used compressible () and incompressible () printing plates.
Table 1.
Measured apparent compressibilities and gap widening coefficients of the used compressible () and incompressible () printing plates.
| Printing Plate | [MPa] | [] |
|---|---|---|
Table 2.
Viscosities and surface tensions of the printing liquids.
| Ink ID | Printing Liquid | [mPas] at C | [] | [] at C |
|---|---|---|---|---|
| LS1 | Siegwerk magenta std. formulation | 1–7 2000 | ||
| LS2 | 4:1 diluted with water | 50–100 2000 | ||
| LK1 | Kappaflex red std. formulation | 6–50 | ||
| LK2 | + tenside | 6–50 |
Table 3.
The ratios of the observed dominant pattern wavelengths in samples printed with the inks LS1 and LS2 of viscosities mPas and mPas, respectively, but identical surface tensions , using printing plates with the same velocities v and gap widening coefficients .
Table 3.
The ratios of the observed dominant pattern wavelengths in samples printed with the inks LS1 and LS2 of viscosities mPas and mPas, respectively, but identical surface tensions , using printing plates with the same velocities v and gap widening coefficients .
| v [m/min] | [mm/MPa] | Ratio |
|---|---|---|
| 10 | 0.136 | 0.6110 |
| 20 | (plates ) | 0.6306 |
| 60 | 0.6059 | |
| 100 | 0.5880 | |
| 160 | 0.6953 | |
| 10 | 0.159 | 0.6237 |
| 20 | (plates ) | 0.7025 |
| 60 | 0.7057 | |
| 100 | 0.6627 | |
| 160 | 0.5981 | |
| average: |
Table 4.
Experimental vs. theoretical scaling exponents of the viscous finger wavelength , as a function of the printing parameters x: printing velocity v, ink viscosity , surface tension , gap widening coefficient , and cylinder radius . The theoretical exponents for rigid, i. e. non-deformable plates, are shown for comparison.
| Exponent | Theory | Experiment | |
|---|---|---|---|
| Rigid () | Elastic () | Elastic Plates | |
| — | |||
| 0 | (not measured) | ||
Table 5.
Estimates of scaling exponents of further parameter as a function of the printing velocity v, derived from the exponents in Table 4: meniscus height , length of the wetting zone ℓ, pressure amplitude , and shear rate .
Table 5.
Estimates of scaling exponents of further parameter as a function of the printing velocity v, derived from the exponents in Table 4: meniscus height , length of the wetting zone ℓ, pressure amplitude , and shear rate .
| Parameter | Exponent | Theory | Derived from Exper. | |
|---|---|---|---|---|
| Rigid () | Elastic () | Elastic Plates | ||
| Nip meniscus height | 0 | |||
| Wetting zone length | 0 | |||
| Pressure amplitude | 1 | |||
| Nip shear rate | 1 | |||
© 2019 by the authors. Licensee MDPI, Basel, Switzerland. This article is an open access article distributed under the terms and conditions of the Creative Commons Attribution (CC BY) license (http://creativecommons.org/licenses/by/4.0/).
Share and Cite
MDPI and ACS Style
Brumm, P.; Sauer, H.M.; Dörsam, E. Scaling Behavior of Pattern Formation in the Flexographic Ink Splitting Process. Colloids Interfaces 2019, 3, 37. https://doi.org/10.3390/colloids3010037
AMA Style
Brumm P, Sauer HM, Dörsam E. Scaling Behavior of Pattern Formation in the Flexographic Ink Splitting Process. Colloids and Interfaces. 2019; 3(1):37. https://doi.org/10.3390/colloids3010037
Chicago/Turabian StyleBrumm, Pauline, Hans Martin Sauer, and Edgar Dörsam. 2019. "Scaling Behavior of Pattern Formation in the Flexographic Ink Splitting Process" Colloids and Interfaces 3, no. 1: 37. https://doi.org/10.3390/colloids3010037