Article

Thermal Transformation of Caffeic Acid on the Nanoceria Surface Studied by Temperature Programmed Desorption Mass-Spectrometry, Thermogravimetric Analysis and FT–IR Spectroscopy

1
Chuiko Institute of Surface Chemistry, NAS of Ukraine, 17 General Naumov Str., 03164 Kyiv, Ukraine
2
Stockholm University, Department of Physics, AlbaNova University Center, SE-106 91 Stockholm, Sweden
*
Authors to whom correspondence should be addressed.
Colloids Interfaces 2019, 3(1), 34; https://doi.org/10.3390/colloids3010034
Submission received: 31 December 2018 / Revised: 22 February 2019 / Accepted: 5 March 2019 / Published: 11 March 2019

Abstract

:
The studies of pyrolysis of caffeic acid (CA) and its surface complexes is important for the development of technologies of heterogeneous catalytic pyrolysis of plant- and wood- based renewable biomass components. In this work, the structure and thermal transformations of the surface complexes of CA on the surface of nanoceria were investigated using Fourier transform–infrared (FT–IR) spectroscopy, thermogravimetric analysis (TGA) and temperature-programmed desorption mass spectrometry (TPD MS). It was found that CA on the surface of cerium dioxide forms several types of complexes: bidentate carboxylates, monodentate carboxylates and complexes formed as a result of interaction with phenolic hydroxyl groups. This is due to the ability of nanosized cerium dioxide to generate basic hydroxyl groups that can deprotonate phenolic groups to form phenolates on the surface. The main pyrolysis products were identified. The possible ways of forming 3,4-dihydroxyphenylethylene, acetylene carboxylic acid, pyrocatechol and phenol from surface complexes of CA were suggested. It was established that on the nanoceria surface effectively occur the decarboxylation, decarbonylation, and dehydration reactions of the CA, which are the desirable processes in biomass conversion technologies.

1. Introduction

In the last few years, CeO2-based materials have attracted much attention due to their wide use in various catalytic systems [1,2,3,4,5,6]. The success of ceria and ceria-based materials in catalysis is often due to facile Ce4+/Ce3+ redox cycling without disruption of the fluorite lattice structure [6]. At the same time the redox and acid-base properties of ceria, either alone or in the presence of transition metals, are important parameters that allow activation of complex organic molecules and selective orientation of their transformation [5]. These characteristics of cerium dioxide indicate the promise of its use as a catalyst for the development of green technologies of heterogeneous pyrolysis of biomass, which today is considered the most attractive renewable raw material for the production of bio-based chemicals.
In addition, the Ce3+/Ce4+ redox couple on the nanoparticle surface provides biological activity of cerium oxide nanoparticles [7]. Their action mechanism is similar to that of natural metalloenzymes that use transition metal ions, such as Fe3+, Cu2+, or Mn3+, to buffer reactive oxygen species in cells and tissues [7,8]. Due to this, nanosized cerium dioxide can be used in medical practice to combat chronic inflammation and pathology associated with oxidative stress, which includes cancer and neurodegeneration [8]. It has been shown that one of the methods for increasing the stability of suspensions of nanosized cerium dioxide and correction of its biological action may be to cover the surface of nanoparticles of CeO2 by biocompatible/organic polymers [8,9,10] and carboxylic acids [11,12].
A significant part of the biomass is made up of hydroxycinnamates, in particular, cinnamic acid and its derivatives (caffeic acid (CA), ferulic acid, p-coumaric acid, sinapic etc.), which are structural blocks of lignocellulose [13]. Special attention is given by researchers to CA. This polyphenol is present in many plants and occurs in the diet as part of fruits, coffee drinks, tea and wine [14,15,16]. Besides food, CA is present in several medications of popular use, mainly based on propolis [17]. The natural renewable source of this valuable acid is currently considered Cynara cardunculus L (artichoke) and agricultural and industrial waste from its processing [18].
CA can be considered one of the most promising natural antioxidants [19,20,21]. The antioxidant activity of this molecule is given by its hydroxyl groups [19,22]. The presence of the OH-group, para-substituted in the aromatic ring, allows free electrons containing phenoxy radicals to delocalize throughout the molecule, thus stabilizing it [23]. The presence of a second hydroxyl group in the ortho-position is known to increase the antioxidant activity due to an additional resonance stabilization and formation of o-quinone [23,24,25,26].
At the same time, lignin-derived phenolic compounds can be used to produce aromatic hydrocarbons such as benzene, toluene, and xylene, phenol, etc. [27,28,29]. It is also known that nanoparticles of metal oxides can be used as catalysts for the production of chemicals through heterogeneous pyrolysis of bio-derived carboxylic acids [30,31,32,33,34,35,36,37]. However, an understanding of the mechanisms of surface-assisted catalytic transformations of these compounds is difficult and the number of thermochemical studies of hydroxycinnamates is quite limited [38,39,40].
Therefore, the study of the thermal transformation of CA, both in the condensed phase and on the surface of materials based on cerium dioxide, is of great practical importance for the development of green technologies of heterogeneous pyrolysis of biomass, as well as for the food industry in order to select the optimal temperatures for the processing and storage of herbal raw materials with high content of polyphenols. Investigation of the interaction of CA with the surface of nanoceria may be useful for implementation of ceria-based materials to pharmaceutical practice.
The effectiveness of the method of temperature-programmed desorption mass spectrometry (TPD MS) in the study of the interaction of cinnamic, ferulic and caffeic acids with the surface of silica was shown in our previous works [35,36,37]. During TPD MS experiments, the surface complexes of various types undergo chemical transformations, which lead to the formation, respectively, of different types of chemical products. The analysis of products of thermal transformations allows us to identify the initial structure of surface complexes.
In this work, the structure of CA surface complexes and their thermal transformations on the surface of nanoceria by using TPD MS, thermogravimetric analysis (TGA) and Fourier transform–infrared (FT–IR) spectroscopy was investigated. The results may help deepen our understanding of these materials and help predict their behavior and application potential.

2. Materials and Methods

Nanoceria was obtained from Alfa Aesar (99.5%, SAr = 71 m2/g, average size of the primary particles d ≈ 15–30 nm). Prior to the adsorption of CA the powder was calcined at 500 °C in air for 2 h to remove adsorbed organic matters. Caffeic acid (≥98%) was supplied by Sigma-Aldrich.
The samples of the nanosized CeO2 were impregnated with CA. A series of samples was obtained (CA/CeO2). The concentration of loaded CA in the samples obtained was 0.1, 0.3, 0.6, 0.9, 1.2 mmol/g. Samples were prepared by mixing 1 g of CeO2 with 20 mL of CA solution in ethanol (96%) with an appropriate concentration. The suspensions were stirred for several minutes and then dried at room temperature in air.
A sample CA/CeO2 (0.3 mmol/g) was used for desorption. To 50 mg of the test sample was added 5 mL of ethanol (96%). The suspension was maintained for 2 h at room temperature (20 °C) periodically shaking. Тhe solid phase was separated from the solution by filtration and then was dried at room temperature in air.
FT–IR spectra at different temperatures were recorded on a Thermo Nicolet Nexus Fourier-transform infrared spectrometer in the 400–4000 cm−1 range, working in “Nexus Smart Collector” mode with a resolution of 4 cm−1. The powdered samples of CA/CeO2 and pure CeO2 were mixed with freshly calcined and milled KBr (10:100). Pure CA was mixed with KBr in a ratio of 1:100. KBr was precalcined at 500 °C for 2 h.
Temperature-programmed desorption mass spectrometry experiments were carried out with ionization MKh-7304A monopole mass spectrometer (Sumy, Ukraine) that was adapted for measurements [35,36]. About 20 mg of samples were used for each run. At the beginning of the measurements all samples were degassed to ca. 5 × 10⁻⁵ at temperature 20 °C after which they were heated to a temperature 750 °C. The heating rate was 0.17 °C s−1.
Thermogravimetric analysis, differential thermogravimetric analysis (DTG) and differential thermal analysis (DTA) were performed using a TGA/DTA analyzer (Q-1500D, Hungaria). A typical sample mass of 100 mg was heated from room temperature to 1000 °C at a heating rate of 10 °C/min in an air atmosphere.

3. Results and Discussion

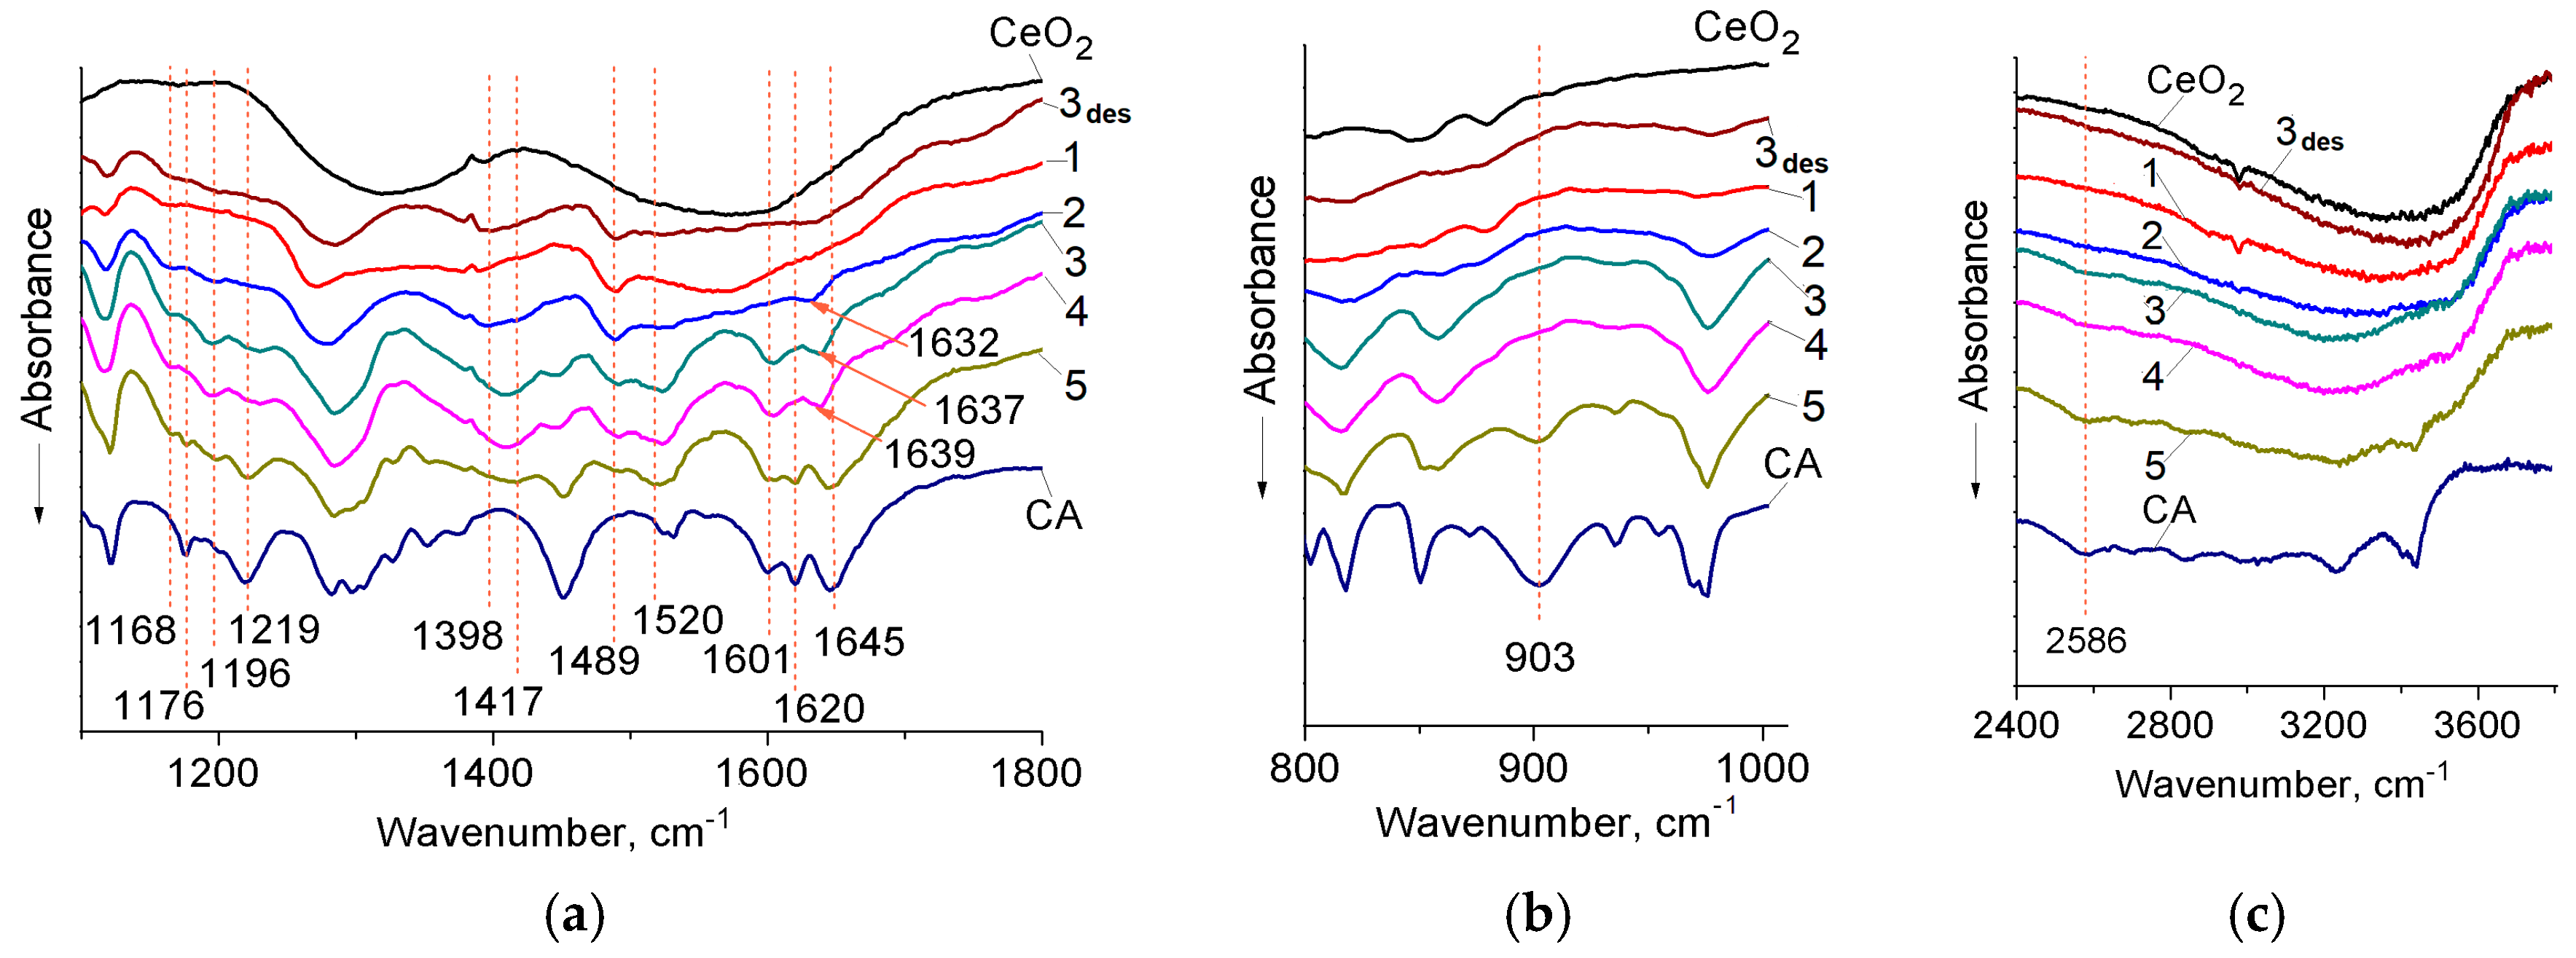
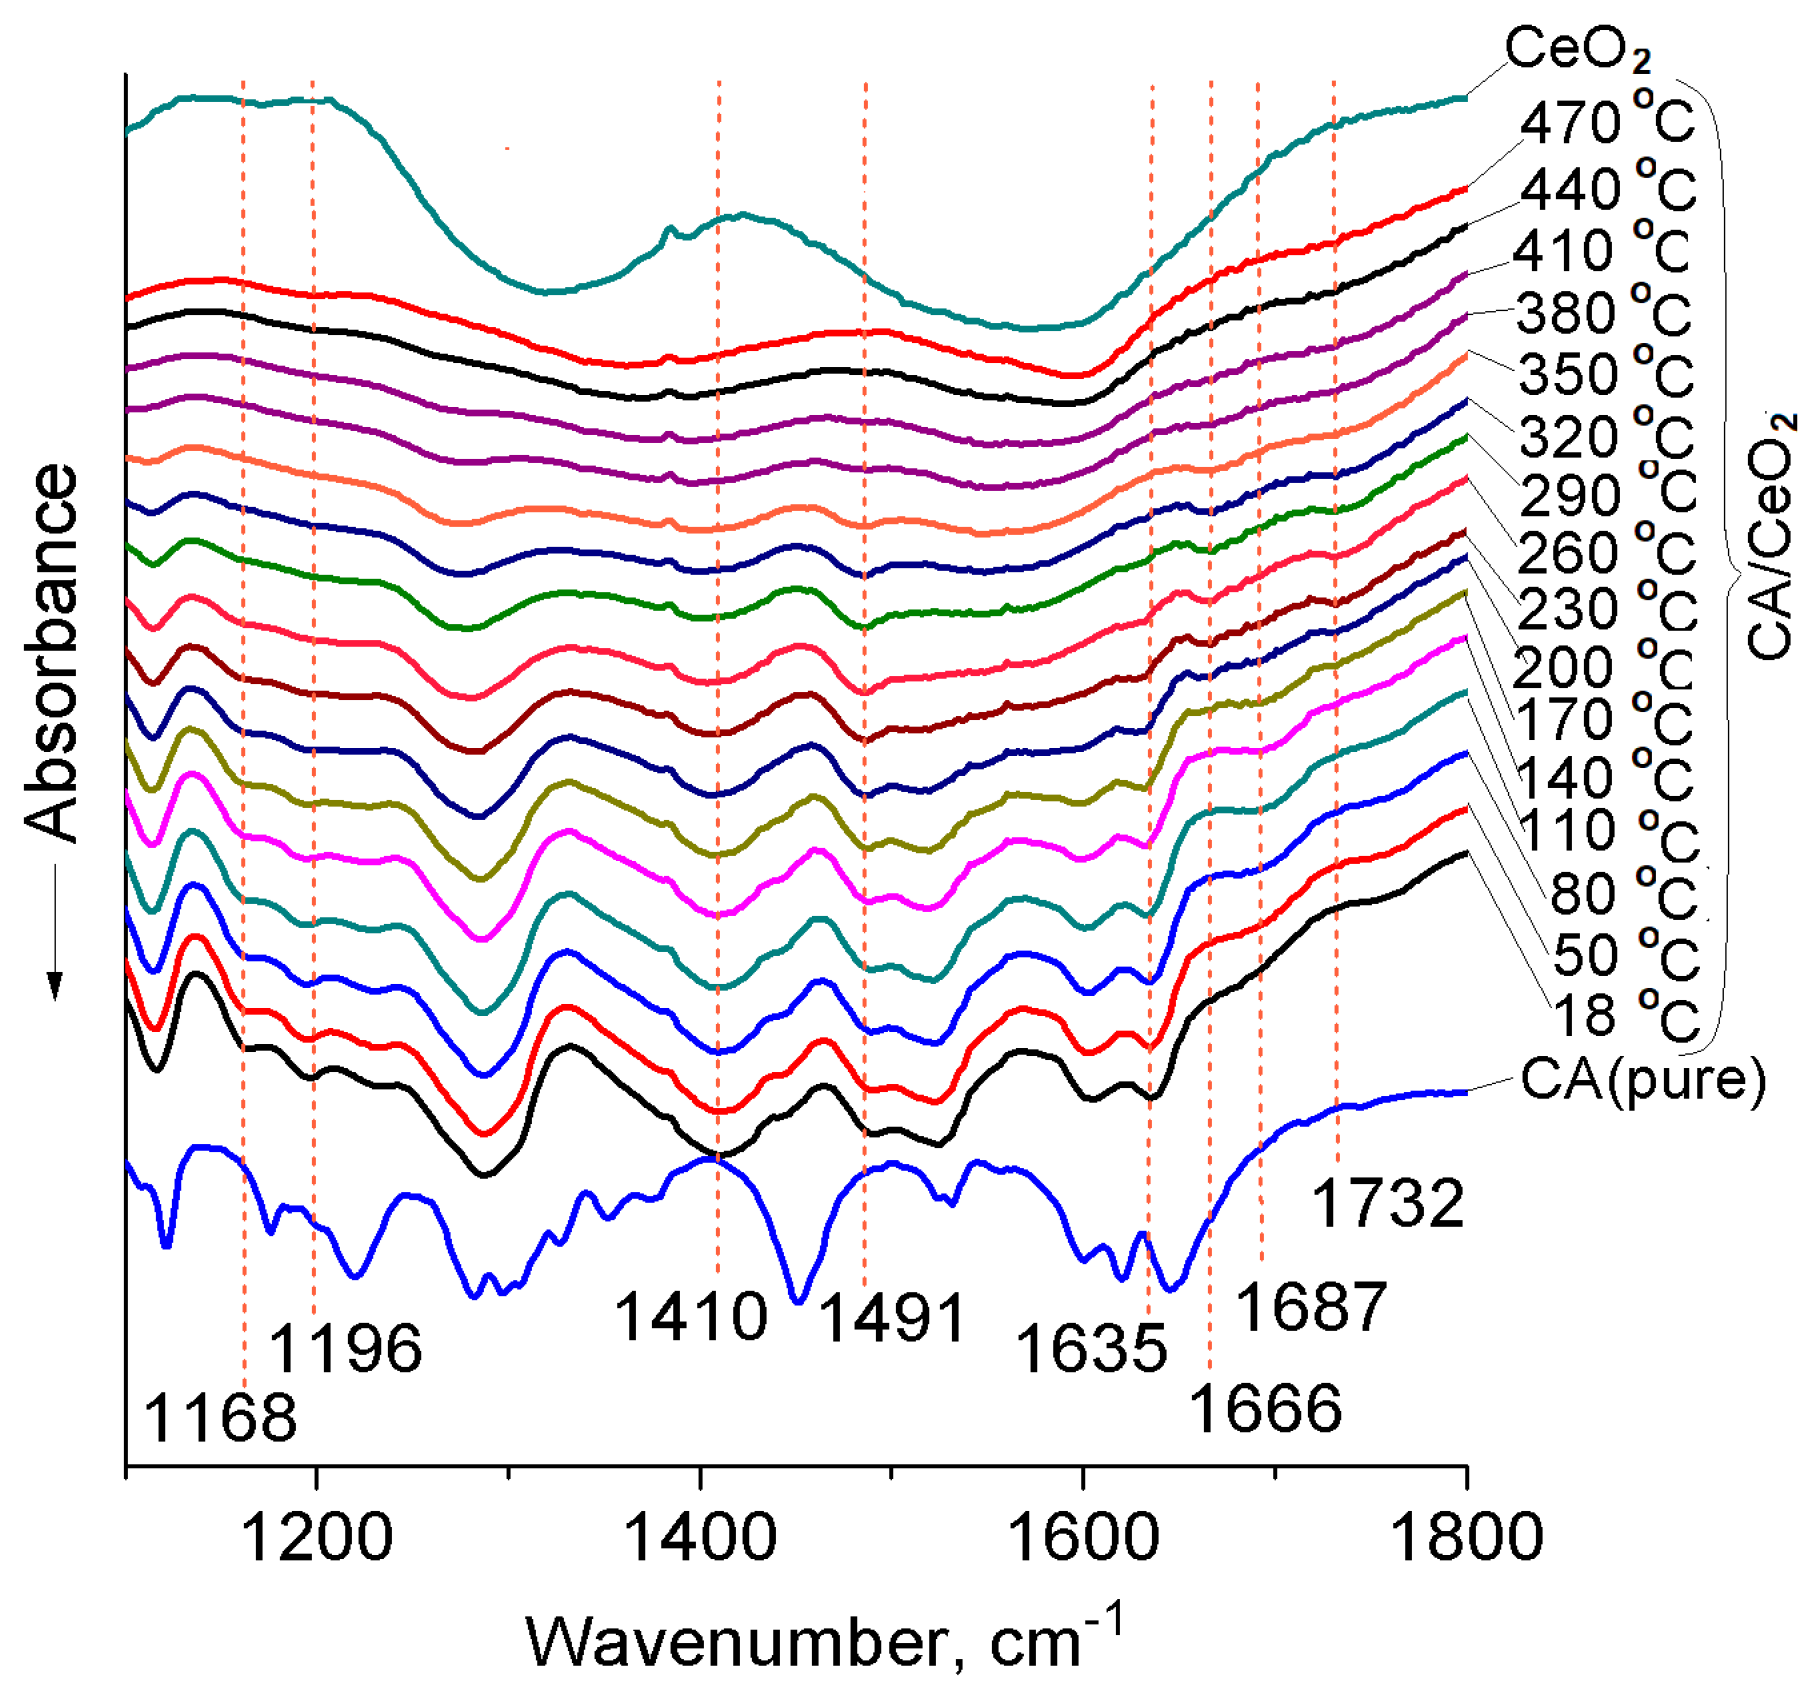
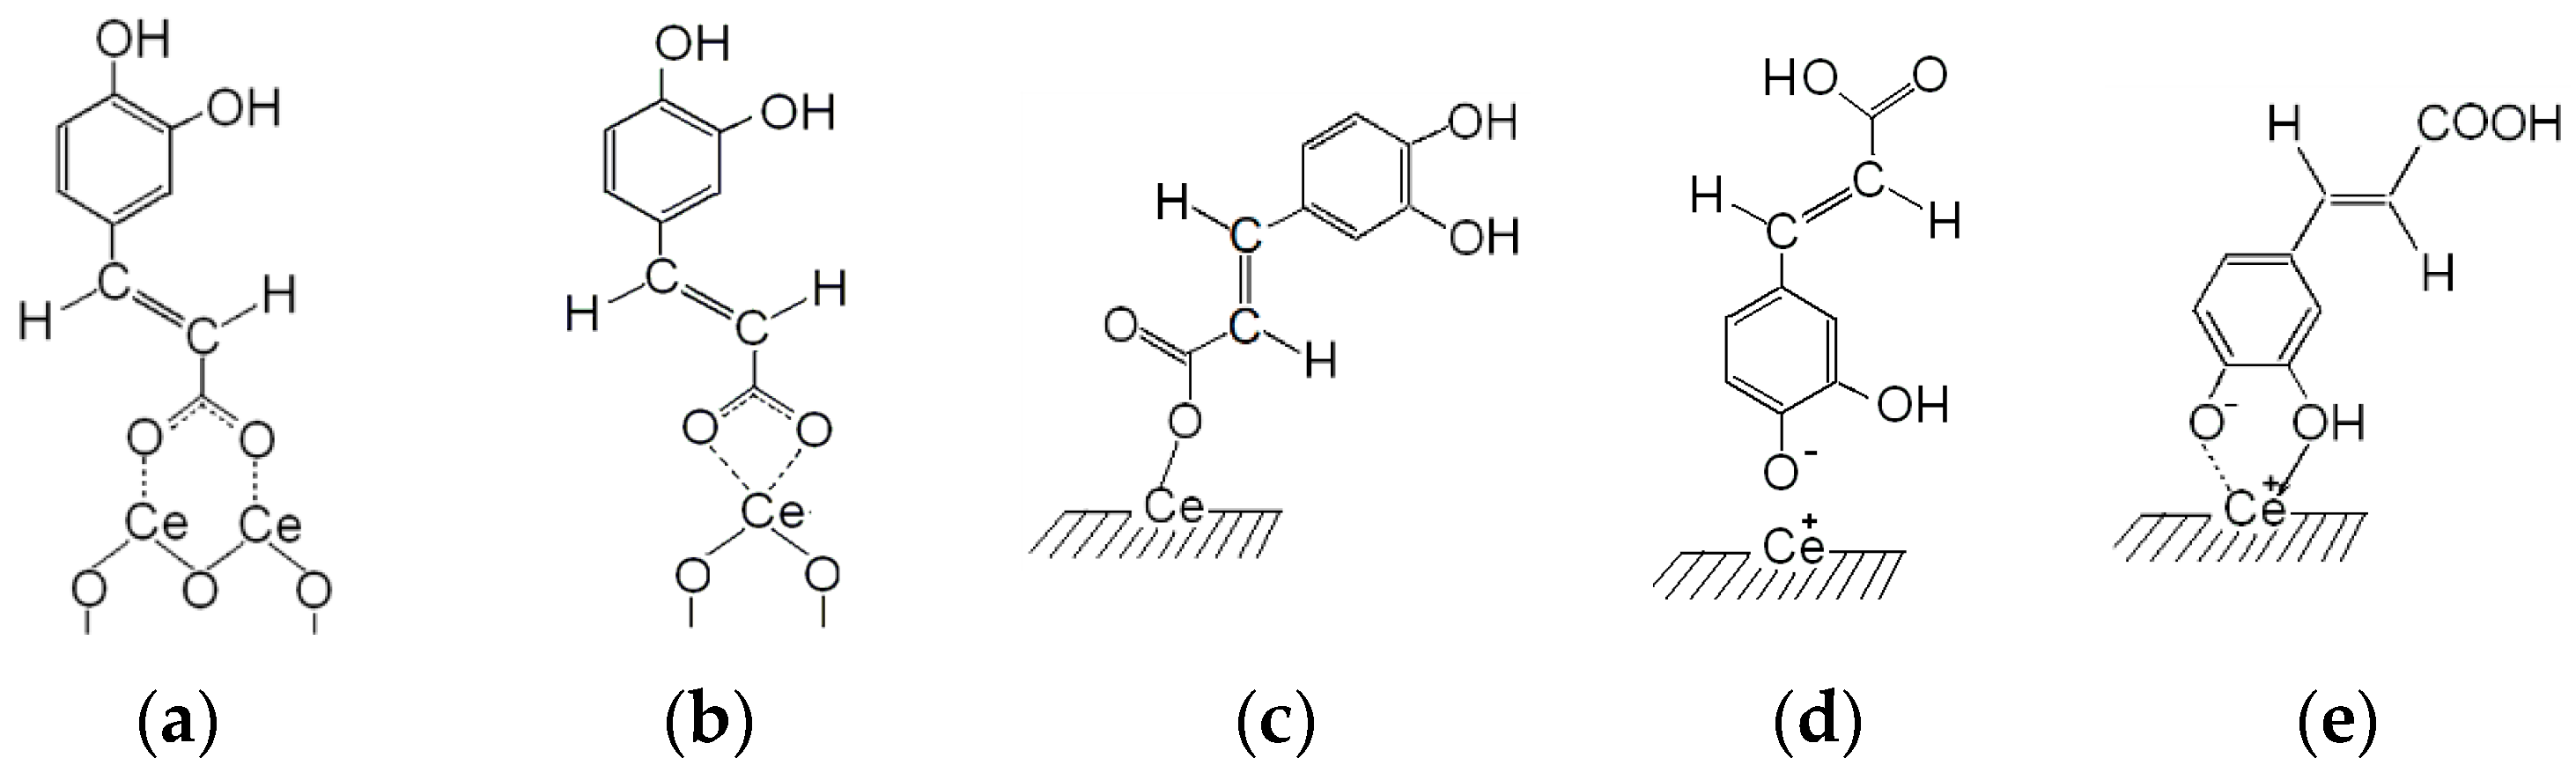
3.1. Fourier Transform–Infrared (FT–IR) Spectroscopy of Caffeic Acid (CA) Surface Complexes

The IR-spectra of the samples studied are shown in Figure 1. It is evident (Figure 1, Table 1), that the absorption at 1645 cm−1 disappears for samples of CA/CeO2 with a lower concentration of CA, while this band appears at lower frequencies (1645–1632 cm−1). Literature data on the assignment of the absorption at 1645 cm−1 for CA [39,41,42,43,44] differ. It was attributed [43] to the stretching vibrations of the double bonds C=C. However, most researchers attribute this band to νC=O [39,41,42,44].
On the example of cinnamic and p-coumaric acids, for which νC=C is observed at ~1630 cm−1 [45,46] and 1628 cm−1 [47] respectively, it can be seen that the conjugation with aromatic substituents causes the shift of νC=C towards lower frequencies. Obviously, the presence of an ortho-dihydroxyl group in the molecule of the CA should lead to an even greater shift νC=C towards lower frequencies. In addition, the conjugation between p-electron systems of double bonds is one example of mesomeric effect [48]. In particular, the conjugation of the double carbonyl bond from the bonding C=C leads to a reduction of both frequencies, which is explained by the formation of a resonance hybrids: >C=C(H)-C=O↔>C+-C(H)=C-O. Reducing the multiplicity of the carbonyl group leads to a decrease in the frequency C=O, and an increase in the polarity of the bond C=C contributes to the increase of intensity [48]. Therefore, the assignment of adsorptions at 1645 cm−1 to νC=O stretching vibrations of the dimer of CA is more plausible.
An additional confirmation of the attribution of this band to νC=O is its disappearance for low concentrations (0.1 mmol/g) of CA on the surface due to the formation of surface carboxylates, which are clearly identified due to the presence of the νasCOO band at about 1489 cm−1 already at the lowest concentrations on the surface (0.1 mmol/g).
Thus, the disappearance of the vibrations at 1645 cm−1 (νC=O) is due to the involvement of the carboxyl group in bonding to the surface of CeO2. This band shifts and appears in the region 1630–1640 cm−1 at higher loading of CA, and may belong to the vibrations corresponding to νC=O of acid molecules that form weakly monodentate bonded carboxylate complexes on the surface of CeO2.
On the other hand, in some studies [48,49], this absorption at 1635–1638 cm−1 is attributed to the vibrations of C=C in the spectra of ferulic and p-coumaric acids that form carboxylate complexes with metals. But such types of attribution cannot explain the disappearance of the vibrations at 1645 cm−1 in the cause of carboxylates formation, and the band of νC=C should exist in the spectra. And indeed, at a concentration of 0.6 mmol/g, there are two bands at 1620 and 1638 cm−1, which can be clearly attributed to νC=C and νC=O vibrations, respectively.
It can be seen that in the spectra of CA/CeO2 new absorption bands appear in the region 1410–1417 cm−1 and about 1489 and 1520 cm−1, which, in our opinion, can be related to νsCOO and νasCOO [45,46], respectively (Table 1). At the same time the band of δOH for the carboxyl group, which is observed for pure acid at 903 cm−1 [39,45], disappears (Figure 1b). The given data indicate the formation of carboxylate complexes of CA on the surface of cerium dioxide.
In addition, some semi-quantitative estimates can be made of the number of basic active sites on the surface of a nanoceria. Based on the IR data that the band at 901 cm−1 appears only starting from the coating of 0.9 mmol/g, acid dimers are also fixed only starting from the same concentrations, it can be argued that there are about ≤0.6 mmol/g or ≤8.45 µmol/m2 of basic active sites.
The interaction between the metal atom and the carboxyl group can be attributed to four types: bidentate chelate or bidentate bridge coordination, monodentate coordination and ionic interaction [50,51]. For bidentate chelate structures the difference between νasCOO and νsCOO (Δ=νasCOO − νsCOO) is less than 110 cm−1, for bidentate bridges structures Δ ≈ 140–190 cm−1, while monodentate structures and non-dissociated acids are characterized by the highest values of Δ (Δ = νC=O–νC-O ~200–320 cm−1) [51].
Thus, on the surface of cerium dioxide two types of bidentate carboxylate complexes can be distinguished: bidentate chelate (Δ = 1489–1417 cm−1 = 72 cm−1) and bidentate bridge (Δ = 1520–1410 cm−1 = 110 cm−1) (Scheme 1a,b). At the same time, the presence of monodentate carboxylate complexes is not excluded (Δ = 1630–1398 cm−1 = 230 cm−1) (Scheme 1c).
At higher concentrations of CA (≥0.9 mmol/g), acid associates appear on the surface of CeO2, resulting in vibrations of C=O (1645 cm−1) again in the spectra of these samples. Absorption in the region of 2500–2700 cm−1 in the spectra of samples of CA/CeO2 (0.9–1.2 mmol/g) shows the presence of carboxylic acid associates [46] (Figure 1c).
From Figure 1 it is evident, that all the spectra of CA/CeO2 contain new bands of medium intensity at ~1200, ~1168 cm−1, while νCO (1219 cm−1) [41,42,52] and βOH (1176 см–1 [52,53], 1300–1400 см–1 [52,54,55]) are shown only for high concentrations of CA (0.9 and 1.2 mmol/g). For a sample with a concentration of CA 0.6 mmol/g, an additional maximum at 1230 cm−1 appears. It should be added that in the region 1300–1400 cm−1 vibrations of C-O-H as a carboxyl group and a phenolic substituent may be observed [41,42,45,46,54]. Therefore, the overlap of these bands in the mentioned part of the spectrum is very likely.
Similar changes in the IR spectra are observed at the adsorption of phenol on γ-Al2O3 and the formation of phenolates on this surface [52,53]. In particular, the infrared spectra of phenol indicate there is a broad band of absorption at 1255–1285 cm−1 with two maxima at 1255 and 1284 cm−1, whereas βOH bands (1176 and 1310 cm−1) disappeared [52]. At the same time, it is known [54] that the formation of a hydrogen bond can also lead to a shift in the absorption bands of C-O-H for phenols in the high-frequency region.
Thus, the character of the obtained spectra can indicate the presence on the surface of CeO2 as chemisorbed complexes of CA, which are formed as a result of the interaction of its phenol hydroxyl group with the surface of oxide (Scheme 1d,e), and weak hydrogen-bound complexes. The possibility of such interactions of CA with surfaces of SiO2 and Ag was shown in [37,56], respectively. In this case it cannot be excluded that the hydrogen bond can be formed by the participation of both phenol hydroxyl groups [37].
From Figure 1 it can be seen that after the desorption, the IR spectrum of the sample (0.6 mmol/g) became very similar to the CA/CeO2 spectrum with a concentration of CA 0.3 mmol/g. Reducing the intensity of all bands is due to the removal of a part of CA from the surface. However, in the spectrum, there are signs of both carboxylate complexes and complexes that are formed with the participation of the phenolic ligand. This may indicate the strength of the formed bonds.

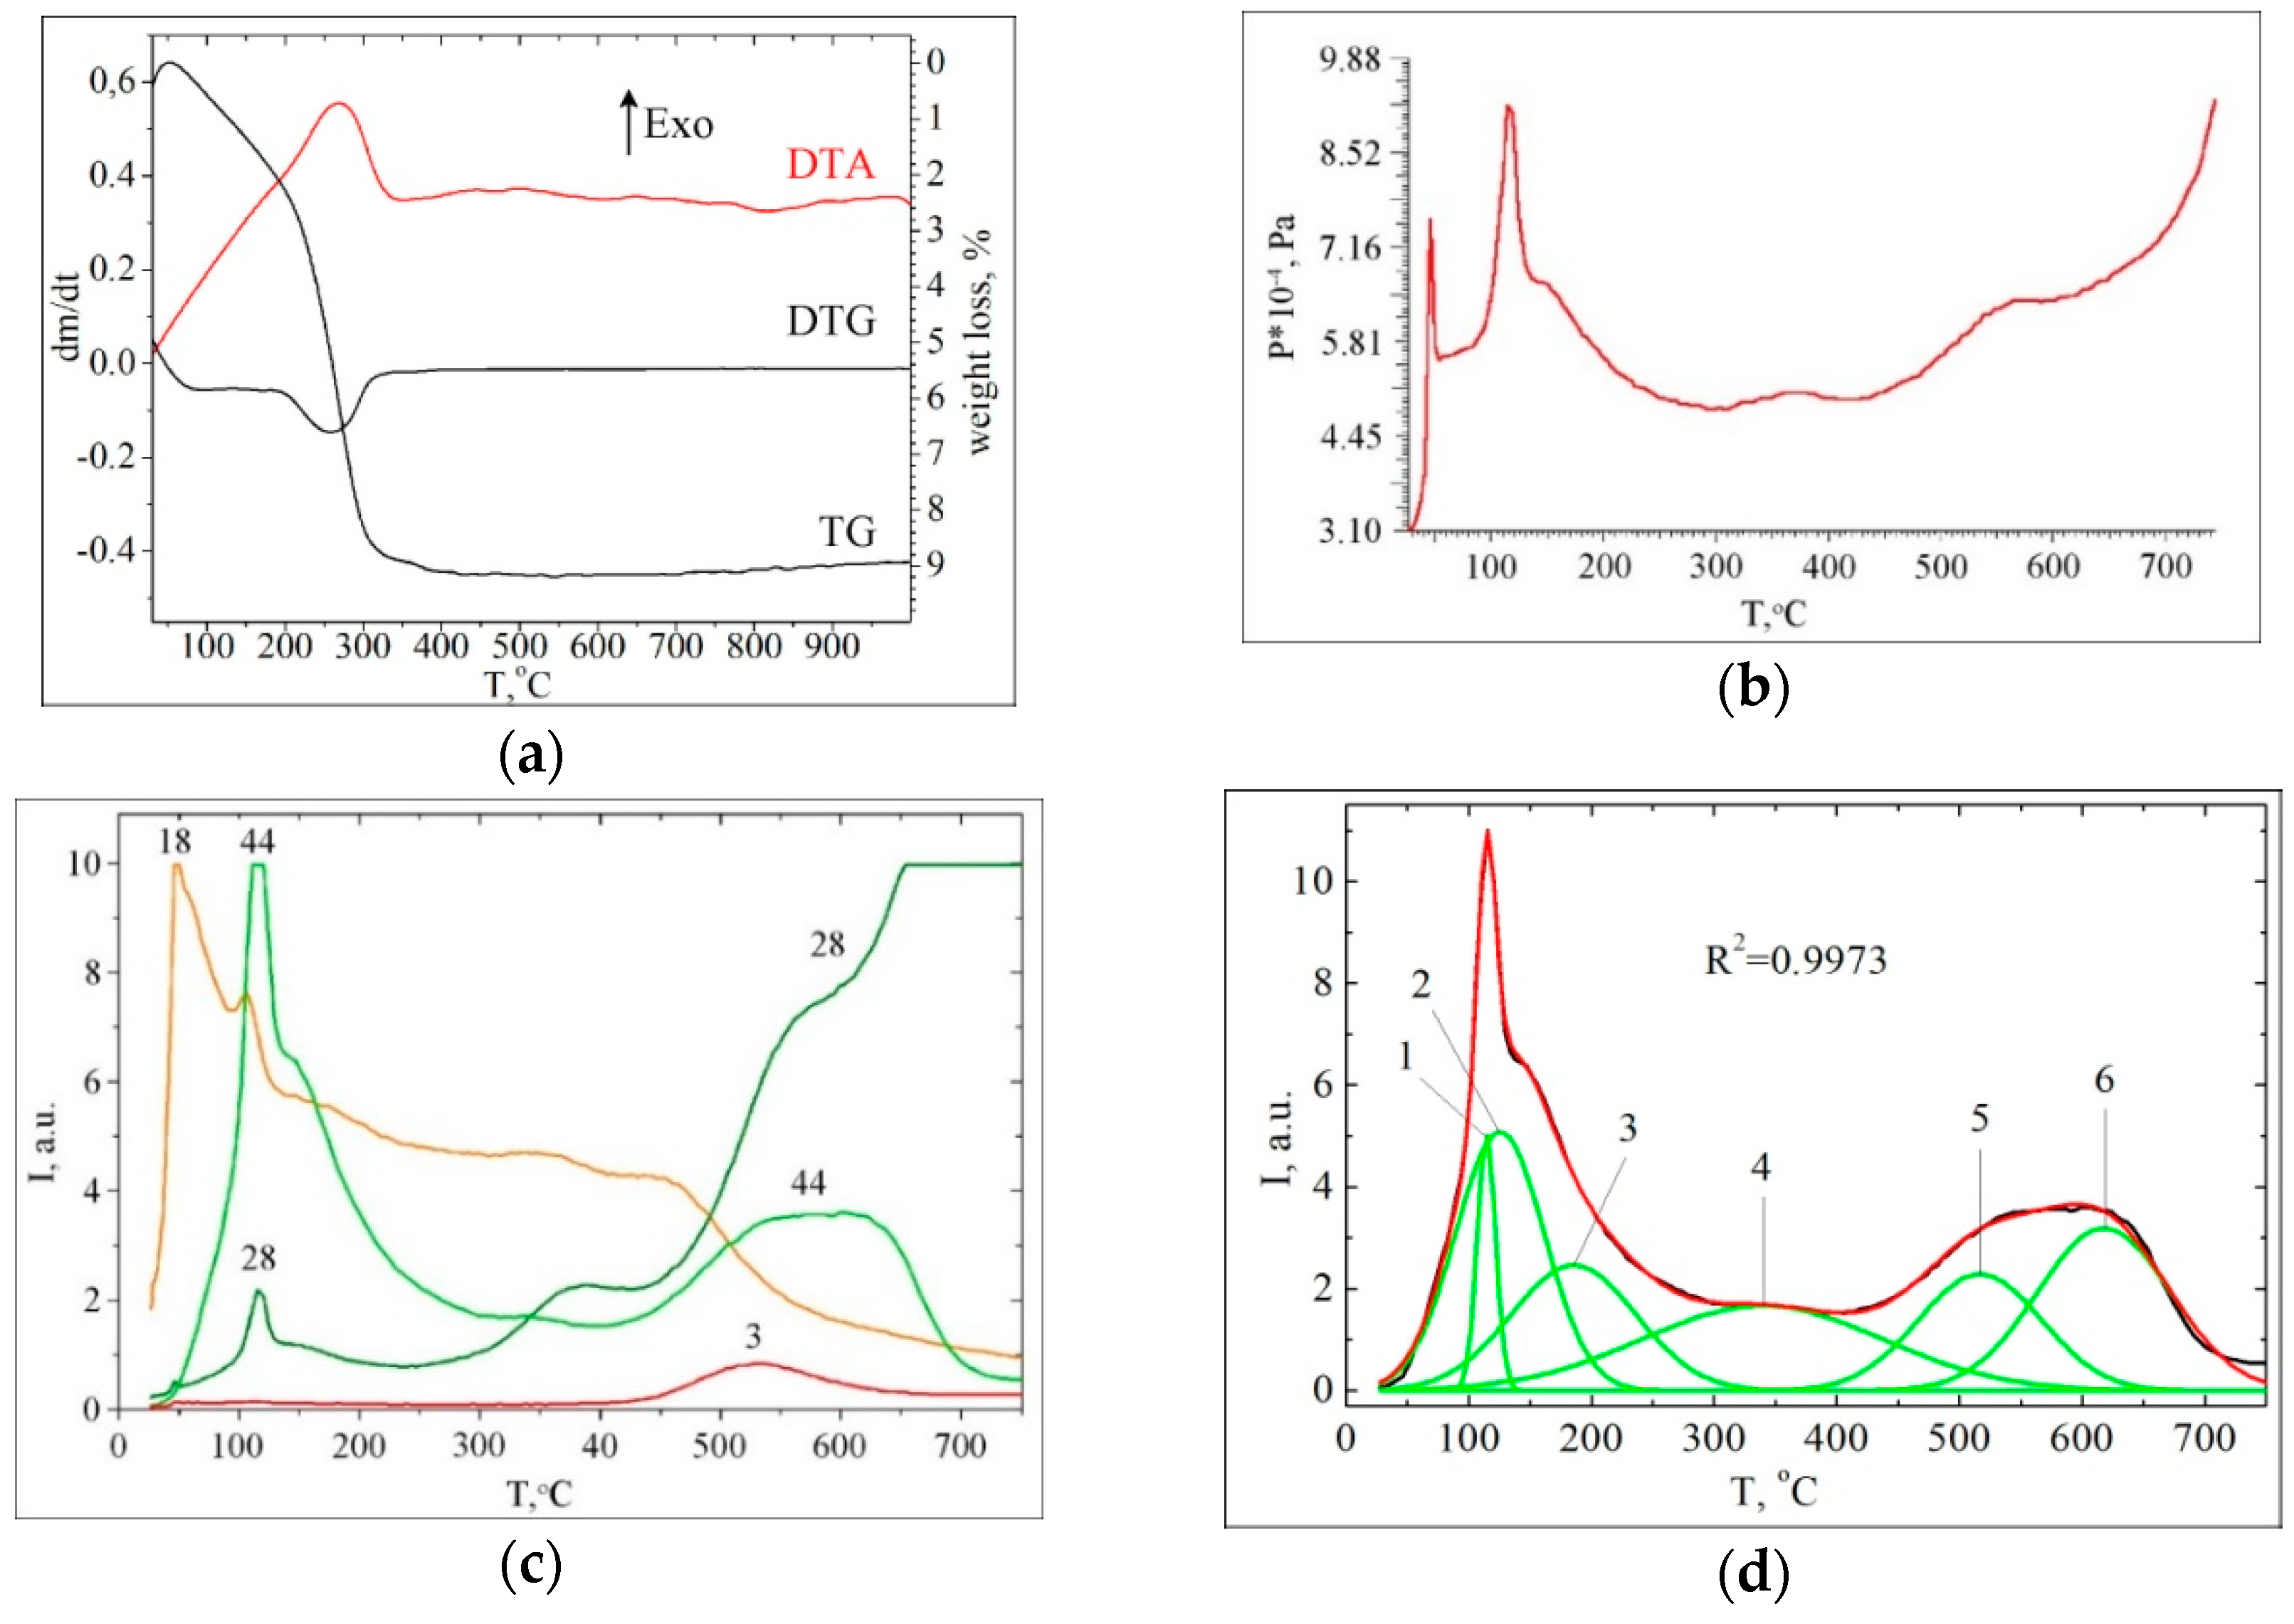
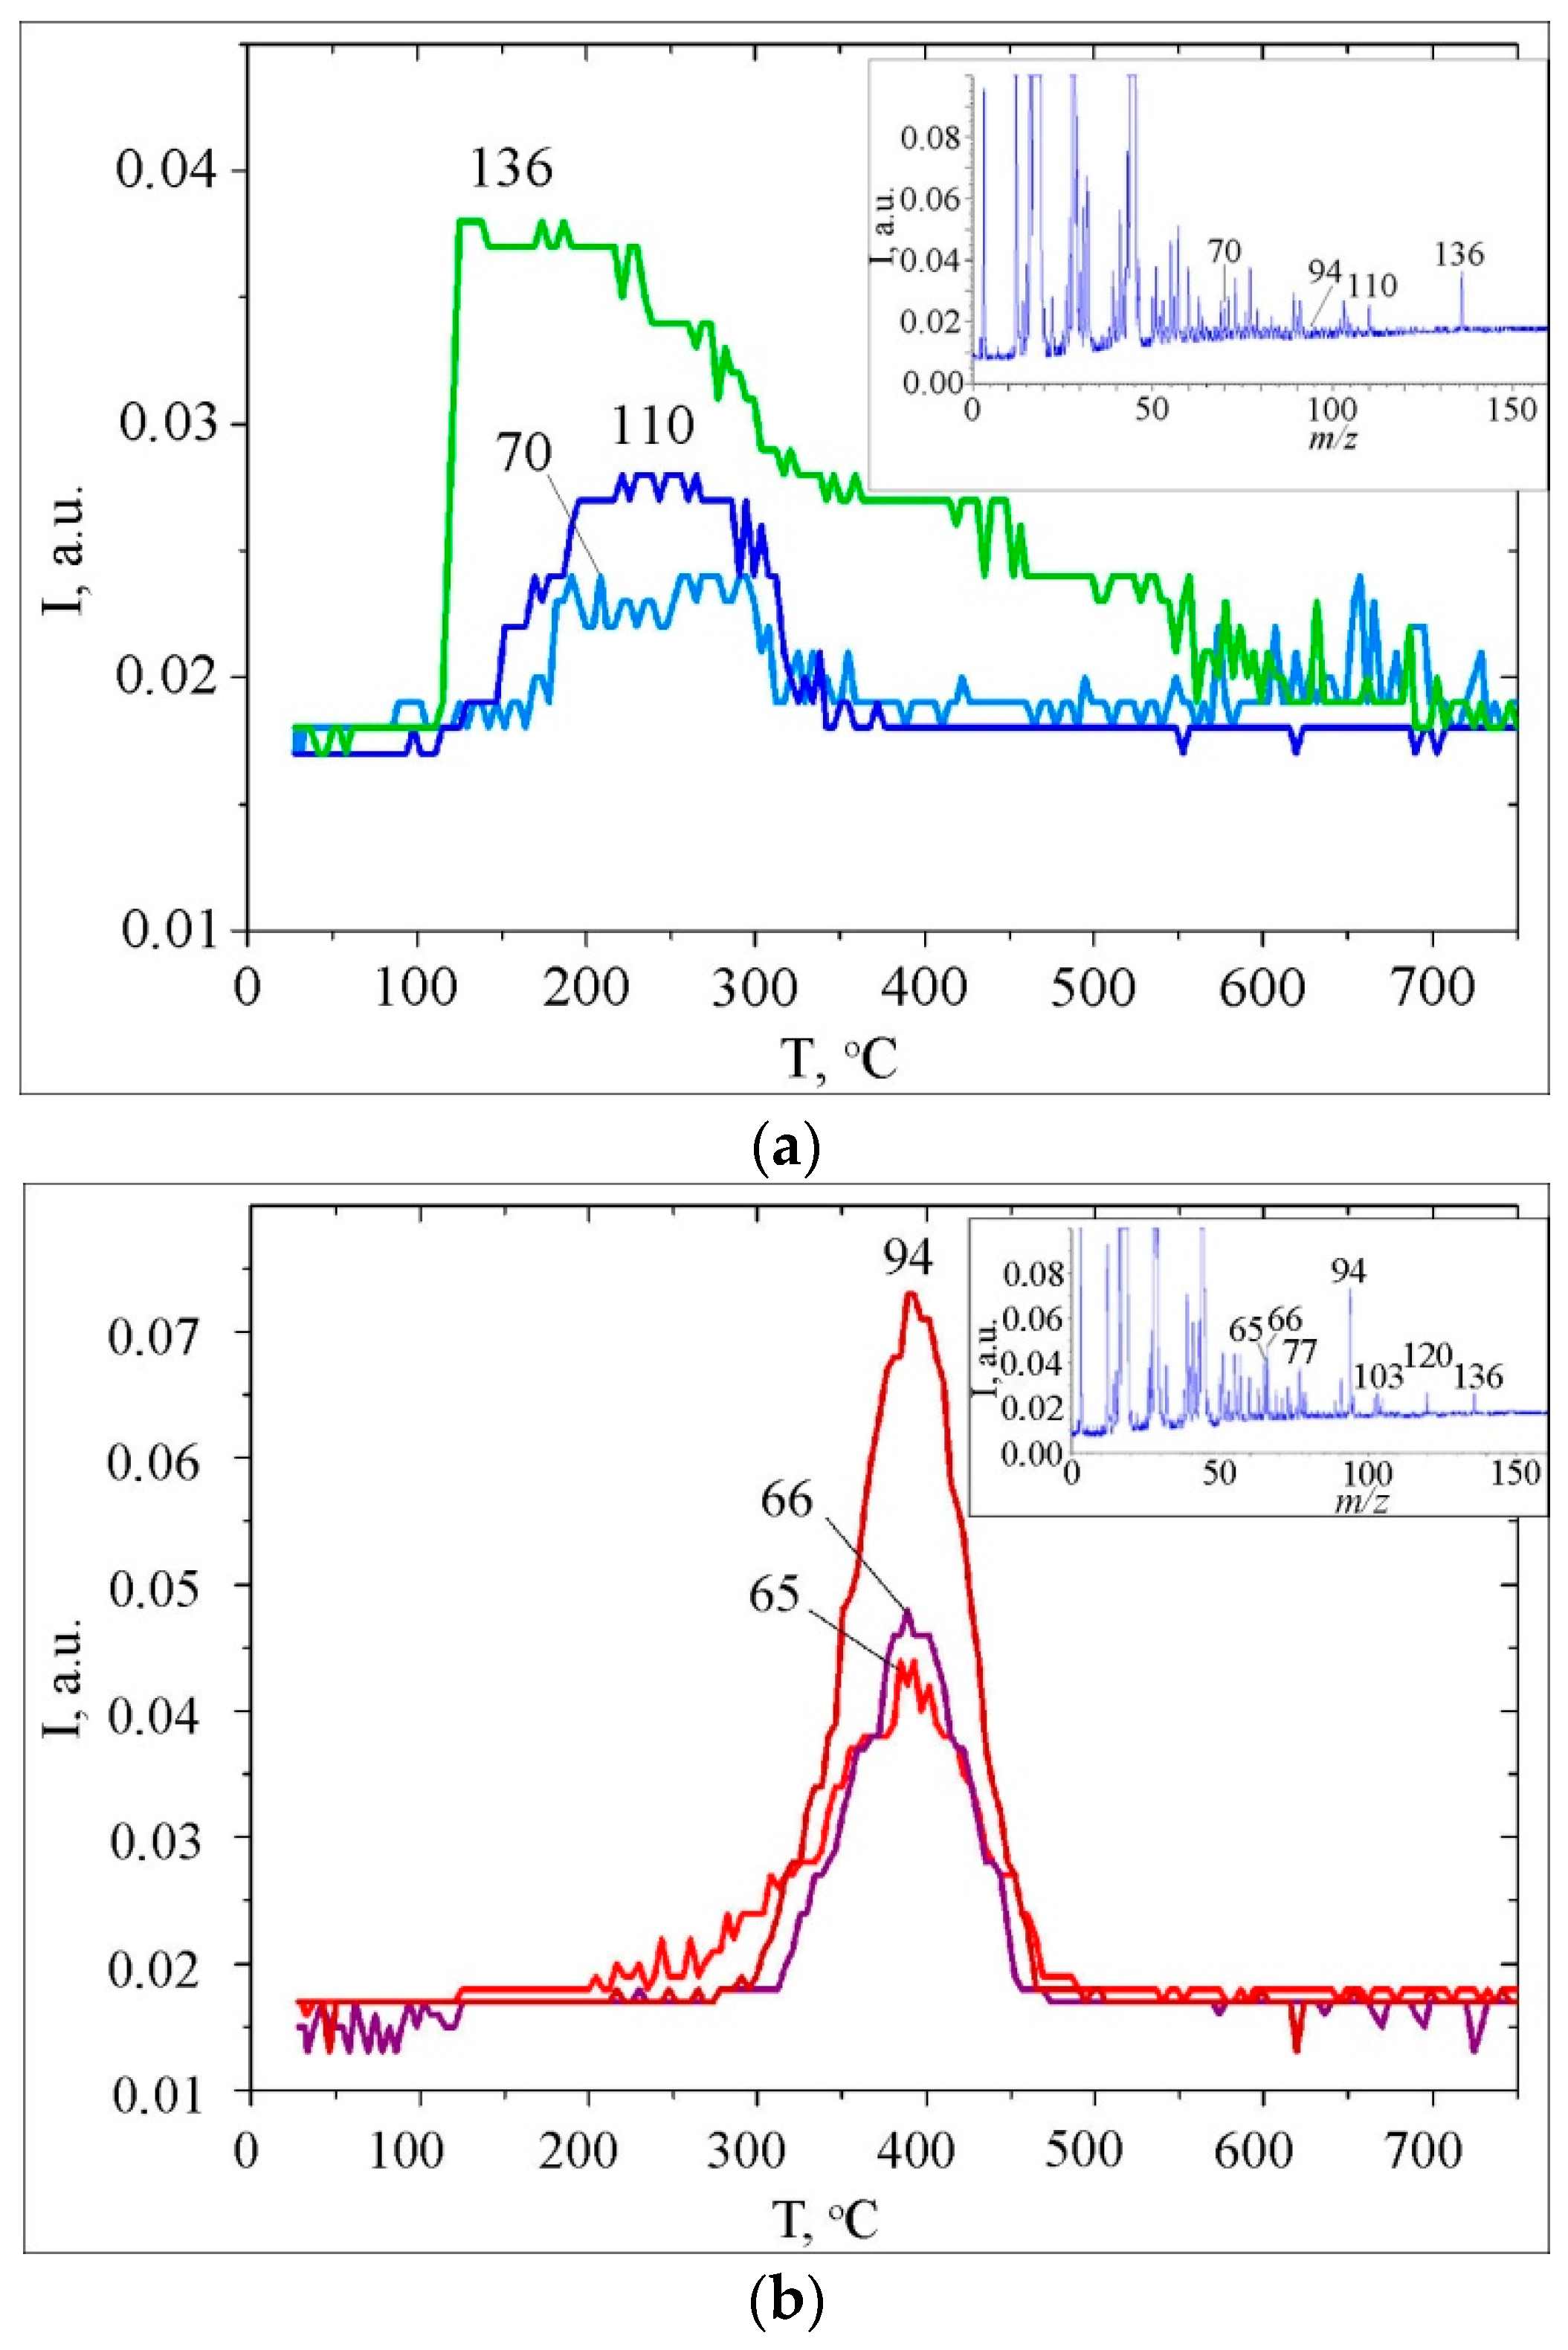
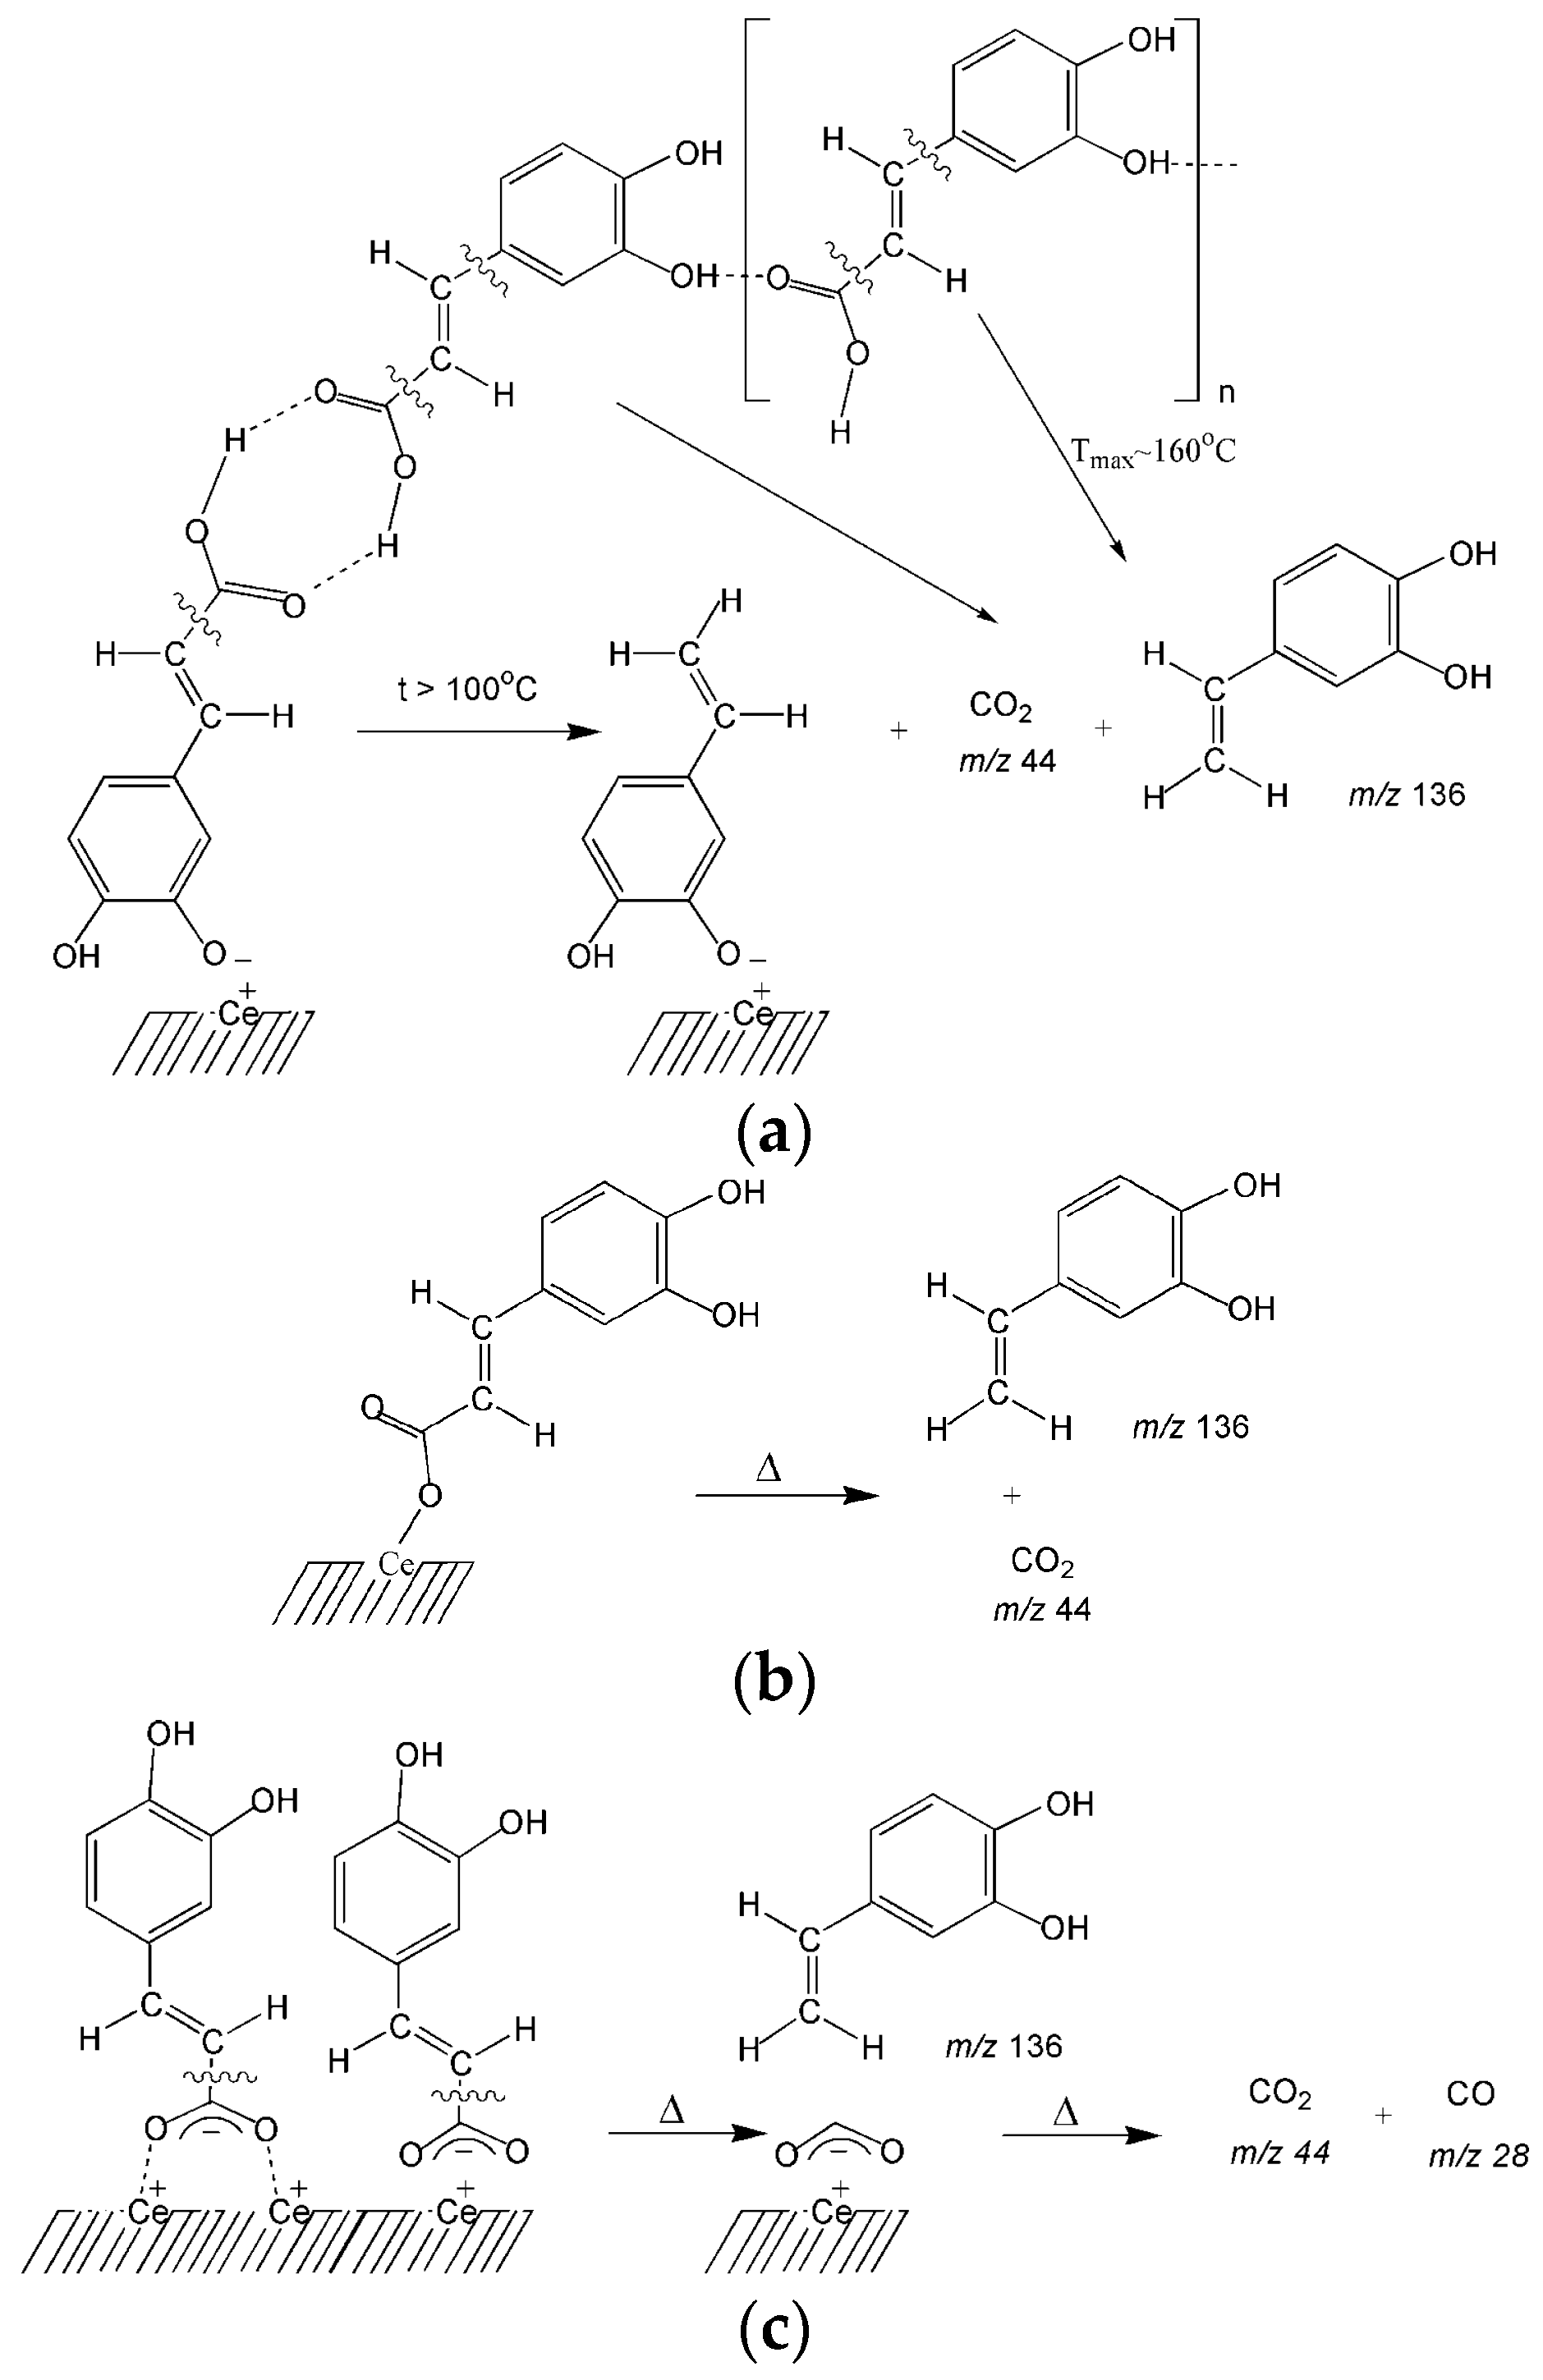
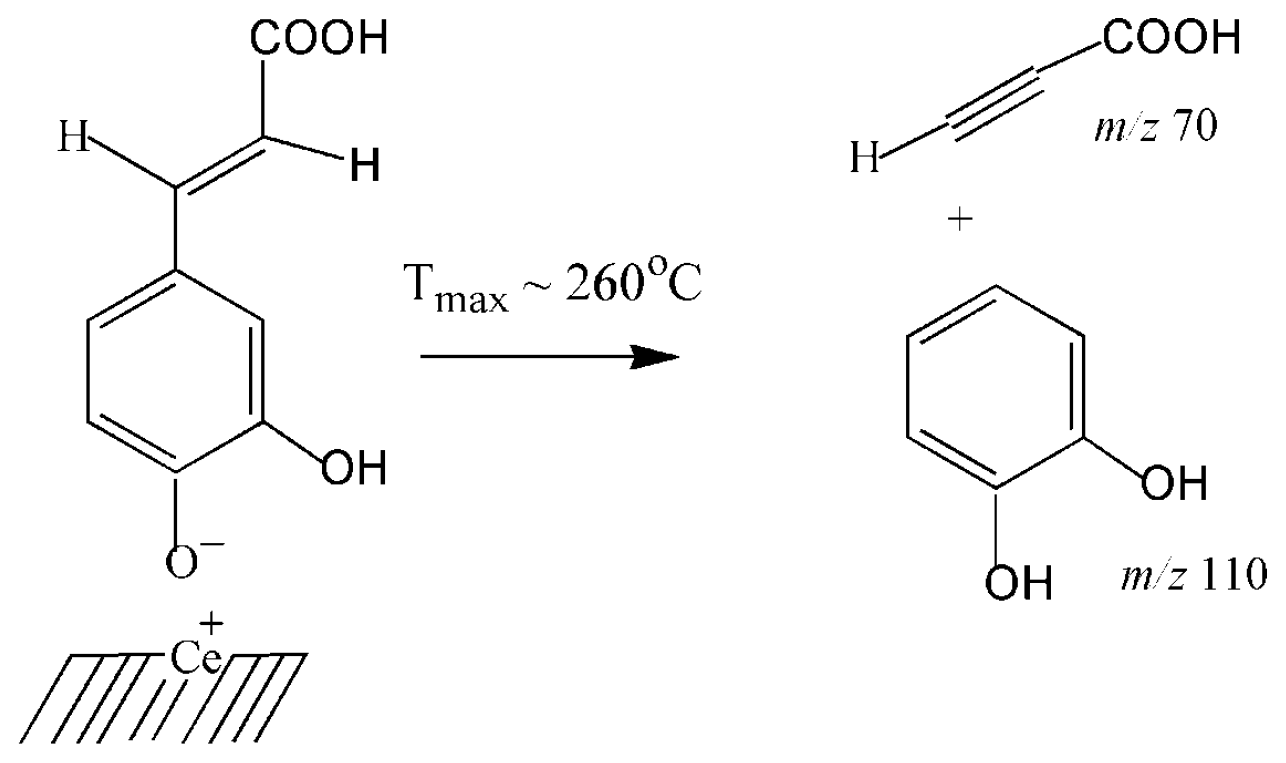
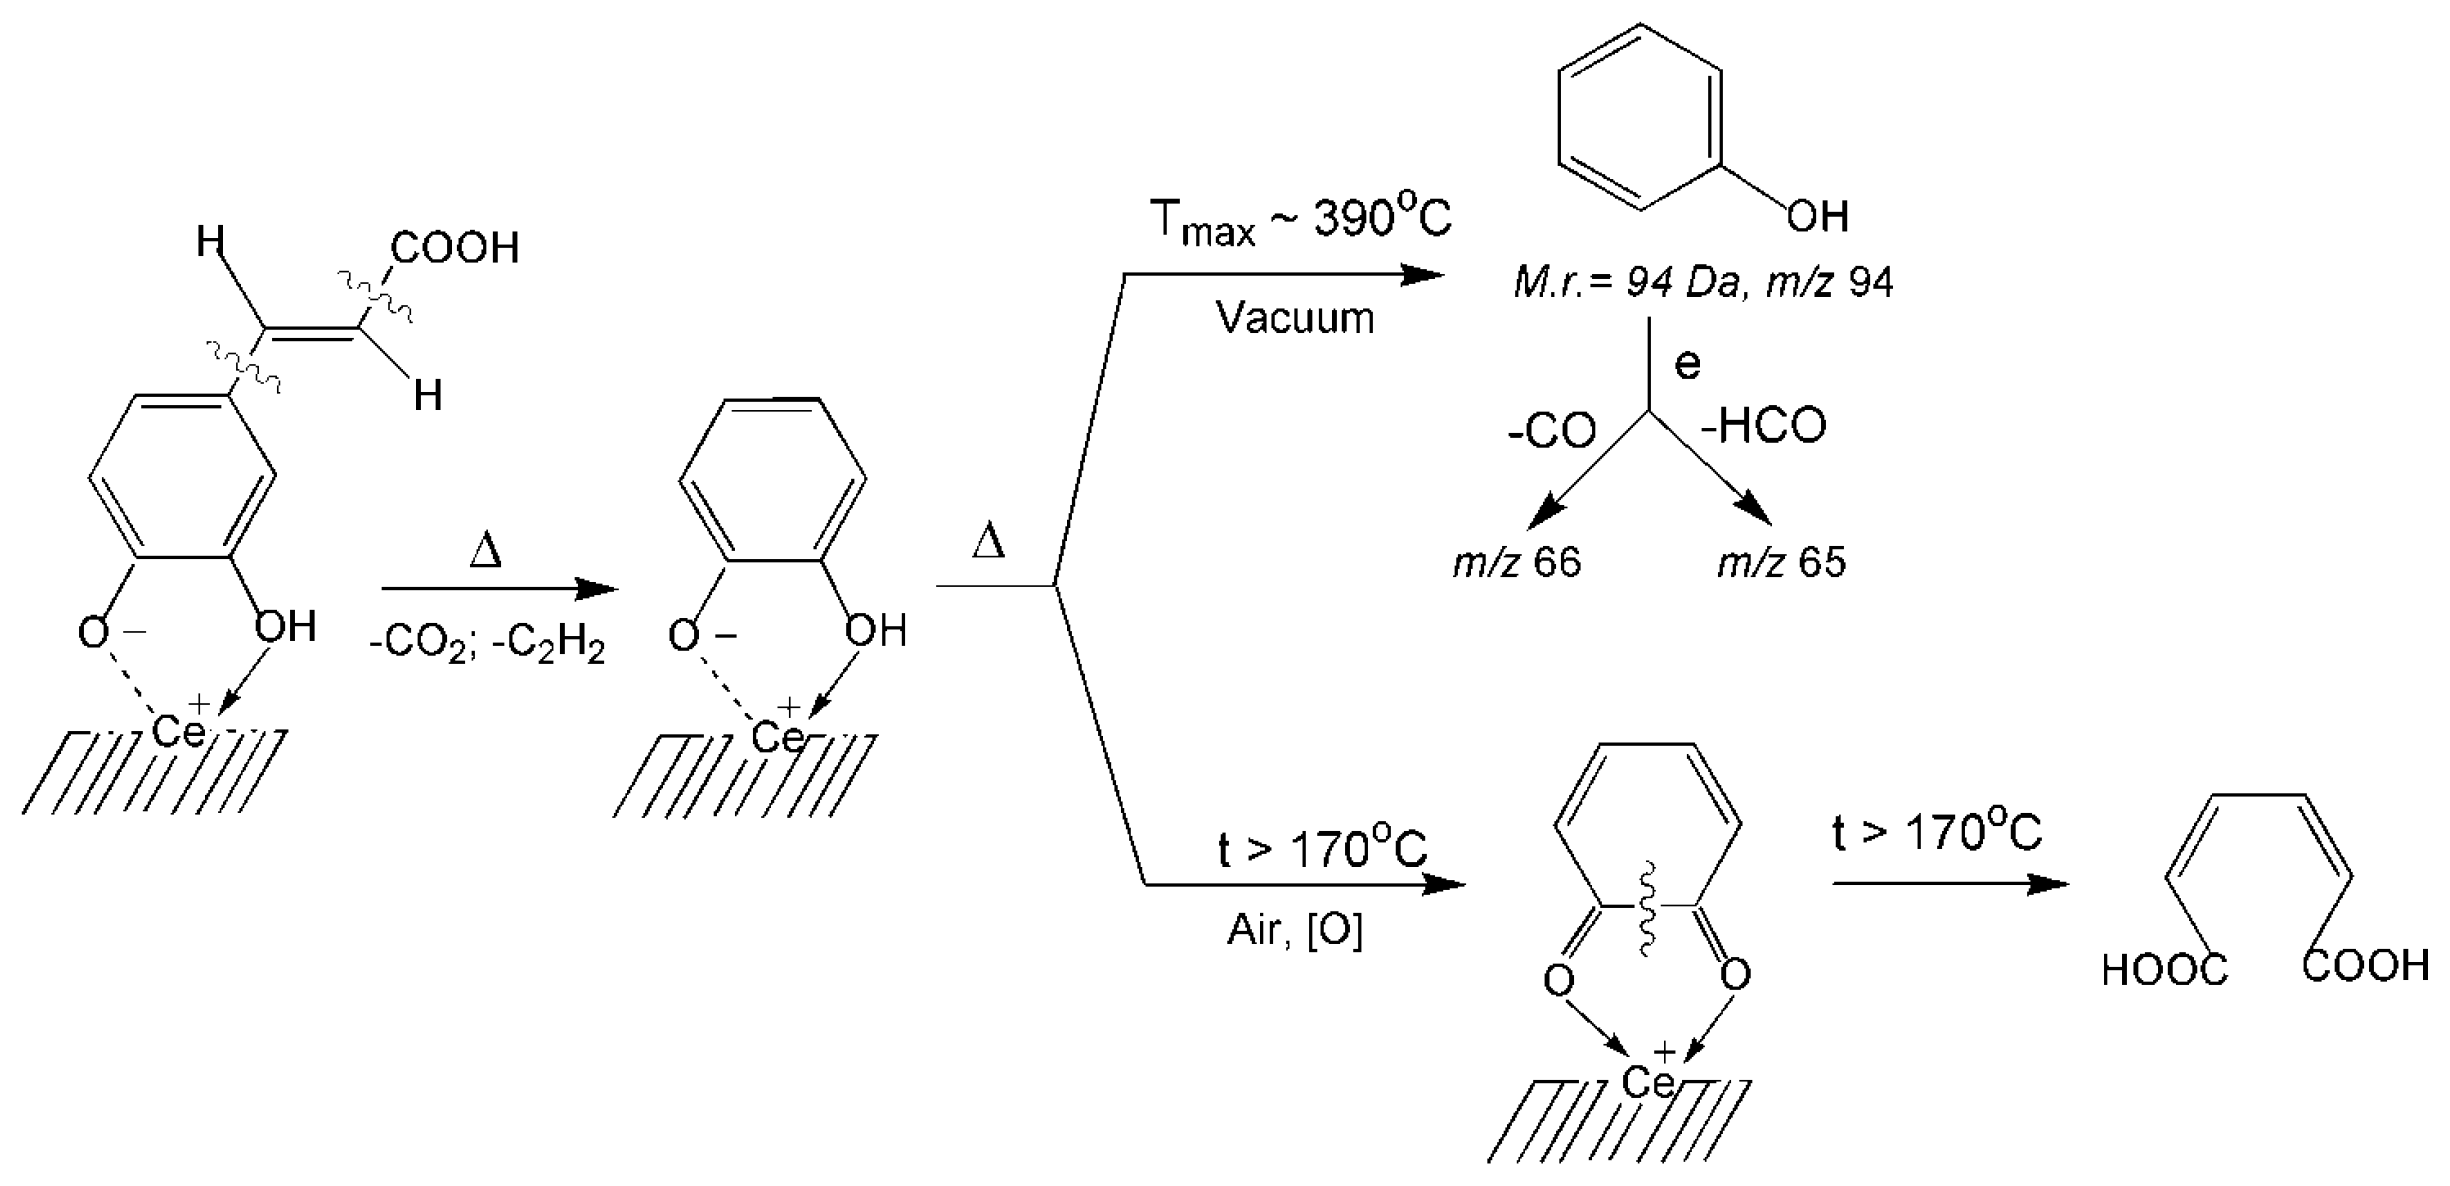
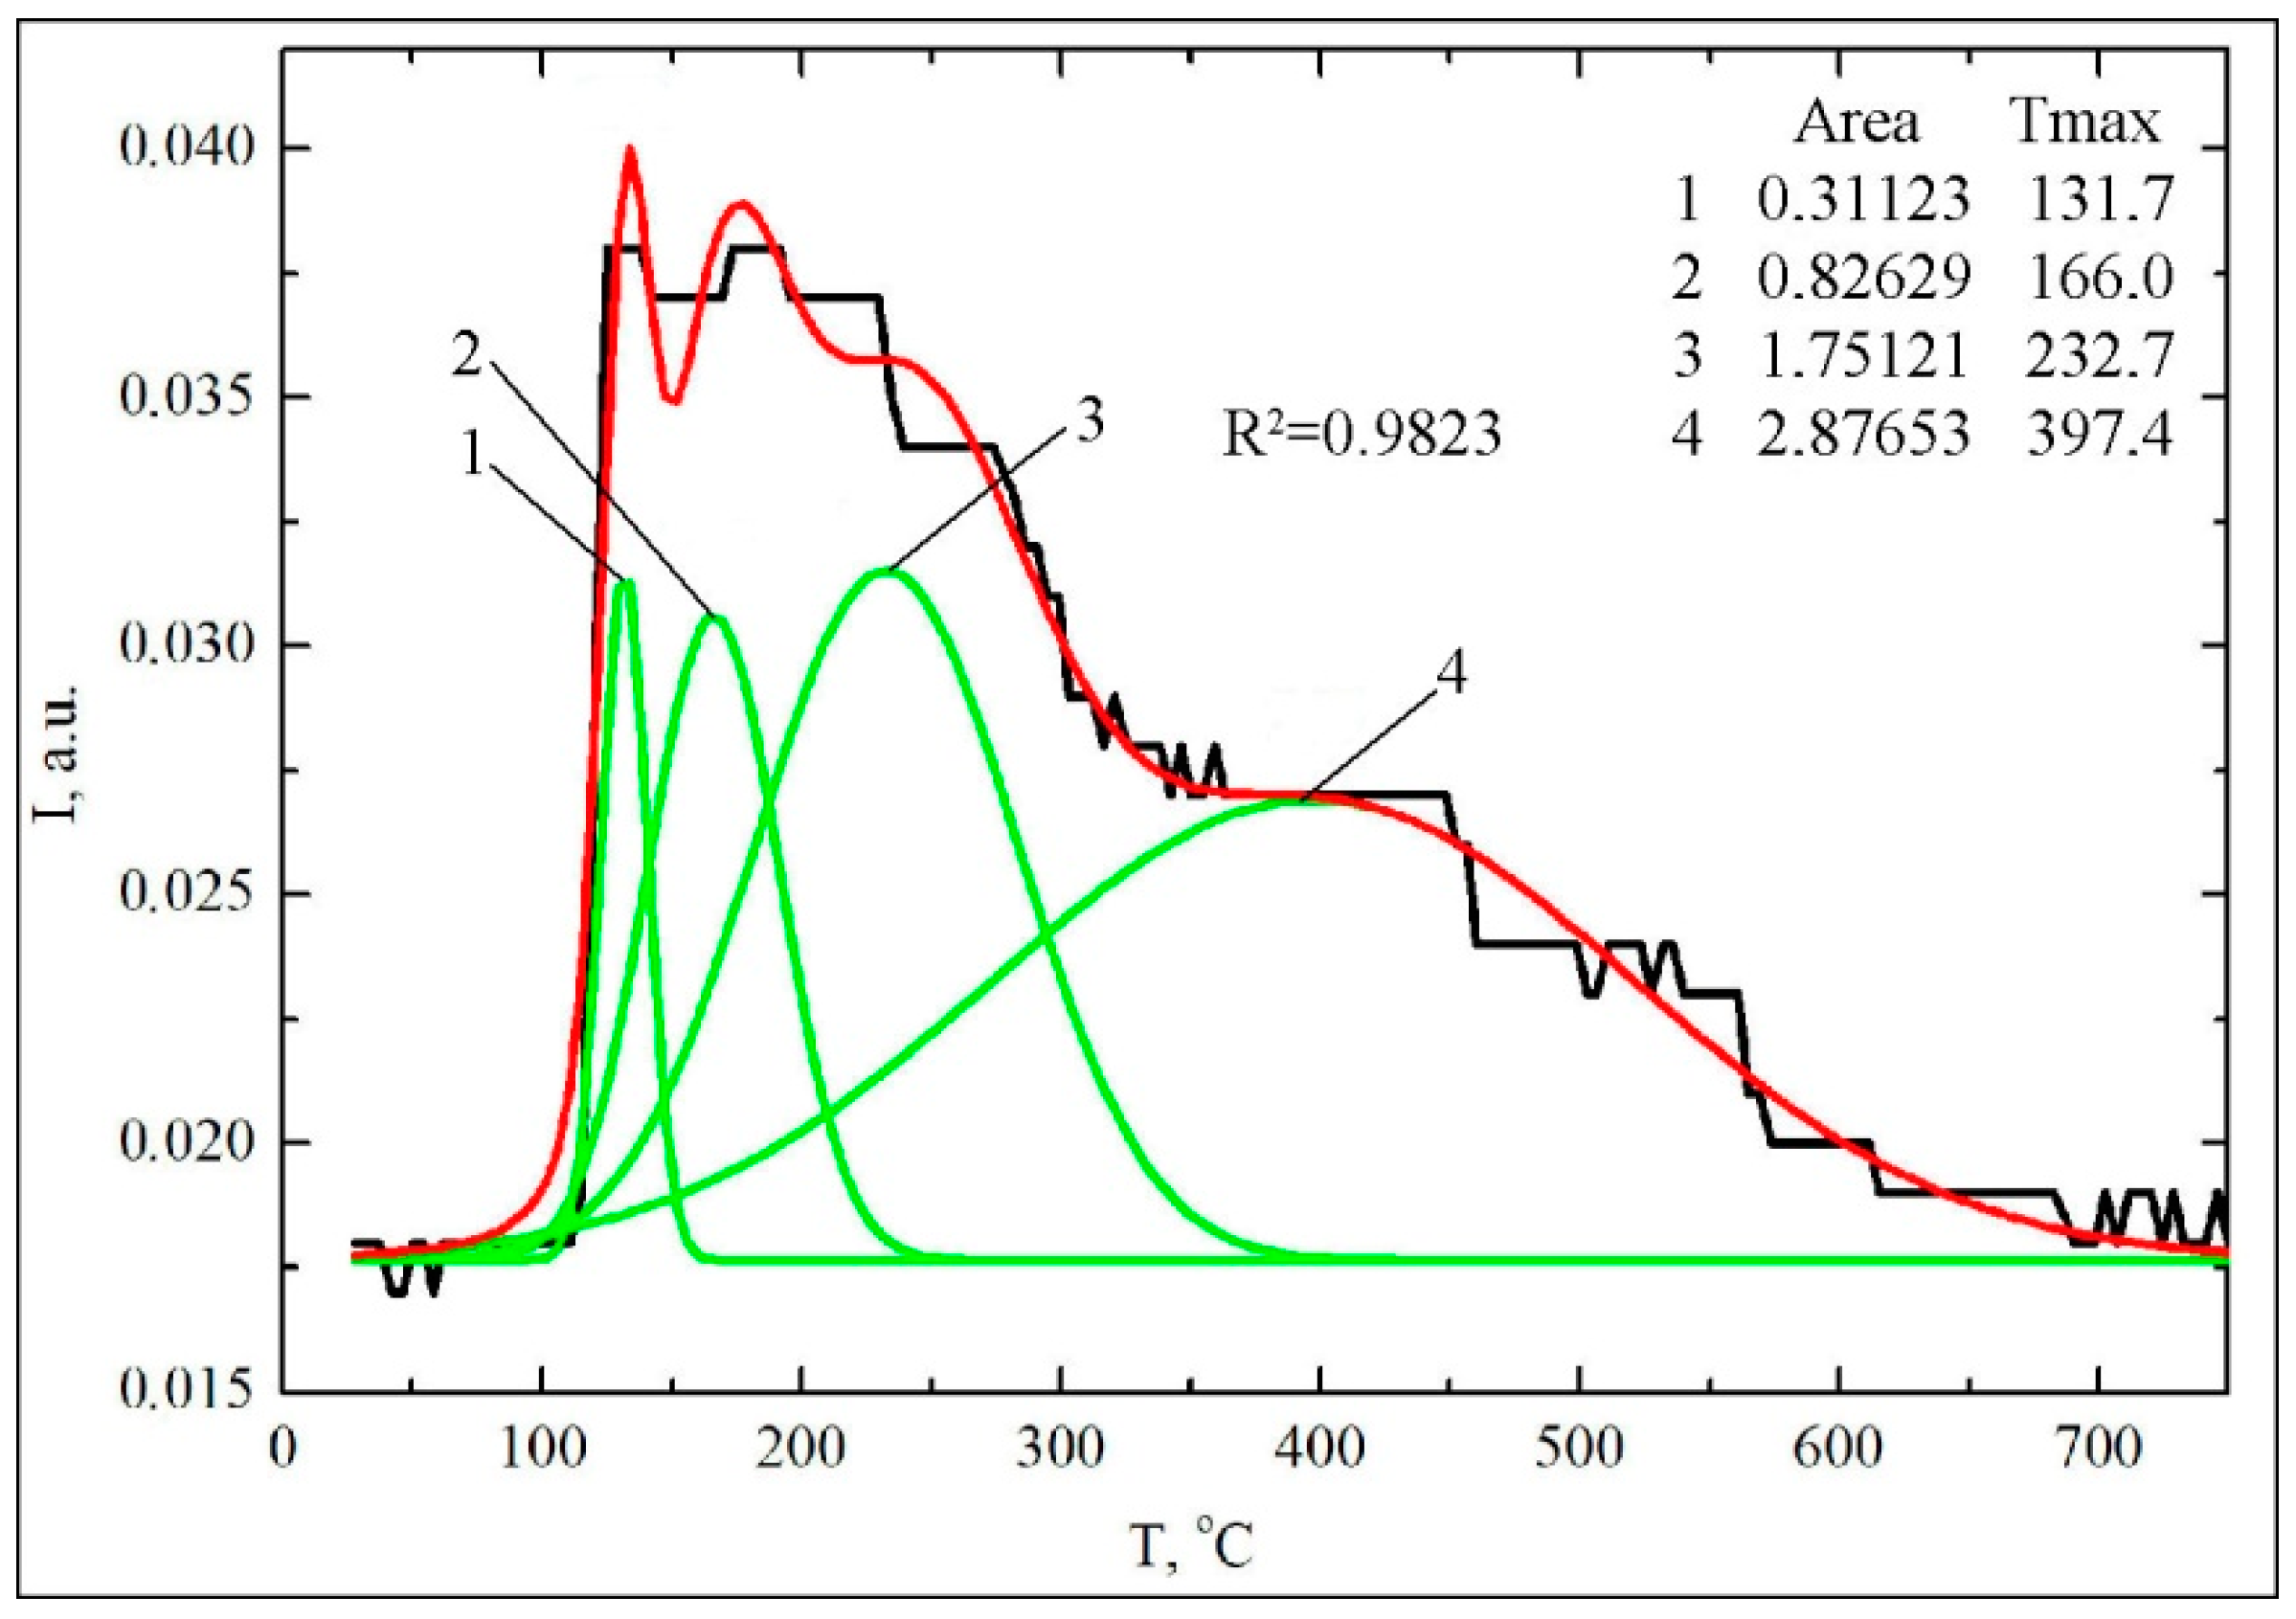
3.2. Thermal Transformations of CA on the Nanoceria Surface

The changes in the IR spectrum of CA/CeO2 (0.6 mmol/g) that occur during heating can be traced in Figure 2. The decrease in the intensity of the bands νCOO at ~1410 cm−1, and at ~1489 cm−1, which is due to the destruction of bidentate carboxylate complexes of CA on the surface of oxide (Scheme 1a,b), occurs to 470 °C. The band νC=O (1635 cm−1), referring to monodentate carboxylate complexes (Scheme 1c), disappears at a lower temperature (~320 °C). The hydrogen-bonded associates of CA which are observed in the spectra of CeO2 (Figure 2) about 1687 cm−1 in the form of a shoulder, are destroyed at a temperature of 260 °C. Absorption at 1168 cm−1, which in our opinion is a sign of the formation of complexes with the participation of an aromatic ligand, are seen in spectra up to a temperature of 320 °C. At a temperature of about 170 °C, new low-intensity bands appear at 1666 cm−1 and 1732 cm−1. Vibrations at 1666 cm−1 can indicate the formation of 1,2-quinones. The absorption bands of the carbonyl group of these molecules are at 1681 and 1661 cm−1 [57]. The first of these bands has a low intensity. It is known [57,58] that 1,2-quinone can be obtained by oxidation of pyrocatechol, and Ce+4 can serve as a catalyst for such a reaction [57].
Obviously, on the surface of CeO2, 1,2-quinones are formed during heating via the thermal transformation of CA phenolate complexes with the participation of air oxygen.
The 1732 cm−1 band, in our opinion, arises in the spectrum as a result of the conversion of quinone to muconic acid and/or to products of deeper oxidation like glyoxal acid [57,58]. Dai and al. [59], an increase in the relative intensity of the absorption band of about 1712 cm−1 in the heating process of the raw and torrefied lignin was associated with an increase in the number of unconjugated forms of C=O groups due to thermal dehydration. According to [45,54], the absorption band νC=O of α,β-unsaturated carboxylic acids is ~1720 cm−1. Then, for dimers cis,cis-muconic acid νC=O is 1680–1689 cm−1 [58,60]. Cis,cis-muconic acid can be produced via the oxidative 1,2-cleavage of catechol, a central intermediate in degradation of aromatic compounds in many aromatic-catabolizing microbes [61].
Thus, CA complexes bound to the surface of CeO2 via an aromatic ligand, when heated in the air, may be transformed into 1,2-quinone and cis,cis-muconic acid. Therefore, the absorption bands of the aromatic ring, which for CA/CeO2 (0.6 mmol/g) are at 1601, 1523, 1440 cm−1, become invisible in IR spectra above 230 °C.
TGA/DTG/DTA characterisation test results of CA/CeO2 pyrolysis are shown in Figure 3a. Thermogravimetric analysis revealed that this sample is thermally degraded in two main steps. The first step proceeds in the range from room temperature to 200 °C. The DTG profile showed the maximum weight loss rate at 260 °C for the second stage. The yields for TGA pyrolysis of CA/CeO2 sample showed that 91.3% of the CA was volatilized and 8.7% was converted to char on the surface (Table 2). Differential thermal analysis indicated that the first and second stages of the decomposition are exothermic.
Pyrolytic methods analysis is powerful instruments for using in the field of conversion of renewable biomass components. It is used successfully to studying polymeric compound [59,62,63] like lignin and their structure units like cinnamic acids [35,36,37].
From TPD and pressure measured as a function of temperature (P-T) curves analysis (Figure 3b,c) it can be seen that the thermal desorption of volatile pyrolysis products occurs in different temperature ranges. Namely, decomposition of CA occurs in five main stages: Tmax ≈ 60, 120, 160, 370, 550 °C in contrast to thermal-oxidative TGA pyrolysis in the air, for which two main stages were observed.
Analysis of the mass spectra of volatile pyrolysis products in the investigated temperature range and TPD curves of the main products of thermal transformations on the CeO2 surface (Figure 3 and Figure 4) showed that the main processes that form the peaks on the P=f(T) curve are decarboxylation, decarbonylation, and dehydration.
The TPD curve for m/z 44 has a complex shape due to the thermal transformation of various types of surface complexes. And it is probably formed due to the superposition of the peaks of individual processes, such as shown by decomposing the total curve into separate Gaussians (R2 = 0.9973) (Figure 3d). Decarboxylation of CA on the surface of CeO2 begins almost at room temperature (Figure 3b). At temperatures above 100 °C, in the mass spectra of volatile pyrolysis products, an ion of 3,4-dihydroxy-phenylethylene (m/z 136) appears. Its desorption is observed in a wide temperature range (110–550 °C) (Figure 4a). It is known that pure caffeic acid decomposes with release CO2 and 3,4-dihydroxy-phenylethylene at a temperature about Tmax = 156 °C [38].
The formation of 3,4-dihydroxy-phenylethylene in the same temperature interval as for a condensed state is due to the decomposition of the CA associates, the presence of which was confirmed by data of FT–IR spectroscopy (Figure 1c).
Release of 3,4-dihydroxy-phenylethylene at higher temperatures is probably due to the thermal transformations of various types of surface complexes that are bound to the surface through a carboxyl group: monodentate and bidentate (Scheme 2). From previous studies [37] it is known that the formation of 3,4-dihydroxy-phenylethylene on the surface of silica was due to the transformation of complexes bound via -COOH.
In contrast to the thermal transformations of the CA on the surface of SiO2 and in the condensed state, the decomposition of CA on the nanoceria surface is accompanied by desorption of pyrocatechol (Mr = 110 Da, m/z 110, Tmax ≈ 260 °C) and hydroxybenzene (Mr = 94 Da, m/z 94, Tmax ≈ 390 °C) (Figure 3). In our opinion, the formation of these products is due to the basic nature of the surface of cerium dioxide and its ability to generate basic hydroxyl groups. The latter deprotonate phenols and cause the formation of phenolates, the presence of which on the surface is confirmed by the FT–IR data (Table 1, Figure 1a).
Release of pyrocatechol is observed at a lower temperature, around ~150 °C (Tmax ~ 260 °C), than the release of hydroxybenzene (Tmax = 390 °C) (Figure 4a). Therefore, it is likely that pyrocatechol is formed as a result of the transformation of the complex, which is bound to the surface by a weaker bond with the participation of only one phenol group (Scheme 3). In this case, its formation occurs synchronously with the desorption of acetylene carboxylic acid (prop-2-ynoic acid, Mr = 70 Da, m/z 70, Tmax ≈ 240 °C).
Formation of hydroxybenzene may occur due to thermal transformations of the surface complex formed on the surface with the participation of the ortho-dihydroxy groups (Scheme 4). The kinetic parameters of the reaction of formation of phenol using the Arrhenius method are calculated: the order of reaction (n = 1), temperature of the maximum desorption rate (Tmax = 390 °C), activation energy (E = 123 kJ/mol), and the pre-exponential factor (ν0 = 1.57 × 10⁷ s−1). The calculation procedure is described in detail in [31,64,65,66].
It is probable that the surface of the nanoceria acquires reducing properties as a result of pyrolytic reactions in the absence of oxygen; this confirms the fact of desorption of molecular hydrogen (m/z 3 (H3+), Tmax ≈ 540 °C) at temperatures above 400 °C (Figure 3c). As a result, the pyrocatechol complex is reduced to form and desorb phenol in molecular form (Scheme 4, Figure 4b). Under the conditions of the TGA experiment, this complex decomposes at a lower temperature as a result of the formation of 1,2-ortho-quinone, as evidenced by the appearance of the corresponding absorption band νC=O at 1666 cm−1 at temperatures above 170 °C (Scheme 4, Figure 2). It is known [57] that further deeper oxidation of 1,2-quinone occurs with the splitting of the aromatic ring and the formation of cis, cis-muconic acid. This process probably also occurs on the nanoceria surface with participation oxygen from the air. This is confirmed by the appearance of the νC=O band at 1732 cm−1, which can refer to the monomer of cis,cis-muconic acid (Figure 2, Scheme 4).
Based on the TGA data (Figure 3a, Table 2), about 68.7% of the total number of CA molecules on the surface decomposes during the second stage, probably as a result of the thermo-oxidative transformations of the CA phenolate complexes. In order to semi-quantitatively assess the relative content of various types of complexes, the integral intensities were calculated for the peaks of molecular ions of structurally related compounds with m/z 136 (3,4-dihydroxy-phenylethylene), 110 (pyrocatechol) and 94 (phenol). In addition, the deconvolution was used for decomposition the wide peak of the ion with m/z 136 for getting several Gaussians (R2 = 0.9821) (Figure 5).
The calculation showed (Table 3) that about 52% of CA complexes are formed on the surface as a result of interaction with the phenolic groups, about 13% with one of phenolic group, about 39% with both of the ortho-phenolic groups (chelate phenolates), about 39% with the carboxyl group and about 10% via the H-bonded association. The preferential formation of the phenolate complexes of CA is confirmed by both of the TPD MS and the TGA data.

4. Conclusions

The structure of CA complexes and their thermal evolution on the nanoceria surface was investigated using FT–IR spectroscopy at different temperatures. The thermal destruction of CA complexes chemisorbed through the -COOH group proceeds via decarboxylation reactions, producing of 3,4-dihydroxy-phenylethylene. Surface complexes through the phenolic groups produce various compounds: acetylene carboxylic acid and aromatic compounds (pyrocatechol, phenol).

Author Contributions

Conceptualization, T.K., M.K. and M.L.; Methodology, N.N., B.P. and T.K.; Formal Analysis, N.N., B.P. and T.K.; Investigation, N.N., B.P. and T.K.; Resources, B.P. and T.K.; Writing-Original Draft Preparation, N.N., B.P. and T.K.; Writing-Review and Editing, N.N. and T.K.; Visualization, P.B., N.N. and K.T.; Supervision, M.K. and M.L.; Project Administration, T.K.

Funding

This research was supported by STCU (Grant P707), by the Volkswagen Foundation, by the Swedish Research Council (VR, 348-2014-4250) and by NAS of Ukraine (Program “New functional substances and materials of chemical production”).

Acknowledgments

The authors are grateful for the peer review for the valuable suggestions.

Conflicts of Interest

The authors declare no conflict of interest.

References

  1. Campbell, C.T.; Peden, C.H.F. Oxygen Vacancies and Catalysis on Ceria Surfaces. Science 2005, 309, 713–714. [Google Scholar] [CrossRef] [PubMed]
  2. Orozco, L.M.; Renz, M.; Corma, A. Cerium oxide as a catalyst for the ketonization of aldehydes: Mechanistic insights and a convenient way to alkanes without the consumption of external hydrogen. Green Chem. 2017, 619, 1555–1569. [Google Scholar] [CrossRef]
  3. Montini, T.; Melchionna, M.; Monai, M.; Fornasiero, P. Fundamentals and Catalytic Applications of CeO2-Based Materials. Chem. Rev. 2016, 116, 5987–6041. [Google Scholar] [CrossRef] [PubMed]
  4. Trovarelli, A. Catalytic Properties of Ceria and CeO2-Containing Materials. Catal. Rev. 1996, 38, 439–520. [Google Scholar] [CrossRef]
  5. Vivier, L.; Duprez, D. Ceria-Based Solid Catalysts for Organic Chemistry. ChemSusChem 2010, 3, 654–678. [Google Scholar] [CrossRef] [PubMed] [Green Version]
  6. Nelson, N. Catalytic Upgrading of Phenolic Compounds Using Ceria-Based Materials. Ph.D. Thesis, Iowa State University, Ames, IA, USA, 2016. [Google Scholar]
  7. Das, S.; Dowding, J.M.; Klump, K.E.; McGinnis, J.F.; Self, W.; Seal, S. Cerium oxide nanoparticles: Applications and prospects in nanomedicine. Nanomedicine 2013, 8, 1483–1508. [Google Scholar] [CrossRef] [PubMed]
  8. Caputo, F.; Mameli, M.; Sienkiewicz, A.; Licoccia, S.; Stellacci, F.; Ghibelli, L.; Traversa, E. A novel synthetic approach of cerium oxide nanoparticles with improved biomedical activity. Sci. Rep. 2017, 7, 4636–4649. [Google Scholar] [CrossRef] [PubMed]
  9. Grulke, E.A.; Reed, K.; Beck, M.J.; Huang, X.; Cormack, A.N.; Seal, S. Nanoceria: Factors affecting its pro- and antioxidant Properties. Environ. Sci. Nano 2014, 1, 429–444. [Google Scholar] [CrossRef]
  10. Asati, M.; Santimukul Santra, S.; Kaittanis, C.; Nath, S.; Perez, J.M. Oxidase Activity of Polymer-Coated Cerium Oxide Nanoparticles. Angew. Chem. Int. Ed. Engl. 2009, 48, 2308–2312. [Google Scholar] [CrossRef] [PubMed]
  11. Hancock, M.L.; Grulke, E.A.; Yokel, R. Ceria Nanoparticle Dissolution and Stability in Acidic Aqueous Environments. In Proceedings of the AIChE Annual Meeting, Pittsburgh, PA, USA, 28 October–2 November 2018; p. 405a. [Google Scholar]
  12. Yokel, R.A.; Hancock, M.L.; Grulke, E.A.; Unrine, J.M.; Graham, U.M. Nanoceria Dissolution and Carboxylic Acid Stabilization in Aqueous Dispersions. FASEB J. 2017, 31, lb624. Available online: https://www.fasebj.org/doi/abs/10.1096/fasebj.31.1_supplement.lb6 24 (accessed on 6 December 2018).
  13. Ralph, J. Hydroxycinnamates in lignification. Phytochem. Rev. 2010, 9, 65–83. [Google Scholar] [CrossRef]
  14. Clifford, M.N. Chlorogenic acids and other cinnamatesnature, occurrence, dietary burden, absorption and metabolism. J. Sci. Food Agric. 2000, 80, 1033–1043. [Google Scholar] [CrossRef]
  15. Higdon, J.V.; Frei, B. Coffe and health: a rewiew of recent human research. Crit. Rev. Food Sci. 2006, 103, 101–123. [Google Scholar] [CrossRef] [PubMed]
  16. Clifford, N. Chlorogenic acid and other cinnamates: Nature, occurrence and dietary burden. J. Sci. Food Agric. 1999, 79, 362–372. [Google Scholar] [CrossRef]
  17. Lustosa, S.R.; Galindo, A.B.; Nunes, L.C.C.; Randau, K.P.; Rolim Neto, P.J. Prόpolis: Atualizações sobre a química e a farmacologia. Rev. Bras. Farmacogn. 2008, 18, 447–454. [Google Scholar] [CrossRef]
  18. Pandino, G.; Lombardo, S.; Williamson, G.; Mauromicale, G. Polyphenol profile and content in wild and cultivated. Cynara cardunculus L. Ital. J. Agron. 2012, 7, 254–261. [Google Scholar] [CrossRef]
  19. Chen, J.H.; Ho, C.T. Antioxidant activities of caffeic acid and its related hydroxycinamic acid compounds. J. Agric. Food Chem. 1997, 45, 2374–2378. [Google Scholar] [CrossRef]
  20. Lu, Y.; Foo, L. Antioxidant and radical scavenging activities of polyphenols from apple pomace. Food Chem. 2000, 68, 81–85. [Google Scholar] [CrossRef]
  21. Gulcin, I. Antioxidant activity of caffeic acid. Toxicology 2006, 217, 213–220. [Google Scholar] [CrossRef] [PubMed]
  22. Magnani, C.; Isaac, V.L.B.; Correa, M.A.; Salgado, H.R.N. Caffeic acid: A review of its potential use in medications and cosmetics. Anal. Methods 2014, 6, 3203–3210. [Google Scholar] [CrossRef]
  23. Graf, E. Antioxidant potential of ferulic acid. Free Radic. Biol. Med. 1992, 13, 435–448. [Google Scholar] [CrossRef]
  24. Cuvelier, M.E.; Richard, H.; Berset, C. Antioxidative activity and phenolic composition of pilot-plant and commercial extracts of sage and rosemary. J. Am. Oil Chem. Soc. 1996, 73, 645–652. [Google Scholar] [CrossRef]
  25. Brand-Willams, W.; Cuvelier, M.E.; Berset, C. Use of free radical method to evaluate antioxidant activity. Food Sci. Technol. 1995, 28, 25–30. [Google Scholar] [CrossRef]
  26. Almajano, M.P.; Carbo, R.; Delgado, M.E.; Gordon, M.H. Effect of pH on the Antimicrobial activity and oxidative stability of oil-in-water emulsions containing caffeic acid. J. Food Sci. 2007, 72, 258–263. [Google Scholar] [CrossRef] [PubMed]
  27. Chaturvedi, V.; Verma, P. An overview of key pretreatment processes employed for bioconversion of lignocellulosic biomass into biofuels and value added products. 3 Biotech 2013, 3, 415–431. [Google Scholar] [CrossRef] [PubMed] [Green Version]
  28. Hodasova, L.; Jablonský, M.; Škulcová, A.; Ház, A. Lignin, potential products and their market value. Wood Res. 2015, 60, 973–986. [Google Scholar]
  29. Luo, Z.; Wang, Y.; He, M.; Zhao, C. Precise oxygen scission of lignin derived aryl ethers to quantitatively produce aromatic hydrocarbons in water. Green Chem. 2016, 18, 433–441. [Google Scholar] [CrossRef]
  30. Azizova, L.R.; Kulik, T.V.; Palianytsia, B.B.; Lipkovska, N.A. Thermal and hydrolytic stability of grafted ester groups of carboxylic acids on the silica surface. J. Therm. Anal. Calorim. 2015, 122, 517–523. [Google Scholar] [CrossRef]
  31. Kulik, T.V. Use of TPD–MS and Linear Free Energy Relationships for assessing the reactivity of aliphatic carboxylic acids on a silica surface. J. Phys. Chem. C 2011, 116, 570–580. [Google Scholar] [CrossRef]
  32. Kwart, H.; King, K. The Chemistry of Carboxylic Acids and Esters; Patai, S., Ed.; Interscience Publishers: London, UK, 1969. [Google Scholar]
  33. Nagashima, O.; Sato, S.; Takahashi, R.; Sodesawa, T. Ketonization of carboxylic acids over CeO2–based composite oxides. J. Mol. Catal. A Chem. 2005, 227, 231–239. [Google Scholar] [CrossRef]
  34. Pacchioni, G. Ketonization of Carboxylic Acids in Biomass Conversion over TiO2 and ZrO2 Surfaces: A DFT Perspective. ACS Catal. 2014, 4, 2874–2888. [Google Scholar] [CrossRef]
  35. Kulik, T.V.; Barvinchenko, V.N.; Palyanitsa, B.B.; Smirnova, O.V.; Pogorelyi, V.K.; Chuiko, A.A. A desorption mass spectrometry study of the interaction of cinnamic acid with a silica surface. Russ. J. Phys. Chem. 2007, 8, 83–90. [Google Scholar] [CrossRef]
  36. Kulik, T.V.; Lipkovska, N.A.; Barvinchenko, V.N.; Palyanytsya, B.B.; Kazakova, O.A.; Dovbiy, O.A.; Pogorelyi, V.K. Interactions between bioactive ferulic acid and fumed silica by UV–vis spectroscopy, FT–IR, TPD MS investigation and quantum chemical methods. J. Colloid Interface Sci. 2009, 339, 60–68. [Google Scholar] [CrossRef] [PubMed]
  37. Kulik, T.V.; Lipkovska, N.O.; Barvinchenko, V.M.; Palyanytsya, B.B.; Kazakova, O.A.; Dudik, O.O.; Menyhárd, A.; László, K. Thermal transformation of bioactive caffeic acid on fumed silica seen by UV–Vis spectroscopy, thermogravimetric analysis, temperature programmed desorption mass spectrometry and quantum chemical methods. J. Colloid Interface Sci. 2016, 470, 132–141. [Google Scholar] [CrossRef] [PubMed]
  38. Kulik, T.V.; Barvinchenko, V.N.; Palyanytsya, B.B.; Lipkovska, N.A.; Dudik, O.O. Thermal transformations of biologically active derivatives of cinnamic acid by TPD MS investigation. J. Anal. Appl. Pyrol. 2011, 90, 219–223. [Google Scholar] [CrossRef]
  39. Kumar, N.; Pruthi, V.; Goel, N. Structural, thermal and quantum chemical studies of p-coumaric and caffeic acids. J. Mol. Struct. 2015, 1085, 242–248. [Google Scholar] [CrossRef]
  40. Davalos, J.Z.; Herrero, R.; Chana, A.; Guerrero, A.; Jiménez, P.; Santiuste, J.M. Energetics and structural properties, in the gas phase, of trans-hydroxycinnamic acids. J. Phys. Chem. A 2012, 116, 2261–2267. [Google Scholar] [CrossRef] [PubMed]
  41. Xing, Y.; Peng, H.; Zhang, M.; Li, X.; Zeng, W.; Yang, X. Caffeic acid product from the highly copper-tolerant plant Elsholtzia splendens post-phytoremediation: Its extraction, purification, and identification. J. Zhejiang Univ. Sci. B 2012, 13, 487–493. [Google Scholar] [CrossRef] [PubMed]
  42. Sẃisłocka, R. Spectroscopic (FT-IR, FT-Raman, UV absorption, 1H and 13C NMR) and theoretical (in B3LYP/6-311++G** level) studies on alkali metal salts of caffeic acid. Spectrochim. Acta Part A 2013, 100, 21–30. [Google Scholar] [CrossRef] [PubMed]
  43. Williams, P.A.M.; Baro, A.G.; Ferrer, E.G. Study of the interaction of oxovanadium(IV) with a plant component (caffeic acid). Synthesis and characterization of a solid compound. Polyhedron 2002, 21, 1979–1984. [Google Scholar] [CrossRef]
  44. Tošović, J. Spectroscopic feature s of caffeic acid: Theoretical study. Kragujev. J. Sci. 2017, 39, 99–108. [Google Scholar] [CrossRef]
  45. Tarasevich, B.N. IR Spectra of the Main Classes of Organic Molecule. Reference Materials; Moskow Lomonosov University: Moskow, Russia, 2012. (In Russian) [Google Scholar]
  46. Bellamy, L. Infra-Red Spectra of Complex Molecule; Methuen & Co LTD: London, UK, 1963. [Google Scholar]
  47. Świsłocka, R.; Kowczyk-Sadowy, M.; Kalinowska, M.; Lewandowski, W. Spectroscopic (FT-IR, FT-Raman, 1H and 13C NMR) and theoretical studies of p-coumaric acid and alkali metal p-coumarates. Spectroscopy 2012, 27, 35–48. [Google Scholar] [CrossRef]
  48. Brand, J.; Eglinton, G. Applications of Spectroscopy to Organic Chemistry; Oldbourne Press: London, UK, 1965. [Google Scholar]
  49. Ferrer, E.G.; Salinas, M.V.; Correa, M.G.; Vrdoljak, F.; Williams, P.A.M. ALP Inhibitors: Vanadyl(IV) Complexes of Ferulic and Cinnamic Acid. Z. Naturforsch. 2005, 60b, 305–311. [Google Scholar] [CrossRef]
  50. Kulyk, K.; Palianytsia, B.; Alexander, J.; Azizova, L.; Borysenko, M.; Larsson, M.; Kartel, M.; Kulik, T. Kinetics of Valeric Acid Ketonization and Ketenization in Catalytic Pyrolisis on Nanosized SiO2, γ-Al2O3 CeO2/SiO2, Al2O3/TiO2 and TiO2/Al2O3. ChemPhysChem 2017, 18, 1943–1955. [Google Scholar] [CrossRef] [PubMed]
  51. Palacios, E.G.; Juares-Lopes, G.; Monhemius, A.J. Infrared spectroscopy of metal carboxylates: II. Analysis of Fe(III), Ni and Zn carboxylate solutions. Hydrometallurgy 2004, 72, 139–148. [Google Scholar] [CrossRef]
  52. Stehfest, K.; Boese, M.; Kerns, G.; Piry, A.; Wilhelm, C. Fourier transform infrared spectroscopy as a new tool to determine rosmarinic acid in situ. J. Plant Physiol. 2004, 161, 151–156. [Google Scholar] [CrossRef] [PubMed]
  53. Kharlampovich, G.D.; Churkin, Y.V. Phenolz; Khimiya Publ.: Moskow, Russia, 1974. (In Russian) [Google Scholar]
  54. Nakanishi, K. Infrared Adsorption Spectroscopy (Practical); Holden Day. Inc.: San Francisco, CA, USA, 1962. [Google Scholar]
  55. Kotorlenko, A.; Alexandrova, V.S. Spectral manifestations of change in electronic structure in phenol-phenolate anion-phenoxi radical series. Theor. Exp. Chem. 1982, 18, 115–118. [Google Scholar] [CrossRef]
  56. Śanchez-Cortés1, S.; Garćıa-Ramos, J.V. Adsorption and Chemical Modification of Phenols on a Silver Surface. J. Colloid. Interface Sci. 2000, 231, 98–106. [Google Scholar] [CrossRef] [PubMed]
  57. Barton, D.; Ollis, W. Comprehensive Organic Chemistry: The Synthesis and Reactions of Organic Compounds, 3rd ed.; Oxygen, Compounds, Stoddart, J.F., Eds.; Pergamon Press: Oxford, UK, 1979; Volume 1. [Google Scholar]
  58. Pillar, E.A.; Zhou, R.; Guzman, M.I. Heterogeneous Oxidation of Catechol. J. Phys. Chem. A 2015, 119, 10349–10359. [Google Scholar] [CrossRef] [PubMed]
  59. Dai, G.; Zou, Q.; Wang, S.; Zhao, Y.; Zhu, L.; Huang, Q. Effect of Torrefaction on the Structure and Pyrolysis Behavior of Lignin. Energy Fuels 2018, 32, 4160–4166. [Google Scholar] [CrossRef]
  60. Evtuguin, D.V.; Rocha, G.; Goodfellow, B.J. Detection of muconic acid type structures in oxidised lignins using 2D NMR. Holzforschung 2009, 63, 675–680. [Google Scholar] [CrossRef]
  61. Fuchs, G.; Boll, M.; Heider, J. Microbial degradation of aromatic compounds—From one strategy to four. Nat. Rev. Microbiol. 2011, 9, 803–816. [Google Scholar] [CrossRef] [PubMed]
  62. Ma, Z.; Wang, J.; Yang, Y.; Zhang, Y.; Zhao, C.; Yu, Y.; Wang, S. Comparison of the thermal degradation behaviors and kinetics of palm oil waste under nitrogen and air atmosphere in TGA-FTIR with a complementary use of model-free and model-fitting approaches. J. Anal. Appl. Pyrolysis 2018, 134, 12–24. [Google Scholar] [CrossRef]
  63. Ma, Z.; Wanga, J.; Zhoua, H.; Zhanga, Y.; Yanga, Y.; Liua, X.; Yea, J.; Chenc, D.; Wangb, S. Relationship of thermal degradation behavior and chemical structure of lignin isolated from palm kernel shell under different process severities. Fuel Process. Technol. 2018, 181, 141–156. [Google Scholar] [CrossRef]
  64. Woodruff, D.; Delchar, T. Modern Techniques of Surface Science; Cambridge Solid State Science Series; Cambridge University Press: London, UK, 1986. [Google Scholar]
  65. Cvetanovic, R.J.; Amenomiya, Y. A temperature programmed desorption technique for investigation of practical catalysts. Catal. Rev. 1972, 6, 21–85. [Google Scholar] [CrossRef]
  66. Nicholl, S.I.; Talley, J.W. Development of thermal programmed desorption mass spectrometry methods for environmental applications. Chemosphere 2006, 63, 132–141. [Google Scholar] [CrossRef] [PubMed]
Figure 1. Fourier transform–infrared (FT–IR) spectra of pure caffeic acid (CA), samples of CA/CeO2 in various concentrations (1–0.1; 2–0.3; 3–0.6; 4–0.9; 5–1.2 mmol/g) and CA/CeO2 (0.6 mmol/g), after desorption—3des.
Colloids 03 00034 g001
Scheme 1. Possible structures of the surface complexes of CA: bidentate bridge (a); bidentate chelate (b); monodentate (c), complexes bonded with the participation of phenol groups (d,e).
Colloids 03 00034 sch001
Figure 2. FT–IR spectra of CA/CeO2 (0.6 mmol/g) at different temperatures.
Colloids 03 00034 g002
Figure 3. (a) Differential thermal analysis (DTA), differential thermogravimetric analysis (DTG), thermogravimetric (TG) curves; (b) Vapor pressure measured as a function of temperature (P-T); (c) temperature-programmed desorption (TPD) curves for ions with m/z 44, 28, 18, 3; (d) deconvolution of TPD curve for ions with m/z 44 for CA/CeO2 (0.6 mmol/g).
Colloids 03 00034 g003
Figure 4. Thermal decomposition of CA/CeO2 (0.6 mmol/g): (a) Mass spectra at 240 C and TPD curves for ions with m/z 136, 110, 70; (b) mass spectra at 380 °C and TPD curves for ions with m/z 94, 66, 65 °C (b).
Colloids 03 00034 g004
Scheme 2. Thermal transformations of carboxylate complexes of CA with the formation of 3,4-dihydroxyphenylethylene and carbon dioxide: (a) dimers and hydrogen-bonded associates of CA; (b) monodentate complex; (c) bidentate chelate and bidentate bridging complexes.
Colloids 03 00034 sch002
Scheme 3. Thermal transformation of phenolate CA with the formation of pyrocatechol and acetylenecarboxylic acid.
Colloids 03 00034 sch003
Scheme 4. Thermal transformation of the phenolic chelate complexes of CA with the formation of phenol, 1,2-quinone and cis,cis-muconic acid.
Colloids 03 00034 sch004
Figure 5. Deconvolution of TPD curve for ion with m/z 136.
Colloids 03 00034 g005
Table 1. Assignments of some characteristic infrared (IR) bands (cm−1) of CA in condensed phase and CA on the surface of CeO2.
CACA/CeO2Assignments 1Literary Data
Phenolic group
903δCOH955–890 [45]
1176βCOHar1180 [52], 1178 [53],
1196
1166
νCO1195 [55]
12191219
1230 2
νCOHar1140–1230 [45],
1230 [53], 1200 [54]
12821281νCOH1210–1320
[45,46,54]
Carboxylic group
903δCOH955–890 [45]
1396νC-O
1410νsCOO1300–1400 [45], 1420–1470 [46]
1417
1489νasCOO1550–1610 [46], 1550–1650 [45,54]
1520
16451632νC=O1645 [41,42,52]
16201620νC=C1635 [48,49], 1626 [46]
2500–2700 32500–2700 3νOH2500–2700 [46]
1 The symbol “ν” denotes stretching vibrations, “δ” denotes in-plane deformations, “β” denotes out-of-plane deformations; and the band is marked with “as”—asymmetric vibrations, “s”—symmetric, “ar”—vibrations of the aromatic ring. 2 The frequency is given for a sample of CA/CeO2 (0.6 mmol/g). 3 The given frequency range corresponds to the νOH of the dimers of carboxylic acids.
Table 2. Pyrolysis yields for thermogravimetric analysis (TGA) pyrolysis of CA/CeO2 (0.6 mmol/g).
StageTemperature Range/Tmax (°C)Volatiles (%)Char (%)
I20–20022.6-
II26068.7-
Σ(I+II) 91.38.7
Table 3. The calculated integral intensities for the peaks of molecular ions of structurally related compounds with m/z 136 (3,4-dihydroxy-phenylethylene), 110 (pyrocatechol) and 94 (phenol). Relative content of various types of CA complexes.
NoSurface Complexes (SC)m/zTmax (°C)SchemePeak Area (a.u.)%
-COOH
1Hydrogen-bonded association1361322a0.3112.6
2Dimers1361662a0.8266.9
3Monodentate bonded complexes1362322b1.75114.6
4Bidentate carboxylates1363972c2.87724.0
ΣSCCOOH = 5.839.0
-Ph(OH)2
5Phenolate complexes11024131.50712.6
6Chelate phenolate complexes9439044.70639.2
ΣSCPhOH = 6.252.2

