Rheological Properties of Alginate–Essential Oil Nanodispersions


Department of Agricultural, Environmental and Food Sciences (DiAAA) and Center for Colloid and Surface Science (CSGI), University of Molise, Via De Sanctis, I-86100 Campobasso, Italy
*
Authors to whom correspondence should be addressed.
Colloids Interfaces 2018, 2(4), 48; https://doi.org/10.3390/colloids2040048
Submission received: 27 September 2018
/
Revised: 13 October 2018
/
Accepted: 15 October 2018
/
Published: 17 October 2018
(This article belongs to the Special Issue Selected Papers from the 16th Conference of the International Association of Colloid and Interface Scientists (IACIS 2018))
Abstract
:Due to its favorable structural properties and biocompatibility, alginate is recognized as a suitable versatile biopolymer for use in a broad range of applications ranging from drug delivery, wound healing, tissue engineering, and food formulations such as nanodispersions. Rheological analysis plays a crucial role in the design of suitable nanoemulsion based coatings. Different essential oil and alginate nanodispersion compositions stabilized by Tween 80 were analyzed for rheological and conductometric properties. The results confirmed that the nanoformulations shared a pseudoplastic non-Newtonian behavior that was more evident with higher alginate concentrations (2%). Nanodispersions made of alginate and essential oil exhibited a slight thixotropic behavior, demonstrating the aptitude to instantaneously recover from the applied stress or strain. Oscillatory frequency sweep tests showed a similar fluid-like behavior for 1% and 2% alginate nanodispersions. Finally, it was demonstrated that advantages coming with the use of the essential oil are added to the positive aspects of alginate with no dramatic modification on the flow behavior.
1. Introduction
Alginates are abundant in the environment since they are present both as a structural component in marine brown algae, and as capsular polysaccharides in soil bacteria. Alginate is recognized as a versatile biopolymer used in a broad range of applications [1,2,3,4,5]. Alginate is a linear binary copolymer made of blocks of mannuronic acid (M) and guluronic acid (G), covalently linked together in different sequences. This anionic polyelectrolyte, due to its ability to form different types of gel has exclusive properties compared to other neutral macromolecules. Alginate in a hydrogel form has been particularly attractive in drug delivery, wound healing and tissue engineering applications [6]. Further applications have also been developed due to the favorable structural properties and biocompatibility sharing technological relevance as gelling agent in the food, cosmetic and pharmacological industries [7].
Among the new trends of the food industry, the interest in ready-to-eat fresh products like fruit and vegetables is increasing. To guarantee the safety of this kind of product, different strategies have been proposed [8], like storage in modified atmospheres, the use of active packaging and the application of edible coatings onto the fruit surface. Each of the proposed strategies is oriented to preserve product appearance and freshness. Minimal processing operations like peeling and cutting, could alter the integrity of foodstuff bringing about negative effects on products such as enzymatic browning, production of off-flavors or texture breakdown [9]. The application of edible coatings or films could be classified as a mild technology that allows the extending of food product shelf life without affecting its original characteristics. Alginate-based edible coatings have been successfully used to preserve postharvest quality of fruits and vegetables [10,11,12]. To date, the importance of this polymer has been highlighted because of its involvement in food technologies as a nanoformulation ingredient [13,14]. Nanoformulations, nanoemulsions or nanodispersions represent a strategy to solubilize lipophilic ingredients in aqueous media and to design new products with an enhanced functionality [15]. Nanodispersions like oil in water (nanoemulsions) enable the improvement of physical stability and performance of active lipophilic ingredients within a hydrophilic edible coating, give the possibility of enhancing quality and/or nutritional value of food products [16,17,18,19]. Typically, the dispersed phase of oil in water nanoemulsions is made of oil droplets and the addition of a polymer like sodium alginate in the continuous phase, this makes these systems more stable because alginate acts as a thickening agent.
The use of nanoemulsions in the field of food-grade packaging plays an important role because it promotes the development of a new generation of active edible coatings, that can conjugate the structural properties of the polyelectrolytes in the continuous phase with the characteristics of the oil fraction that provides a partial barrier to moisture loss and allows the solubilization of active lipophilic compounds. Moreover, if oils with outstanding properties, like essential oils, are used as oil phase the features of the essential oil, like the antimicrobial and antioxidant characteristics, will be added to the edible coating [16].
Rheological analysis plays a crucial role in the design of suitable coatings. The study of interconnected parameters is useful to foresee or develop performances of the analyzed materials. [20,21,22]. Generally, the viscosity of an emulsion is strongly dependent on the concentration of the dispersed phase [23], and for such systems the relative amounts of polymer and oil phases become a key development issue in influencing the rheological properties of a nanoemulsion [24].
In the present study different nanodispersions have been prepared and characterized to analyze the rheological properties of formulations having alginate 1% or 2% in the continuous phase and essential oil concentrations varying from 0% to 2%. Considering the use of alginate as edible coating, the goal of this investigation was to understand how the essential oil dispersion in alginate suspension affects the structural and fluid behavior.
2. Materials and Methods
Materials: Food-grade sodium alginate was purchased from Farmalabor, Tween 80 was purchased from Sigma Aldrich, lemongrass (Cymbopogon nardus) essential oil (100%) was purchased from Erbamea (Lama di San Giustino, PG, Italy).
Nanodispersions preparation: Dispersions made of different concentrations of sodium alginate (1–2% w/v) were prepared by dissolving polyelectrolyte powder in a water bath at 70 °C through gentle stirring with a magnetic bar. Nanodispersions were prepared using sodium alginate dispersion (1 or 2% w/v) as the continuous phase and lemongrass essential oil (EO) at different concentrations (0, 0.5, 1, 2% v/v) as the dispersed phase. All the nanodispersions were stabilized by Tween 80 (1% v/v). Coarse emulsions were prepared by mixing the aqueous phase with EO and Tween 80 using a laboratory mixer, T25 digital Ultra-Turrax, working at 24,000 rpm for 4 min. All the emulsions were then sonicated using an Ultrasonic Homogenizer (Model 300 VT) for 1 min at 120 W with 50% pulsed frequency to reduce particle dimensions.
Rheological characterization: Rheological measurements of alginate suspensions and nanodispersions were made through a rotational rheometer, Haake MARS III (Thermo Scientific, Karlsruhe, Germany) two days after their preparation.
All rheology measurements were made using a 60-mm diameter parallel plate geometry (PP60). The temperature was controlled by a Peltier system in combination with a water bath system (Phoenix II, Thermo Scientific, Karlsruhe, Germany). The samples (2.9 mL) were carefully poured onto the surface of the lower plate and the upper plate was lowered to 1 mm gap distance. Before testing, samples were left equilibrating for 10 min to allow for mechanical and temperature equilibrium. Flow curves were made in control rate mode (CR) varying the shear rate (0.1–150 s−1) at 25 °C.
Frequency sweep tests were carried out using a fixed shear stress from the linear viscoelastic (LVE) range previously determined (through amplitude sweep measurements), and in a frequency range from 0.01 to 100 Hz.
Thixotropy curves were obtained through hysteresis loop experiments carried out in three steps: (1) rotational CR test with the shear rate varying from 0 to 100 s−1 in 100 s; (2) plateau curve at the maximum shear rate (100 s−1) for 30 s; (3) downward curve from 100 to 0 s−1 in 100 s.
Conductivity measurements: Conductivity values were recorded using a CDM230 conductivity meter (Radiometer Analytical) equipped with a two-pole conductivity cell tailored for small volumes (CDC 749), calibrated with a standard solution of KCl 1 × 10⁻² M. The conductivity was measured at 25 °C.
3. Results and Discussion
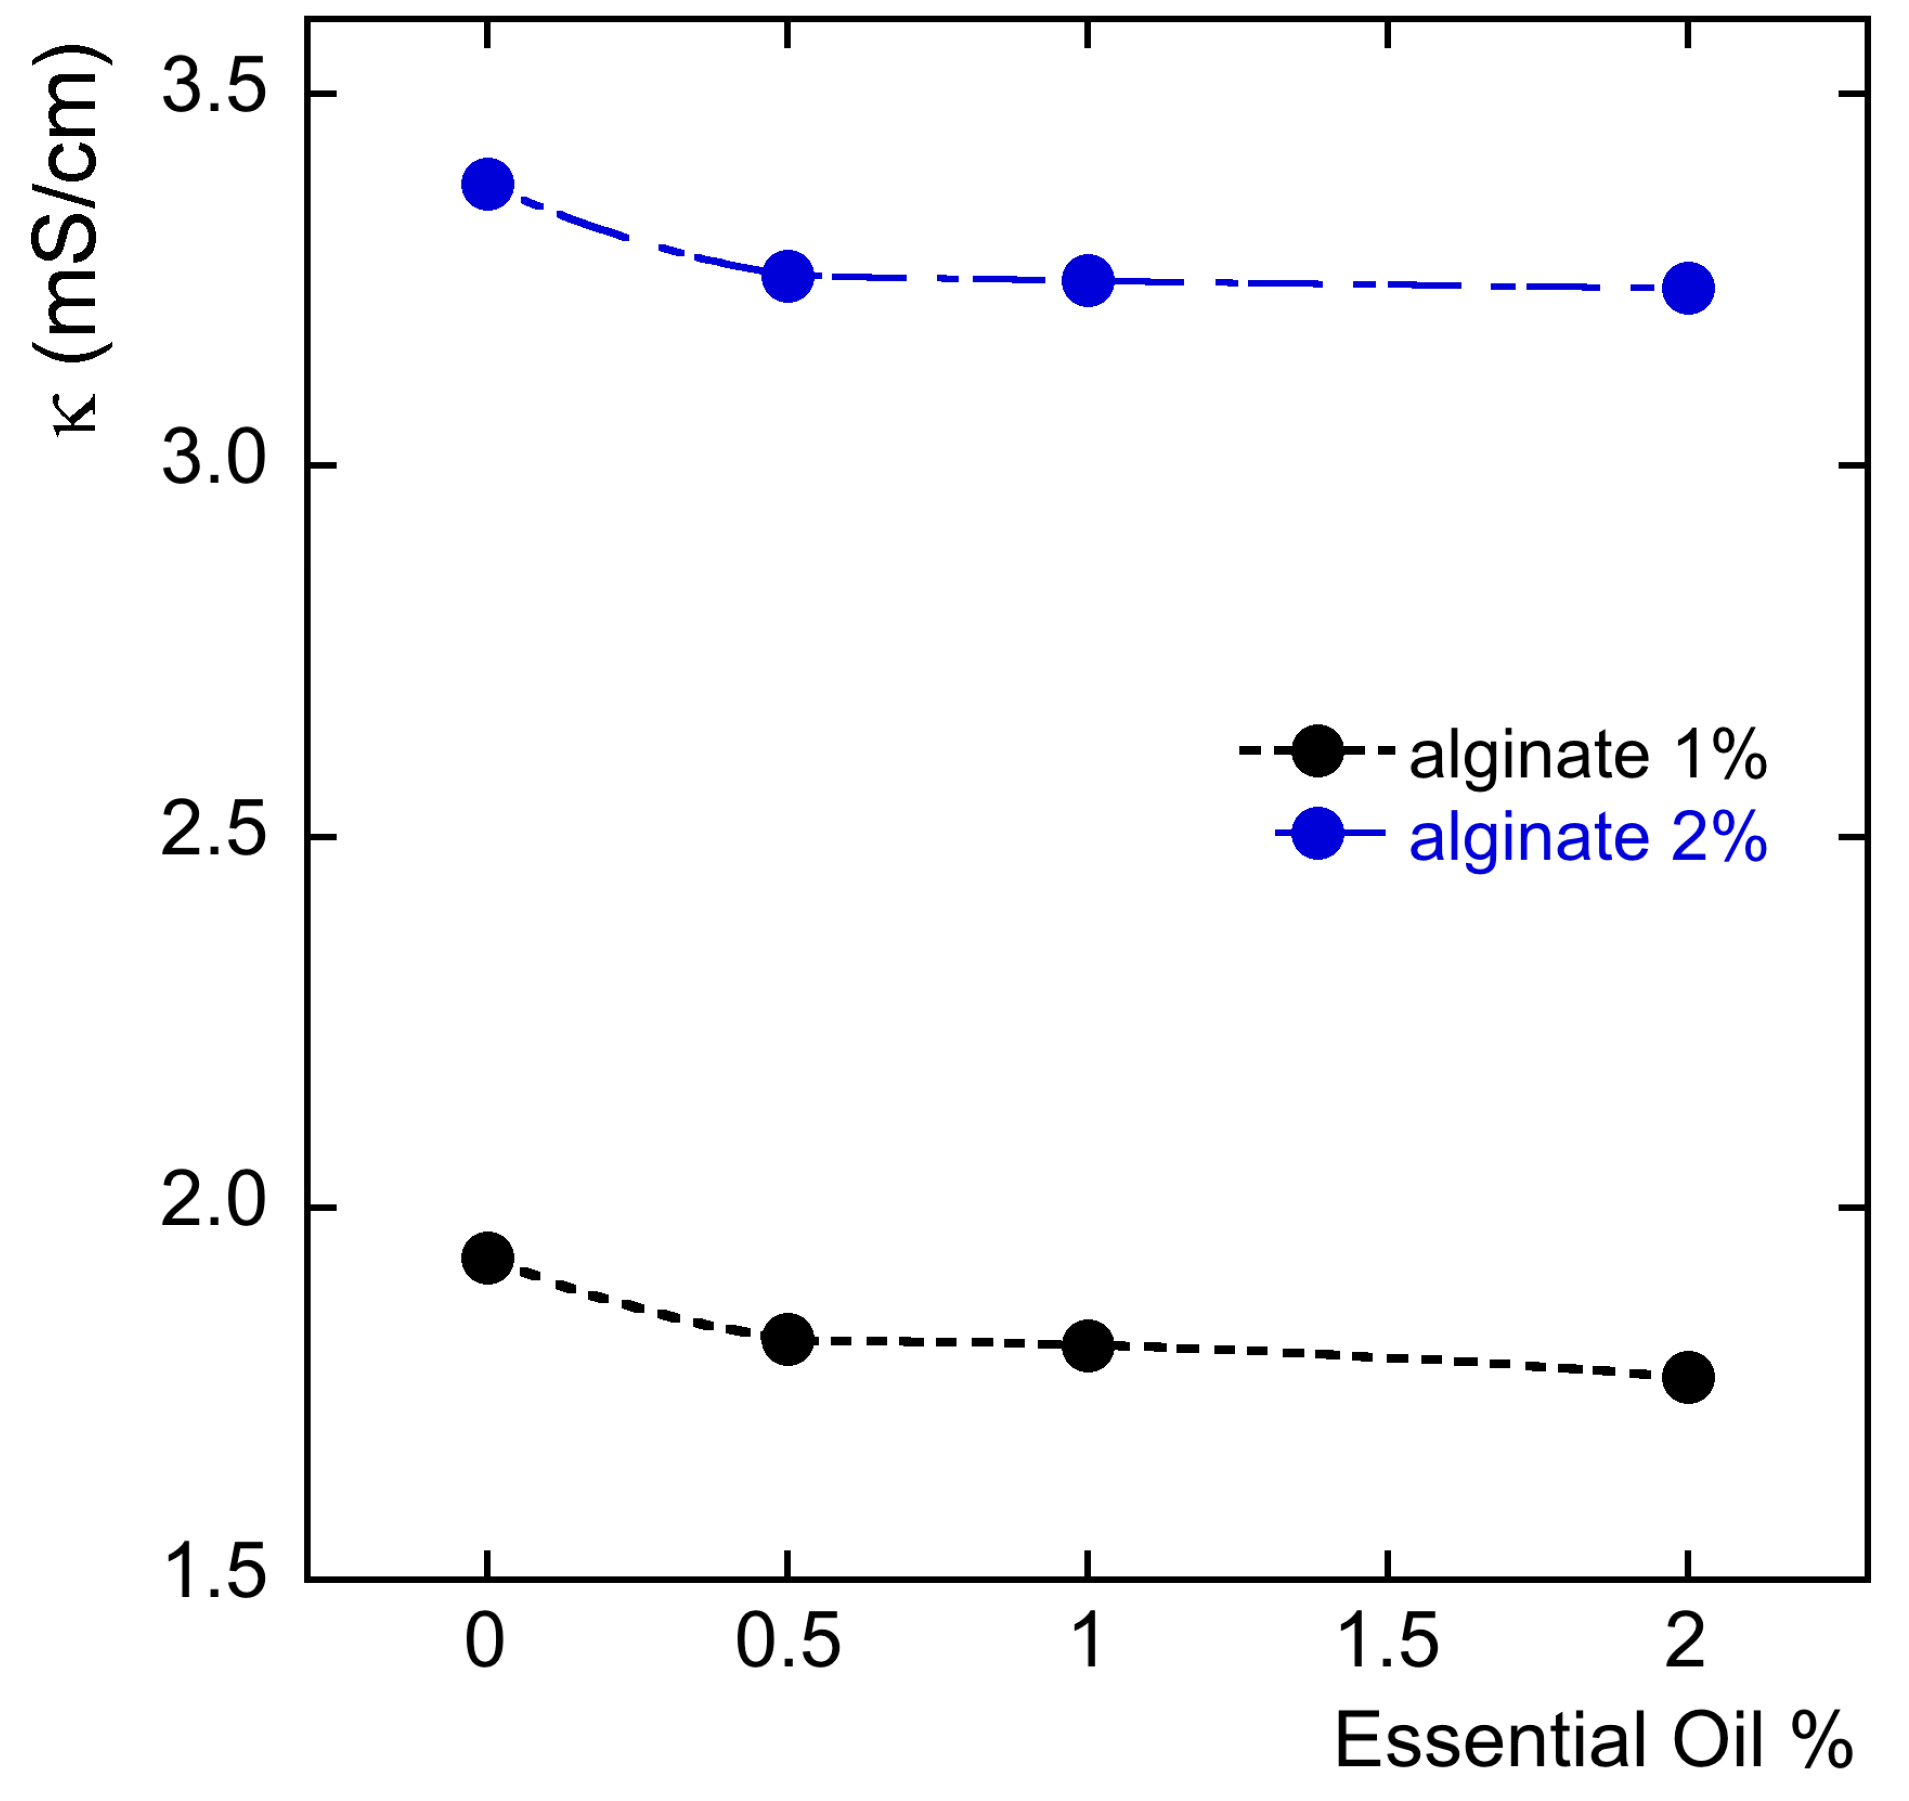
Food grade nanodispersions were prepared by mixing different concentrations of lemongrass essential oil with suspensions containing either 1% or 2% alginate. The effect of the oil mixing with alginate was measured with ionic conductivity. Figure 1 illustrates the conductivity values according to variations of essential oil concentration in 1% and 2% alginate dispersions. Shown in the graph, the conductivity of the dispersions decreases with the oil content increase. Among the nanodispersions, alginate, being a polyelectrolyte, is the only one bearing charges and as can be seen from Figure 1, the ionic conductivity of the nanoemulsions based on 2% alginate was higher than conductivity at 1% alginate. However, the addition of essential oil was able to reduce the alginate charge mobility, regardless the alginate concentration.
From these results, the relevance of the amount of polymer that influences the phase behavior of the system appears obvious. Such changes in electrical conductivity can be interpreted as a consequence of polymer-induced increase in connectivity of aqueous domains [25]. These results indicate that the hydrocolloid and the lipid fraction interact with each other.
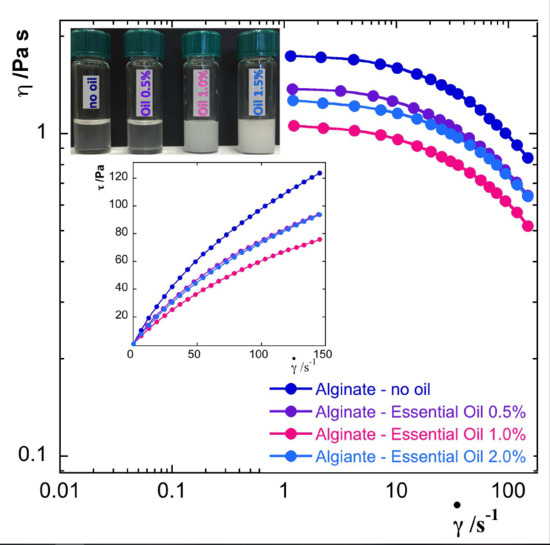
The rheological behavior was investigated according to the increasing oil concentration through both rotational and oscillatory tests. Native alginate suspensions (without oil and surfactant) exhibited a non-Newtonian pseudoplastic behavior (data not shown) showing shear rate dependence of the apparent viscosity. As reported in Figure 2A,B, an analogous behavior was observed for the alginate/essential oil nanodispersions. The flow curves of all the o/w nanodispersions showed the apparent viscosity values decreasing along with the shear rate increase. In the insets of Figure 2, the shear stress values as a function of the shear rate are reported. Apparent viscosity curves for 1% alginate nanodispersions (Figure 2A) presented a small increase for essential oil content of 0.5% (A1–EO 0.5) and overall, the values measured were one order of magnitude smaller than the values of the 2% alginate nanodispersions (Figure 2B). Among the nanodispersions made with 2% alginate, loading 1% of essential oil (A2–EO 1) gave the lowest viscosity values.
Flow curves of all the nanodispersions were fitted to the Ostwald-de Waele model [26,27] according to Equation (1):
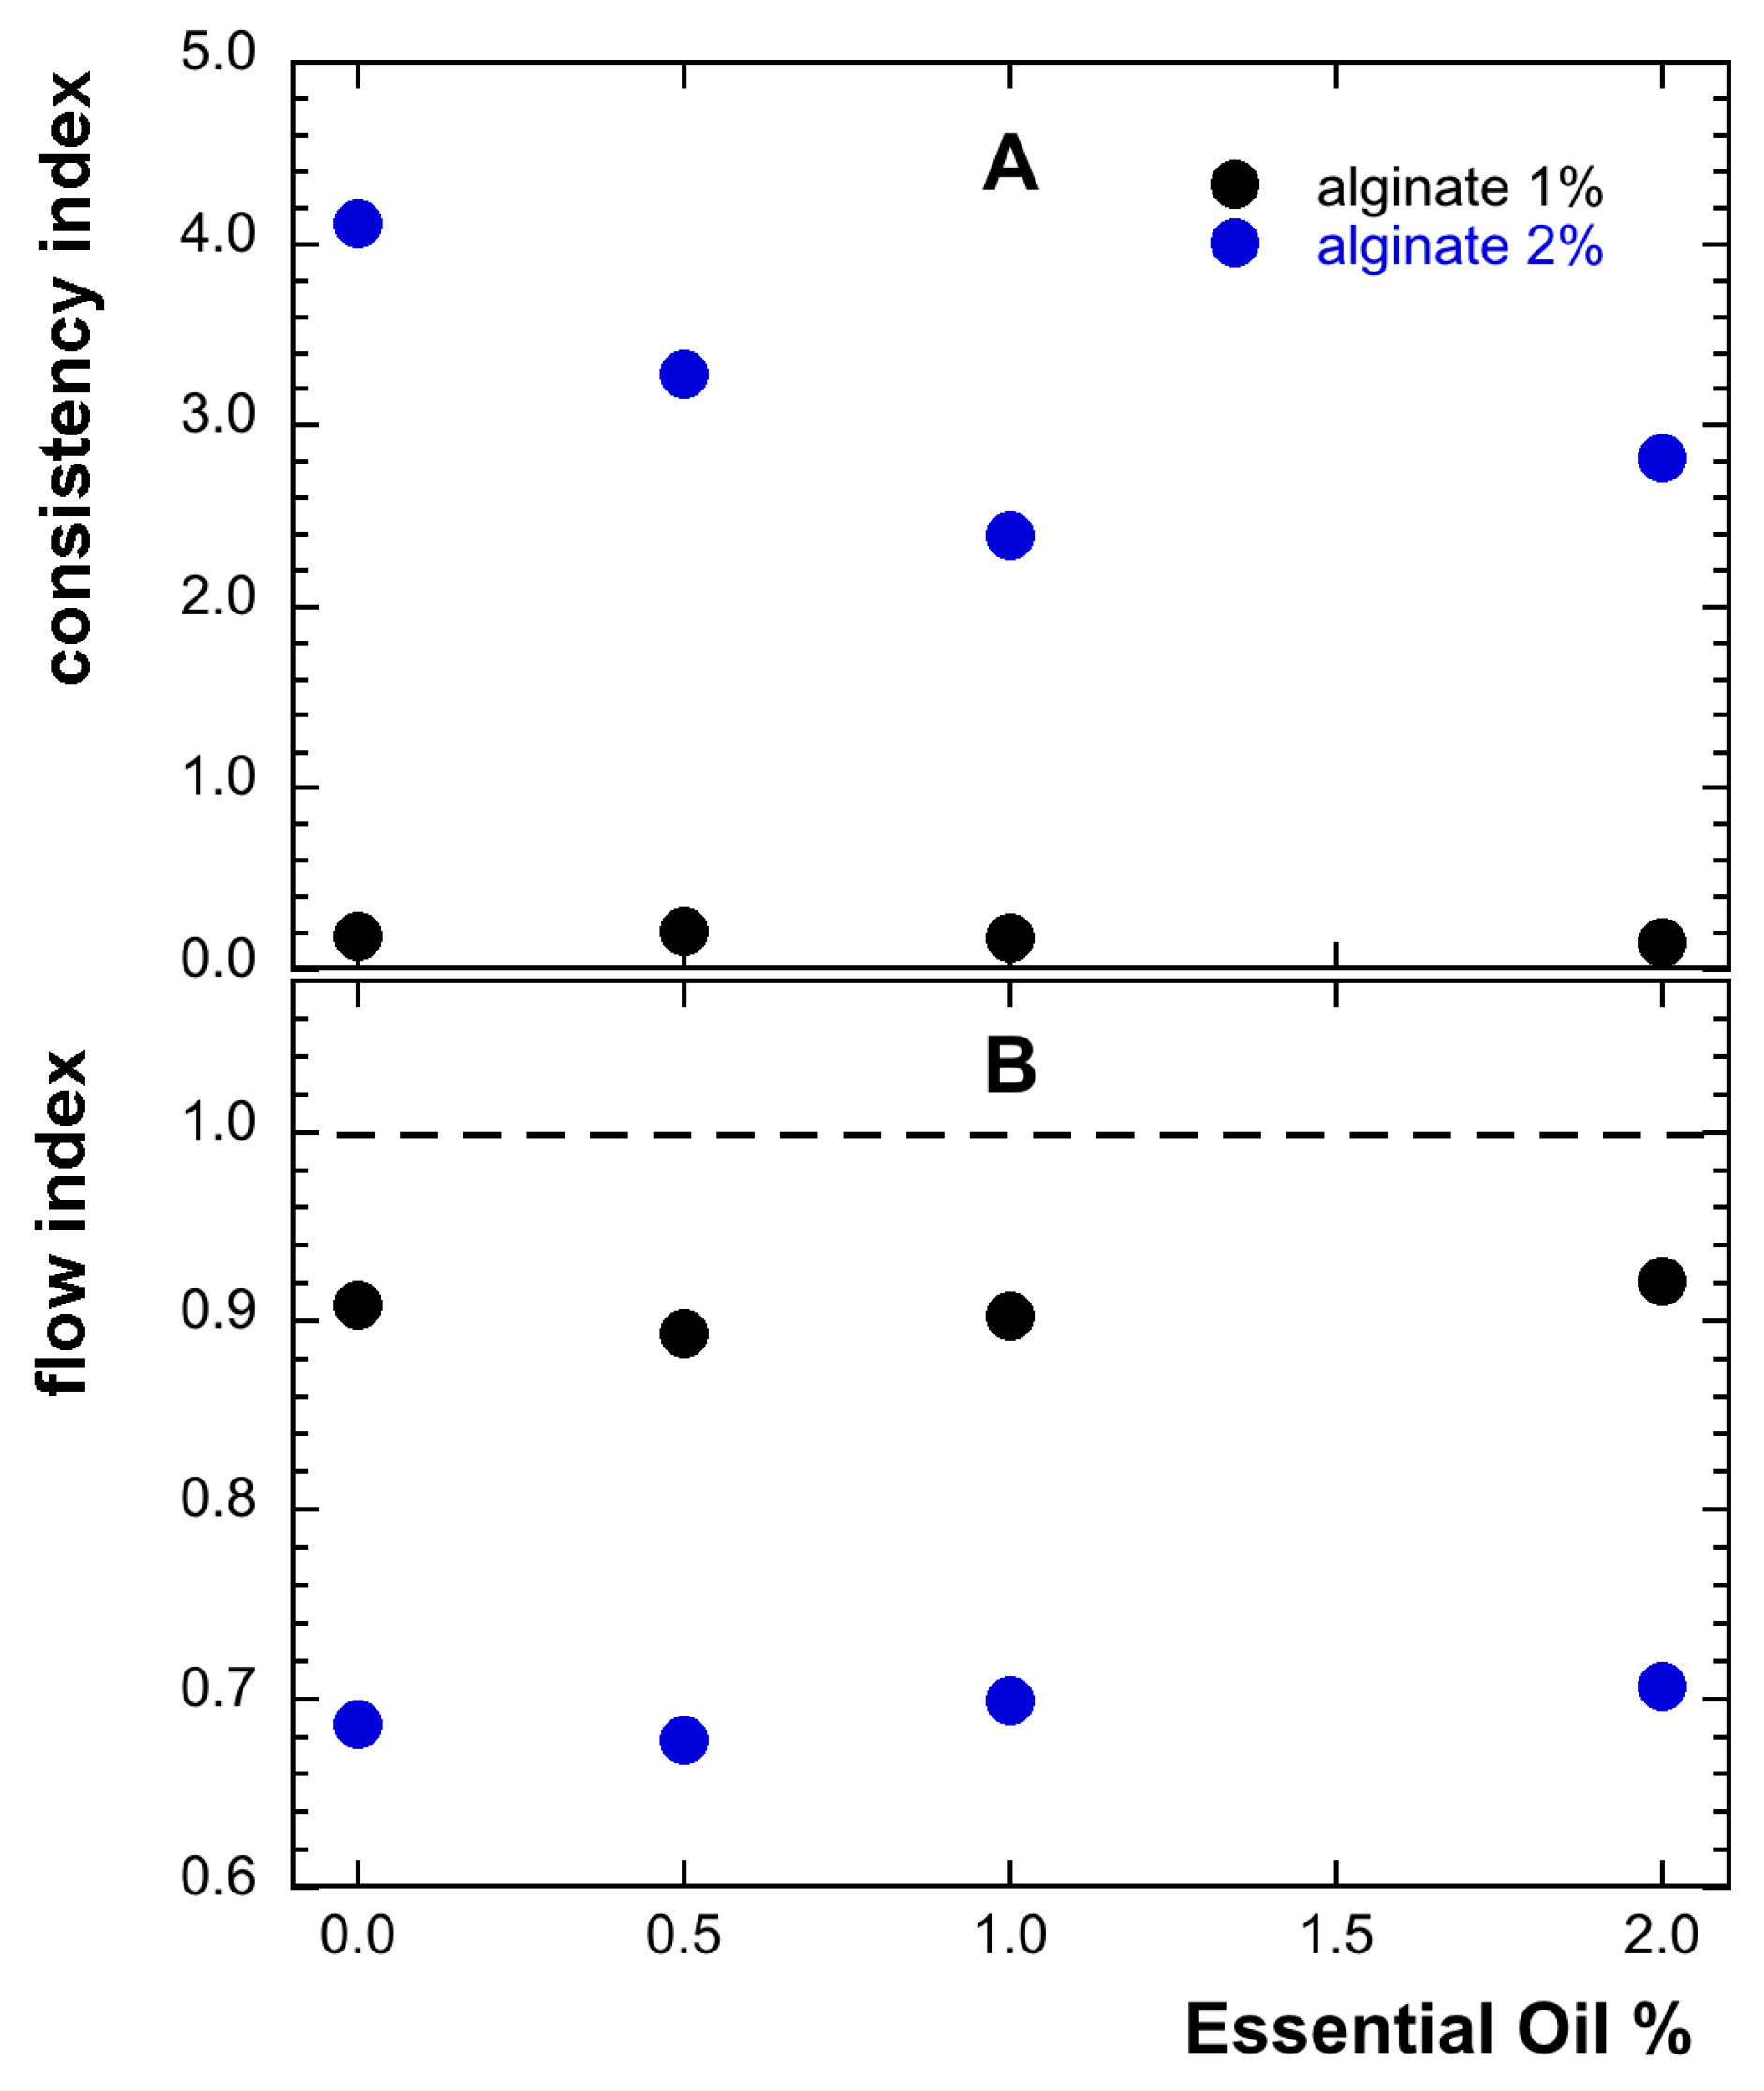
where τ is the shear stress (Pa), is the shear rate (s−1), k is known as the consistency index (Pa × sn) corresponding to the fluid consistency and n as the flow behavior index (dimensionless number). When the value of n equals 1 the fluid behaves as a Newtonian fluid and the consistency index will coincide with the viscosity value, for n values smaller than 1 the fluid is considered a shear thinning or pseudoplastic fluid; for n values higher than 1, the fluid rheogram will show the behavior of a shear thickening or dilatant fluid. The values of the consistency and flow indices, calculated from the flow curve for all the nanodispersion systems at either 1 or 2% of alginate, are shown in Figure 3A,B, respectively. As shown, the flow index values are all smaller than 1, indicating a deviation from the Newtonian behavior that was higher for 2% alginate based nanodispersions. On the other hand, the trend observed for the viscosity values is replicated in the trend seen in the index of consistency values. These values indicate that the flow behavior of the nanodispersions was more influenced by the hydrocolloid concentration than by the oil content. This aspect together with the shear thinning behavior is important since the continuous phase prevents the creaming phenomena.
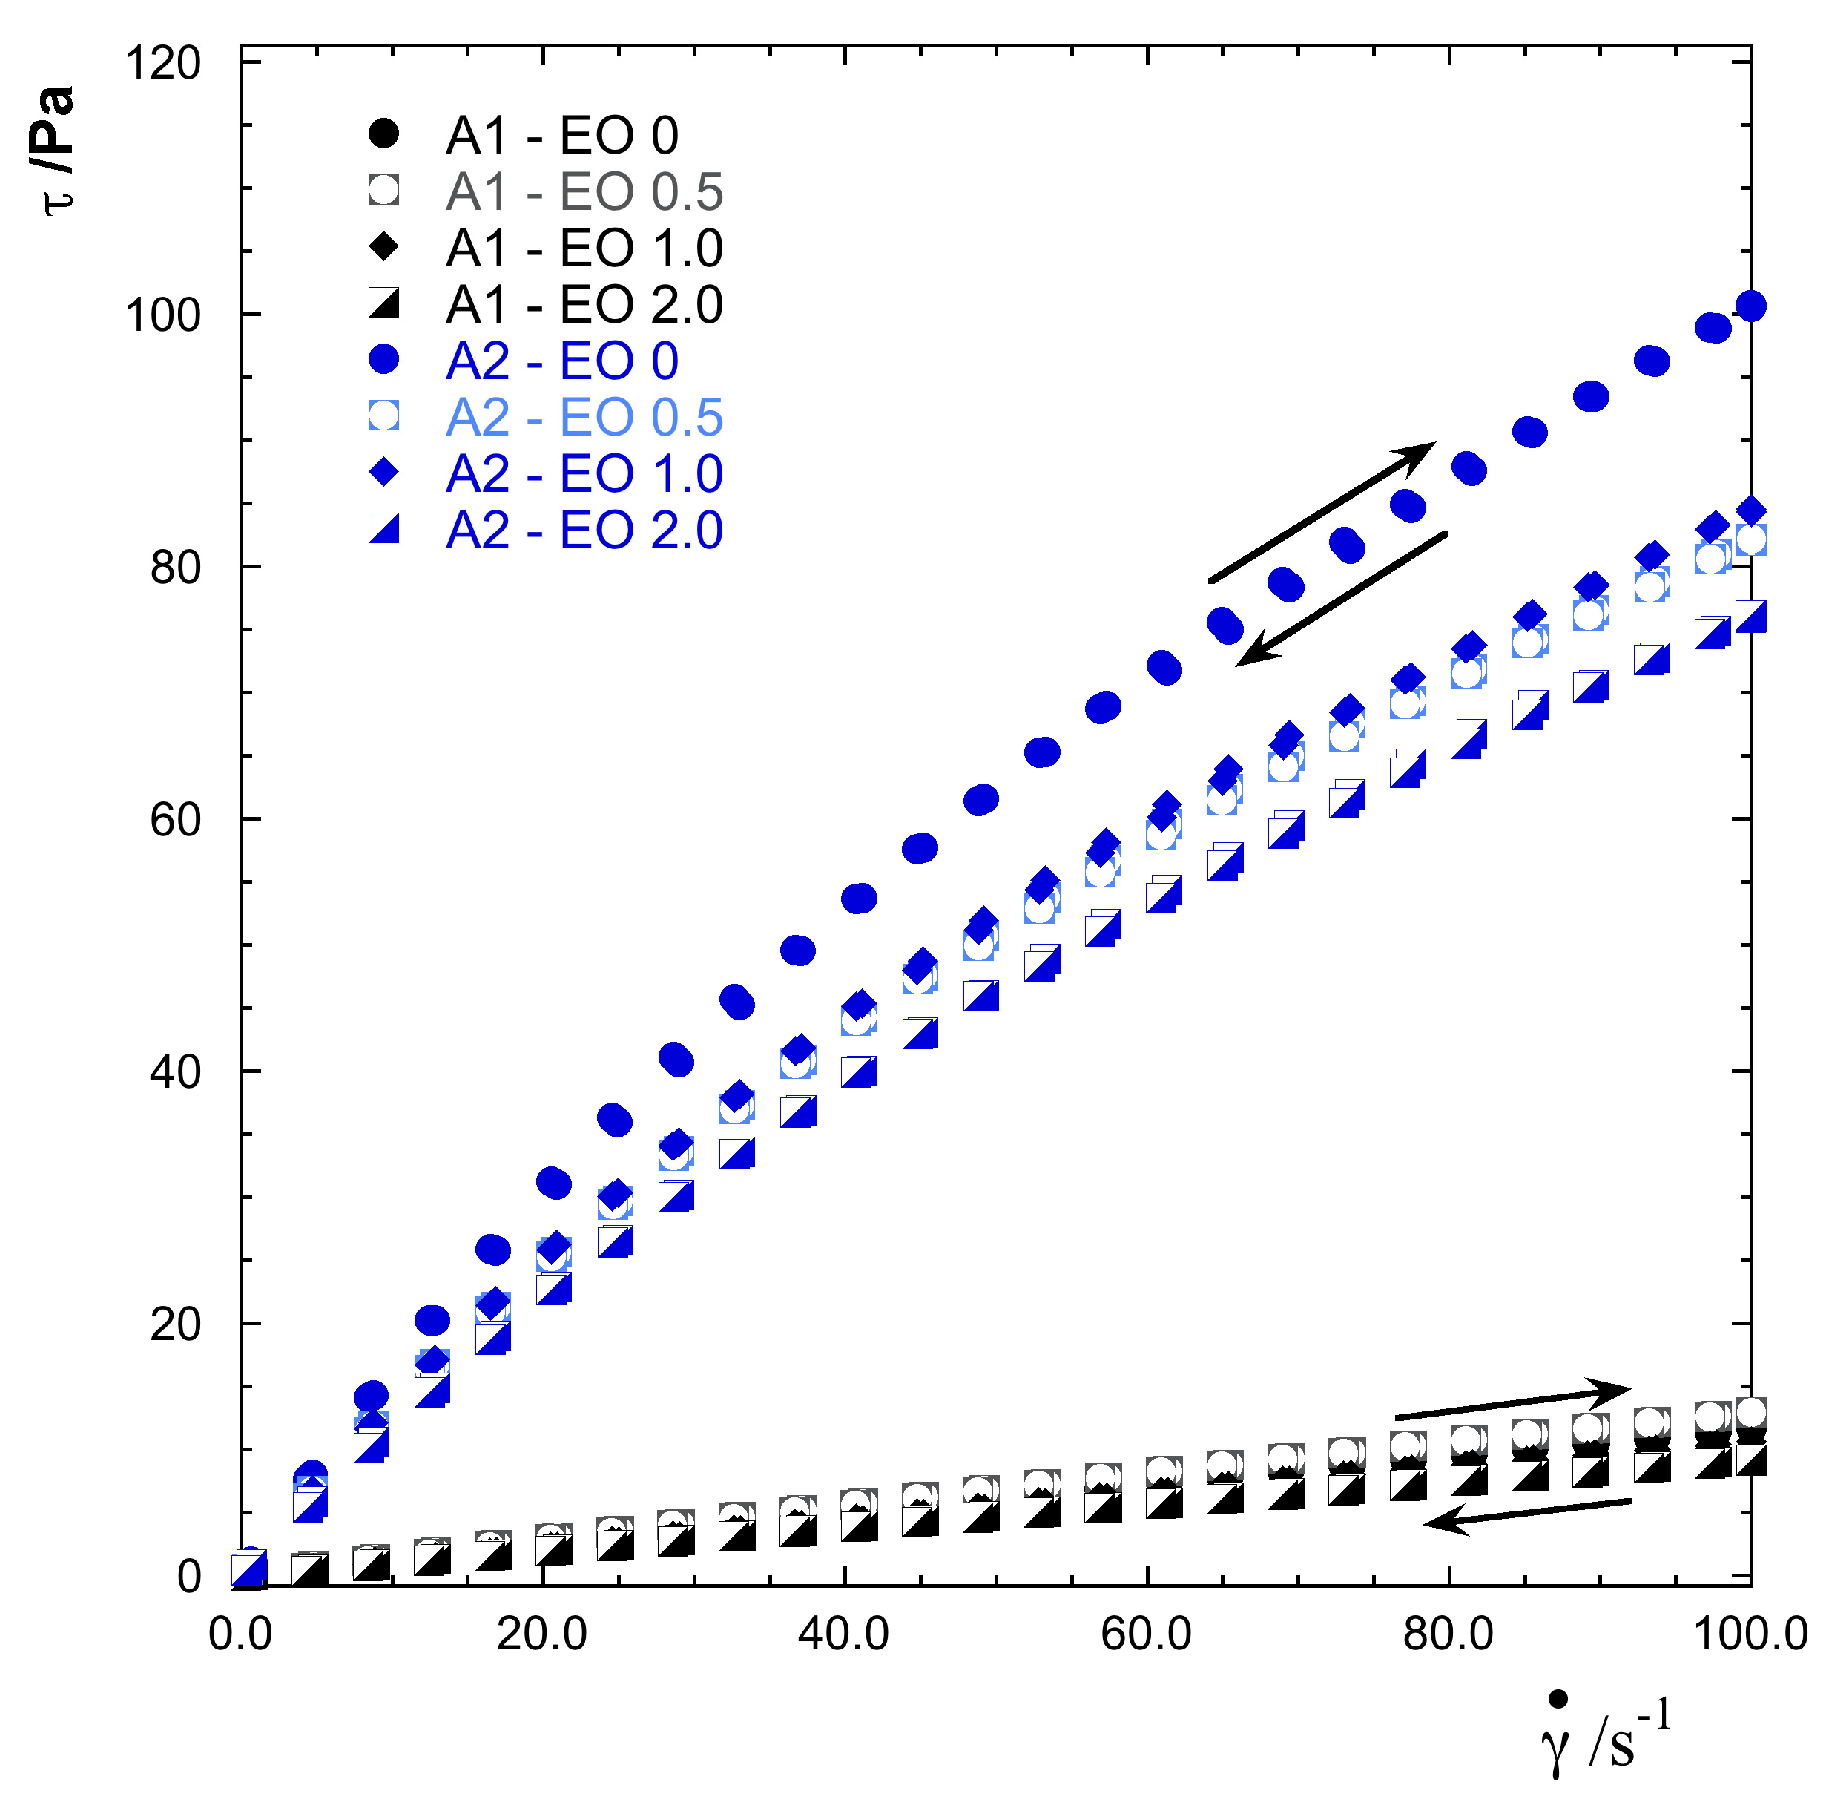
A relevant aspect regarding the handling of fluids is their time dependent behavior that can result in a thixotropic (viscosity decrease) or rheopectic (viscosity increase) response to shearing time. A common method for studying the thixotropic behavior of fluids like paints and coatings is a loop experiment including a Controlled Rate (CR) ramp up from low to high shear rates (structure breakdown), followed by a steady shear rate phase at the highest shear rate and a CR ramp down to a zero shear rate (structure recovery). For thixotropic materials the difference in the area defined by the upward and the backward curve is the hysteresis area that represents the energy to breakdown the fluid structure. A non-thixotropic material would exhibit identical viscosity curves for ramp up and ramp down and therefore no hysteresis area. This kind of material recovers instantaneously from an applied stress or strain. The larger a hysteresis area the more a material is considered as thixotropic. The nanodispersions made of alginate 1% and 2% and essential oil (varying from 0 to 2%) all exhibited slight thixotropic behavior as shown in Figure 4, and therefore it can be claimed that the nanodispersions viscosity is barely time dependent, but it is mostly a function of shear rate and temperature. This means that the nanodispersions have a fast structure recovery. A very similar thixotropic behavior was previously observed on aqueous suspensions of alginate at different concentrations [26].
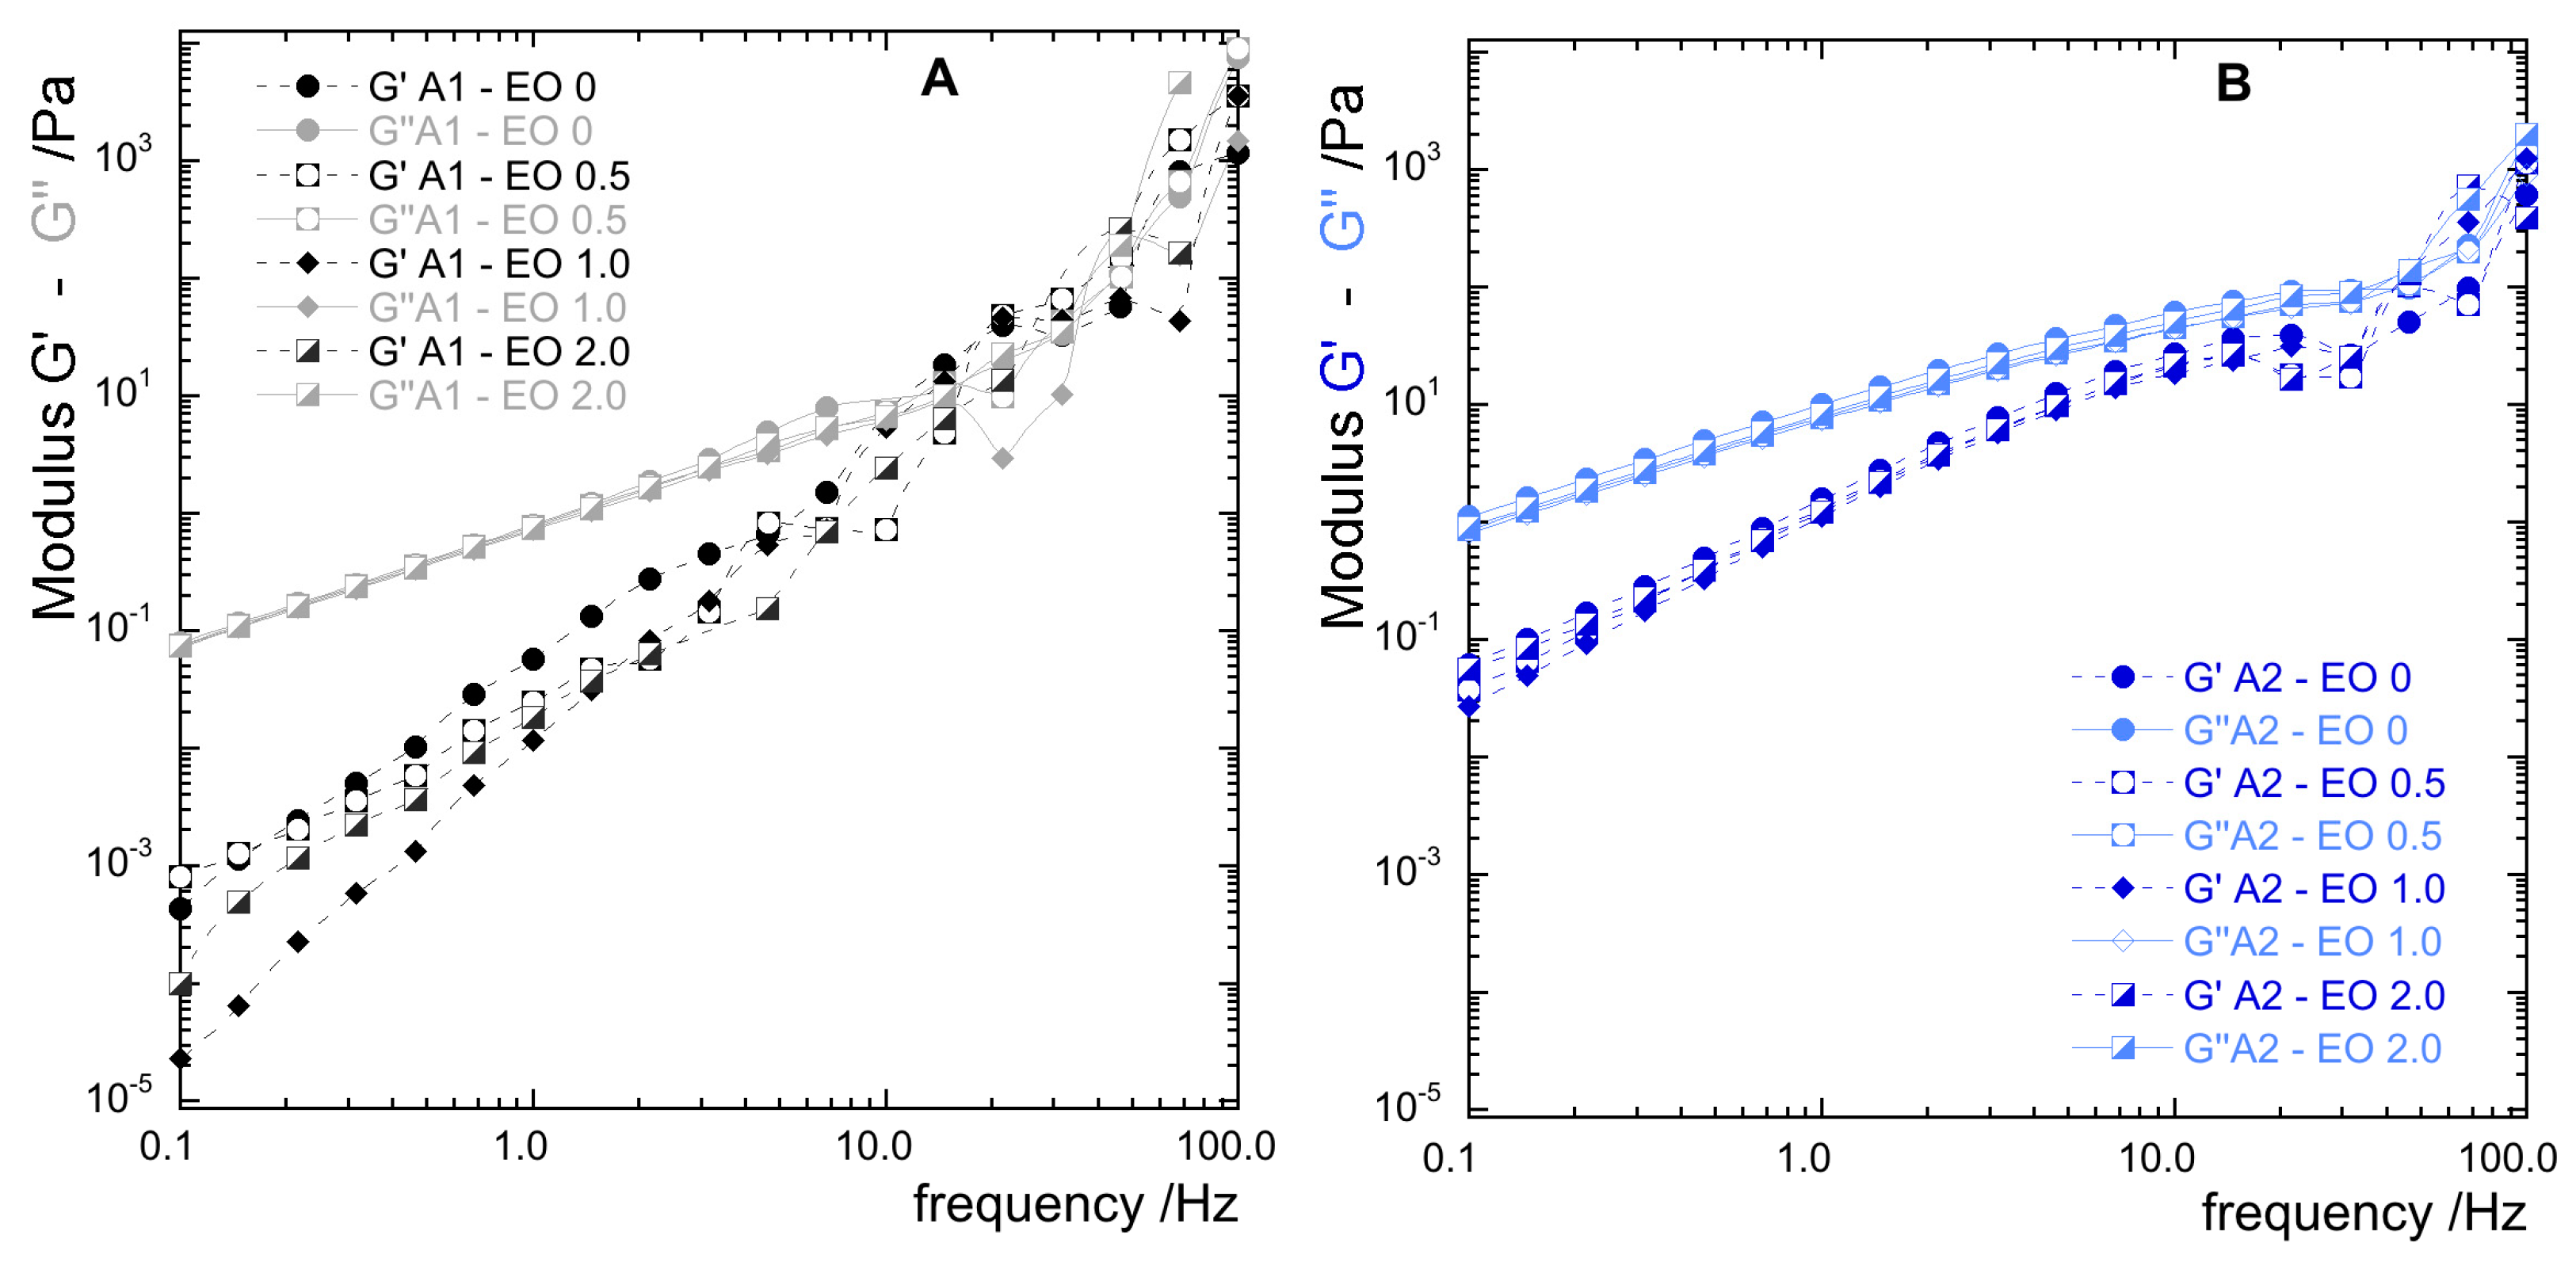
To gain a better understanding of the nanodispersion structures, rheological oscillatory analyses were carried out. Frequency sweep tests, performed within the linear viscoelastic region of each fluid, enabled the determination of the viscoelastic behavior in a frequency range from 0.1 to 100 Hz. As shown in Figure 5A,B, the storage modulus (G’) and loss modulus (G”) were both increasing along with the frequency applied to either 1% or 2% alginate dispersions. The high frequency zone of the mechanical spectra corresponds to short-time behavior that is simulated by the rapid motion, while, the low frequency side, characterized by a slower motion, simulates the long-term behavior. The nanodispersions considered had G” values higher than the G’ values, particularly at low frequencies. Additionally, the G’ and G” moduli approached each other at high frequency, indicating that the viscous-like behavior dominated, even if in the short term, the dispersions become less liquid-like.
By comparing the elastic moduli G’ of nanodispersions prepared with 1% (Figure 5A) and 2% alginate (Figure 5B) it was evident they were more frequency dependent using 1% alginate nanodispersions, showing it provided a more fluid-like material compared with the samples containing 2% alginate.
Overall the rheological investigation on alginate-based nanodispersions has demonstrated that the nanodispersions studied had similar flow properties to the parent alginate suspension free from oil. This shows that the positive features of alginate in the continuous phase were added to the advantages given by the addition of essential oil, with no dramatic modification on the flow behavior.
The practice of coating food products involves the formation of a protective layer on the surface avoiding draining or dripping phenomena to ensure the realization of a continuous film. To achieve this, a step of gelation of the coating on the food surface is usually provided. In this regard, alginate is known for its gelling properties, in the presence of divalent cations (like calcium ions). Therefore, considering the similar properties shown by the alginate and essential oil enriched nanodispersions proposed here, similar gelling aptitudes are also expected for the latter.
4. Conclusions
In this study the rheological and conductometric properties of nanodispersions based on alginate and lemongrass essential oil were determined and analyzed. Different alginate and essential oil concentrations were considered. A small variation on the ionic conductivity was observed by adding up to 2% oil to the alginate suspensions. The flow curves of all the nanodispersions were fitted to the Ostwald de-Waele equation and all the preparations shared a pseudoplastic non-Newtonian behavior that was more evident with the higher alginate concentration (2%).
Through the analysis of thixotropic behavior, it was found that the nanodispersions had the ability to return to their initial structure after the application of a high shear rate. Additionally, through oscillatory frequency sweep tests, the samples showed a similar fluid-like behavior for 1% and 2% alginate nanodispersions. This investigation demonstrates that nanodispersions containing essential oils can be handled like alginate suspensions, with the added value of the benefits offered by the properties of the oils.
Author Contributions
Data curation, M.C. and F.C.; Investigation, M.C., F.C. and F.L.; Methodology, F.C.; Project administration, F.L.; Writing original draft, F.C. and F.L.
Funding
This research received no external funding.
Acknowledgments
This paper was supported by C.S.G.I. (Centre for Colloid and Surface Science-Florence—ITALY).
Conflicts of Interest
The authors declare no conflict of interest.
References
- Tønnesen, H.H.; Karlsen, J. Alginate in drug delivery systems. Drug Dev. Ind. Pharm. 2002, 28, 621–630. [Google Scholar] [CrossRef] [PubMed]
- Tabasum, S.; Noreen, A.; Maqsood, M.F.; Umar, H.; Akram, N.; Nazli, Z.I.H.; Chatha, S.A.S.; Zia, K.M. A review on versatile applications of blends and composites of pullulan with natural and synthetic polymers. Int. J. Biol. Macromol. 2018, 120, 603–632. [Google Scholar] [CrossRef] [PubMed]
- George, M.; Abraham, T.E. Polyionic hydrocolloids for the intestinal delivery of protein drugs: Alginate and chitosan-a review. J. Control. Release 2006, 114, 1–14. [Google Scholar] [CrossRef] [PubMed]
- Cuomo, F.; Lopez, F.; Ceglie, A. Templated globules-Applications and perspectives. Adv. Colloid Interface Sci. 2014, 205, 124–133. [Google Scholar] [CrossRef] [PubMed]
- Cuomo, F.; Ceglie, A.; Piludu, M.; Miguel, M.G.; Lindman, B.; Lopez, F. Loading and protection of hydrophilic molecules into liposome-templated polyelectrolyte nanocapsules. Langmuir 2014, 30, 7993–7999. [Google Scholar] [CrossRef] [PubMed]
- Lee, K.Y.; Mooney, D.J. Alginate: Properties and biomedical applications. Prog. Polym. Sci. 2012, 37, 106–126. [Google Scholar] [CrossRef] [PubMed] [Green Version]
- Qin, Y. Alginate fibres: An overview of the production processes and applications in wound management. Polym. Int. 2008, 57, 171–180. [Google Scholar] [CrossRef]
- Wilson, M.D.; Stanley, R.A.; Eyles, A.; Ross, T. Innovative processes and technologies for modified atmosphere packaging of fresh and fresh-cut fruits and vegetables. Crit. Rev. Food Sci. Nutr. 2017, 1–12. [Google Scholar] [CrossRef] [PubMed]
- Yildiz, F.; Wiley, R.C. Minimally Processed Refrigerated Fruits and Vegetables; Springer: New York, NY, USA, 2017. [Google Scholar]
- Díaz-Mula, H.M.; Serrano, M.; Valero, D. Alginate coatings preserve fruit quality and bioactive compounds during storage of sweet cherry fruit. Food Bioprocess Technol. 2012, 5, 2990–2997. [Google Scholar] [CrossRef]
- Maftoonazad, N.; Ramaswamy, H.S.; Marcotte, M. Shelf-life extension of peaches through sodium alginate and methyl cellulose edible coatings. Int. J. Food Sci. Technol. 2008, 43, 951–957. [Google Scholar] [CrossRef]
- Zapata, P.J.; Guillén, F.; Martínez-Romero, D.; Castillo, S.; Valero, D.; Serrano, M. Use of alginate or zein as edible coatings to delay postharvest ripening process and to maintain tomato (Solanum lycopersicon Mill) quality. J. Sci. Food Agric. 2008, 88, 1287–1293. [Google Scholar] [CrossRef]
- Reis, C.P.; Neufeld, R.J.; Vilela, S.; Ribeiro, A.J.; Veiga, F. Review and current status of emulsion/dispersion technology using an internal gelation process for the design of alginate particles. J. Microencapsul. 2006, 23, 245–257. [Google Scholar] [CrossRef] [PubMed]
- Zambrano-Zaragoza, M.; González-Reza, R.; Mendoza-Muñoz, N.; Miranda-Linares, V.; Bernal-Couoh, T.; Mendoza-Elvira, S.; Quintanar-Guerrero, D. Nanosystems in Edible Coatings: A Novel Strategy for Food Preservation. Int. J. Mol. Sci. 2018, 19, 705. [Google Scholar] [CrossRef] [PubMed]
- Perugini, L.; Cinelli, G.; Cofelice, M.; Ceglie, A.; Lopez, F.; Cuomo, F. Effect of the coexistence of sodium caseinate and Tween 20 as stabilizers of food emulsions at acidic pH. Colloids Surf. B Biointerfaces 2018, 168, 163–168. [Google Scholar] [CrossRef] [PubMed]
- Acevedo-Fani, A.; Salvia-Trujillo, L.; Rojas-Graü, M.A.; Martín-Belloso, O. Edible films from essential-oil-loaded nanoemulsions: Physicochemical characterization and antimicrobial properties. Food Hydrocoll. 2015, 47, 168–177. [Google Scholar] [CrossRef] [Green Version]
- Acevedo-Fani, A.; Soliva-Fortuny, R.; Martín-Belloso, O. Nanoemulsions as edible coatings. Curr. Opin. Food Sci. 2017, 15, 43–49. [Google Scholar] [CrossRef]
- Baldwin, E.A.; Nisperos-Carriedo, M.O.; Baker, R.A. Use of edible coatings to preserve quality of lightly (and slightly) processed products. Crit. Rev. Food Sci. Nutr. 1995, 35, 509–524. [Google Scholar] [CrossRef] [PubMed]
- McClements, D.J.; Rao, J. Food-Grade Nanoemulsions: Formulation, Fabrication, Properties, Performance, Biological Fate, and Potential Toxicity. Crit. Rev. Food Sci. Nutr. 2011, 51, 285–330. [Google Scholar] [CrossRef] [PubMed]
- Małgorzata, J.; Elżbieta, S.; Jan, O. Rheological Properties of Nanoemulsions Stabilized by Polysorbate 80. Chem. Eng. Technol. 2015, 38, 1469–1476. [Google Scholar]
- Pal, R. Modeling the Viscosity of Concentrated Nanoemulsions and Nanosuspensions. Fluids 2016, 1, 11. [Google Scholar] [CrossRef]
- Lundberg, B.; Pan, X.; White, A.; Chau, H.; Hotchkiss, A. Rheology and composition of citrus fiber. J. Food Eng. 2014, 125, 97–104. [Google Scholar] [CrossRef]
- Nijenhuis, K.; McKinley, G.; Spiegelberg, S.; Barnes, H.; Aksel, N.; Heymann, L.; Odell, J. Experimental Fluid Mechanics; Springer: New York, NY, USA, 2007; pp. 711–712. [Google Scholar]
- Ibanoǧlu, E. Rheological behaviour of whey protein stabilized emulsions in the presence of gum arabic. J. Food Eng. 2002, 52, 273–277. [Google Scholar] [CrossRef]
- Lopez, F.; Venditti, F.; Ambrosone, L.; Colafemmina, G.; Ceglie, A.; Palazzo, G. Gelatin microemulsion-based gels with the cationic surfactant cetyltrimethylammonium bromide: A self-diffusion and conductivity study. Langmuir 2004, 20, 9449–9452. [Google Scholar] [CrossRef] [PubMed]
- Ma, J.; Lin, Y.; Chen, X.; Zhao, B.; Zhang, J. Flow behavior, thixotropy and dynamical viscoelasticity of sodium alginate aqueous solutions. Food Hydrocoll. 2014, 38, 119–128. [Google Scholar] [CrossRef]
- Zavaleta-Avejar, L.; Bosquez-Molina, E.; Gimeno, M.; Pérez-Orozco, J.P.; Shirai, K. Rheological and antioxidant power studies of enzymatically grafted chitosan with a hydrophobic alkyl side chain. Food Hydrocoll. 2014, 39, 113–119. [Google Scholar] [CrossRef]
Figure 1.
Ionic conductivity as function of lemongrass essential oil concentration. Nanodispersions having 1% and 2% alginate as continuous phase are represented with black and blue symbols, respectively.
Figure 1.
Ionic conductivity as function of lemongrass essential oil concentration. Nanodispersions having 1% and 2% alginate as continuous phase are represented with black and blue symbols, respectively.

Figure 2.
Apparent viscosity curves of alginate/lemongrass essential oil nanodispersions as a function of the shear rate. Nanodispersions having 1% and 2% alginate as the continuous phase are represented with black (A) and blue (B) symbols, respectively. Insets of (A) and (B) are the flow curves (shear stress as functions of the shear rate) for nanodispersions based on 1% and 2% alginate.

Figure 3.
Consistency index (A) and flow index (B) as function of the nanoemulsion oil content calculated by fitting the nanodispersion flow curves to the Ostwald-de Waele model. Nanodispersions at 1 and 2% of alginate are represented with black and blue dots, respectively.
Figure 3.
Consistency index (A) and flow index (B) as function of the nanoemulsion oil content calculated by fitting the nanodispersion flow curves to the Ostwald-de Waele model. Nanodispersions at 1 and 2% of alginate are represented with black and blue dots, respectively.

Figure 4.
Curves of hysteresis loop at 1% and 2% alginate (black and blue symbols respectively) and essential oil concentration ranging from 0 and 2%.
Figure 4.
Curves of hysteresis loop at 1% and 2% alginate (black and blue symbols respectively) and essential oil concentration ranging from 0 and 2%.

Figure 5.
Dynamical oscillatory frequency sweep test curves for alginate/lemongrass essential oil nanodispersions. Storage modulus (G’) and loss modulus (G”) of 1% alginate nanodispersions (A) are shown with black and grey symbols respectively. G’ and G” of 2% alginate nanodispersions (B) are represented with dark blue and light blue symbols, respectively.

© 2018 by the authors. Licensee MDPI, Basel, Switzerland. This article is an open access article distributed under the terms and conditions of the Creative Commons Attribution (CC BY) license (http://creativecommons.org/licenses/by/4.0/).
Share and Cite
MDPI and ACS Style
Cofelice, M.; Cuomo, F.; Lopez, F. Rheological Properties of Alginate–Essential Oil Nanodispersions. Colloids Interfaces 2018, 2, 48. https://doi.org/10.3390/colloids2040048
AMA Style
Cofelice M, Cuomo F, Lopez F. Rheological Properties of Alginate–Essential Oil Nanodispersions. Colloids and Interfaces. 2018; 2(4):48. https://doi.org/10.3390/colloids2040048
Chicago/Turabian StyleCofelice, Martina, Francesca Cuomo, and Francesco Lopez. 2018. "Rheological Properties of Alginate–Essential Oil Nanodispersions" Colloids and Interfaces 2, no. 4: 48. https://doi.org/10.3390/colloids2040048