Article

Morphological Effect on the Surface Activity and Hydrogen Evolution Catalytic Performance of Cu2O and Cu2O/rGO Composites

1
NanoScience Technology Center, University of Central Florida, Orlando, FL 32826, USA
2
Department of Chemistry, University of Central Florida, Orlando, FL 32816, USA
3
Department of Materials Science and Engineering, University of Central Florida, Orlando, FL 32816, USA
*
Author to whom correspondence should be addressed.
J. Compos. Sci. 2023, 7(9), 403; https://doi.org/10.3390/jcs7090403
Submission received: 24 August 2023 / Revised: 5 September 2023 / Accepted: 14 September 2023 / Published: 20 September 2023
(This article belongs to the Section Composites Applications)

Abstract

:
Different cuprous oxide (Cu2O) particle forms, including the octahedron, truncated octahedron, cube, and star-like forms, are synthesized through chemical reduction under different reaction conditions. The correlation between the morphology and the catalytic activity of hydrogen evolution reactions (HERs) is investigated. It is discovered that the Cu2O particles with a higher 111/100 facets (r) ratio have a higher oxidation resistance and higher activity in HER catalysis, as supported by the density functional theory (DFT) calculation results. This improvement is attributed to the fact that more Cu+ terminated atoms on facet 111 provide more active sites, as measured using their electroactive area, as well as the lower H2 adsorption energy on that facet. To enhance Cu2O’s HER performance, cuprous oxide particles are deposited on reduced graphene oxide (rGO) through a hydrothermal method. XPS and XRD show a CuO layer on the composite surface, which reduces the Cu2O corrosion in the reaction. Overall, Cu2O/rGO composites exhibit a better particle distribution, increased active sites, and improved charge separation. The best electrocatalyst in this study is the Cu2O/rGO with a star-shaped form, with an overpotential of −458 mV. Its improved performance is attributed to the presence of unsaturated active sites with a higher reactivity, such as the edges and corners. SEM studies of this composite after catalysis indicate that Cu2O undergoes structural reconstruction during the reaction and reaches a more stable structure.

Graphical Abstract

1. Introduction

Replacing fossil fuels with more environmentally friendly alternatives requires the development of cost-effective technologies to produce fuels from renewable resources. [1,2]. Estimating the global demand for hydrogen in 2050 reveals an expected demand surpassing 500 Mt, emphasizing the urgency for expanding hydrogen production capabilities [3]. Presently, gray hydrogen, derived from fossil fuel sources, holds a competitive advantage in terms of its cost-effectiveness and well-established production processes, overshadowing green hydrogen, produced from carbon-neutral sources. The primary challenge lies in the relatively high production costs associated with green hydrogen, which currently stand at 4–5 times greater than those of gray hydrogen. These cost disparities can be mitigated through the utilization of scalable and readily available materials, such as oxides and perovskites, derived from abundant metals like iron (Fe), nickel (Ni), cobalt (Co), and copper (Cu).
Cuprous oxide (Cu2O) is one notable water-splitting electrocatalyst for producing hydrogen and has demonstrated remarkable catalytic properties as a solar water-splitting photocathode material. Additionally, it has shown stable activity and minimal structural changes in mechanical catalysis for water splitting [4]. As an efficient and stable photocatalyst for HERs, Cu2O has a theoretical efficiency of 18% [5] based on the air mass (AM) 1.5 standard spectrum [6].
Different methods have been employed to produce Cu2O particles through various formation mechanisms [7,8,9,10,11,12,13,14,15,16,17]. In fact, enhancing Cu2O’s catalytic performance in HERs was achieved via two approaches: tailoring specific facets of Cu2O via crystal engineering [18] and enhancing the electrochemical stability [19,20]. Crystal engineering is particularly intriguing as it allows for the modification of Cu2O particles’ crystalline facets and surface compositions, resulting in different surface reactivities. By selecting appropriate crystalline facets, charge transport can be facilitated, and new active sites can be created [7,21,22]. Although challenging, this approach has been explored to achieve a greater catalytic performance of Cu2O in water splitting [21,23]. To conduct the tailoring, surface etching [10,24] has been used to generate Cu2O with different morphology particles [12]. On the other hand, increasing the electrochemical stability of Cu2O is a critical factor for suppressing photo-corrosion and self-destruction on the electrode in aqueous solutions during HERs [25,26]. Cu2O is a p-type semiconductor with a direct bandgap of 1.90–2.17 eV (652–571 nm) [27]. Corrosion occurs when the electrochemical potential aligns with the Cu2O bandgap potential. To mitigate this issue, a protective shell layer, such as TiO2 to shield the Cu2O core [28,29] or a heterojunction with an n-type semiconductor like ZnO, has been used [30,31]. In addition, improving the charge transport between Cu2O and the electrode can also enhance the performance of the copper oxide. To improve the electric mobility, reduced graphene oxide (rGO), an electron-rich material, can be attached, leading to excellent electrochemical performance [32,33,34,35,36]. Reduced graphene oxide (rGO) is produced through the oxidation of graphite followed by a reduction [37]. rGO possesses a two-dimensional structure with sp2 hybridization, enabling electron movement within the 2D-sheet. Several composites comprising Cu2O and rGO have been synthesized for various applications [31,33,34,38,39,40,41,42,43,44], especially as promising catalysts in water splitting [32]. These composites exhibit improved stability, longevity, and efficiency, making them highly desirable for advancing the field of water splitting.
This study focuses on investigating the impact of Cu2O particle morphology and the incorporation of rGO on HER catalytical efficacy. Cu2O particles with diverse morphologies were synthesized, and their electrochemical activity was evaluated to optimize HER performance. The different geometries and shapes of the particles led to the emergence of distinct facets, which influenced the reactivity variations. Specifically, two facets, 111 and 100, were considered in this research. Changes in Cu2O morphology resulted in different ratios of these two facets and yielded varying electrochemical activities. Additionally, Cu2O@rGO composites were produced to create an effective catalyst. In this structure, rGO sheets wrapped the Cu2O particles, offering several beneficial effects such as enhanced chemical stability, improved conductivity, and efficient charge separation. The developed Cu2O@rGO composite exhibited significant improvements compared to bare Cu2O. These enhancements included a larger electroactive area, higher electrochemical stability, better particle distribution, and improved ohmic contact. Overall, this study demonstrates that tailoring Cu2O particle morphology to achieve specific facet ratios, along with the incorporation of rGO to form an electrochemically stable composite, can lead to a notable enhancement in HER catalytic activity.

2. Materials and Methods

2.1. Reagents

Copper (II) chloride dihydrate (CuCl2•2H2O, 99%, Acros organics), copper (II) acetate monohydrate (Cu(CH3COO)2•H2O, Acros organics), D-(+)-Glucose (C6H12O6, 99.5%, Sigma Aldrich, St Louis, MI, USA), potassium hydroxide (KOH, 85.8%, Fisher Chemical, Fair Lawn, NJ, USA) polyvinylpyrrolidone (PVP, molecular weight 40,000, (C6H9NO)x, Sigma Aldrich), and ethanol (CH3CH2OH, 99.8%, Sigma Aldrich) were used in the Cu2O particle synthesis. Sulfuric acid (H2SO4, 98%, Fisher Chemical), o-phosphoric acid (H3PO4, 85%, Fisher Chemical), graphite (325 mesh, Alfa Aesar, Haverhill, MA, USA), potassium permanganate (KMnO4, 99%, J.T. Maker, Phillipsburg, NJ, USA), hydrochloric acid (HCl, 36%, Fisher Chemical), and hydrogen peroxide (H2O2, 99%, J.T. Baker) were used in the graphene oxide synthesis. Hydrazine monohydrate (N2H4•OH, 98%, TCI America, Portland, OH, USA) was used in the graphene oxide reduction. Nafion D520 (5%, Sigma Aldrich) was used for the working electrode preparation. Potassium ferricyanide (K3Fe(CN)6, 99%, Acros organics, Fair Lawn, NJ, USA) and potassium chloride (KCl, 99%, Fisher chemical) were used in the electroactive surface area test. Deionized water further purified using the Thermo Scientific Barnstead Nanopure water purification system, with a resistivity around 18 MΩ·cm, was used for the solutions and for the electrochemical measurements.

2.2. Cu2O Microparticle Synthesis

Cu2O particles were produced using the chemical reduction method. To produce octahedral particles [8], CuCl2•2H2O was dissolved in 50 mL of water under stirring to obtain a 5 mmol aqueous solution. Then, 10 mL of 3 M KOH was added dropwise into the solution until a blue precipitation was formed. The suspension was stirred for 5 min. Subsequently, 0.2 g of glucose was introduced into the mixture to initiate the chemical reduction process, which involved a two-step temperature ramping. The solution was heated from room temperature to 70 °C for 15 min, followed by an additional 15 min of aging at the same temperature. Subsequently, the solution was allowed to cool down to room temperature, and a reddish solid was observed to settle at the bottom of the vessel. The red precipitate was purified via centrifugation (5000 rpm for 2 min) with successive washing with water and anhydrous ethanol, repeated three times. The reddish solid was transferred into a watch glass and placed into a vacuum oven at 50 °C for 8 h. Controlling the drying conditions was essential to prevent the oxidation of the Cu2O particles. The octahedral particle route was taken as a reference to produce particles with different shapes.
The modified reaction conditions to obtain various shapes of Cu2O particles are summarized in Table S1. To obtain truncated octahedron particles, CuCl2•2H2O was replaced with Cu(CH3COO)2•H2O in the octahedron route [15]. To obtain cubic particles [16], the temperature was raised to 70 °C before the addition of KOH. In addition, the aging time was increased to 30 min and the rest of the steps in the octahedron route were performed at this temperature. Adding 1.38 g of PVP before the copper chloride solution in the cubic particle route produced truncated the octahedron Cu2O-PVP particles [10]. To obtain the star-like particles [13], an ethanol 50% (v/v) solution was used as a medium. Indeed, 30 mL of anhydrous ethanol and 20 mL of water were mixed, and the temperature was raised to 80 °C, instead of 70 °C, and the octahedron particle route was followed. The shape of the Cu2O particles is presented using abbreviations in the article. O represents octahedron, C represents cubic, TO represents truncated octahedron and S represents star-like.

2.3. rGO Synthesis

Graphene oxide was obtained via the oxidation of graphite, as reported in our previous work [45]. The GO was recovered from the centrifuge as a gel and was frozen at −30 °C for 24 h. A GO aerogel was obtained via lyophilization using a Labconco freeze-drying chamber, set at 0.077 mbar and −38 °C [46]. The GO was reduced through a hydrazine reduction method [47]. The GO aerogel was placed in a 15 mL corning falcon tube, which was put into a sealed Erlenmeyer flask. The vapor produced from an aqueous hydrazine solution was pumped into the flask for about 3 h, reducing the light brown aerogel. Hydrazine was carried by a nitrogen gas flow at 6 bubbles/sec (≈3 cm3/s), and the temperature was controlled using an oil bath at 100 °C.

2.4. Cu2O@rGO Composites Synthesis

An aqueous dispersion of 1 mg/mL of rGO was mixed with the synthesized Cu2O particles in a 1:1 Cu2O/rGO mass ratio. The mixture was stirred on a vortex mixer at 3000 rpm for 1 min, where a reddish-brown homogeneous solution was obtained. The solution was added into a 25 mL polytetrafluoroethylene-lined vessel and then into a hydrothermal reactor. The reactor was placed in an oven, and the temperature was kept at 160 °C for 24 h. The mixture was cooled down to room temperature and centrifuged at 8000 rpm for 7 min. The solution was decanted, and the solid was frozen on dry ice for 1 h in a plastic cuvette and placed in a lyophilizer for 24 h to obtain Cu2O@rGO composites [48].

2.5. Characterization Techniques

X-ray diffraction (XRD) was performed with the PANalytical Empyrean diffractometer with Cu Kα1 radiation (λ = 1.5406 Å). X-ray photoelectron spectroscopy (XPS) was performed with the Thermo Scientific ESCALAB Xi+ X-ray photoelectron spectrometer microprobe, Rochester, NY, USA. Scanning electron microscopy (SEM) was performed with the Zeiss ULTRA-55 FEG, and transmission electron microscopy (TEM) with the JEOL TEM-1011 electron microscope. Ultraviolet–visible (UV-Vis) reflectance mode measurements were obtained with the Thermo Scientific Evolution 200 spectrophotometer with an integration sphere accessory. Photoluminescence (PL) measurements were performed with the Horiba Nanolog FL3-11 fluorescence spectrometer with a PMT detector, with an excitation wavelength of 400 nm.

2.6. Hydrogen Evolution Electrocatalysis

The electrochemical performance of the Cu2O particles and the Cu2O@rGO aerogel was measured with a CHI6600D electrochemical workstation, using a typical three-electrode system. The working electrode was prepared as follows: 2 mg of the desired solid was dissolved in a mixture of 80 µL of ethanol and 20 µL of Nafion. The solution was sonicated for 20 min to ensure that all the solid was dispersed in the medium. Then, 2 µL of the dispersion was cast onto a glassy carbon electrode (GCE) surface, and was air-dried for at least 30 min. The surface density of the working electrode coating was 0.55 mg/cm2. The counter and reference electrodes were a platinum foil and a Ag/AgCl/saturated KCl electrode, respectively.
The linear sweep voltammetry (LSV) was recorded at a scan rate of 5 mV/s with 95% iR-compensation. The electrolyte solution was 0.5 M H2SO4, and the potential ranged from −200 mV to −900 mV. All the measured potentials were calibrated using Equation (1).
E(RHE) = EAg/AgCl + 0.2 + 0.059 pH
The geometrical area of the GCE electrode of 0.071 cm2 was used as the reference for all measurements, and the current was expressed as density current (mA/cm2). To evaluate the long-term stability of the photocurrent generated on the catalyst surface, chronoamperometry (CA) was used. Measurements were performed at a current density of approximately 10 mA/cm2, with 95% iR-compensation and under constant stirring.
Electrochemical impedance spectroscopy (EIS) was performed within a frequency range from 10−2 to 105 Hz at 0 V vs. the reversible hydrogen electrode (RHE) to inquire about the charge-transfer kinetic. To evaluate the electrochemical performance, the electroactive surface area (ESA) was determined using the Randles–Sevcik equation (Equation (2)) [49]:
Ia = 2.69 × 10⁵ × A × D1/2 × n3/2 × v1/2 × C
where Ia is the anodic peak current, n is the electron transfer number, A is the ESA of the electrode, D is the diffusion coefficient, C is the concentration of redox species, and v is the scan rate. The fresh catalyst was supported on the GCE, and the usual three-electrode system was used to perform the ESA analysis. A solution of 2 mM of K3Fe(CN)6 and 0.1 M of KCl was used as a redox species and supporting electrolyte, respectively, at scan rates from 10 to 150 mV s−1. The linear relationship between the oxidation current responses and the square root of the scan rate was used to calculate the ESA. The electron transfer number was taken as n = 1 and the diffusion coefficient was taken as D = 1.65 × 10⁻⁵ cm2 s−1.

2.7. Compactional Details

All calculations were performed by employing density functional theory with the Perdew–Burke–Ernzerho functional [50]. The projector-augmented wave (PAW) method [51] was used to describe the pseudopotential, and the plane wave basis set was expanded with a 50 Ry and 500 Ry kinetic energy cutoff and charge density cutoff, respectively. For the treatment of the coulomb interaction of Cu’s 3d electrons, the DFT + U method [52] was applied with a U value of 7.0 eV. The DFT-D3 method of Grimme correction [53] was employed to account for long-range interactions. All calculations were conducted within the Quantum espresso 7.2 package [54,55], and the calculated results were visualized using VESTA 3.5.7 software [56].
To obtain the oxygen-terminated Cu2O (111) surface, we first simulated and fully relaxed the bulk Cu2O, and then extracted the (111) surface from the relaxed bulk structure. The resulting 6-layer 1 × 1 surface consisted of 36 atoms, with the lattice parameter of a = b = 6.04 Å. For the Cu2O (100) surface, we used the oxygen-terminated 1 × 1 module, as proposed by Soldemo et al. [57] A 15 Å vacuum layer along the z-direction was introduced for both the (111) and (100) surfaces. A k-point mesh of 5 × 5 × 1 was employed for both surfaces. Previous research has shown that magnetism does not affect the energy calculations [58]; therefore, no spin-polarized calculation was considered in the DFT calculations. The H2 adsorption energy was calculated using Equation (3):
Ead = EH2 + slab − Eslab − EH2

3. Results and Discussion

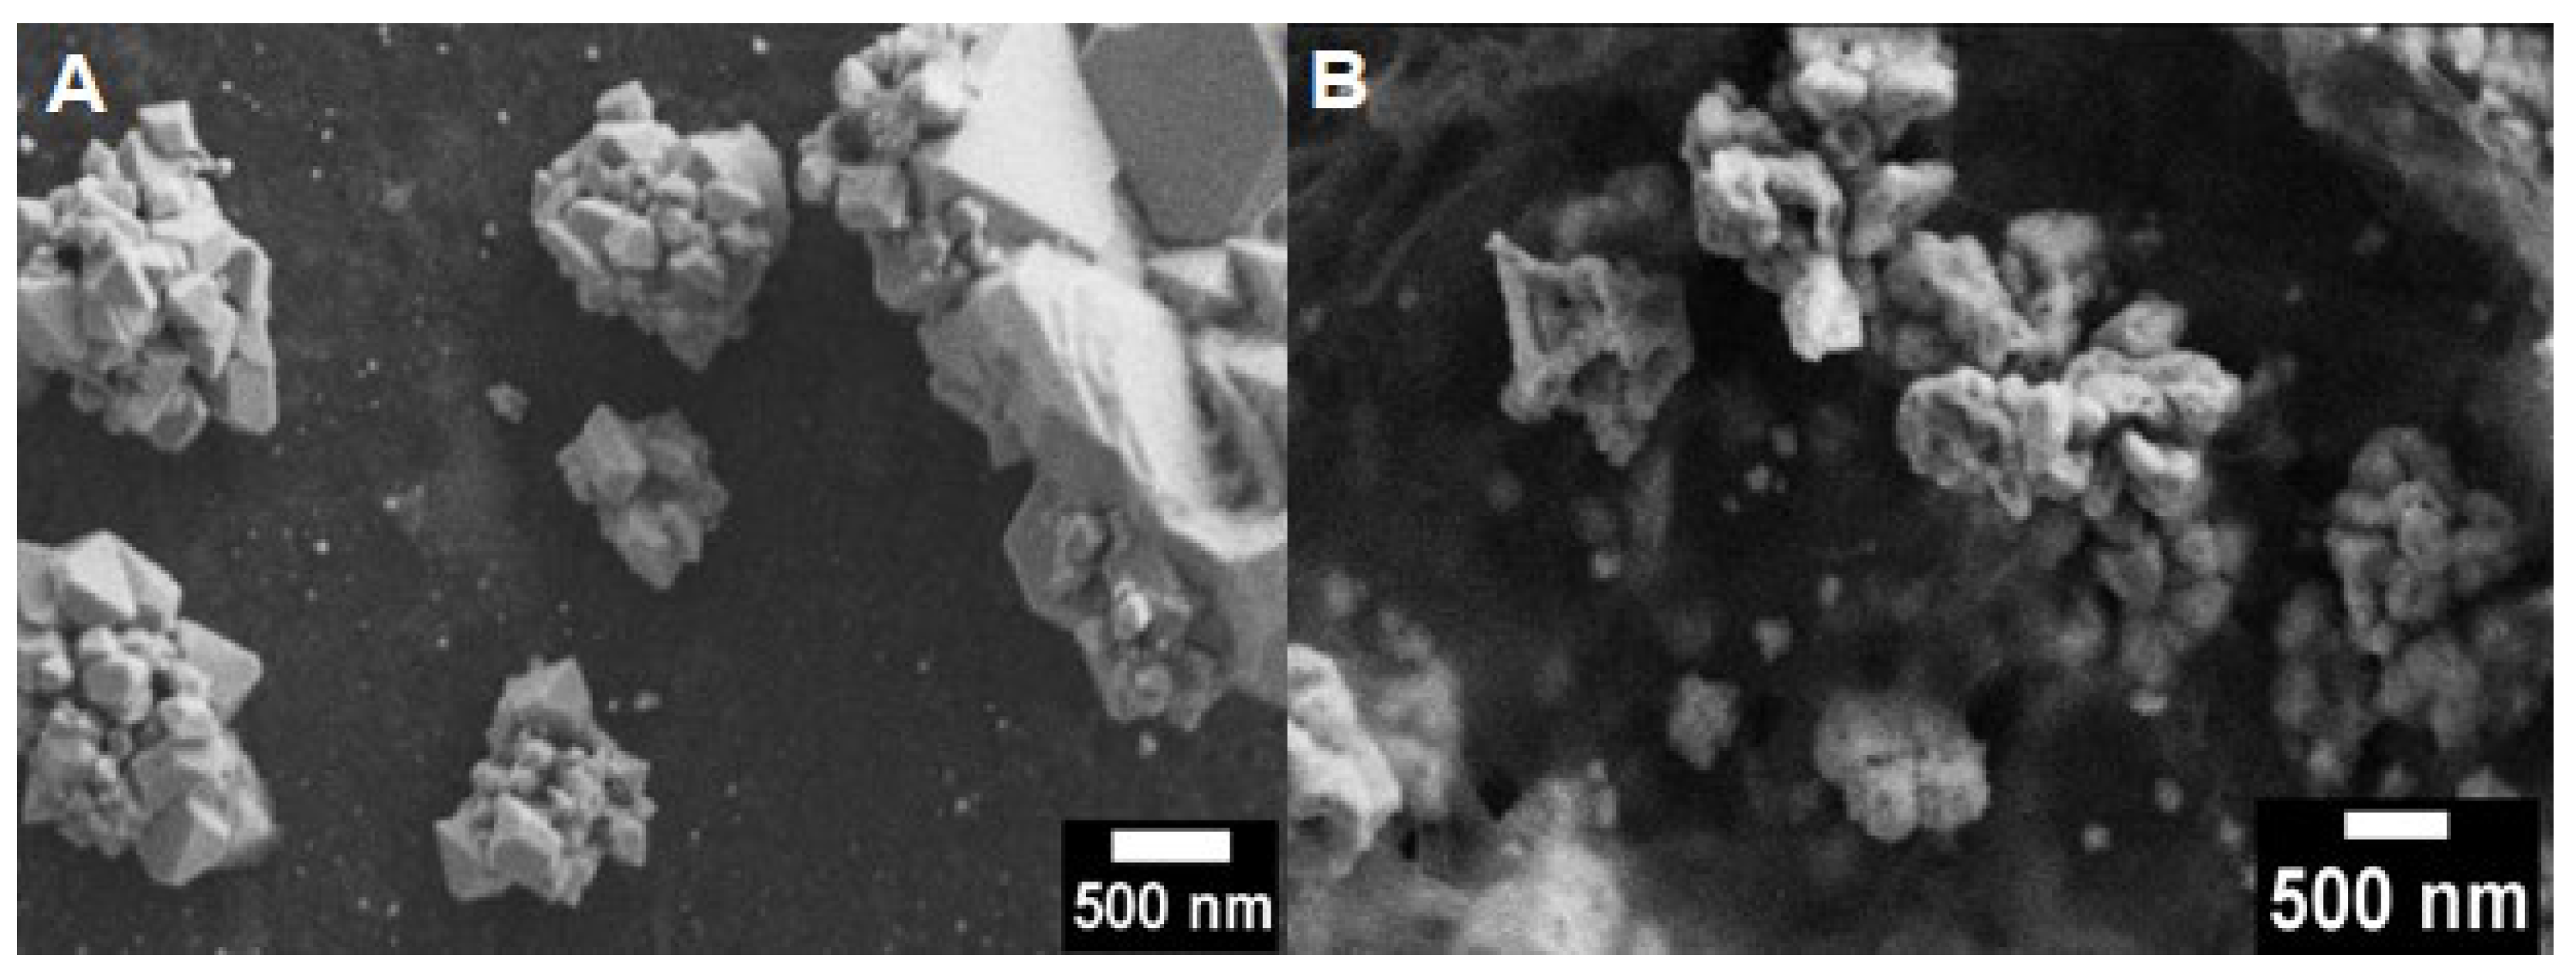
3.1. Morphology of Cu2O Particles and Cu2O@rGO

Various conditions were used to obtain the desired geometric shapes of Cu2O particles, including temperature, the addition of a capping agent, a different precursor anion, and ethanol as a medium. Consequently, five distinct geometric particles were produced and investigated in this study. Table 1 presents the values for the average particle size and 100/111 facet ratio for each Cu2O particle. These two parameters were computed using the ImageJ software. To determine the particle size, we measured the length of the edges of a minimum of 100 particles and calculated the average. Furthermore, we measured the area of both facets of the individual particles to obtain the 100/111 facet ratio. This measurement was repeated for at least 20 particles to obtain an average value for r. Figure 1a provides a 3D illustration of these particles, highlighting facets 111, 110, and 100. O represents octahedron, C represents cubic, TO represents truncated octahedron and S represents star-like. Among the particles, O-Cu2O, TO-Cu2O, and S-Cu2O had a higher content of facet 111, whereas C-Cu2O and TO PVP-Cu2O displayed a higher proportion of facet 100. It is worth noting that the scale size of the particles in Figure 1 may not correspond exactly to the sizes mentioned in Table 1.
The formation of octahedral particles (Figure 1b) predominantly composed of facet 111 can be attributed to the presence of hydroxylated complex precursors, as shown in Equations (4)–(6). The surface energy of facet 111 tends to decrease under high-temperature conditions and in the presence of chloride ions [8]. Facet 111 of cuprous oxide exposes Cu atoms with dangling bonds, resulting in positive charges that are subsequently stabilized by chloride anions. This stabilization mechanism imposes restrictions on particle formation, specifically for the octahedral shape, leading to an average particle size of 2.0 ± 0.5 µm.
Cu2+(aq) + 2 OH(aq) → Cu(OH)2(s)
Cu(OH)2(s) + 2 OH(aq) → [Cu(OH)4]2−(aq)
2[Cu(OH)4]2−(aq) + C6H12O6(aq) → Cu2O(s) + C6H12O7(aq) + 4OH(aq) + 2H2O
To reduce the stabilization effect on facet 111, the chloride anions were substituted with acetate ions [15]. The lower adsorption of acetate anions resulted in a decreased ability to stabilize the positive copper atoms compared to the chloride anions, as acetate ions have a weaker polarizing effect. Consequently, the growth of facet 100, which possesses lower energy, was favored. This led to the formation of truncated octahedral particles (Figure 1c) with an average size of 1.1 ± 0.3 µm. Furthermore, the particle exhibited a 100/111 facet ratio of 0.09. Both the chloride and acetate anions served as internal capping agents during the particle formation process.
On the other hand, when the initial temperature was raised from room temperature to 70 °C, a direct transition from Cu2+ to CuO was suggested [16], as shown in Equations (7) and (8). The elevated reaction temperature caused the decomposition of the Cu(OH)2 precursor to differ from the formation of the octahedral particles at room temperature. As evidence of this transformation, a blackish-blue color was observed upon the addition of hydroxide to the system. With the presence of this precursor, a distinct formation mechanism emerged, and the adsorption of the chloride anions failed to stabilize the surface energy of facet 111. Consequently, the predominant facet became facet 100, resulting in the formation of cubic particles [16] (Figure 1d) with a size of 1.1 ± 0.1 µm.
Cu2+(aq) + 2 OH(aq) → CuO(s) + H2O
2CuO(s) + C6H12O6(aq) + OH(aq) → Cu2O(s) + C6H11O7(aq) +H2O
To stabilize the energy of facet 111 in the synthesis of the cubic particles, PVP, a capping agent [10] was introduced to the reaction mixture. By using PVP of an appropriate molecular weight and concentration as a capping agent, truncated octahedral particles with a size of 1.0 ± 0.3 µm and a facet ratio of 0.26 (Figure 1e) were synthesized. The adsorption of PVP onto facet 111 served to stabilize this facet and achieve a balanced presence of both the 111 and 100 facets in the final particle structure. Despite the similar size to the previous truncated octahedra, a larger area of facet 100 was observed, as indicated by the 100/111 ratio in Table 1. Furthermore, the size of the square edges closely approached that of the hexagonal edges, almost forming regular hexahedrons on facet 111.
Lastly, star-like particles (Figure 1f) were obtained via the selective etching oxidation [7,13,17] of facet 111 of the octahedra using ethanol as the medium, as shown in Equation (9).
2Cu2O(s) + O2(aq) + 4H2O → 4Cu2+(aq) + 8OH(aq)
Ethanol was found to facilitate the accessibility of oxygen to facet 111 of the octahedra, resulting in hexapod-like particles through surface etching. The formation of the particular shape is also attributed to ethanol’s lower surface tension compared to water [16]. Additionally, when the aging temperature reached 80 °C, sufficient thermal energy was transferred to the system, triggering a self-organizing branching growth [15]. Consequently, square-based truncated pyramids began to develop on the surface of the hexapod, leading to the ultimate formation of a star-like structure with an average size of 2.4 ± 0.5 µm. In addition, this etching process did not induce a significant oxidation or reduction of the Cu2O, but rather caused a crystal restructuring, thereby creating more active sites at the edges and corners of the Cu2O [7,12,22].
To support the proposed nucleation mechanism, star-like particles were synthesized at 70 °C, wherein only facet 111 underwent etching, as shown in Figure S1. Conversely, no self-organization growth was observed. Furthermore, an additional control experiment was conducted at an initial reaction temperature of 70 °C. This higher temperature led to the rapid evaporation of ethanol within the initial minutes of the reaction, subsequently suppressing the diffusion of oxygen assisted by ethanol. Consequently, the nucleus of the Cu2O started to form through the same mechanism as the octahedron synthesis, resulting in the generation of regular octahedra without any evident surface etching (Figure S2). The average size of all Cu2O geometric particles is listed in Table 1.
As per the principles of Wulff construction [15], the type of preferential face on a particle’s surface is determined by minimizing their surface energies. Such a process influences the crystal’s growth pattern and final shape. Faces with higher energy levels exhibit faster initial growth, but eventually reach a point where the growth slows down and stops. On the other hand, the faces with lower surface energy levels tend to grow more gradually and persist as the dominant surface face throughout the nucleation process.
The XRD patterns in Figure 1g correspond to the standard cubic structure of Cu2O (JCPDS Card No. 05-0667) [6] and indicate the absence of impurities or other copper phases such as Cu (0) and CuO in the geometrical Cu2O particles. The chemical reduction method employed to obtain cuprous oxide resulted in polycrystalline particles. The relative intensity of the diffraction planes is provided below in descending order: The (111) plane exhibited the highest intensity among all planes, even in particles with a preferential facet 100. Subsequently, the (200) and (220) planes exhibited comparable intensities. This implies that the (100) and (110) planes were still present in the cuprous oxide particles. Furthermore, the (311) plane displayed greater complexity, while the (222), (110), and (211) planes exhibited very low intensities. These findings are consistent with the crystalline planes achieved through the chemical reduction method [8,10,13,14,15,16].
Notably, the intensity of the crystalline planes varied between the geometric particles. The particles with a higher content of facet 111 (O-Cu2O, TO-Cu2O, and S-Cu2O) exhibited the highest crystallinity, whereas the particles with a higher content of facet 100 (C-Cu2O and TO PVP-Cu2O) had the lowest crystallinity under the same analysis conditions. This observation suggests that dissolved oxygen negatively impacts facet 100, resulting in the formation of truncated faces [22] and a decreased plane intensity. The diffraction planes obtained in this study, along with their relative intensities, are subject to modifications based on the nucleation and crystal growth processes. Experimental factors such as pH and the nature of the reducing agent yield specific diffraction patterns, while temperature, the presence of a capping agent, and particle size can influence their relative intensities.

3.2. Morphology of Cu2O@rGO Composites

To incorporate rGO into the existing Cu2O geometrical particles, a hydrothermal method was employed. The resulting composite was labeled as Cu2O@rGO, with the nomenclature following the format of X-G, where X represents the geometric shape of the pristine Cu2O particles, such as O representing octahedron, C representing cubic, TO representing truncated octahedron, and S representing star-like, while G signifies the inclusion of rGO.
The SEM images in Figure 2a–e demonstrate that the Cu2O@rGO composites have a uniform distribution of micro-sized Cu2O particles on the rGO sheets. The large contact area between the rGO and Cu2O particles promotes efficient charge transport. The O-G, TO-G, and S-G composites displayed no changes in their geometric shape or size, and no isolated nanoparticles were observed.
Moreover, the particles encapsulated by the rGO were more frequently observed in the geometric particles with a predominant facet 111 compared to those with a predominant facet 100. This phenomenon can be attributed to the electrostatic attraction between the positively charged Cu-terminated atoms on facet 111 and the negatively charged rGO sheets.
The O-G composites exhibited the highest coverage of rGO, which could potentially impact its catalytic activity by covering the surface where redox reactions take place. Additionally, the C-G composites revealed surface etching, resulting in the growth of truncated edges with facets 111 and 110 in the cube-shaped particles (Figure 2c).
On the other hand, a surface reconstruction was observed in the TO PVP-G composites (Figure 2d). Truncated octahedra, with a predominant facet 111, transformed into cubes with truncated edges and corners, primarily exposing facet 100. Initially, this shape transformation was attributed to the presence of dissolved oxygen in the rGO solution, which could diffuse through the surface and modify the preferential facet. To investigate this hypothesis, the rGO solution was sonicated and bubbled with nitrogen gas, then mixed with the TO PVP-Cu2O precursor. Subsequently, hydrothermal synthesis was conducted under the same conditions as the solution with oxygen gas. Interestingly, the same surface reconstruction from truncated octahedra to cubes was observed (Figure S3), even in the absence of oxygen in the system. This suggests that the substitution of the preferential facet from 111 to 100 can occur at high temperatures, elevated pressure, and in the presence of rGO. The reconstruction of facet 111 towards facet 100 happened through an etching process [7]. In a vacuum, facet 100 has a lower surface energy than facet 111. However, the surface energy of facet 111 can be reduced to an even lower level, compared to other facets, with the assistance of ion adsorption, as stated in the Wulff construction theory. On the other hand, surface reconstruction within the hydrothermal reactor can proceed as follows: The Cu-terminated atoms on facet 111 can be transformed into Cu and O-terminated atoms on facet 100 [25]. This transformation reduced the polarity of the system and consequently decreased the surface energy of the particle. Under hydrothermal synthesis conditions, the activation energy required for this facet transformation can be surpassed. In contrast, the O-G, TO-G, and S-G composites, which possessed preferential facet 111, did not undergo any change because the growth of facet 100 was not as advanced as that in the TO PVP-G composites.
Figure 2f shows the crystallographic planes of the Cu2O@rGO composites. The characteristic crystalline planes of cuprous oxide are marked in black. However, the intensity of these peaks was significantly reduced compared to bare Cu2O. This reduction can be attributed to the physical state of the sample. The Cu2O@rGO composites are porous materials, resulting in a shallower depth of X-ray diffraction compared to finely ground Cu2O powder [59]. In addition, a 1/1 mass ratio of Cu2O/rGO represents a smaller amount of Cu2O for examination.
Furthermore, in the S-G composites, two low-intensity crystallographic planes, (002) and (111), were observed [60], which can be attributed to cupric oxide (CuO) and are labeled in blue. Similarly, in the TO-G composites, a CuO (002) plane was detected. This suggests that even though some geometric shapes did not undergo structural changes or surface reconstructions, the presence of CuO may be observed. Moreover, the O-G composites, which exhibited a better coating of the rGO sheets compared to the others, displayed higher peak intensities. This suggests that hydrothermal conditions involving O2 gas, high temperature, and high pressure may play a significant role in the surface oxidation of Cu2O particles.

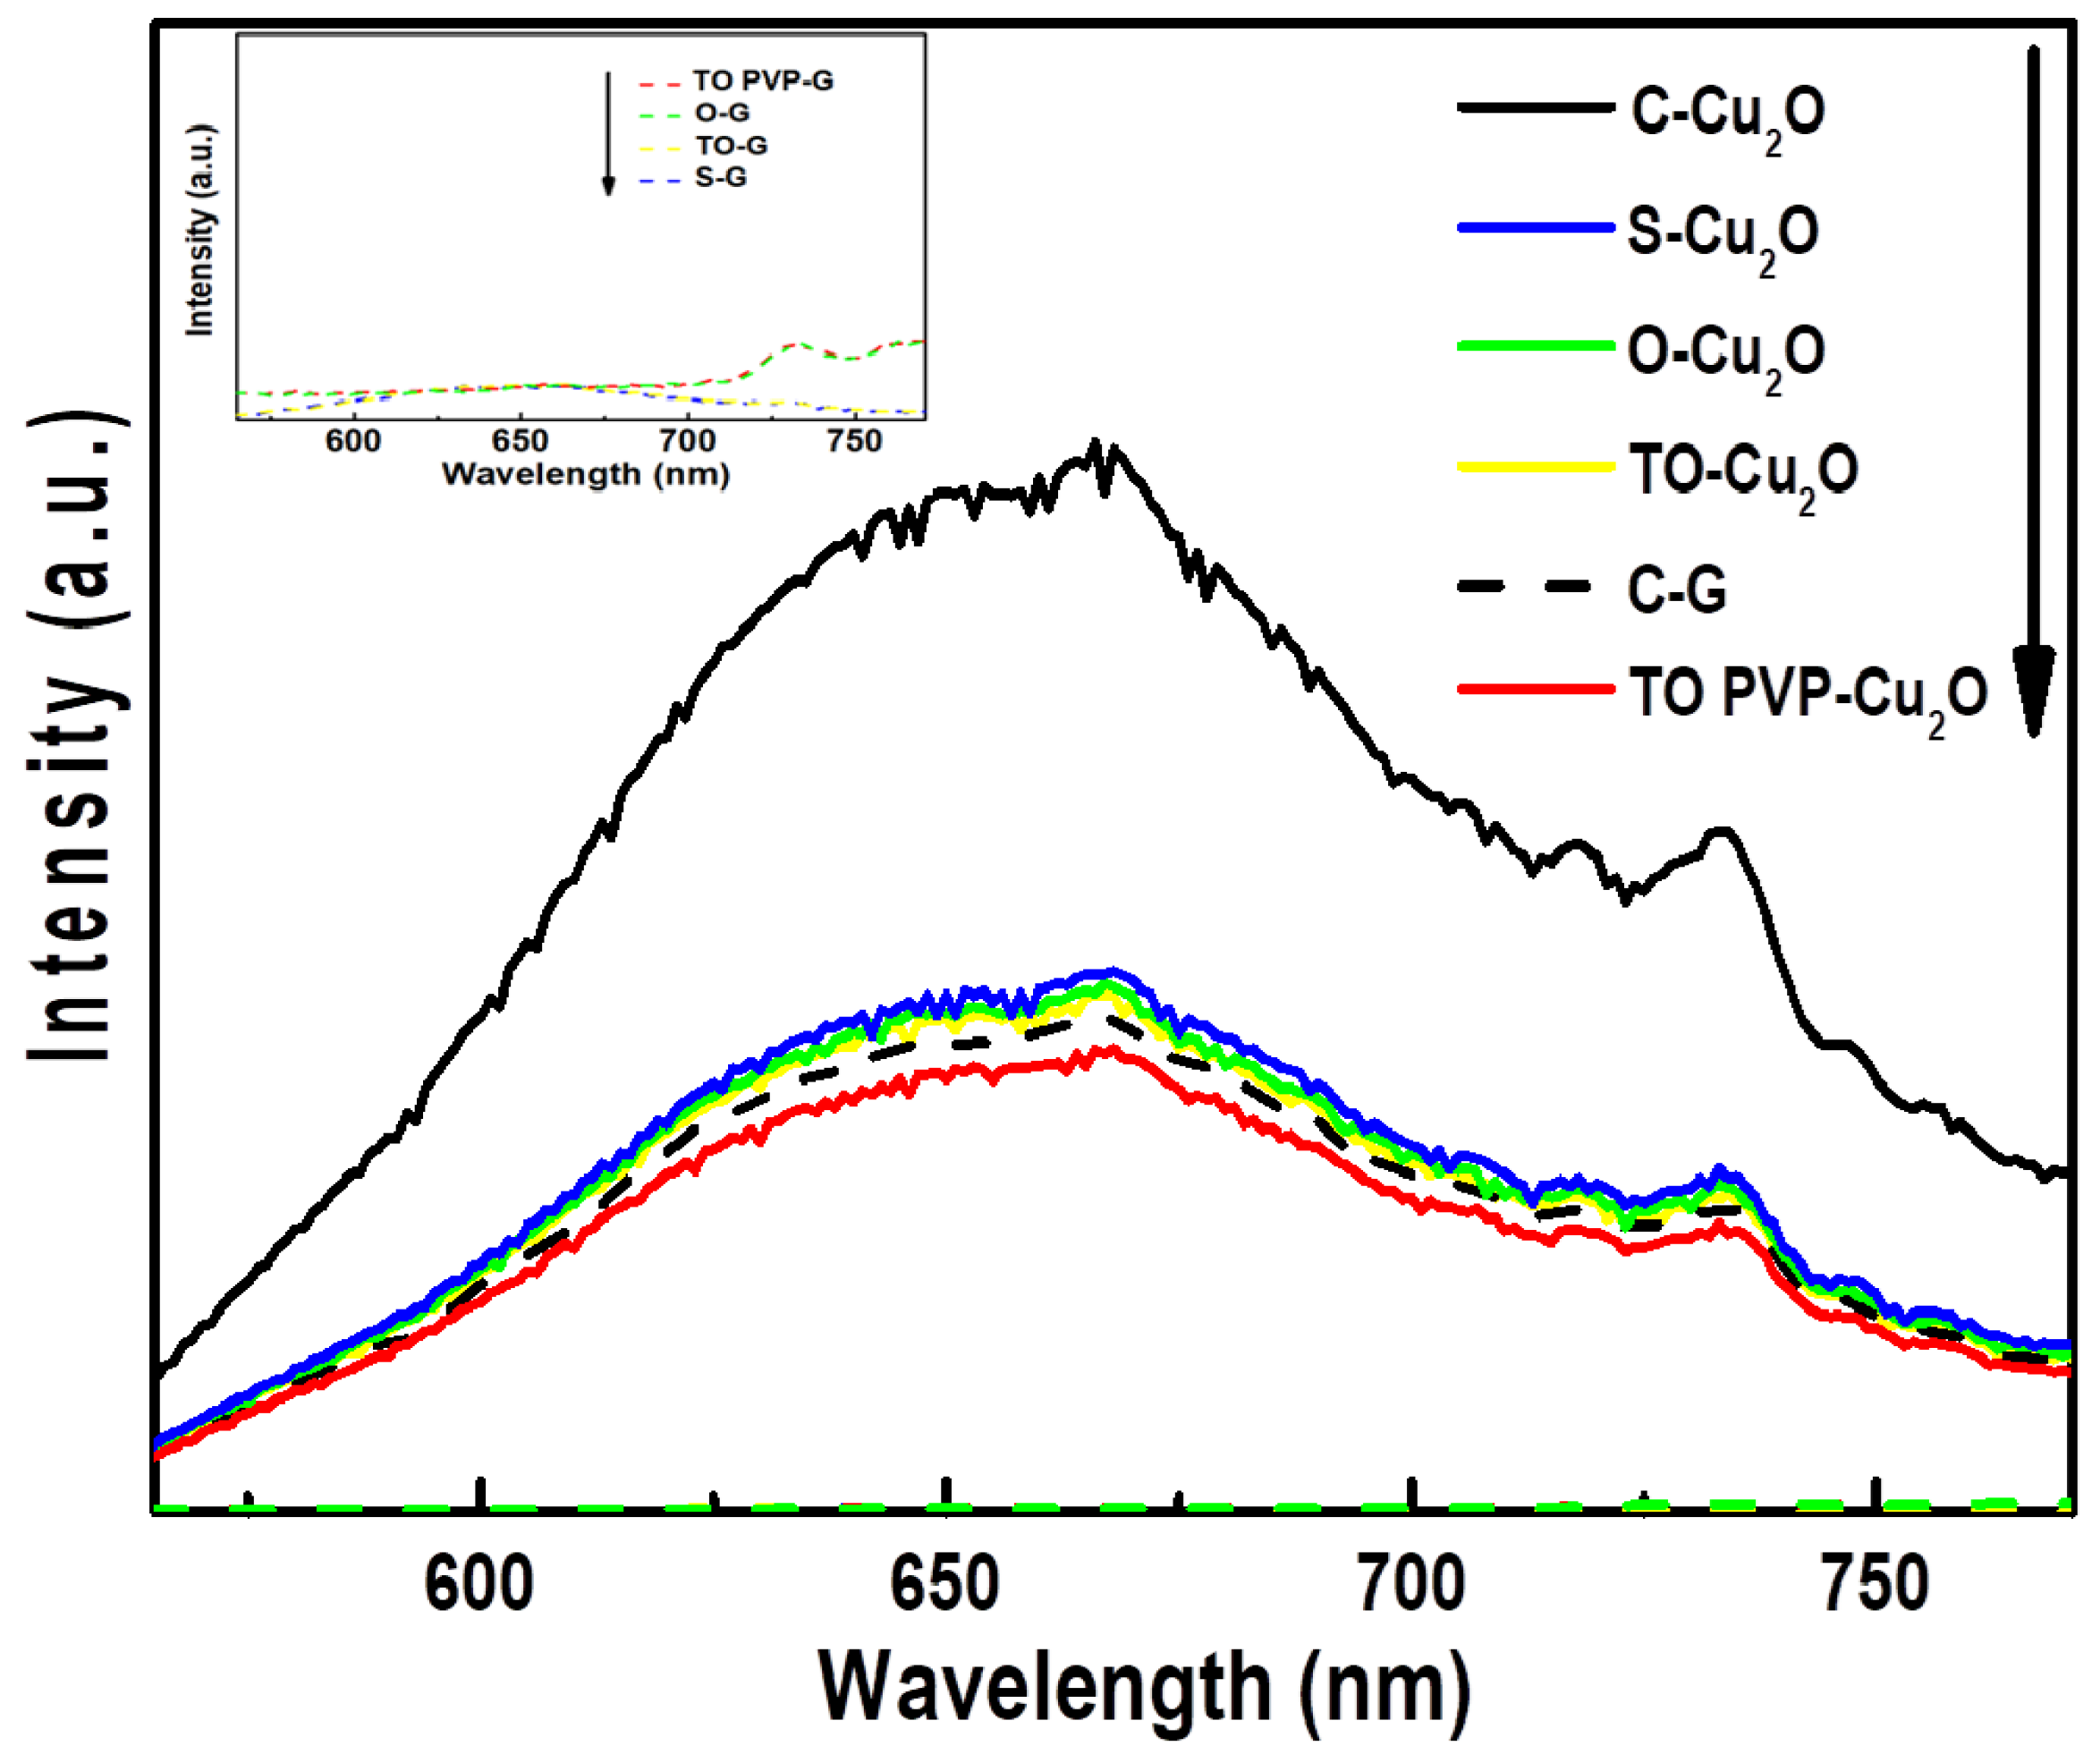
3.3. Electronic Properties of Cu2O Particles and Cu2O@rGO Composites

XPS was conducted to determine the copper oxidation states in the cuprous oxide samples. Figure S4 presents the XPS spectra of Cu2p for the following samples: the Cu2O (Figure S4a–e) and Cu2O@rGO composites (Figure S4f–j). Firstly, it is observed that the intensity of the Cu peaks is higher in the Cu2O samples compared to the Cu2O@rGO composites. This difference in intensity can be attributed to the larger volume occupied by the rGO in the composite, resulting in a lower concentration of copper oxide and hence lower peak intensity in the XPS spectra. The Cu peaks in the Cu2O samples can be up to 10 times higher in intensity compared to the Cu2O@rGO composites.
The XPS spectra of pristine Cu2O clearly show the presence of Cu2+ peaks along with their respective satellites. This indicates the formation of a thin CuO layer, with a thickness of a few nanometers, on the surface of Cu2O [24,38,61]. Additionally, the presence of Cu+ is confirmed by the Cu 2p3/2 and Cu 2p1/2 peaks. Therefore, the intensity ratio of Cu+/Cu2+ is an important parameter to consider because it exhibits a significant dependence on the morphology of the particles. The calculated intensity ratio of Cu+/Cu2+ is shown in Table S2. Among the geometric particles, TO-Cu2O, O-Cu2O, and S-Cu2O, which possess a predominant facet 111, maintained higher Cu+/Cu2+ ratios, above the value of two. On the other hand, TO PVP-Cu2O, and C-Cu2O, with the main facet 100, exhibited lower Cu+/Cu2+ ratios in that order, which were below two. This observation aligns with the trend observed in the XRD patterns of Cu2O, where a higher ratio of facet 111 to facet 100 corresponds to higher crystallinity. This correlation suggests that the presence of oxygen, both in the air and in the initial reaction mixture, leads to the formation of a thicker CuO layer [62] and a decrease in the crystallinity of Cu2O, particularly in particles with a higher proportion of facet 100.
The XPS spectra of the Cu2O@rGO composites revealed the presence of a Cu+ signal, as indicated by the Cu 2p3/2 and Cu 2p1/2 peaks. Additionally, Cu2+ and its satellite were observed, displaying a greater intensity than the Cu+ intensity. However, the Cu+/Cu2+ ratios in all the composite samples, as shown in Table S2, were found to be lower than one, indicating a larger presence of CuO on the surface of Cu2O compared to the pristine Cu2O particles. This larger CuO layer formation can be attributed to the dissolved oxygen and the presence of rGO during the hydrothermal synthesis. It is known that reduced graphene oxide can act as an oxidative agent [63]. Although some composites did not exhibit CuO planes in the XRD patterns, the high-resolution XPS spectra suggest that surface oxidation occurred in all composites. Even in the case of the TO-G composites, which exhibited a higher Cu+/Cu2+ ratio, the presence of the CuO (002) plane was observed.
The high resolution O1s XPS spectra of the Cu2O particles and Cu2O@rGO composites are shown in Figure S5. It can be observed that the intensity of the oxygen signal in all composites is nearly double compared to that in the Cu2O samples. This suggests that the oxygen signal is predominantly attributed to rGO rather than Cu2O, owing to the larger volume of rGO in the composites. For the geometrical particles, three peaks were identified at 531.4, 530.3, and 529.5 eV, corresponding to the hydroxyl group attached to the surface, and the oxygen in copper oxides Cu(I) and Cu(II), respectively [62]. Similar to the Cu XPS spectra, a clear trend was observed for the Cu2O particles with a higher 111 facet ratio (S-Cu2O, O-Cu2O, and TO-Cu2O), which exhibited a higher content of Cu(I) than Cu2O, in that order. Conversely, the TO PVP-Cu2O and C-Cu2O samples with a higher content of facet 100 displayed no significant Cu(I) signal, but a distinct Cu(II) peak was observed. This finding aligns with the previous statement that a higher facet 111 content leads to an increased resistance to oxidation. Furthermore, all Cu2O samples had hydroxyl groups on the Cu2O surface from residual hydroxide on the surface. Notably, the S-Cu2O and O-Cu2O exhibited fewer attached hydroxyl groups, suggesting that facet 100 has a stronger affinity for the dissociative adsorption mechanism of water. This mechanism can play a significant role in the hydrogen evolution reaction by facilitating the occupation of active sites on the catalyst surface with water [63]. Consequently, the faster desorption of the solvent can assist in the occupation of active sites by the hydronium ion. For the Cu2O@rGO composites, three functional groups, C=O, C-O, and -OH, were believed to come from the reduced graphene oxide. Some water adsorption was found for the C-G sample. The C-O group was only present for the aerogel with particles with a higher facet 111 content.
The bandgap of the geometric Cu2O was determined via the Tauc plot analysis using the measurement of the percentage of reflectance. The bandgap energies were interpolated from the F(R)2 vs. energy plot, which is not shown in this study. A direct transition was assumed for the semiconductor Cu2O. The obtained bandgap energies for the geometric Cu2O particles can be found in Table S2. The results show a slight variation of ±0.2 eV [64] in the bandgap energies. No significant correlation was observed between the bandgap energies and the crystallinity of the samples, their geometric shape, or their size.
The fluorescence spectra of the Cu2O and the Cu2O@rGO composites are shown in Figure 3. A prominent band centered at 655 nm (1.89 eV), with a minor peak at 667 nm, (1.85 eV) indicates the migration of electrons from a higher excited state to the base state. Additionally, a less intense peak at 733 nm (1.69 eV) was observed, which corresponds to the exciton associated with oxygen vacancies (VO) [65]. All spectra exhibited the same characteristic peaks, suggesting that rGO does not contribute to the fluorescence in this range. When considering the relative intensity of the samples, C-Cu2O exhibited the highest intensity among the cuprous oxide samples. The remaining Cu2O samples, including S-Cu2O, O-Cu2O, TO-Cu2O, and TO PVP-Cu2O, displayed similar intensities, but lower than that of C-Cu2O. This observation suggests that the charge separation in C-Cu2O is less efficient compared to other geometric shapes of Cu2O. Furthermore, all Cu2O@rGO composites demonstrated a significant decrease in intensity compared to their respective geometric Cu2O counterparts. The C-G sample exhibited a substantial reduction in intensity, approximately half of its original value. Similarly, the intensity of the TO-G and S-G samples decreased to levels close to the background noise. These findings confirm that Cu2O@rGO composites exhibit an improved charge separation compared to pristine Cu2O samples.

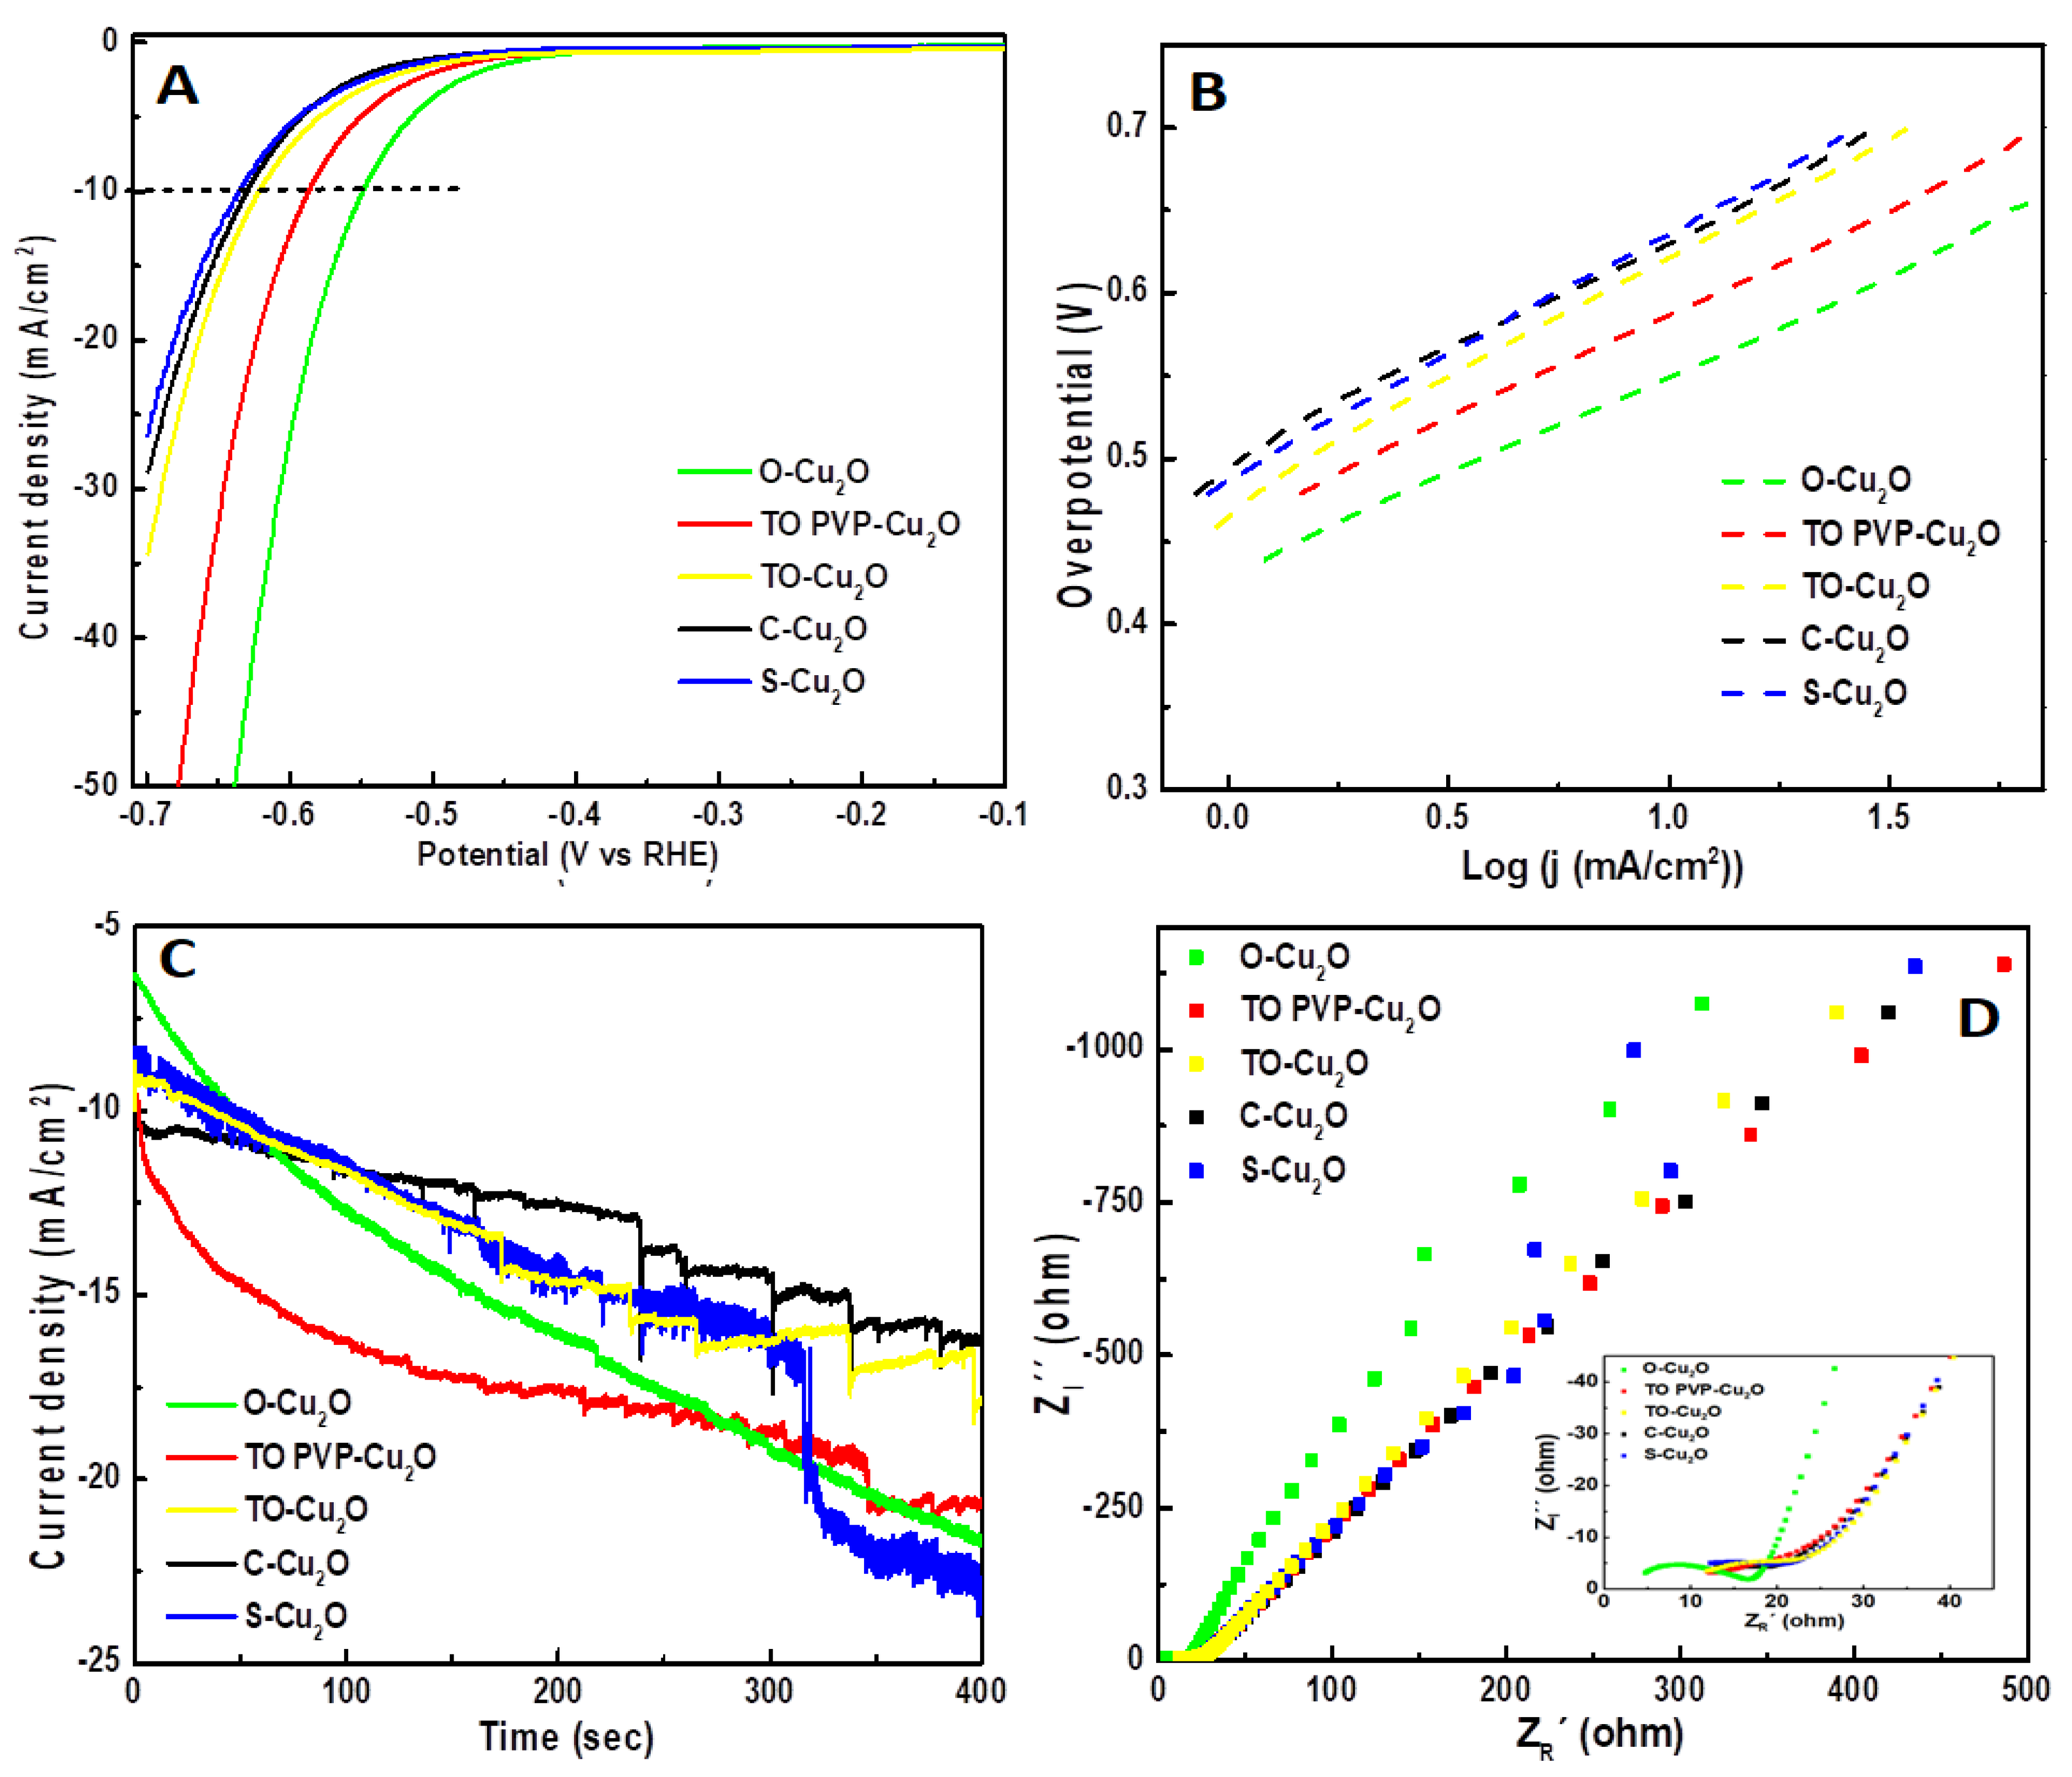
3.4. Electrochemical Hydrogen Evolution Reactions

3.4.1. HER Performance of Cu2O Geometrical Particles

Two reactions contributing to the electrochemical activity of Cu2O occur at potentials close to 0 V vs. RHE [26,66]. On facet 111, the surface is predominantly occupied by Cu+ terminated atoms, allowing for the adsorption and subsequent reduction of oxygen atoms (Equation (10)). On facet 100, the O2− terminated atoms prevail, facilitating the self-reduction of the Cu2O. This reaction is assisted by H+ ions, which are attracted to the O2− anions on facet 100 (Equation (11)). It has been demonstrated that tailoring specific crystalline faces can extend the catalyst’s lifespan under reductive potentials.
≡O2(aq) + 2H+(aq) + 2e → H2O2(aq)
Cu2O(s) + 2H+(ads) + 2e → 2Cu(s) + H2O(l)
Figure 4 shows the HER electrochemical measurements of the Cu2O particles in an acid medium (0.5 M H2SO4) when supported on the GCE. As shown in Figure 4A, bare cuprous oxide exhibits no activity for HERs below −300 mV. However, upon surpassing this potential limit, hydrogen reduction is initiated. The onset potentials of the particles are summarized in Table 2, indicating that the geometric shape of Cu2O provides different active sites for HERs. The overpotential required to achieve a current density of 10 mA/cm2 for each Cu2O particle is also presented in Table 2, reflecting a similar relationship to that observed for the onset potentials. Despite the comparable relative intensities of the crystalline planes, as shown via the XRD, the variations in performance suggest that the surface composition plays a significant role in the HER activity.
Firstly, O-Cu2O particles with a preferential facet 111 exhibit the lowest onset potential of −330 mV, despite their larger size (2.0 ± 0.5 µm) and the high Cu+ atom saturation on the facet 111 surface [7,43]. Compared to the neutral facet 100, facet 111 experiences electrostatic repulsion with H3O+ ions, yet it demonstrates better activity for HERs. Next, the TO PVP-Cu2O particles with a facet ratio (100/111) of 0.26 and a smaller size of 1.0 ± 0.3 µm show an onset potential of −375 mV. These particles possess more unsaturated sites at the corners and edges generated by facet 100, setting them apart from the other particles. On the other hand, the truncated octahedron TO-Cu2O exhibits an onset potential of −419 mV. This decrease in HER performance could be attributed to the reduced facet 100 content (r = 0.09) in TO-Cu2O compared to TO PVP-Cu2O particles of similar size, resulting in fewer unsaturated sites. Other factors such as electrochemical stability [67], higher electrical mobility within the crystal, and fewer transition states at the band level [68] may also contribute to explaining why the larger octahedron has a lower onset potential. Moreover, the different facet ratios of 111/100 in TO PVP-Cu2O and TO-Cu2O particles could promote different charge migration effects [24].
The star-like particles display an onset potential of −410 mV under the same conditions. Despite expectations for higher performance due to their rough surface and numerous edges consisting of unsaturated sites, several factors might account for this result. The puzzle-like stacking due to their long edges could reduce their active area. Additionally, the accumulation of evolved hydrogen could limit the availability of sites, decreasing their potential for HERs.
Lastly, C-Cu2O demonstrates an onset potential of −417 mV, suggesting that facet 100 is less active than facet 111 in O-Cu2O. This can be explained by several factors: when supported on a GCE, the neutral facet 100 tends to agglomerate, resulting in the loss of the active area. Moreover, facet 100 exhibits lower chemical and electrochemical stability compared to facet 111 [24,26,67]. Additionally, particles with a higher facet 100 content show a greater affinity for hydroxyl groups, as indicated in the XPS (Figure S5). This promotes a higher saturation of active sites by the solvent [69], ultimately reducing the available active area for hydronium adsorption [62]. Furthermore, the larger octahedron of 2.4 ± 0.5 µm showed a higher performance than the smaller cubes of 1.1 ± 0.1 µm, which suggests the surface composition is more significant in the same oxide composition than the size.
To analyze the reaction rate [70], Tafel curves of the Cu2O particles were plotted and are shown in Figure 4B, with their corresponding values shown in Table 2. The observed slopes fall within the range of 120 mV dec−1, indicating that the hydrogen evolution reaction (HER) mechanism is primarily governed by the Volmer step, as described in Equation (12), where AS denotes the actives sites.
H3O+(aq) + e + AS ↔ AS-H + H2O
In this mechanism, both the charge transfer and the adsorption of hydronium ions towards the active sites are important in determining the reaction rate. The adsorption of hydronium ions is likely to be influenced by the availability of active sites. XPS analysis revealed the presence of surface hydroxylation on both facets, which reduces the total number of free active sites. Furthermore, the photoluminescence results indicated a low electron migration for all the Cu2O samples. These two factors, the limited active sites due to surface hydroxylation and the restricted electron migration, are the major contribution to the observed Tafel slope of 120 mV dec−1 for the cuprous oxide particles.
To assess the short-term stability of the current generated on the catalyst’s surface, chronoamperometry (CA) was conducted under fixed conditions of potential and pH = 0 (0.5 M of H2SO4). Figure 4C shows the stability of the catalyst Cu2O at a suitable potential, resulting in a current close to 10 mA cm−2. Interestingly, it was observed that the current increased beyond the initial value in all cases. This phenomenon suggested that a redox reaction occurred on the catalyst surface. It is possible that the thin layer of CuO, as observed in the XPS analysis (Figure S4), was reduced back to Cu2O. Additionally, the reduction from Cu+ to Cu(0) could enhance the electrode’s conductivity, thereby leading to an increase in the recorded current.
A decrease in the charge-transfer resistance between the electrode surface and the species involved [71] can significantly impact the performance of HERs. All measurements were conducted in an acid medium (H2SO4 = 0.5 M) at 0 V vs. RHE using the same three-electrode system, and the frequency range for the measurements ranged from 105 to 10−2 Hz. By analyzing the obtained data from the EIS, Nyquist plots were generated and are presented in Figure 4D. These plots provide valuable information regarding the charge-transfer processes occurring at the electrode/solution interface. The diameter of the semicircle observed in the plots is directly related to the charge-transfer resistance of the electrode/solution interface.
In the mid–low frequency range, the geometrical shape of the Cu2O particles exhibited a semicircle in the impedance measurements. The C-Cu2O and TO PVP-Cu2O displayed semicircles with shorter diameters, indicating a lower resistance. The high onset potential of −417 mV for the C-Cu2O and the lower onset potential of −375 mV for the TO PVP-Cu2O imply a contradictory relationship between the performance and the charge-transfer resistance. This observation suggests that electrode–electrolyte resistance is not the most significant parameter in HER cubic Cu2O performance compared to other shapes. Additionally, the presence of more oxygen terminations in facet 100 may facilitate the accumulation of electrons, resulting in a better charge transfer at the solution–electrode interface [72]. This can explain the higher resistance observed in the O-Cu2O, which predominantly consists of facet 111 with Cu+-terminated atoms. On the other hand, the TO-Cu2O and S-Cu2O exhibited similar onset potentials and a comparable resistance, indicating that other parameters, such as the active sites and thermodynamic factors (e.g., a lower activation energy and hydrogen adsorption free energies), can significantly enhance their catalytic activity [73].
The values of the ESA [74] for Cu2O are presented in Table 2, and the corresponding plots can be found in Figure S6. The cyclic voltammograms (not shown) of these plots indicated a diffusion-controlled quasi-reversible redox reaction. Table 2 reveals that the O-Cu2O and TO PVP-Cu2O exhibit larger ESA values compared to the TO-Cu2O, C-Cu2O, and S-Cu2O samples. This finding suggests a direct correlation between the ESA and the onset potential, which is attributed to higher active sites for HERs. In the case of TO PVP-Cu2O, its shape having more vertices and edges likely contributes to a larger active area in comparison to O-Cu2O. In the case of the S-Cu2O sample, it is anticipated that the corners and edges would possess a higher concentration of unsaturated sites [75]. However, this composite did not manifest as many electroactive sites as unsaturated ones. Consequently, its performance in the HER was inferior when compared to other Cu2O catalysts. On the other hand, TO-Cu2O and S-Cu2O displayed lower ESA values, which can explain their limited HER performance. This analysis highlights the importance of the ESA as a crucial parameter for characterizing the performance of HERs.

3.4.2. HER Performance of Cu2O@rGO Composites

Figure 5A shows the HER catalytic performance of the Cu2O@rGO composites. The electrochemical parameter onset and overpotential are summarized in Table 3. For all the composites, a better onset was obtained for all cases compared with the corresponding pristine Cu2O particles. The lower onset suggests that the Cu2O-rGO composites, with a mass ratio of 1/1, had a synergistic effect and enhanced the HER performance.
Although the onset potential improved in all cases, the overpotential of the TO PVP-G was lower than that of the TO PVP-Cu2O. This can be attributed to two reasons. Firstly, the structural reconstruction from truncated octahedra to cubes (Figure 2d) could modify its performance until it becomes comparable to that of C-G. Secondly, the 1:1 mass ratio may not be the optimal composition for this composite, resulting in fewer active sites. This is supported by two additional linear sweep voltammetry controls with mass ratios of 2:1 and 3:1 for S-G and O-G, respectively (Figure S7). These controls suggested that different mass ratios could significantly alter the HER performance. In summary, the electrochemical activity showed excellent improvement for the S-G and TO-G composites, good improvement for the C-G composites, and slight or insignificant improvement for the O-G and TO PVP-G composites. This observation suggested that the properties of these particles depended on their specific facets [72,76].
Moreover, the semiconductive properties of rGO enables the formation of a Schottky barrier at the interface, where the Fermi levels (EF) reach an equilibrium with specific facets of Cu2O. Facet 100 in particular is favorable for the formation of a Schottky barrier [72], acting as an electrostatic force. This barrier facilitates the directional migration of charge carriers towards different faces of Cu2O, thereby increasing their lifetime. Additionally, defects in rGO can play a crucial role in creating localized charges on atoms with different electronegativities [68]. Furthermore, the degree of reduction of rGO can modify the affinity for hydrogen adsorption [77,78]. These factors collectively establish rGO as a prominent material for hydrogen evolution, serving as an effective co-catalyst.
The Cu2O@rGO star-like composites exhibited the best performance as a catalyst for hydrogen evolution in this study, with an onset potential of −310 mV. The enhanced catalytic activity was attributed to two key factors: (i) The presence of multiple edges and vertices in the star-like structure led to a higher density of unsaturated atomic sites [21]. This was supported by the TEM-SAED image (Figure S8), which reveals different diffraction patterns on the surface edges and in the particle core. The edges predominantly exhibit low-index planes such as 100 and 111, while the core exhibits more complex planes with higher indices. This unique atomic arrangement provides a larger number of active sites for the hydrogen evolution reaction. (ii) Secondly, the electron transfer was typically limited to the front surface of the electrode, when the Cu2O was supported on the GCE. However, the Cu2O-rGO composite with its higher porosity offered a three-dimensional matrix that facilitated electron transfer in a larger space because of the improved particle distribution. This arrangement enhanced the ohmic contact between the rGO and the Cu2O, minimizing the energy losses during electron transport. The combination of these two factors overcame the limitations observed in the pristine S-Cu2O and results in a superior catalyst.
The Tafel curves of the Cu2O@rGO composites are presented in Figure 5B, and the corresponding Tafel slopes are summarized in Table 3. In most cases, the Tafel slope values increased, which was consistent with findings from other graphene-like compounds [79] that showed a Tafel slope value in the range of 200 mV dec−1. The observed Tafel slope values for the aerogels could be attributed to the significant volume occupied by rGO in the composite. While the rGO possessed high electrical mobility, it was practically inactive for the HER compared to cuprous oxide. Consequently, although rGO provides additional active sites, these sites are less electroactive than Cu2O sites, resulting in a substantial increase in the Tafel slope.
To validate this hypothesis, the Tafel slopes of the two control LSV measurements performed (Figure S8) are presented in Figure S9. The slope decreased with the higher Cu2O content in the composites, supporting the conclusion that different mass ratios could significantly alter the HER mechanism and, consequently, its performance. Furthermore, it is worth noting that at higher hydrogen coverage regions, the Tafel slope exhibits a much higher value compared to lower coverage values. This observation was evident in the Tafel curves of the C-G, TO-G, and S-G composites, where the Tafel slopes were 118, 82, and 70 mV dec−1, respectively, at lower coverage values. However, this phenomenon was not observed in the 2:1 mass ratio S-G composites, indicating that it was only evident for the 1:1 mass ratio S-G composites. Moreover, the TO-G and S-G composites might exhibit a mechanism primarily governed by the Heyrovsky rate-determining step, with a Tafel slope close to 40 mV dec−1, which transited to a Volmer determining step at the higher-coverage regions.
The short-term stability of the Cu2O@rGO composites is shown in Figure 5C. In contrast to pristine Cu2O, all the composites exhibited an improved short-term stability with a sustained current density. The slight increase in the current could be attributed to a more efficient agitation. Previous studies have reported the stability provided by rGO, which was attributed to a reduced electron recombination, enhanced electrical mobility, and better dispersibility [31,32,33,34,40,41,42,44]. Additionally, the presence of CuO, as observed in the XPS section (Figure S4), has been shown to positively influence the water-splitting performance when an appropriate number of CuO layers were attached to the Cu2O surface [80].
The Nyquist plots of the Cu2O@rGO composites are presented in Figure 5D. The charge-transfer resistances of the C-G, TO-G, and S-G composites are very similar to each other and follow the same trend as their respective Cu2O particles. Conversely, the O-G composite exhibited a higher resistance, which correlates with its lower HER performance. Notably, the TO PVP-G composites demonstrated a significant decrease in charge-transfer resistance, which could be attributed to the structural changes illustrated in Figure 2d. These structural modifications might lead to the creation of crystal defects, thereby enhancing the electron transfer from the Cu2O surface to the electrolyte.
The Nyquist plots of the Cu2O particles and Cu2O@rGO composites were compared, and the results are presented in Figure S10. The O-G composites exhibited a slight increase in resistance compared to pristine O-Cu2O. Additionally, the TO-G, C-G, and S-G composites showed a significant increase in charge-transfer resistance compared to their respective Cu2O particles. Only the TO PVP-G composite demonstrated a drastic decrease in charge-transfer resistance compared to TO PVP-Cu2O. However, despite this decrease, the HER catalytic performance of TO PVP-G did not increase to the same extent. This finding suggests that the transformation from facet 111 to facet 100 as the main facet could significantly reduce the charge-transfer resistance, as discussed earlier in the Cu2O EIS analysis. In summary, the surface reconstruction of TO PVP-G composites can replicate the characteristics of C-G, such as the onset potential and improved charge-transfer resistance.
Despite the observed increase in resistance in the O-G, TO-G, C-G, and S-G composites, the overall HER performance was not solely determined by resistance. Other factors come into play, such as the Cu2O-rGO mass ratio, as discussed earlier in the Tafel slope analysis of the composites. To support this hypothesis, an EIS measurement was conducted on the 3:1 mass ratio O-G aerogel, and the corresponding Nyquist plot is shown in Figure S11. Although a significant improvement in charge-transfer resistance was observed, the HER performance of the 3:1 mass ratio O-G aerogel decreased considerably (as shown in Figure S7). This finding indicated that, while a lower charge-transfer resistance was important, it was not the sole determining factor in achieving efficient hydrogen evolution.
Table 3 shows the ESA values of all Cu2O@rGO composites. It is evident that all Cu2O-rGO composites exhibited a significant increase in ESA compared to their respective pristine Cu2O counterparts. This indicates that the rGO enhanced the active sites of the Cu2O and facilitated the creation of additional sites, which was directly reflected in the improved HER performance of the composites. The smallest increase in ESA was observed for O-G, which was attributed to the limited availability of active sites on facet 111 due to the wrapping effect of rGO (as shown in Figure 2a). On the other hand, the TO-G demonstrated the greatest increase in ESA, reaching a six-fold improvement. This finding confirms the synergistic effect between rGO and Cu2O in enhancing electrochemical activity. Additionally, the S-G composites exhibited a lower ESA compared to the TO-S composites, but a similar onset was initially observed. This suggested that while the S-G composite had fewer active sites, it exhibited a higher electroactivity. In conclusion, the mass ratio of Cu2O/rGO could modify the enhancement of the electric mobility on the electrode surface and promote electron migration to the reactive sites [61,63]. Just as in the Cu2O ESA analysis, the electrochemically active area plays a vital role in enhancing HER performance.

3.4.3. Density Functional Theory Calculations

To gain deeper insight into the difference in HER performance between the Cu2O facets (111) and (100) surfaces, we conducted density functional theory (DFT) calculations to investigate the hydrogen adsorption on those facets. The hydrogen adsorption energy of hydrogen on various sites from the (111) and (100) surfaces was calculated using DFT. Interestingly, our findings align with previous research [81], indicating that molecular hydrogen prefers to bind with coordinatively unsaturated Cu atoms on the second layer of the (111) surface. In contrast, on the oxygen-terminated (100) surface, hydrogen exhibits stronger adsorption compared to the (111) surface. Although molecular hydrogen shows weak adsorption on the Cu atoms, it forms a stable structure by binding with the exposed oxygen end on the (100) surface. The H2 adsorption energy was found to be −0.73 eV on the Cu2O (111) surface, while it was −2.26 eV on the Cu2O (100) surface. Our calculations demonstrate that the H2 adsorption energy on the (100) surface was more than 1.53 eV greater than that on the (111) surface. This stable structure on the (100) surface creates a higher energy barrier during the hydrogen formation process. For detailed DFT calculation data, please refer to the Supplementary Materials (Figure S12).

3.4.4. After-Test Catalyst Analysis

Surface analysis was conducted after a 10 min hydrogen reduction and the results are presented in Figure 6. Among the catalysts studied, the two most promising ones, namely the O-Cu2O particles and Cu2O@rGO S-G composites, were selected for this investigation. The O-Cu2O particles exhibited a significant decrease in size, reducing from 2 μm to the range of 100–500 nm. Moreover, the presence of truncation and the generation of facet 100 were observed. The backscattering SEM mode revealed the existence of small nanoparticles on the surface. A dynamic evolution can be found in Cu2O after an electrochemical process [82]. This dynamic evolution involves atomic rearrangement and a change in chemical state, particularly during the hydrogen evolution. The Pourbaix diagram of Cu species suggests that the dissolution and reduction of Cu+ occurs at the pH and cathodic potential conditions utilized in HERs. This fact leads to the formation of less energetically favorable particles with a reduced surface area.
Regarding the O-Cu2O catalyst, we detected the presence of smaller octahedral particles. This observation strongly implies that O-Cu2O is undergoing a dynamic process involving Cu+ dissolution and subsequent reconstruction into Cu2O. Furthermore, the oxygen produced at the counter electrode may contribute to the truncation of faces like the small, truncated octahedron that was found. Additionally, the Nafion coating was observed to reduce the active area of the catalyst. This issue can be addressed by immobilizing the particles onto a metal support, without the need for additional additives.
In contrast, the S-G composite exhibited a more radical transformation, where the star-like particles were completely converted into irregular agglomerations of approximately 250 nm (Figure 6B). This significant change suggests a distinct mechanism compared to the O-Cu2O particles. In this case, it appears that during the hydrogen evolution, the dissolution of Cu+ species takes place, followed by their diffusion into the reduced graphene oxide sheets, culminating in the creation and growth of nuclei. It is important to highlight that, despite the observed surface morphology change, the current density stability remained constant over a short-term period, as shown in Figure 5C. This observation suggests that the restructuring process occurs within the initial minutes of catalysis. Subsequently, after this structural modification, the particles stabilize and initiate the reduction of hydrogen without any secondary reaction.
These findings lead us to the conclusion that, under an acid medium and cathodic potential, the Cu2O particles undergo surface and structural reconstruction, ultimately attaining a stable state. It is advisable to utilize XPS to differentiate between Cu(0) and Cu(I) on the particle surface. Additionally, in situ Raman spectroscopy [83] has proven to be a valuable technique for elucidating and identifying Cu phases during water splitting. Therefore, it should be considered for further investigation.
Some other cuprous oxide been investigated [84,85] for HERs, as summarized in Table 4. It is clear to note that Cu2O performance improves when supported on a copper substrate. Indeed, an in situ growing synthesis generates a good interface between the catalyst and the support. However, the control of the area is poor compared to the flat surface of the GCE. Furthermore, the morphology effect [86,87,88] has been applied to other materials showing important results in decreasing the overpotential when tunneling the surface properties of the catalyst. The addition of rGO in Cu2O with a tunneling surface has significantly improved the reactivity of Cu2O@rGO composites. This study demonstrates the potential of tuning the morphology to enhance the HER performance. Several critical parameters should be considered in future studies. First, reducing the Cu2O particle size could potentially enhance the catalytic activity. Second, exploring different Cu2O-rGO ratios may help identify the optimal composition for improved performance. Third, additional reduction of rGO could be explored to enhance electron mobility within the aerogel. Finally, the CuO layer depth is seen as a critical factor in the overall performance of the catalyst. By addressing these parameters, it is possible to promote the HER performance of Cu2O@rGO composites.

4. Conclusions

The morphology of Cu2O plays a crucial role in determining its catalytic performance for HERs. Among the different shapes examined, the octahedral shape with a higher facet ratio of 111/100 emerged as the most efficient catalyst, exhibiting an overpotential of −549 mV. This indicates that the 111 facet is more active compared to the 100 facet under the same catalytic conditions, as supported also by DFT, where the facet 111 showed a lower H2 adsorption energy. Furthermore, the 111 facet of Cu2O showed better protection against ambient oxygen and higher crystallinity, as confirmed via the XRD and XPS analyses.
The electroactive area was found to be the most significant parameter influencing the HER activity in the Cu2O@rGO composites. Among the studied samples, the Cu2O@rGO S-G composites demonstrated the best performance, achieving an overpotential of −458 mV. The incorporation of rGO in the aerogel structure improved the particle dispersion and provided more active sites for catalytic reactions. Additionally, the presence of a superficial CuO layer, as indicated via the XPS and XRD analyses, contributed to the stabilization and enhancement of HER performance.
Overall, investigating the reactivity of different geometric shapes of catalysts and their surface properties is crucial for optimizing their performance. These findings highlight the significance of Cu2O morphology in determining its catalytic activity, with the 111 facet showing superior performance, and underscore the importance of factors such as electroactive area, particle dispersion, and surface composition in achieving efficient HER catalysis.

Supplementary Materials

The following supporting information can be downloaded at https://www.mdpi.com/article/10.3390/jcs7090403/s1. Table S1. Experimental conditions of Cu2O geometrical particles synthesis. Table S2. Intensity of Cu+/Cu2+ ratio of Cu2O particles and Cu2O@rGO aerogels and bandgap of geometrical Cu2O particles. Figure S1. SEM image of Cu2O star-like particles synthesized at 70 °C. Figure S2. SEM image of Cu2O star-like particles synthesized with at 70 °C as an initial temperature reaction. Figure S3. SEM image of TO PVP-G aerogel with no O2 on the reaction solution. Figure S4. Cu2p XPS spectra of geometrical Cu2O particles: (a) O-Cu2O (b) TO-Cu2O (c) TO PVP-Cu2O (d) C-Cu2O and (e) S-Cu2O and Cu2O@rGO aerogels: (f) O-G (g) TO-G (h) TO PVP-G (i) C-G and (j) S-G. Figure S5. O1s XPS spectra of geometrical Cu2O particles: (a) O-Cu2O (b) TO-Cu2O (c) TO PVP-Cu2O d) C-Cu2O and (e) S-Cu2O and Cu2O@rGO aerogels: (f) O-G g) TO-G (h) TO PVP-G (i) C-G and (j) S-G. Figure S6. Oxidation current response versus square root of scan rate 10-150 mV/s of Cu2O Particles (a) O-Cu2O (b) TO PVP-Cu2O (c) TO-Cu2O (d) C-Cu2O (e) S-Cu2O and Cu2O@rGO aerogel (f) O-G (g) TO PVP-G (h) TO-G (i) C-G (j) S-G. Figure S7. HER performance of mass ratio effect in Cu2O@rGO aerogel. Linear Sweep voltammetry curves in 1N H2SO4 solution at scan rate 5 mV s−1. Figure S8. SAED-TEM images of Cu2O star-like shape. (A) High magnification of electron diffraction on the (A) edges (B) core of the particle. Figure S9. HER performance of mass ratio effect in Cu2O@rGO aerogel. Tafel plots of HER. Figure S10. Nyquist plot of Cu2O particles and Cu2O@rGO aerogel at 0 V vs RHE. Figure S11. Nyquist plot of Cu2O@rGO aerogel mass ratio effect. Figure S12. Most-favored configuration and energy of hydrogen adsorption on Cu2O (111) and (100) surface: (a) pristine Cu2O (100) surface, (b) side view, and (c) top view of H2 adsorption on (100) surface; (d) pristine Cu2O (111) surface, (d) side view, and (f) top view of H2 adsorption on (111) surface.

Author Contributions

Conceptualization, M.A.R.-U. and L.Z.; methodology, M.A.R.-U., L.Z. and A.W.; DFT calculation, A.W.; investigation, M.A.R.-U. and A.W.; resources, L.Z.; writing—original draft preparation, M.A.R.-U. and A.W.; writing—review and editing, L.Z., K.Y.C.-T. and S.Z. All authors have read and agreed to the published version of the manuscript.

Funding

This research received no external funding.

Data Availability Statement

Not applicable.

Acknowledgments

The authors acknowledge the award of MRI: EECS: 1726636 from the National Science Foundation and the support from the MCF-AMPAC facility, NSTC, MSE, and CECS at the University of Central Florida. DFT calculations were performed using the computing resources at the Advanced Research Computing Center at the University of Central Florida and Extreme Science and Engineering Discovery Environment (XSEDE) through allocation to S.Z.

Conflicts of Interest

The authors declare no conflict of interest.

References

  1. Heptonstall, P.J.; Gross, R.J.K. A systematic review of the costs and impacts of integrating variable renewables into power grids. Nat. Energy 2020, 6, 72–83. [Google Scholar] [CrossRef]
  2. Owusu, P.A.; Asumadu-Sarkodie, S.; Dubey, S. A review of renewable energy sources, sustainability issues and climate change mitigation. Cogent Eng. 2016, 3, 1167990. [Google Scholar] [CrossRef]
  3. Guan, D.; Xu, H.; Zhang, Q.; Huang, Y.C.; Shi, C.; Chang, Y.C.; Xu, X.; Tang, J.; Gu, Y.; Pao, C.W.; et al. Identifying A Universal Activity Descriptor and a Unifying Mechanism Concept on Perovskite Oxides for Green Hydrogen Production. Adv. Mater. 2023, 2305074. [Google Scholar] [CrossRef] [PubMed]
  4. Hara, M.; Komoda, M.; Hasei, H.; Yashima, M.; Ikeda, S.; Takata, T.; Kondo, J.N.; Domen, K. A Study of Mechano-Catalysts for Overall Water Splitting. J. Phys. Chem. B 2000, 104, 780–785. [Google Scholar] [CrossRef]
  5. Hara, M.; Kondo, T.; Komoda, M.; Ikeda, S.; Kondo, J.N.; Domen, K.; Hara, M.; Shinohara, K.; Tanaka, A. Cu2O as a photocatalyst for overall water splitting under visible light irradiation. Chem. Comm. 1998, 3, 357–358. [Google Scholar] [CrossRef]
  6. Bagal, I.V.; Chodankar, N.R.; Hassan, M.A.; Waseem, A.; Johar, M.A.; Kim, D.H.; Ryu, S.W. Cu2O as an emerging photocathode for solar water splitting—A status review. Int. J. Hydrogen Energy 2019, 44, 21351–21378. [Google Scholar] [CrossRef]
  7. Shang, Y.; Sun, D.; Shao, Y.; Zhang, D.; Guo, L.; Yang, S. A facile top-down etching to create a Cu2O jagged polyhedron covered with numerous {110} edges and {111} corners with enhanced photocatalytic activity. Chemistry 2012, 18, 14261–14266. [Google Scholar] [CrossRef]
  8. Yang, Z.; Sun, S.; Kong, C.; Song, X.; Ding, B. Designated-Tailoring on {100} Facets of Cu2O Nanostructures: From Octahedral to Its Different Truncated Forms. J. Nanomater. 2010, 2010, 710584. [Google Scholar] [CrossRef]
  9. Yao, K.X.; Yin, M.X.; Wang, T.W.; Zeng, H.C. Synthesis, Self-Assembly, Disassembly, and Reassembly of two types of Cu2O Nanocrystal Unifaceted with {001} or {110} Planes. J. Am. Chem. Soc. 2010, 132, 6131–6144. [Google Scholar] [CrossRef]
  10. Zhang, D.F.; Zhang, H.; Guo, L.; Zheng, K.; Han, X.D.; Zhang, Z. Delicate control of crystallographic facet-oriented Cu2O nanocrystals and the correlated adsorPion ability. J. Mater. Chem. 2009, 19, 5220–5225. [Google Scholar] [CrossRef]
  11. Bai, Y.; Yang, T.; Gu, Q.; Cheng, G.; Zheng, R. Shape control mechanism of cuprous oxide nanoparticles in aqueous colloidal solutions. Powder Technol. 2012, 227, 35–42. [Google Scholar] [CrossRef]
  12. Shang, Y.; Guo, L. Facet-Controlled Synthetic Strategy of Cu2O-Based Crystals for Catalysis and Sensing. Adv. Sci. 2015, 2, 1500140. [Google Scholar] [CrossRef] [PubMed]
  13. Sun, S.; You, H.; Kong, C.; Song, X.; Ding, B.; Yang, Z. Etching-limited branching growth of cuprous oxide during ethanol-assisted solution synthesis. CrystEngComm 2011, 13, 2837–2840. [Google Scholar] [CrossRef]
  14. Wang, X.; Liu, C.; Zheng, B.; Jiang, Y.; Zhang, L.; Xie, Z.; Zheng, L. Controlled synthesis of concave Cu2O microcrystals enclosed by {hhl} high-index facets and enhanced catalytic activity. J. Mater. Chem. A 2013, 1, 282–287. [Google Scholar] [CrossRef]
  15. Yang, J.; Wan, X.; Tie, S.; Lan, S.; Gao, X. Crystal-facet-controllable synthesis of Cu2O micron crystals by one-step, surfactant- and capping agent-free method and the formation mechanism. Solid State Sci. 2020, 104, 106203. [Google Scholar] [CrossRef]
  16. Zhang, Z.; Che, H.; Gao, J.; Wang, Y.; She, X.; Sun, J.; Gunawan, P.; Zhong, Z.; Su, F. Shape-controlled synthesis of Cu2O microparticles and their catalytic performances in the Rochow reaction. Catal. Sci. Technol. 2012, 2, 1207–1212. [Google Scholar] [CrossRef]
  17. Zhao, H.Y.; Wang, Y.F.; Zeng, J.H. Hydrothermal Synthesis of Uniform Cuprous Oxide Microcrystals with Controlled Morphology. Cryst. Growth Des. 2008, 8, 3731–3734. [Google Scholar] [CrossRef]
  18. Takata, T.; Jiang, J.; Sakata, Y.; Nakabayashi, M.; Shibata, N.; Nandal, V.; Seki, K.; Hisatomi, T.; Domen, K. Photocatalytic water splitting with a quantum efficiency of almost unity. Nature 2020, 581, 411–414. [Google Scholar] [CrossRef]
  19. Pan, L.; Kim, J.H.; Mayer, M.T.; Son, M.-K.; Ummadisingu, A.; Lee, J.S.; Hagfeldt, A.; Luo, J.; Grätzel, M. Boosting the performance of Cu2O photocathodes for unassisted solar water splitting devices. Nat. Catal. 2018, 1, 412–420. [Google Scholar] [CrossRef]
  20. Paracchino, A.; Laporte, V.; Sivula, K.; Gratzel, M.; Thimsen, E. Highly active oxide photocathode for photoelectrochemical water reduction. Nat. Mater. 2011, 10, 456–461. [Google Scholar] [CrossRef]
  21. Luo, M.; Yao, W.; Huang, C.; Wu, Q.; Xu, Q. Shape effects of Pt nanoparticles on hydrogen production via Pt/CdS photocatalysts under visible light. J. Mat Chem. 2015, 3, 13884–13891. [Google Scholar] [CrossRef]
  22. Li, Q.; Xu, P.; Zhang, B.; Tsai, H.; Zheng, S.; Wu, G.; Wang, H.-L. Structure-Dependent Electrocatalytic Properties of Cu2O Nanocrystals for Oxygen Reduction Reaction. J. Phys. Chem. C 2013, 117, 13872–13878. [Google Scholar] [CrossRef]
  23. Yun, H.J.; Lee, H.; Jool, J.B.; Kim, N.D.; Yi, J. Effect of TiO2 nanoparticle shape on hydrogen evolution via water splitting. J. Nanosci. Nanotechnol. 2011, 11, 1688–1691. [Google Scholar] [CrossRef] [PubMed]
  24. Dan, Y.; Lu, Y.; Kybert, N.J.; Luo, Z.; Johnson, A.T.C. Intrinsic Response of Graphene Vapor Sensors. Nano Lett. 2009, 9, 1472–1475. [Google Scholar] [CrossRef]
  25. Wu, L.; Tsui, L.-k.; Swami, N.; Zangari, G. Photoelectrochemical Stability of Electrodeposited Cu2O Films. J. Phys. Chem. C 2010, 114, 11551–11556. [Google Scholar] [CrossRef]
  26. Sowers, K.L.; Fillinger, A. Crystal Face Dependence of p-Cu2O Stability as Photocathode. J. Electrochem. Soc. 2009, 156, F80. [Google Scholar] [CrossRef]
  27. Meyer, B.K.; Polity, A.; Reppin, D.; Becker, M.; Hering, P.; Kramm, B.; Klar, P.J.; Sander, T.; Reindl, C.; Heiliger, C.; et al. The Physics of Copper Oxide (Cu2O); Elsevier: Amsterdam, The Netherlands, 2013; pp. 201–226. [Google Scholar]
  28. Lalitha, K.; Sadanandam, G.; Kumari, V.D.; Subrahmanyam, M.; Sreedhar, B.; Hebalkar, N.Y. Highly Stabilized and Finely Dispersed Cu2O/TiO2: A Promising Visible Sensitive Photocatalyst for Continuous Production of Hydrogen from Glycerol: Water Mixtures. J. Phys. Chem. C 2010, 114, 22181–22189. [Google Scholar] [CrossRef]
  29. Trang, T.N.Q.; Tu, L.T.N.; Man, T.V.; Mathesh, M.; Nam, N.D.; Thu, V.T.H. A high-efficiency photoelectrochemistry of Cu2O/TiO2 nanotubes based composite for hydrogen evolution under sunlight. Compos. B Eng. 2019, 174, 106969. [Google Scholar] [CrossRef]
  30. Salek, G.; Tenailleau, C.; Dufour, P.; Guillemet-Fritsch, S. Room temperature inorganic polycondensation of oxide (Cu2O and ZnO) nanoparticles and thin films preparation by the dip-coating technique. Thin Solid Films 2015, 589, 872–876. [Google Scholar] [CrossRef]
  31. Hou, F.; Shanmugasundaram, A.; Hassan, M.; Johar, M.; Ryu, S.-W.; Lee, D.-W. ZnO/Cu2O-decorated rGO: Heterojunction photoelectrode with improved solar water splitting performance. Int. J. Hydrogen Energy 2019, 44, 19177–19192. [Google Scholar] [CrossRef]
  32. Tran, P.D.; Batabyal, S.K.; Pramana, S.S.; Barber, J.; Wong, L.H.; Loo, S.C. A cuprous oxide-reduced graphene oxide (Cu2O-rGO) composite photocatalyst for hydrogen generation: Employing rGO as an electron acceptor to enhance the photocatalytic activity and stability of Cu2O. Nanoscale 2012, 4, 3875–3878. [Google Scholar] [CrossRef]
  33. Momeni, M.M.; Ghayeb, Y.; Menati, M. Fabrication, characterization and photoelectrochemical properties of cuprous oxide-reduced graphene oxide photocatalysts for hydrogen generation. J. Mat. Sci. Mater. Electron. 2017, 29, 4136–4146. [Google Scholar] [CrossRef]
  34. Roy, I.; Bhattacharyya, A.; Sarkar, G.; Saha, N.R.; Rana, D.; Ghosh, P.P.; Palit, M.; Das, A.R.; Chattopadhyay, D. In situ synthesis of a reduced graphene oxide/cuprous oxide nanocomposite: A reusable catalyst. RSC Adv. 2014, 4, 52044–52052. [Google Scholar] [CrossRef]
  35. Huang, Y.; Yan, C.-F.; Guo, C.-Q.; Lu, Z.-X.; Shi, Y.; Wang, Z.-D. Synthesis of GO-modified Cu2O nanosphere and the photocatalytic mechanism of water splitting for hydrogen production. Int. J. Hydrogen Energy 2017, 42, 4007–4016. [Google Scholar] [CrossRef]
  36. Choi, S.; Kim, C.; Suh, J.M.; Jang, H.W. Reduced graphene oxide-based materials for electrochemical energy conversion reactions. Carbon Energy 2019, 1, 85–108. [Google Scholar] [CrossRef]
  37. Singh, V.; Joung, D.; Zhai, L.; Das, S.; Khondaker, S.I.; Seal, S. Graphene based materials: Past, present and future. Progr. Mater. Sci. 2011, 56, 1178–1271. [Google Scholar] [CrossRef]
  38. Chen, C.; Li, D.; Wang, A.; Guo, J.; Dong, S.; Chen, D.; Jiao, X.; Xia, Y. Interfacial enhancement for hydrogen radical transfer on hollow Cu2O/rGO nanohybrid with efficient catalytic reduction activity. Appl. Catal. A Gen. 2020, 590, 117331. [Google Scholar] [CrossRef]
  39. Kumar, J.S.; Jana, M.; Khanra, P.; Samanta, P.; Koo, H.; Murmu, N.C.; Kuila, T. One pot synthesis of Cu2O/RGO composite using mango bark extract and exploration of its electrochemical properties. Electrochim. Acta 2016, 193, 104–115. [Google Scholar] [CrossRef]
  40. Liu, M.; Liu, R.; Chen, W. Graphene wrapped Cu2O nanocubes: Non-enzymatic electrochemical sensors for the detection of glucose and hydrogen peroxide with enhanced stability. Biosens. Bioelectron. 2013, 45, 206–212. [Google Scholar] [CrossRef]
  41. Wang, M.; Huang, J.; Tong, Z.; Li, W.; Chen, J. Reduced graphene oxide–cuprous oxide composite via facial deposition for photocatalytic dye-degradation. J. Alloys Compd. 2013, 568, 26–35. [Google Scholar] [CrossRef]
  42. Nathan, D.; Boby, S.; Basu, P.; Mahesh, R.; Harish, S.; Joseph, S.; Sagayaraj, P. One-pot hydrothermal preparation of Cu2O-CuO/rGO nanocomposites with enhanced electrochemical performance for supercapacitor applications. Appl. Surf. Sci. 2018, 449, 474–484. [Google Scholar]
  43. Zhang, F.; Li, Y.; Gu, Y.-E.; Wang, Z.; Wang, C. One-pot solvothermal synthesis of a Cu2O/Graphene nanocomposite and its application in an electrochemical sensor for dopamine. Mikrochim. Acta 2011, 173, 103–109. [Google Scholar] [CrossRef]
  44. Zhang, W.; Li, X.; Yang, Z.; Tang, X.; Ma, Y.; Li, M.; Hu, N.; Wei, H.; Zhang, Y. In situ preparation of cubic Cu2O-RGO nanocomposites for enhanced visible-light degradation of methyl orange. Nat. Nanotechnol. 2016, 27, 265703. [Google Scholar] [CrossRef] [PubMed]
  45. Ramirez-Ubillus, M.A.; De Melo Costa-Serge, N.; Hammer, P.; Nogueira, R.F.P. A new approach on synergistic effect and chemical stability of graphene oxide-magnetic nanocomposite in the heterogeneous Fenton degradation of caffeine. Environ. Sci. Pollut. Res. Int. 2021, 28, 55014–55028. [Google Scholar] [CrossRef] [PubMed]
  46. Barrios, E.; Fox, D.; Li Sip, Y.Y.; Catarata, R.; Calderon, J.E.; Azim, N.; Afrin, S.; Zhang, Z.; Zhai, L. Nanomaterials in Advanced, High-Performance Aerogel Composites: A Review. Polymers 2019, 11, 726. [Google Scholar] [CrossRef] [PubMed]
  47. Shen, C.; Calderon, J.E.; Barrios, E.; Soliman, M.; Khater, A.; Jeyaranjan, A.; Tetard, L.; Gordon, A.; Seal, S.; Zhai, L. Anisotropic electrical conductivity in polymer derived ceramics induced by graphene aerogels. J. Mat. Chem. C 2017, 5, 11708–11716. [Google Scholar] [CrossRef]
  48. Cai, J.; Liu, W.; Li, Z. One-pot self-assembly of Cu2O/RGO composite aerogel for aqueous photocatalysis. Appl. Surf. Sci. 2015, 358, 146–151. [Google Scholar] [CrossRef]
  49. Celik Kazici, H.; Caglar, A.; Aydogmus, T.; Aktas, N.; Kivrak, H. Microstructured prealloyed Titanium-Nickel powder as a novel nonenzymatic hydrogen peroxide sensor. J. Colloid. Interface. Sci. 2018, 530, 353–360. [Google Scholar] [CrossRef]
  50. John, P.; Kieron, B.; Ernzerhof, M. Generalized Gradient Approximation Made Simple. Phys. Rev. Lett. 1996, 77, 3865–3868. [Google Scholar]
  51. Bloch, P.E. Projector augmented-wave method. Phys. Rev. B 1993, 50, 17953–17979. [Google Scholar] [CrossRef]
  52. Dudarev, S.L.; Botton, G.A.; Savrasov, S.Y.; Humphreys, C.J.; Sutton, A.P. Electron-energy-loss spectra and the structural stability of nickel oxide: An LSDA+U study. Phys. Rev. B 1998, 57, 1505–1509. [Google Scholar] [CrossRef]
  53. Grimme, S.; Ehrlich, S.; Goerigk, L. Effect of the damping function in dispersion corrected density functional theory. J. Comput. Chem. 2011, 32, 1456–1465. [Google Scholar] [CrossRef] [PubMed]
  54. Giannozzi, P.; Giannozzi, P.; Baroni, S.; Bonini, N.; Calandra, M.; Car, R.; Cavazzoni, C.; Ceresoli, D.C.; Cococcioni, G.L.M. Advanced capabilities for materials modelling with Quantum ESPRESSO. J. Phys. Condens. Matter. 2017, 46, 465901. [Google Scholar] [CrossRef]
  55. Giannozzi, P.; Baroni, S.; Bonini, N.; Calandra, M.; Car, R.; Cavazzoni, C.; Ceresoli, D.; Chiarotti, G.L.; Cococcioni, M.; Dabo, I.; et al. QUANTUM ESPRESSO: A modular and open-source software project for quantum simulations of materials. J. Phys. Condens. Matter. 2009, 21, 395502. [Google Scholar] [CrossRef] [PubMed]
  56. Momma, K.; Izumi, F. VESTA 3for three-dimensional visualization of crystal, volumetric and morphology data. J. Appl. Crystallogr. 2011, 44, 1272–1276. [Google Scholar] [CrossRef]
  57. Soldemo, M.; Stenlid, J.H.; Besharat, Z.; Ghadami Yazdi, M.; Önsten, A.; Leygraf, C.; Göthelid, M.; Brinck, T.; Weissenrieder, J. The Surface Structure of Cu2O(100). J. Phys Chem. C 2016, 120, 4373–4381. [Google Scholar] [CrossRef]
  58. Kokalj, A.; Peljhan, S. Density Functional Theory Study of Adsorption of Benzotriazole on Cu2O Surfaces. J. Phys. Chem. C 2015, 119, 11625–11635. [Google Scholar] [CrossRef]
  59. Sompech, S.; Srion, A.; Nuntiya, A. The Effect of Ultrasonic Treatment on the Particle Size and Specific Surface Area of LaCoO3. Procedia Eng. 2012, 32, 1012–1018. [Google Scholar] [CrossRef]
  60. Dalapati, G.K.; Masudy-Panah, S.; Moakhar, R.S.; Chakrabortty, S.; Ghosh, S.; Kushwaha, A.; Katal, R.; Chua, C.S.; Xiao, G.; Tripathy, S.; et al. Nanoengineered Advanced Materials for Enabling Hydrogen Economy: Functionalized Graphene-Incorporated Cupric Oxide Catalyst for Efficient Solar Hydrogen Production. Global Chall. 2020, 4, 1900087. [Google Scholar] [CrossRef]
  61. Zhang, Y.-H.; Cai, X.-L.; Guo, D.-Y.; Zhang, H.-J.; Zhou, N.; Fang, S.-M.; Chen, J.-L.; Zhang, H.-L. Oxygen vacancies in concave cubes Cu2O-reduced graphene oxide heterojunction with enhanced photocatalytic H2 production. J. Mat. Sci. Mater. Electron. 2019, 30, 7182–7193. [Google Scholar] [CrossRef]
  62. Wang, C.; Tissot, H.; Escudero, C.; Pérez-Dieste, V.; Stacchiola, D.; Weissenrieder, J. Redox Properties of Cu2O(100) and (111) Surfaces. J. Phys Chem. C 2018, 122, 28684–28691. [Google Scholar] [CrossRef]
  63. An, X.; Li, K.; Tang, J. Cu2O/reduced graphene oxide composites for the photocatalytic conversion of CO2. ChemSusChem 2014, 7, 1086–1093. [Google Scholar] [CrossRef] [PubMed]
  64. Ho, W.C.J.; Tay, Q.; Qi, H.; Huang, Z.; Li, J.; Chen, Z. Photocatalytic and Adsorption Performances of Faceted Cuprous Oxide (Cu2O) Particles for the Removal of Methyl Orange (MO) from Aqueous Media. Molecules 2017, 22, 677. [Google Scholar] [CrossRef] [PubMed]
  65. Li, J.; Mei, Z.; Liu, L.; Liang, H.; Azarov, A.; Kuznetsov, A.; Liu, Y.; Ji, A.; Meng, Q.; Du, X. Probing defects in nitrogen-doped Cu2O. Sci. Rep. 2014, 4, 7240. [Google Scholar] [CrossRef] [PubMed]
  66. Engel, C.; Polson, T.; Spado, J.; Bell, J.; Fillinger, A. Photoelectrochemistry of Porous p-Cu2O Films. J. Electrochem. Soc. 2008, 155, F37–F42. [Google Scholar] [CrossRef]
  67. Grosse, P.; Yoon, A.; Rettenmaier, C.; Herzog, A.; Chee, S.W.; Roldan-Cuenya, B. Dynamic transformation of cubic copper catalysts during CO2 electroreduction and its impact on catalytic selectivity. Nat. Commun. 2021, 12, 6736. [Google Scholar] [CrossRef]
  68. Wu, N.; Wang, J.; Tafen, D.N.; Wang, H.; Zheng, J.G.; Lewis, J.P.; Liu, X.; Leonard, S.S.; Manivannan, A. Shape-enhanced photocatalytic activity of single-crystalline anatase TiO2 (101) nanobelts. J. Am. Chem. Soc. 2010, 132, 6679–6685. [Google Scholar] [CrossRef]
  69. Ehrnst, Y.; Sherrell, P.C.; Rezk, A.R.; Yeo, L.Y. Acoustically-Induced Water Frustration for Enhanced Hydrogen Evolution Reaction in Neutral Electrolytes. Adv. Energy Mat. 2022, 13, 2203164. [Google Scholar] [CrossRef]
  70. Shinagawa, T.; Garcia-Esparza, A.T.; Takanabe, K. Insight on Tafel slopes from a microkinetic analysis of aqueous electrocatalysis for energy conversion. Sci. Rep. 2015, 5, 13801. [Google Scholar] [CrossRef]
  71. Mei, B.-A.; Munteshari, O.; Lau, J.; Dunn, B.; Pilon, L. Physical Interpretations of Nyquist Plots for EDLC Electrodes and Devices. J. Phys. Chem. C 2017, 122, 194–206. [Google Scholar] [CrossRef]
  72. Wang, L.; Ge, J.; Wang, A.; Deng, M.; Wang, X.; Bai, S.; Li, R.; Jiang, J.; Zhang, Q.; Luo, Y.; et al. Designing p-Type Semiconductor–Metal Hybrid Structures for Improved Photocatalysis. Angew. Chem. Int. Ed. 2014, 53, 5107–5111. [Google Scholar] [CrossRef] [PubMed]
  73. Ekspong, J.; Gracia-Espino, E.; Wågberg, T. Hydrogen Evolution Reaction Activity of Heterogeneous Materials: A Theoretical Model. J. Phys. Chem. C 2020, 124, 20911–20921. [Google Scholar] [CrossRef]
  74. Ouiram, T.; Moonla, C.; Preechaworapun, A.; Tangkuaram, T. Enzyme-free Cu2O@MnO2/GCE for Hydrogen Peroxide Sensing. Electroanalysis 2019, 31, 1356–1362. [Google Scholar] [CrossRef]
  75. Koolen, C.D.; Luo, W.; Züttel, A. From Single Crystal to Single Atom Catalysts: Structural Factors Influencing the Performance of Metal Catalysts for CO2 Electroreduction. ACS Catal. 2022, 13, 948–973. [Google Scholar] [CrossRef]
  76. Liu, L.; Yang, W.; Sun, W.; Li, Q.; Shang, J.K. Creation of Cu2O@TiO2 composite photocatalysts with p-n heterojunctions formed on exposed Cu2O facets, their energy band alignment study, and their enhanced photocatalytic activity under illumination with visible light. ACS. Appl. Mater. Interfaces 2015, 7, 1465–1476. [Google Scholar] [CrossRef]
  77. Sterlin Leo Hudson, M.; Raghubanshi, H.; Awasthi, S.; Sadhasivam, T.; Bhatnager, A.; Simizu, S.; Sankar, S.G.; Srivastava, O.N. Hydrogen uptake of reduced graphene oxide and graphene sheets decorated with Fe nanoclusters. Int. J. Hydrogen Energy 2014, 39, 8311–8320. [Google Scholar] [CrossRef]
  78. Zheng, Y.; Jiao, Y.; Li, L.; Chen, Y.; Jaroniec, M.; Qiao, S. Toward Design of Synergistically Active Carbon Based Catalysts for Electrocatalytic Hydrogen Evolution. ACS Nano 2014, 8, 5290–5296. [Google Scholar] [CrossRef]
  79. Kareem, A.; Kunhiraman, A.K.; Maiyalagan, T. Hydrogen evolution reaction catalyzed by microstructured SrMoO4 decorated on three-dimensional nanostructured rGO/f-MWCNT in acidic medium. Ionics 2020, 26, 5055–5064. [Google Scholar] [CrossRef]
  80. Han, J.; Zong, X.; Zhou, X.; Li, C. Cu2O/CuO photocathode with improved stability for photoelectrochemical water reduction. RSC Adv. 2015, 5, 10790–10794. [Google Scholar] [CrossRef]
  81. Yu, X.; Zhang, X.; Wang, H.; Wang, Z.; Feng, G. High-Coverage H2 Adsorption on the Reconstructed Cu2O(111) Surface. J. Phys. Chem. C 2017, 121, 22081–22091. [Google Scholar] [CrossRef]
  82. Lai, W.; Ma, Z.; Zhang, J.; Yuan, Y.; Qiao, Y.; Huang, H. Dynamic Evolution of Active Sites in Electrocatalytic CO2 Reduction Reaction: Fundamental Understanding and Recent Progress. Adv. Funct. Mat. 2022, 32, 2111193. [Google Scholar] [CrossRef]
  83. Deng, Y.; Handoko, A.D.; Du, Y.; Xi, S.; Yeo, B.S. In Situ Raman Spectroscopy of Copper and Copper Oxide Surfaces during Electrochemical Oxygen Evolution Reaction: Identification of CuIII Oxides as Catalytically Active Species. ACS Catal. 2016, 6, 2473–2481. [Google Scholar] [CrossRef]
  84. Fan, M.; Gao, R.; Zou, Y.C.; Wang, D.; Bai, N.; Li, G.D.; Zou, X. An efficient nanostructured copper(I) sulfide-based hydrogen evolution electrocatalyst at neutral pH. Electrochim. Acta 2016, 215, 366–373. [Google Scholar] [CrossRef]
  85. Zhou, M.; Lian, C.; Xu, Z.; Pi, T.; Yang, K.; Chi, B.; Li, Z. Active copper(II) and copper(I) reviving repeatedly in situ on copper wire electrode for full water splitting at ultra-low potential. Appl. Surf. Sci. 2020, 505, 144653. [Google Scholar] [CrossRef]
  86. Johny, J.; Guzman, S.S.; Krishnan, B.; Martinez, J.A.; Avellaneda, D.; Shaji, S. SnS2 nanoparticles by liquid phase laser ablation: Effects of laser fluence, temperature and post irradiation on morphology and hydrogen evolution reaction. Appl. Surf. Sci. 2019, 470, 276–288. [Google Scholar] [CrossRef]
  87. Kong, F.; Qie, Y.; Liu, Y.; Yang, Z.; Shi, Z.; Yang, H. Magnetic properties and electrocatalytic properties of Fe5C2 particles with different morphologies. J. Mater. Sci. Mater. Electron. 2021, 33, 884–893. [Google Scholar] [CrossRef]
  88. Mukurala, N.; Mokurala, K.; Mohapatra, L.; Suman, S.; Kushwaha, A.K. Surface controlled synthesis of Cu2FeSnS4 particles for enhanced hydrogen evolution reaction. Int. J. Hydrogen Energy 2021, 46, 34689–34700. [Google Scholar] [CrossRef]
Figure 1. (a) 3D geometric model of Cu2O particles: (i) C-Cu2O; (ii) O-Cu2O; (iii) TO PVP-Cu2O; (iv) TO-Cu2O; and (v) S-Cu2O. Morphologies of Cu2O microparticles: (b) O-Cu2O; (c) TO-Cu2O; (d) C-Cu2O; (e) TO PVP-Cu2O; (f) S-Cu2O; and (g) XRD patterns of geometrical Cu2O particles.
Jcs 07 00403 g001
Figure 2. Morphologies of Cu2O@rGO aerogel. (a) O-G, (b) TO-G, (c) C-G, (d) TO PVP-G, (e) S-G, and (f) XRD patterns of Cu2O@rGO composites.
Jcs 07 00403 g002
Figure 3. PL spectra of Cu2O particles and Cu2O@rGO composites. The inset plot showed the spectra for TO PVP-G, O-G, TO-G, and S-G at higher zoom. The arrow indicates the vertical direction of intensities.
Jcs 07 00403 g003
Figure 4. HER catalytic performance of geometrical Cu2O particles in 0.5 M H2SO4 solution. (A) LSV curves at scan rate 5 mV s−1, (B) Tafel plots of HER, (C) CA measurements of short-term stability, and (D) Nyquist plots at 0 V vs. RHE. The dot line in subfigure a represents the overpotential at 10 mA/cm2. The inset plot showed a high-frequency region of the Nyquist plot.
Jcs 07 00403 g004
Figure 5. HER catalytic performance of Cu2O@rGO composites in 0.5 M H2SO4. (A) LSV curves at scan rate of 5 mV s−1, (B) Tafel plots of HER, (C) CA measurements of short-term stability, and (D) Nyquist plots at 0 V vs. RHE. The dot line in subfigure a represents the overpotential at 10 mA/cm2. The inset plot showed the high-frequency region of the Nyquist plot.
Jcs 07 00403 g005
Figure 6. SEM images of samples on the working electrode after hydrogen evolution reaction. (A) O-Cu2O and (B) S-G composites.
Jcs 07 00403 g006
Table 1. Properties of Cu2O geometrical particles.
Cu2O ParticleLabel100/111 Ratio (r)Size (µm)
CubeC-Cu2O1001.1 ± 0.1
OctahedronO-Cu2O02.0 ± 0.5
Truncated Octahedron PVPTO PVP-Cu2O0.261.0 ± 0.3
Truncated OctahedronTO-Cu2O0.091.0 ± 0.3
StarS-Cu2O-2.4 ± 0.5
O represents octahedron, C represents cubic, TO represents truncated octahedron and S represents star-like.
Table 2. Electrochemical features and performance of geometrical Cu2O particles.
Cu2O ParticleOnset (mV)Overpotential (mV) at 10 mA/cm2Tafel Slope (mV/dec)ESA (mm2)
O-Cu2O−330−5491265.9
TO PVP-Cu2O−375−5871277.0
TO-Cu2O−419−6201484.0
C-Cu2O−417−6291354.9
S-Cu2O−410−6341474.7
Table 3. Electrochemical properties and electrochemical performance of Cu2O@rGO geometrical particles.
Cu2O@rGOOnset (mV)Overpotential (mV) at 10 mA/cm2Tafel Slope (mV/dec)ESA (mm2)
O-G−295−5002109.2
TO PVP-G−357−59818115.8
TO-G−315−48220524.2
C-G−355−53315616.3
S-G−310−45820013.0
Table 4. Overpotential values for electrocatalyst systems for HERs.
CatalystElectrolyteOverpotential (mV) at 10 mA/cm2Reference
Cu2O/copper foam1 M Phosphate buffer solution−255[84]
Cu2O-CuO/copper wire1 M KOH−350[85]
SnS2/GCE1 M H2SO4−800 (16.5) [86]
Fe5C2/GCE1 M KOH−365 to −225[87]
Cu2FeSnS4/GCE0.5 M H2SO4−470 to −421[88]
Cu2O/rGO/GCE0.5 M H2SO4−598 to −458This work
Disclaimer/Publisher’s Note: The statements, opinions and data contained in all publications are solely those of the individual author(s) and contributor(s) and not of MDPI and/or the editor(s). MDPI and/or the editor(s) disclaim responsibility for any injury to people or property resulting from any ideas, methods, instructions or products referred to in the content.

