
Flexural Characteristics of Functionally Layered Fiber-Reinforced Cementitious Composite with Polyvinyl Alcohol Fibers


1
Graduate School of Science and Technology, University of Tsukuba, Tsukuba 305-8577, Japan
2
Division of Engineering Mechanics and Energy, University of Tsukuba, Tsukuba 305-8577, Japan
*
Author to whom correspondence should be addressed.
J. Compos. Sci. 2023, 7(7), 293; https://doi.org/10.3390/jcs7070293
Submission received: 31 May 2023
/
Revised: 30 June 2023
/
Accepted: 12 July 2023
/
Published: 15 July 2023
(This article belongs to the Special Issue Functional Composites: Fabrication and Application)
Abstract
:The main purpose of this study is to investigate the flexural characteristics of a functionally layered fiber-reinforced cementitious composite (FL-FRCC) with polyvinyl alcohol fibers and to verify the adaptability of the proposed tri-linear stress-strain model based on the bridging law for large fiber orientation intensity, which shows the fiber orientation distribution as almost 2-D. The average maximum bending moment of FL-FRCC specimens is almost twice that of homogeneous (Hmg-FRCC) specimens, which indicates that the FL-FRCC specimens lead to larger bending capacity. The proposed wide-range stress-strain model based on the bridging law was verified and showed good adaptability with the experimental results through a comparison with the conducted section analysis.
1. Introduction
Conventional fiber-reinforced cementitious composites (FRCCs), which adopt a certain volume fraction of synthetic or metallic fibers in cementitious-based materials, have been widely employed in various infrastructure and building facilities such as tunnel lining, bridge decks, and wall panels [1,2]. Since the crack bridging performance of the mixed fibers can effectively enhance the flexural and durability performance whilst improving the inherent brittleness of the cementitious structure after the first crack development [3,4], a number of researches [5,6,7,8] have been devoted to assess and evaluate the mechanical properties of FRCCs.
It is reported that multiple factors, which include the casting directions, flow, fiber orientation, and formwork geometry, etc. [9], affect the strain or deflection hardening and ductile performance. Fiber orientation and distribution, which can directly affect the bridging performance of FRCCs, are considered to be two of the most significant influential factors due to the high viscosity and self-consolidating properties of the cementitious matrix. Krenchel [10] attempted to apply a coupled parameter of the orientation and distribution of the fibers from a wider perspective than mere particular cases, which allows for a better understanding of the fracture results. Laranjeira [11] proposed a parametric study and engineered expressions based on the mechanical pull-out properties and orientations of the steel fibers. It should be pointed out that the fiber orientation changes at random from 2-D to 3-D due to the dimensions of the specimen [12]. Kanakubo et al. (2016) [13] introduced an elliptic function to quantitatively evaluate the fiber orientation intensity, which reflects the orientation tendency of fibers, and investigated the influence of casting direction on fiber orientation distribution. Duque and Graybeal [14] discussed and validated the anisotropy in the fiber orientation distribution and the tensile mechanical properties as a consequence of the casting process and the flow pattern. They proposed a fiber orientation factor considering the fiber orientation distribution impact on the design methodologies for ultra-high performance fiber reinforced concrete (UHPFRC). Kang and Kim [15] used the image analysis process and bending tests to confirm that the fiber orientation distribution has a strong impact on the deflection hardening behavior in bending using the measured fiber orientation distributions for two different flexural performances.
Functionally layered materials, including functionally graded materials, are new types of composite materials that improve the deficiency of individual material properties and take full advantage of each material by a specific process. These kinds of composite materials have undergone a series of materials and emerging structural developments after the concept introduction for industrial applications such as in the aerospace, automotive, and biomedical fields [16,17,18]. Some studies [19,20,21,22,23] have applied the concept of a functional gradient to the field of cementitious structures in order to maximize the rational application of the mechanical properties while reducing costs and the emission of greenhouse gases. Torelli and Lees [24] proposed an original fresh-on-fresh casting method to generate functionally layered concrete sections composed of an external U-shaped durability layer of low porosity concrete and a rectangular lightweight bulk core section, which aimed at minimizing the use of cement and to reduce the self-weight of precast concrete beams. Dias et al. (2010) [25] employed the thermogravimetric analysis to assess fiber distribution and four-point bending tests to evaluate the mechanical performance of both conventional and graded composites. Lai et al. (2021) [26] focused on the effect of high-speed penetration to explosion resistance of the functionally graded cementitious composite and proposed the improved empirical formulas for penetration, explosion, and the coupling of penetration and explosion, respectively. Bao et al. (2023) [27] optimized the design of functionally graded ultra-high performance cementitious composite (FGUHPCC) by using a numerical simulation program named RFPA3D and investigated the flexural behavior of FGUHPCC. Kanakubo and Koba [28] investigated the flexural characteristics of functionally graded fiber-reinforced cementitious composite (FG-FRCC) concerning the fiber volume fraction varying in layers and the layered effect in bending specimens.
The layered FRCC, in which the fibers tend to show a 2-D orientation, has the possibility to maximize the bridging effect of the fibers, and leads to the higher tensile performance and durability of the FRCC. It is considered that the 2-D orientation of fibers can be generated easily if the thickness of the layer becomes smaller than the length of dispersed fibers. The main purpose of this study is to try to fabricate the functionally layered fiber-reinforced cementitious composite (FL-FRCC) and investigate its characteristics through evaluating the bending test and the section analysis. To perform the section analysis, a tensile stress–strain model is required. This study also aims to propose a tensile stress–strain model of FRCC with wider applicability based on the bridging law (tensile stress–crack width relationship) and fiber orientation. The bridging law of 2-D oriented FRCC can be represented by the proposed model. The target fibers are polyvinyl alcohol (PVA) fibers, in which the bridging law has been studied by authors [13]. This previous study has described the effect of fiber orientation on the bridging law using the fiber orientation intensity, k. The random orientation of fibers is given by k = 1. When the value of k is larger than 1, fibers tend to orient toward the principal direction. In the case of a completely one-directional orientation, k is represented by infinite. In the range of k from 0.5 to 6, good adaptability has been confirmed between the calculated bridging law and the uniaxial tension test results in this previous study.
2. Modification of the Bridging Law for PVA-FRCC
The authors have conducted a previous study on a visualization simulation experiment using a water–glass solution [29]. This previous research mainly focused on the influence of the placing thickness on fiber orientation distribution and the bridging law, which leads to the conclusion that a smaller placing thickness can effectively improve the bending performance of the FRCC. Figure 1 shows examples of the visualization simulation in the case of a 10 mm placing thickness. The black nylon fibers are 12 mm in length and 0.24 mm in diameter, which can be easily identified in the transparent water glass where a solution is applied in the visualization simulation experiment. It has been recognized that the fibers strongly tend to orientate in the axial direction (y-axis) in the y–z plane. The histograms for a placing thickness of 10 mm were generated by image progress and statistical counting, as shown in Figure 2. The values for the fiber orientation intensity, k, shown in the figures exhibit the results of the regression analysis in the histograms. In this case, the fiber orientation with a placing thickness of 10 mm can be simplified as a 2-D issue, which is considered to be consistent with the situation that nearly all the fibers in the y–z plane in the matrix are in the same orientation.
Ozu et al. (2018) [30] has proposed a tri-linear model, described by Equation (1), that gives the bridging law considering fiber orientation expressed by the function of the fiber orientation intensity, k, based on the calculated bridging law shown in Figure 3a. Figure 3b illustrates the proposed tri-linear model of the bridging law characterized by the parameters in Equation (1) [30]. The proposed model has been built for the range of k from 0 to 10. Using this model extrapolated, the values of tensile stresses become infinite as the value of k becomes infinite. This fact results in the Ozu-proposed model not being able to be adopted for FRCCs with a 10 mm placing thickness, in which the value of k is large enough.
where, : maximum tensile stress, MPa; : tensile stress at second snapping point, MPa; : crack width at , mm.
The proposed model has been derived by the calculation results of the bridging law, i.e., the summation of the pullout load of all individual fibers crossing the crack [13]. This calculation method can give the maximum bridging force if all the fibers in the matrix are in the same orientation. In the previous study [13], the maximum pullout load of the individual fiber is given as 3.0 N in the case of target PVA fibers (0.1 mm diameter and 12 mm length). Thus, the maximum tensile stress in the case of a volume fraction of 2% can be given by following formula:
where is the fiber volume fraction, 2%; is the total number of fibers; is the sectional area of the fiber, 0.007854 mm2; is the cross-sectional area of the matrix; and is the maximum pullout load of an individual fiber, 3.0 N.
The crack width at the maximum pullout load of an individual fiber is given as 0.45 mm [13]. If all the fibers in the matrix are in the same orientation, the crack width at the maximum tensile stress can be given at the same crack width.
Based on the above-mentioned considerations and the same input value as in a previous study [29], tri-linear models of maximum tensile stress and crack width at maximum tensile stress are asymptotically approaching 7.6 MPa and 0.45 mm, respectively, when k is infinite. Based on the regression analysis with the calculation results, the following formulas are proposed, as shown in Figure 4.
where, , , and all refer to the same meaning as in Equation (1).
The comparison of the proposed model and previously studied model (Ozu model) [30] are shown in Figure 5; in the case of a fiber orientation intensity of 2.8 and 250, those are the averaged fiber orientation intensity values between the y–z and x–y planes for a 100 mm placing thickness and a 10 mm one, respectively [29].
As Figure 4 revealed, the fitting result based on the proposed model is slightly better than the Ozu model when the fiber orientation intensity ranges from 0 to 20. As for Figure 5, in the case where the fiber orientation intensity, k, is 2.8, both the tensile stress–strain relationship derived from the proposed model and the Ozu model are nearly the same, which is consistent with the former fitting effect. However, in the case where the fiber orientation intensity is 250, the proposed model can still effectively describe the relationship between tensile stress and crack width, while the results of Ozu’s model lead to a large discrepancy with the actual cognition relationship. By comparing the described results of the models, it can be considered that the proposed model can more accurately describe the bridging law of the fiber orientation intensity and has a wider application range from 0 to infinite.
3. Experiment Program
In FL-FRCC, the thickness of each layer is smaller than the fiber length and the fibers tend to show a 2-D orientation, creating a possibility to maximize the bridging effect of the fibers, which leads to a higher tensile performance. In order to verify this consideration, FL-FRCC specimens and homogeneous (Hmg-FRCC) specimens are designed and fabricated per the following instructions.
3.1. Materials
The mechanical properties of the PVA fibers utilized in this study are listed in Table 1, which are the same with those used in previous studies [13,29,30]. The mixture proportion of FRCC is listed in Table 2 and the fiber volume fraction of both FL-FRCC specimens and Hmg-FRCC specimens are set to 2%. Both the FL-FRCC and Hmg-FRCC specimens follow the same fabrication order as below. Firstly, early-strength cement, fly ash, sand and drying shrinkage reducing agent are added in at one time and mixed for 60 s. Secondly, water and a high-range water reducing agent are added in the mixer. After 180 s of mixing, the first flow time test based on the test method for the flowability of grout for prestressing tendons (JSCE-F 531) [31] is then carried out to measure the rheology of the matrix. The second flow time test is conducted after the addition of thickener to increase the viscosity and fluidity of the matrix. The results of the two flow time tests are 15.3 s and 54.5 s, respectively. In order to fully mix the PVA fibers, half of the fibers are added to the mixer for the first mixing of 30 s, and the other half of the fibers are then added to the mixer for 120 s of mixing. Finally, the air content of the FRCC is measured, which result refers to 3.9%.
3.2. Specimen
The specimen type overview is listed in Table 3. Each 400 × 100 × 10 mm FL-FRCC-plate is poured in the same direction. One side of the mold is raised 12 mm to ensure that the FRCC is poured in the same direction under the gravity effect, as shown in Figure 6. Individual FL-FRCC plates are cured for two weeks at room environment, and the execution works for the bonding of plates are carried out. Considering the adhesive thicknesses of the layers, every nine of plates are bonded together with epoxy adhesive to make the total height of the whole FL-FRCC specimen around 100 mm. The epoxy adhesive used in this study is made by Mitsubishi Chemical Infratec Co., Ltd. The main properties of the epoxy adhesive provided by the maker are listed in Table 4. The main agent and hardener of the epoxy resin are fully mixed at a weight ratio of 2:1. Clamps and a guider are used to tie up and retain the holistic shape and height of the specimen consistent with homogeneous specimen until the epoxy adhesive is tightly bonded with each layer, as shown in Figure 7. The spilled epoxy adhesive is scraped off to keep the specimen surface flat. After the fixed formation of the whole FL-FRCC specimen, the height of the specimen was measured, as shown in Figure 8, and the results are listed in Table 5.
Four-point bending tests are conducted to obtain the relationship of the bending moment and curvature following ISO 21914:2019 [33] using the universal loading machine. The π-type linear variable displacement transducers (LVDT) are respectively set at 15 mm from the edge of the specimen. All the FL-FRCC and Hmg-FRCC specimens are set on the test platform of the loading machine with the same placing method where the casting surface is kept upside, as shown in Figure 9. For compressive strength, Φ100 mm × 200 mm cylinder test pieces are prepared and tested according to the instruction of ISO 1920-4:2020 [34]. The result of the average compressive strength is 55.6 MPa.
4. Experiment Results
4.1. Failure Pattern
Figure 10 shows the typical crack development results of the FL-FRCC specimens and Hmg-FRCC specimens after loading. It can be learned from the Figure 10 that only one crack developed in the middle area of each of the FL-FRCC and Hmg-FRCC specimens. Numerous PVA fibers can be seen on the ruptured section of both specimens.
4.2. Bending Moment: A Curvature Relationship
The relationship between the bending moment and curvature is shown in Figure 11. The initial crack of each Hmg-FRCC specimen is observed before it reaches the maximum bending moment. For FL-FRCC specimens, the initial crack of each specimen is observed before reaching the maximum bending moment, but very soon, the FL-FRCC specimens reach the maximum bending moment. For Hmg-FRCC specimens, after reaching the maximum value, the bending moment decreases with the increase in the curvature. This bending moment–curvature relationship tendency also applies to FL-FRCC specimens. However, the curves of FL-FRCC specimens all show a steeper decline phase after reaching the maximum bending moment, which indicated a relative brittleness in this kind of FL-FRCC specimen, while the curve of Hmg-FRCC specimens decrease more slowly with the increase in the curvature. The maximum bending moments of specimens are listed in Table 6. The average maximum bending moment of FL-FRCC specimens is 1.62 MPa, which is almost two times that of Hmg-FRCC specimens. This fact indicates that the FL-FRCC specimens could have a larger bending capacity.
4.3. Comparison of the Section Analysis and Experiment Results
Section analysis based on the proposed bridging law is conducted to compare with the experiment results. The stress–strain model used in the analysis is shown in Figure 12. The proposed bridging law, given by Equation (3) and shown in Figure 5, is converted to a tensile stress–strain model as that the crack width is divided by the gauge length of LVDTs, which is equal to the length of the constant moment region. Popovics [35] introduced the complete stress–strain models of concrete and mortar, which provided a better fitting effect compared to the experiment, as expressed by Equation (4). Popovics’ model is also applied in the compression side of stress–strain model in the section analysis of this study. The compressive strength and strain at the maximum stress are decided as the average results obtained by the compression test described in Section 3.2. The coefficient n is obtained by the fitting calculation of the compression test results, as shown in Figure 13.
where is the compressive strength of the specimen; is the strain at maximum stress; and n is the coefficient.
Table 6 lists the results of the section analysis comparing the experiment results. It can be seen from the results of the section analysis that the maximum bending moment of FL-FRCC specimens is 1.66 MPa, which is 1.77 times that of Hmg-FRCC specimens. For both FL-FRCC and Hmg-FRCC specimens, it is considered that the section analysis results show a good consistency with the experiment results since the ratio of experiment to analysis is around 1.00, in which the deviation is no more than 10%, especially for FL-FRCC specimens. This fact also verifies that the proposed bridging law in Section 2 considers the infinite orientation intensity and shows good adaptability with FL-FRCC specimens.
Curvatures at the maximum bending moment calculated by the section analysis do not show good adaptability with the ones obtained by the experiment. The reasons for that are considered to be that the layered FRCC would cause a chain of fractures in each adjacent layer in the case of FL-FRCC specimens. In the case of Hmg-FRCC specimens, the wide constant moment region around the maximum bending moment leads to the scattering of the curvature at the maximum. On the other hand, the absorbed energy generally refers to the ability of materials to absorb the post-crack energy and can be calculated from the bending moment–rotation angle relationship. In this study, the absorbed energy was calculated from 0 to 0.05 of the rotation angles (equal to a curvature of 0 to 0.50 m−1) and the results are listed in Table 6. The experiment results show that the absorbed energy of FL-FRCC specimens is 1.14 times larger than that of Hmg-FRCC specimens, which indicates that FL-FRCC specimens have a larger bending capacity but also an increased relative brittleness compared to the Hmg-FRCC specimens.
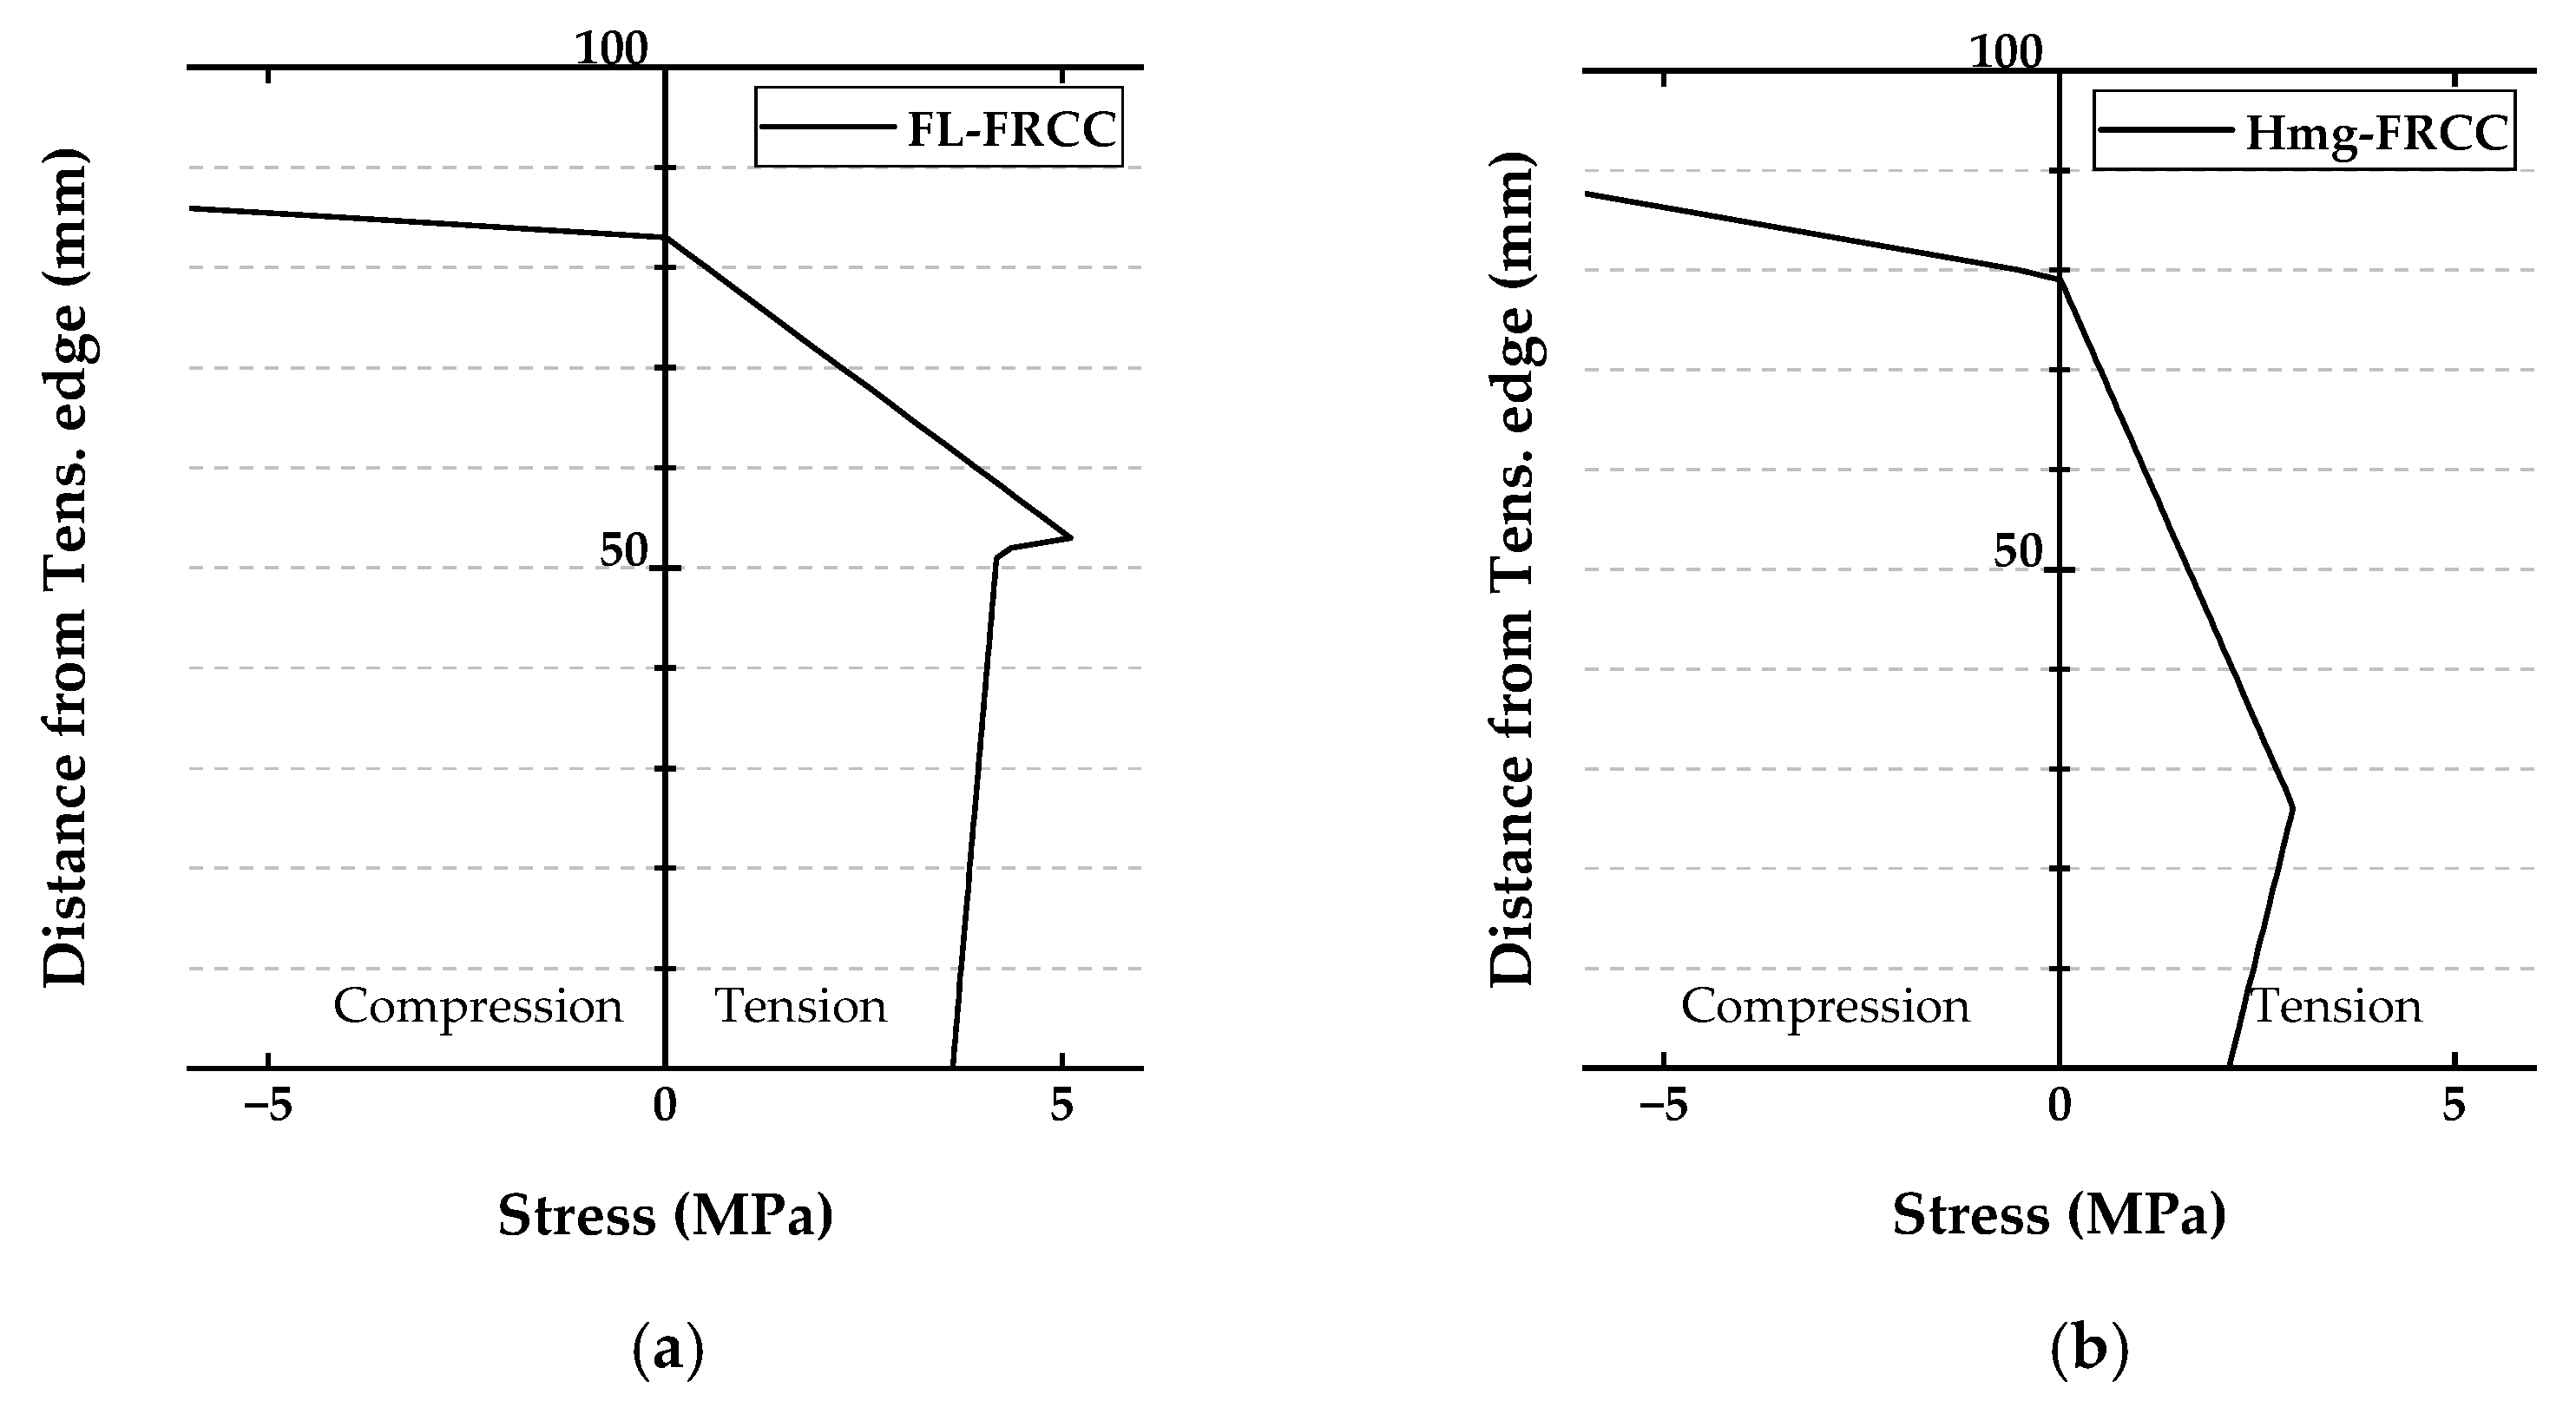
The stress distributions in the cross-section at the maximum bending moment are shown in Figure 14. For Hmg-FRCC specimens, the maximum bending moment would occur while the tensile stress reaches the maximum at about one-fourth of the cross-section height from the tension edge. As for FL-FRCC specimens, the tensile stress reaches the maximum at approximately half of the cross-section height from the compression edge; thus, it is considered that FL-FRCC specimens can effectively apply the bending capacity of the whole specimen.
5. Conclusions
Based on the proposed stress–strain model considering the bridging law and the results of the bending tests and section analysis conducted to investigate the flexural characteristics of the FL-FRCC, the following conclusions can be drawn:
- Based on the previous visualization simulation results, a bridging law model is proposed with a wider range of fiber orientation intensity applications, including the situation of being infinite. Compared to the Ozu model, the proposed model has proven to have a better fitting and predicting effect;
- FL-FRCC specimens, in which the thickness of each layer is smaller than the fiber length and the mixed fibers tend to show a 2-D orientation, are fabricated. Bending tests were conducted and the results show that the average maximum bending moment of FL-FRCC specimens is nearly twice that of the Hmg-FRCC specimens. The bending moment-curvature curves of FL-FRCC specimens shows a steeper decline phase after reaching the maximum bending moment compared to that of Hmg-FRCC specimens. And the absorbed energy of FL-FRCC specimens is also larger than that of Hmg-FRCC specimens. These facts suggest the FL-FRCC specimens can lead to a larger bending capacity and also the relative brittleness compared to the Hmg-FRCC specimens;
- Section analysis based on the proposed stress–strain model was conducted. The ratio of the experiment to analysis ranged from 0.93 to 0.98, which can lead to the conclusion that the section analysis shows a good adaptability with the experiment result. Curvatures at the maximum bending moment calculated by the section analysis do not show good adaptability with the ones obtained by the experiment. The reasons for that are considered to be that the layered FRCC would cause a chain of fractures in each adjacent layer in the case of FL-FRCC specimens. In the case of Hmg-FRCC specimens, the wide constant moment region around the maximum bending moment leads to the scattering of the curvature at the maximum;
- For FL-FRCC specimens, the tensile stress reaches the maximum at approximately half of the cross-section height from the compression edge; it is considered that FL-FRCC specimens can effectively apply the bending capacity of the whole specimen compared to the Hmg-FRCC specimens.
Author Contributions
Conceptualization, T.K. and H.Z.; methodology, T.K. and H.Z.; validation, T.K.; formal analysis, T.K. and H.Z.; investigation, T.K. and H.Z.; writing—original draft preparation, H.Z.; writing—review and editing, T.K.; visualization, H.Z.; supervision, T.K.; project administration, T.K.; funding acquisition, T.K. All authors have read and agreed to the published version of the manuscript.
Funding
This research received no external funding.
Data Availability Statement
The data that support the findings of this study are available from the corresponding author upon reasonable request.
Conflicts of Interest
The authors declare no conflict of interest.
References
- Li, V.C. Engineered Cementitious Composites (ECC)—Bendable Concrete for Sustainable and Resilient Infrastructure; Springer: Berlin/Heidelberg, Germany, 2019. [Google Scholar]
- Rokugo, K.; Kanda, T. Strain Hardening Cement Composites: Structural Design and Performance; RILEM State-of-the-Art Reports 6; E. & FN Spon: London, UK, 2013. [Google Scholar]
- Li, V.C. On Engineered Cementitious Composites (ECC)—A Review of the Material and Its Applications. J. Adv. Concr. Technol. 2003, 1, 215–230. [Google Scholar] [CrossRef] [Green Version]
- Li, V.C. Progress and Application of Engineered Cementitious Composites. J. Chin. Ceram. Soc. 2007, 35, 531–536. [Google Scholar]
- Balaguru, P.N.; Shah, S.P. Introduction, Fiber-Reinforced Cement Composites; McGraw-Hill: New York, NY, USA, 1992; pp. 1–15. [Google Scholar]
- Zollo, R.F. Collated Fibrillated Polypropylene Fibers in FRC. In Proceedings of the Fiber Reinforced Concrete International Symposium (ACI SP-81), Detroit, MI, USA, 1 November 1984; pp. 397–409. [Google Scholar]
- Naaman, A.E.; Reinhardt, H.W. High Performance Fiber Reinforced Cement Composites: HPFRCC 2; E. & FN Spon: London, UK, 1996. [Google Scholar]
- Li, V.C. Large volume, high-performance applications of fibers in civil engineering. J. Appl. Polym. Sci. 2002, 83, 660–686. [Google Scholar] [CrossRef] [Green Version]
- Laranjeira, F.; Aguado, A.; Molins, C.; Grünewald, S.; Walraven, J.; Cavalaro, S. Framework to predict the orientation of fibers in FRC: A novel philosophy. Cem. Concr. Res. 2012, 42, 752–768. [Google Scholar] [CrossRef]
- Krenchel, H. Fibre Spacing and Specific Fibre Surface. Fibre Reinf. Cem. Concr. 1975, 1975, 69–79. [Google Scholar]
- Laranjeira, F. Design Oriented Constitutive Model for Steel Fiber Reinforced Concrete. Ph.D. Thesis, Universitat Politècnica de Catalunya, Barcelona, Spain, 26 March 2010. [Google Scholar]
- Li, V.C.; Wang, S. On High Performance Fiber Reinforced Cementitious Composites. In Proceedings of the JCI Symposium on Ductile Fiber-Reinforced Cementitious Composites, Tokyo, Japan, 4–5 December 2003; pp. 13–23. [Google Scholar]
- Kanakubo, T.; Miyaguchi, M.; Asano, K. Influence of Fiber Orientation on Bridging Performance of Polyvinyl Alcohol Fiber-Reinforced Cementitious Composite. ACI Mater. J. 2016, 113, 131–141. [Google Scholar] [CrossRef]
- Duque, L.F.M.; Grayeal, B. Fiber orientation distribution and tensile mechanical response in UHPFRC. Mater Struct. 2017, 50, 55. [Google Scholar] [CrossRef]
- Kang, S.T.; Kim, J.K. Investigation on the flexural behavior of UHPCC considering the effect of fiber orientation distribution. Const. Bldg. Mater. 2012, 28, 57–65. [Google Scholar] [CrossRef]
- Gupta, A.; Talha, M. Recent development in modeling and analysis of functionally graded materials and structures. Prog. Aerosp. Sci. 2015, 79, 1–14. [Google Scholar] [CrossRef]
- Pompe, W.; Worch, H.; Epple, M. Functionally Graded Materials for Biomedical Applications. Mater. Sci. Eng. A 2003, 362, 40–60. [Google Scholar] [CrossRef]
- El-Galy, I.M.; Saleh, B.I.; Ahmed, M.H. Functionally Graded Materials Classifications and Development Trends from Industrial Point of View. SN Appl. Sci. 2019, 1, 1378. [Google Scholar] [CrossRef] [Green Version]
- Zhou, F.; Zhou, R.; Du, Y.; Wang, Y. Flexural Behavior of Layered CTRC-ECC Reinforced Cementitious Composite Plates. J. Bldg. Eng. 2022, 62, 105283. [Google Scholar] [CrossRef]
- Yuan, H.; Fu, X.H.; Fan, Y.C.; Fu, B.; Zou, Q.Q. Flexural Performance of Layered Macro Fiber Reinforced Concrete Beams. Const. Bldg. Mater. 2022, 357, 129314. [Google Scholar] [CrossRef]
- Rydval, M.; Čítek, D.; Kolísko, J.; Nenadálová, Š.; Bittner, T. Functionally Layered Thin Slabs Made from UHPC and ECC Composites. Solid State Phenom. 2017, 259, 90–96. [Google Scholar] [CrossRef]
- Akshaya, S.L.; Prakash, A.; Bharati Raj, J. Applications of Functionally Graded Materials in Structural Engineering—A Review. In Proceedings of SECON 2020; Lecture Notes in Civil Engineering; Springer: Berlin/Heidelberg, Germany, 2020; Volume 97. [Google Scholar]
- Liu, Q.; Zhang, H.; Hong, P.; Han, S. A Brief Review on the Fabrication and Mechanical Behavior of Functionally Graded Concrete Materials. IOP Conf. Ser. Earth Environ. Sci. 2020, 525, 012142. [Google Scholar] [CrossRef]
- Torelli, G.; Lees, J.M. Interface bond strength of lightweight low-cement functionally layered concrete elements. Const. Bldg. Mater. 2020, 249, 118614. [Google Scholar] [CrossRef]
- Dias, C.; Savastano, H.; John, V.M. Exploring the potential of functionally graded materials concept for the development of fiber cement. Const. Bldg. Mater. 2010, 24, 140–146. [Google Scholar] [CrossRef]
- Lai, J.; Zhou, J.; Yin, X.; Zheng, X. Dynamic behavior of functional graded cementitious composite under the coupling of high speed penetration and explosion. Compos. Struct. 2021, 274, 114326. [Google Scholar] [CrossRef]
- Bao, S.; Zhang, Y.; Liu, H.; Zeng, K.; Zhang, W. Optimization design of functionally graded ultra-high performance cementitious composite on flexural behavior. Struct. Concr. 2023, 24, 2245–2259. [Google Scholar] [CrossRef]
- Kanakubo, T.; Koba, T. Flexural characteristics of functionally graded fiber-reinforced cementitious composite with polyvinyl alcohol fiber. J. Compos. Sci. 2021, 5, 94. [Google Scholar] [CrossRef]
- Zhang, H.; Kanakubo, T. Influence of Placing Thickness on Fiber Orientation and Bridging Law of FRCC. In Strain Hardening Cementitious Composites; SHCC 2022; RILEM Bookseries; Springer: Berlin/Heidelberg, Germany, 2022; Volume 39. [Google Scholar]
- Ozu, Y.; Miyaguchi, M.; Kanakubo, T. Modeling of Bridging Law for PVA Fiber-Reinforced Cementitious Composite Considering Fiber Orientation. J. Civ. Eng. Archit. 2018, 12, 651–661. [Google Scholar]
- JSCE-F 531-2013; Standard Specifications for Concrete Structures — 2013, Test Methods and Specifications. Japan Society of Civil Engineers: Tokyo, Japan, 2013; pp. 281–282. (In Japanese)
- JIS K 5400; Testing Methods for Paints. Japanese Industrial Standard. Japanese Standards Association (JSA): Tokyo, Japan, 1990. (In Japanese)
- ISO 21914: 2019; Test Methods for Fibre-Reinforced Cementitious Composites—Bending Moment—Curvature Curve by Four-Point Bending Test. ISO: Geneva, Switzerland, 2019.
- ISO 1920-4: 2020; Testing of Concrete—Part 4: Strength of Hardened Concrete. ISO: Geneva, Switzerland, 2020.
- Popovics, S. A numerical approach to the complete stress-strain curve of concrete. Cem. Concr. Res. 1973, 3, 583–599. [Google Scholar] [CrossRef]
Figure 1.
Photos of the water–glass simulation, side and up view, with a 10 mm placing thickness [29].
Figure 1.
Photos of the water–glass simulation, side and up view, with a 10 mm placing thickness [29].
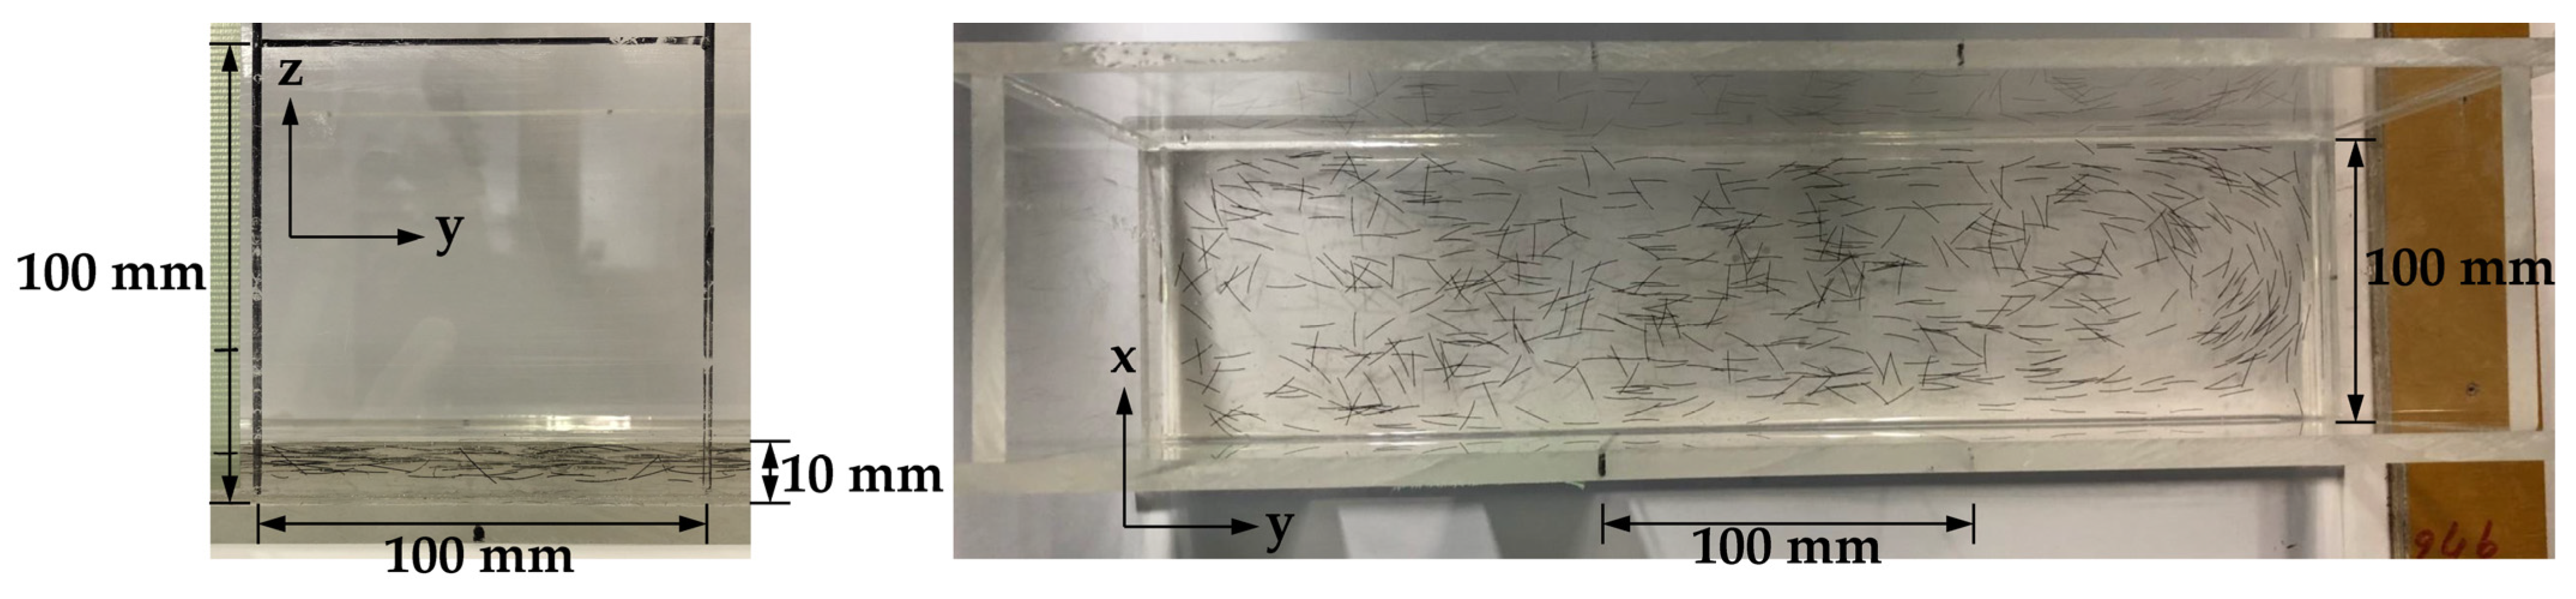
Figure 2.
Fiber angle histograms with a placing thickness of 10 mm [29]: (a) y-z plane; (b) x-y plane.
Figure 2.
Fiber angle histograms with a placing thickness of 10 mm [29]: (a) y-z plane; (b) x-y plane.

Figure 3.
Calculation result and tri-linear model of the bridging law for PVA-FRCC [30]: (a) Calculation result; (b) Tri-linear model.
Figure 3.
Calculation result and tri-linear model of the bridging law for PVA-FRCC [30]: (a) Calculation result; (b) Tri-linear model.
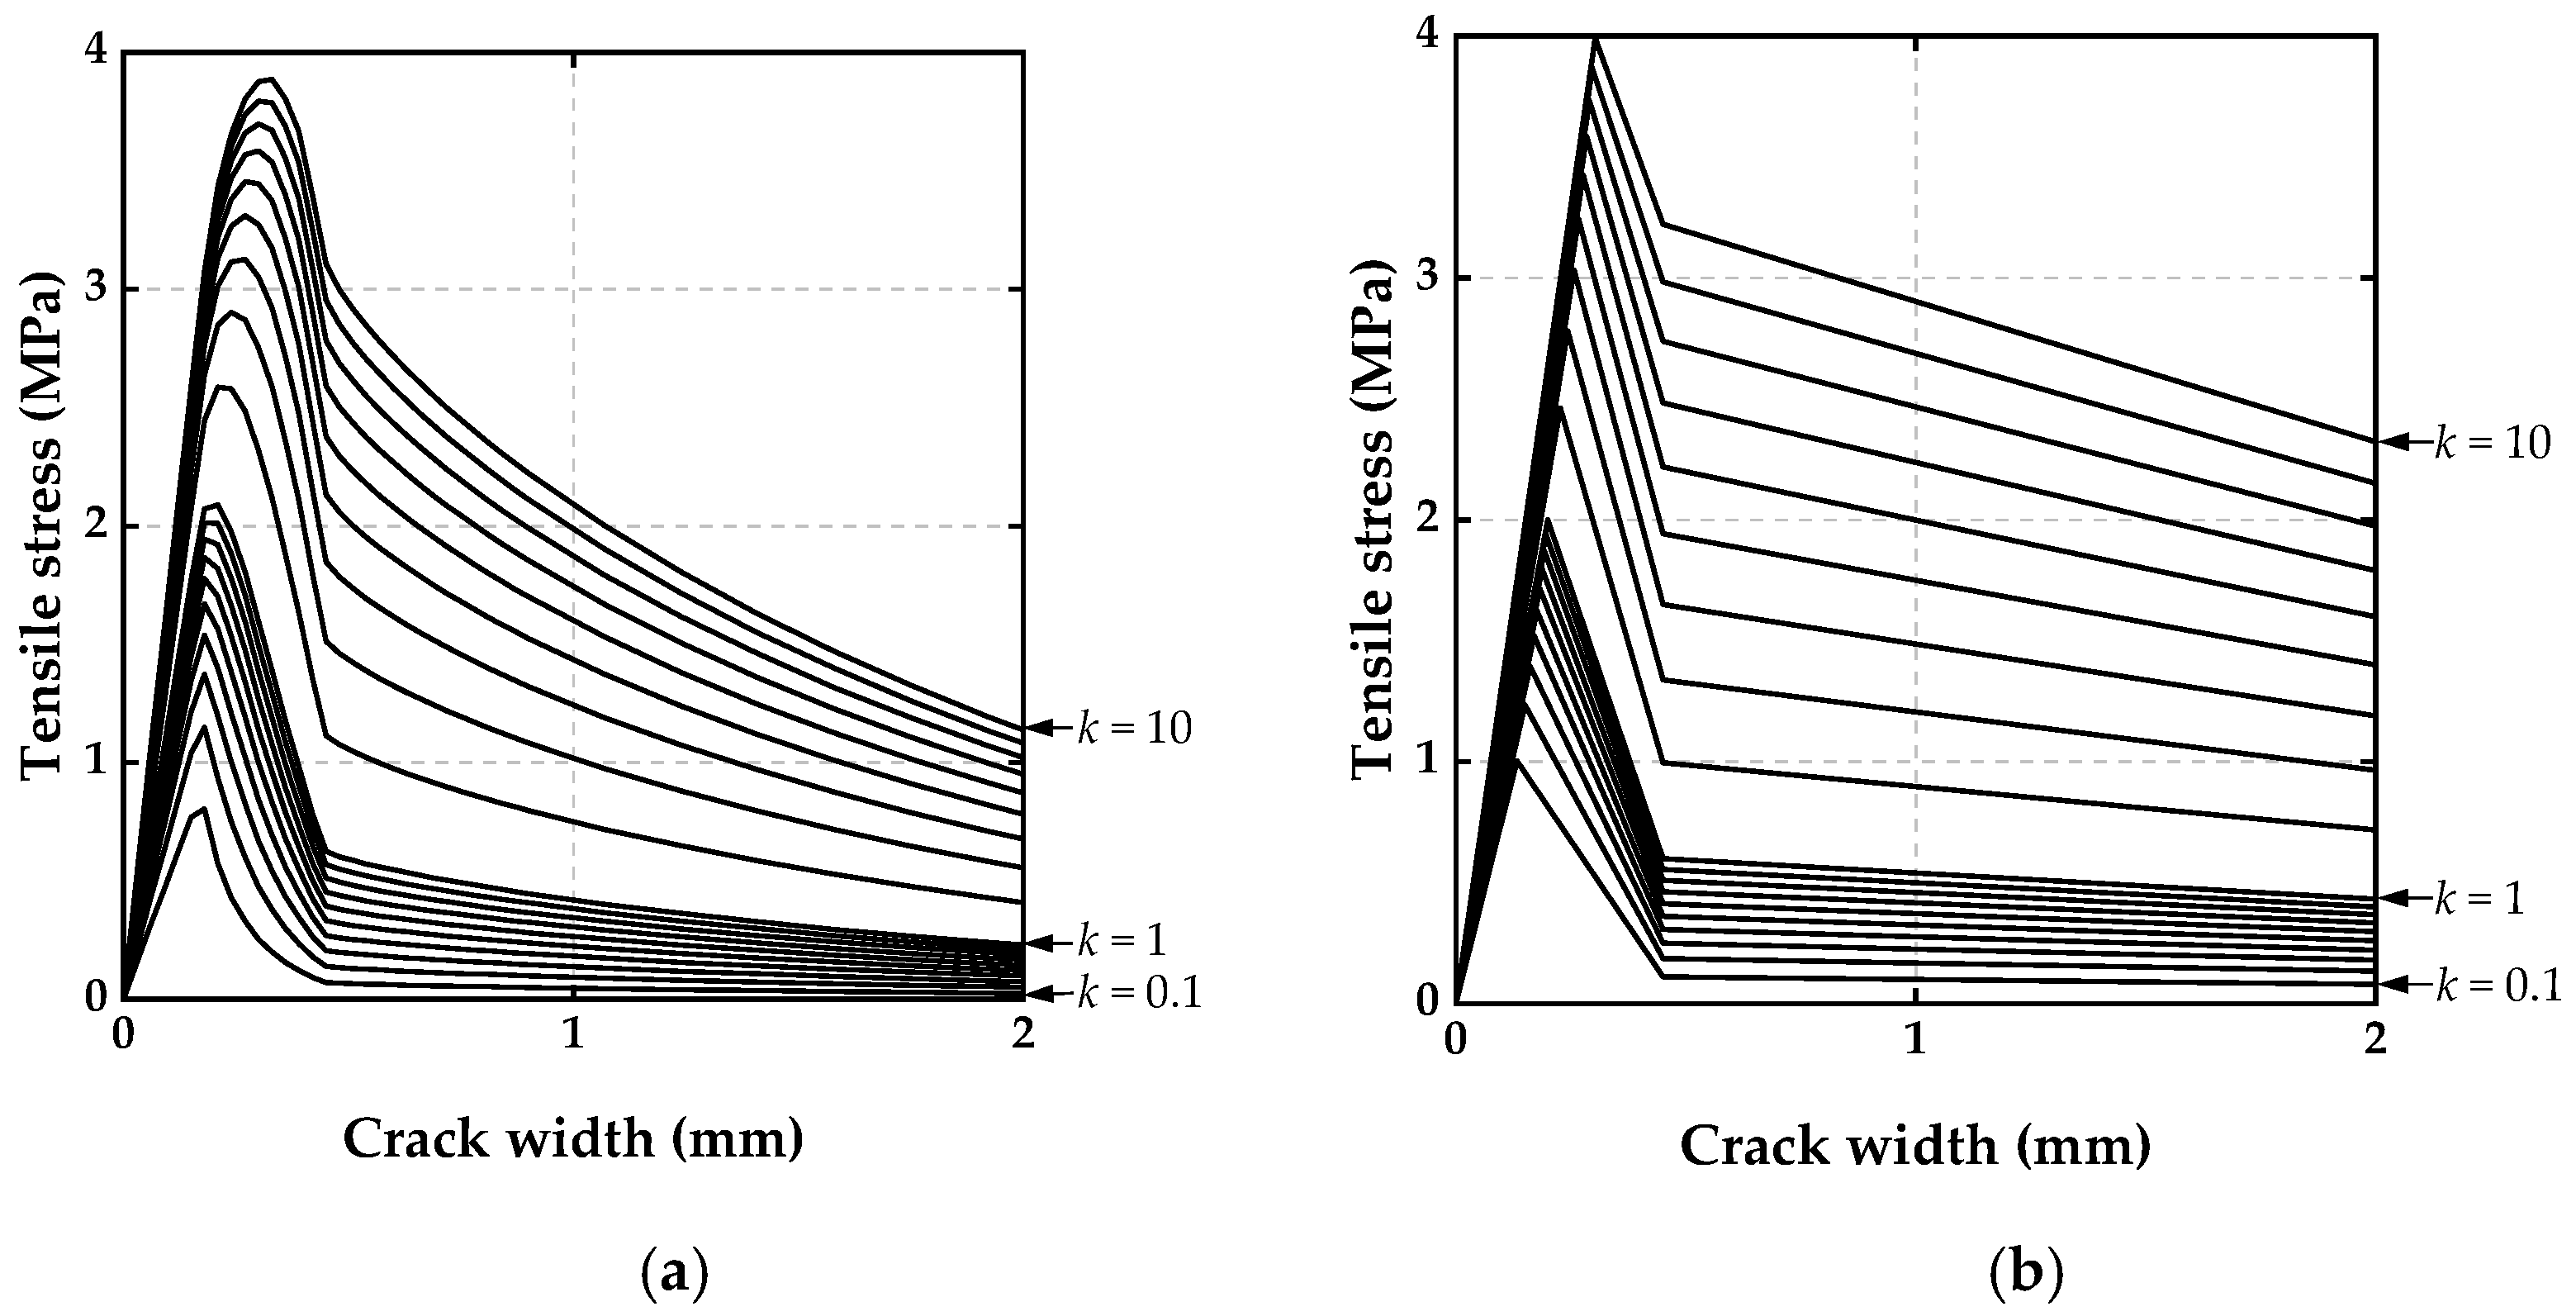
Figure 4.
Comparison of tensile stresses and crack width in proposed model and Ozu model: (a) ; (b) ; (c) .
Figure 4.
Comparison of tensile stresses and crack width in proposed model and Ozu model: (a) ; (b) ; (c) .
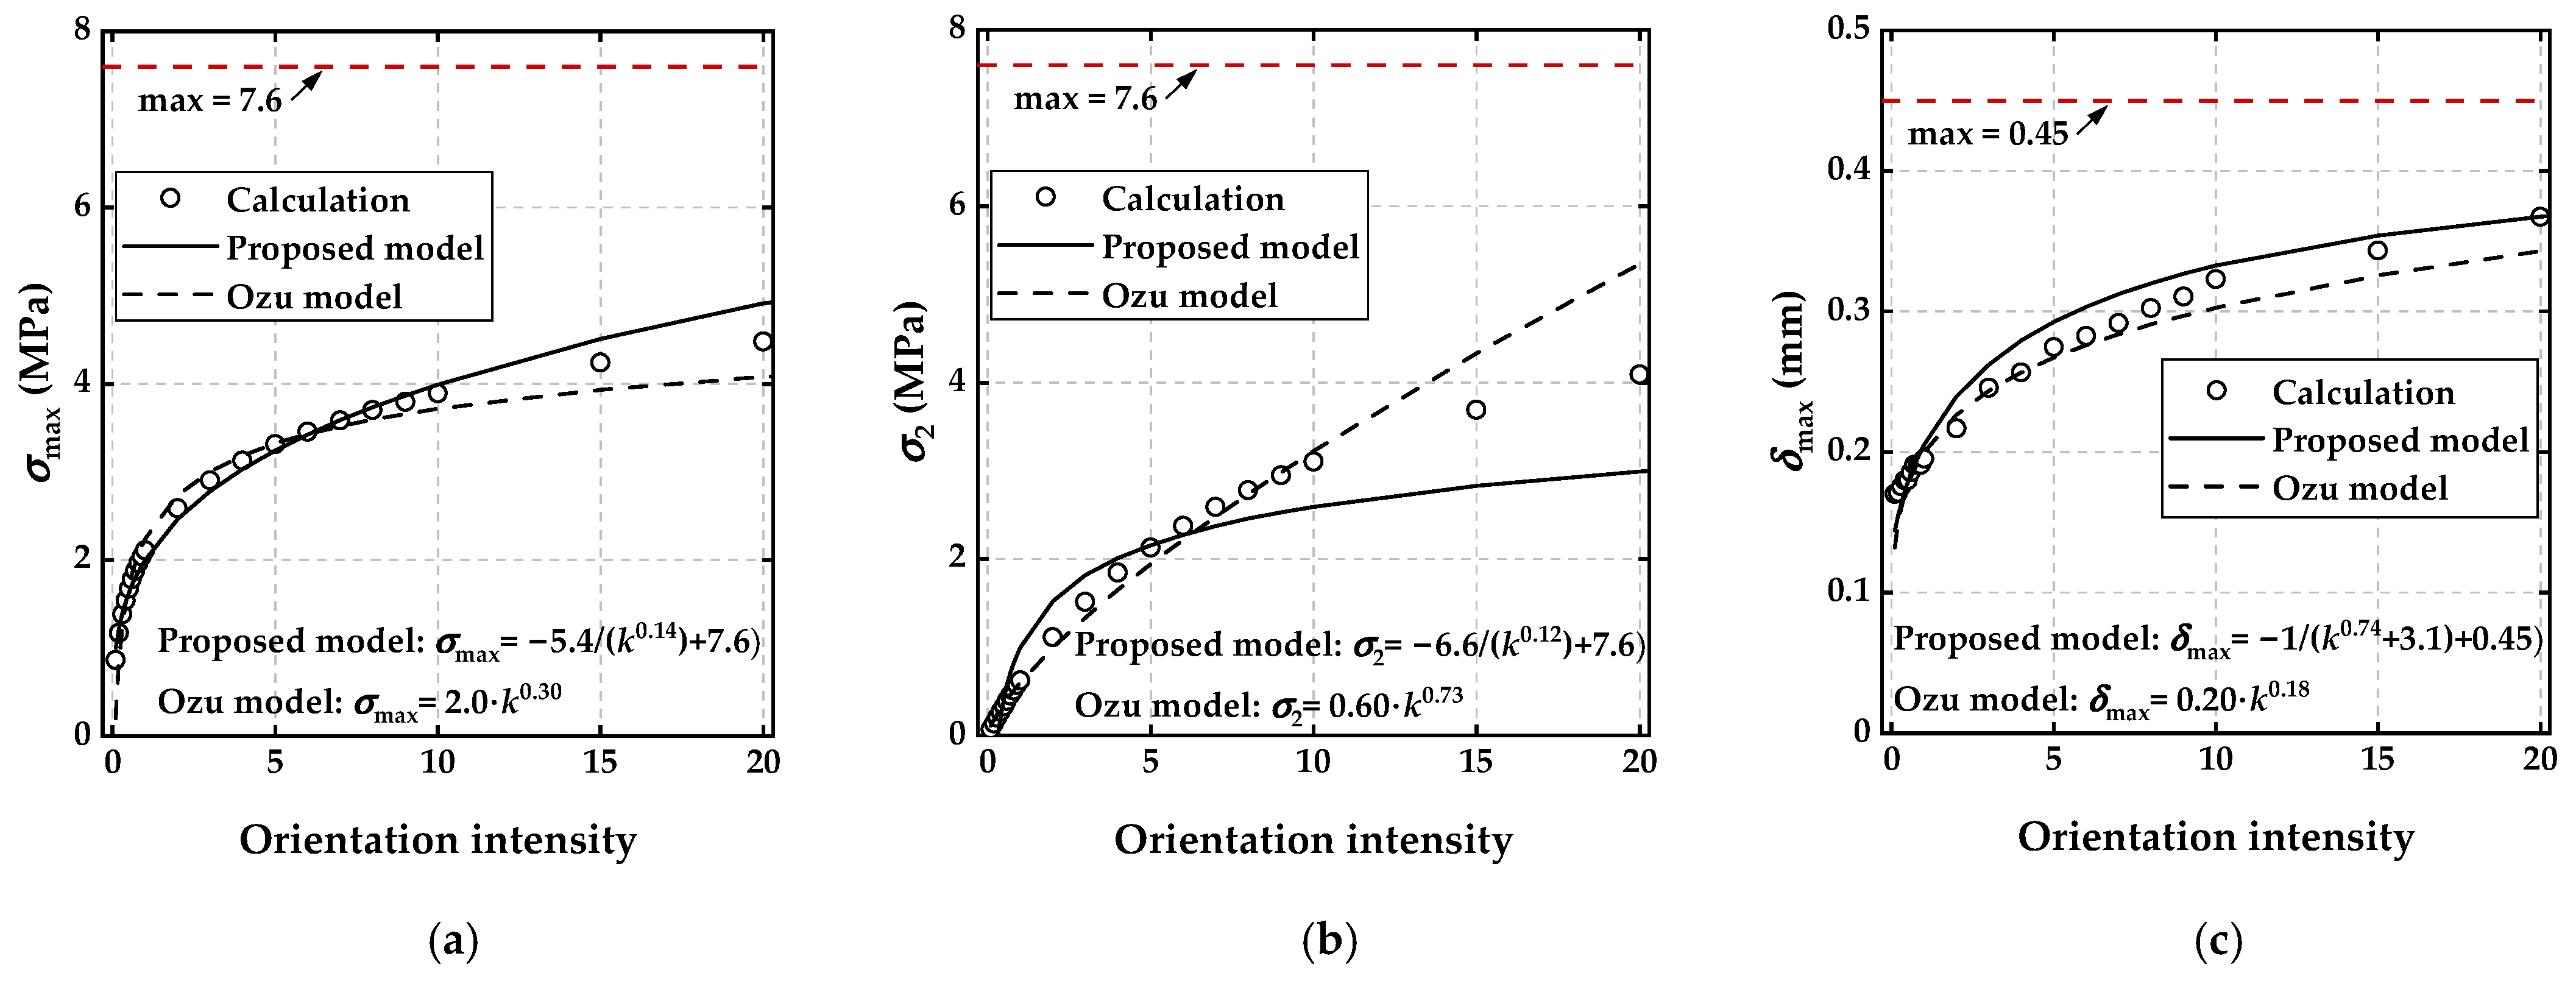
Figure 5.
Comparison of proposed model and the Ozu model: (a) k = 2.8; (b) k = 250.

Figure 6.
Casting of FRCC plates.
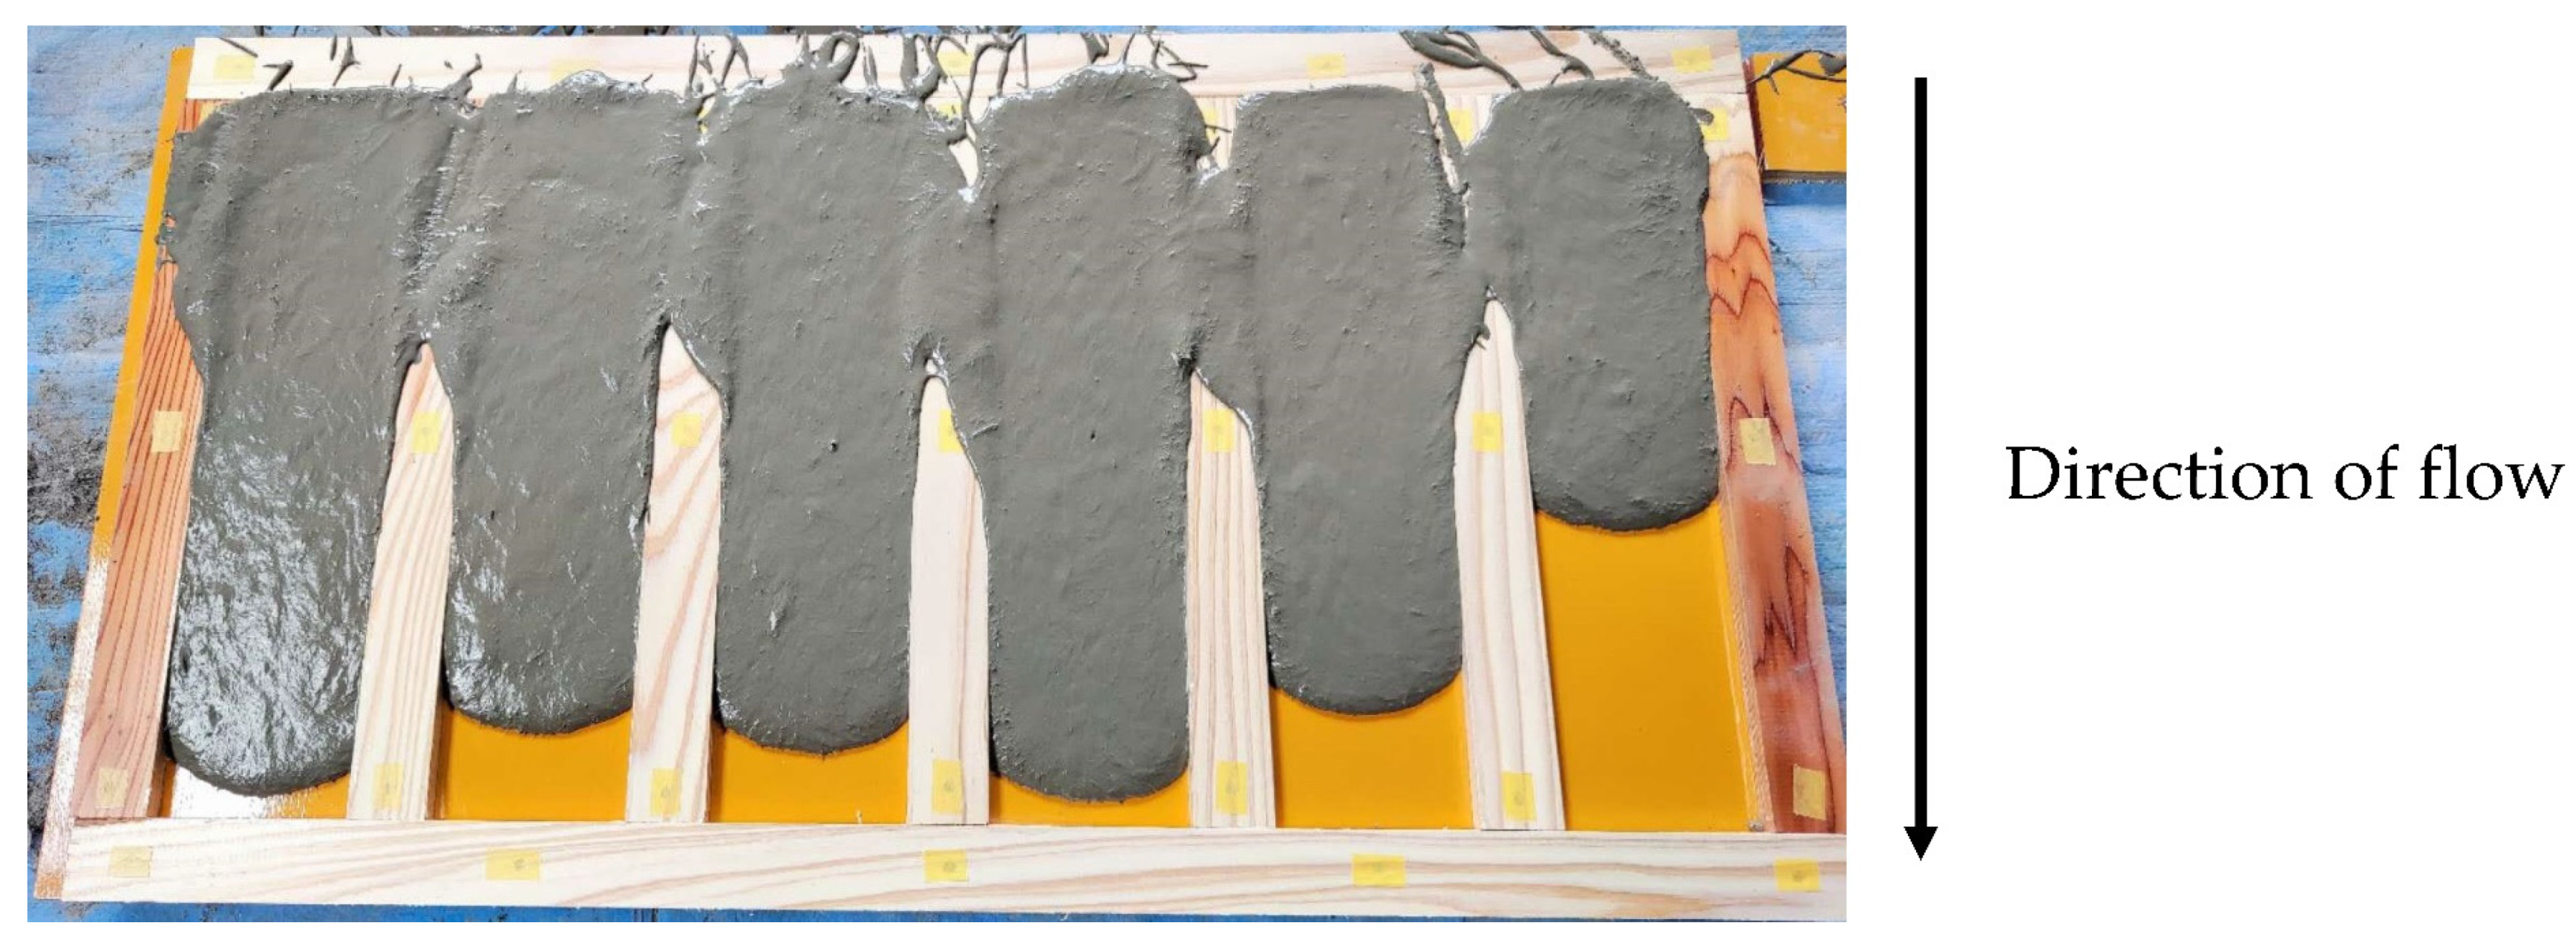
Figure 7.
Clamps and guider applied to retain the holistic shape.

Figure 8.
Height measuring points of the FL-FRCC specimen.

Figure 9.
Four-point loading configuration.
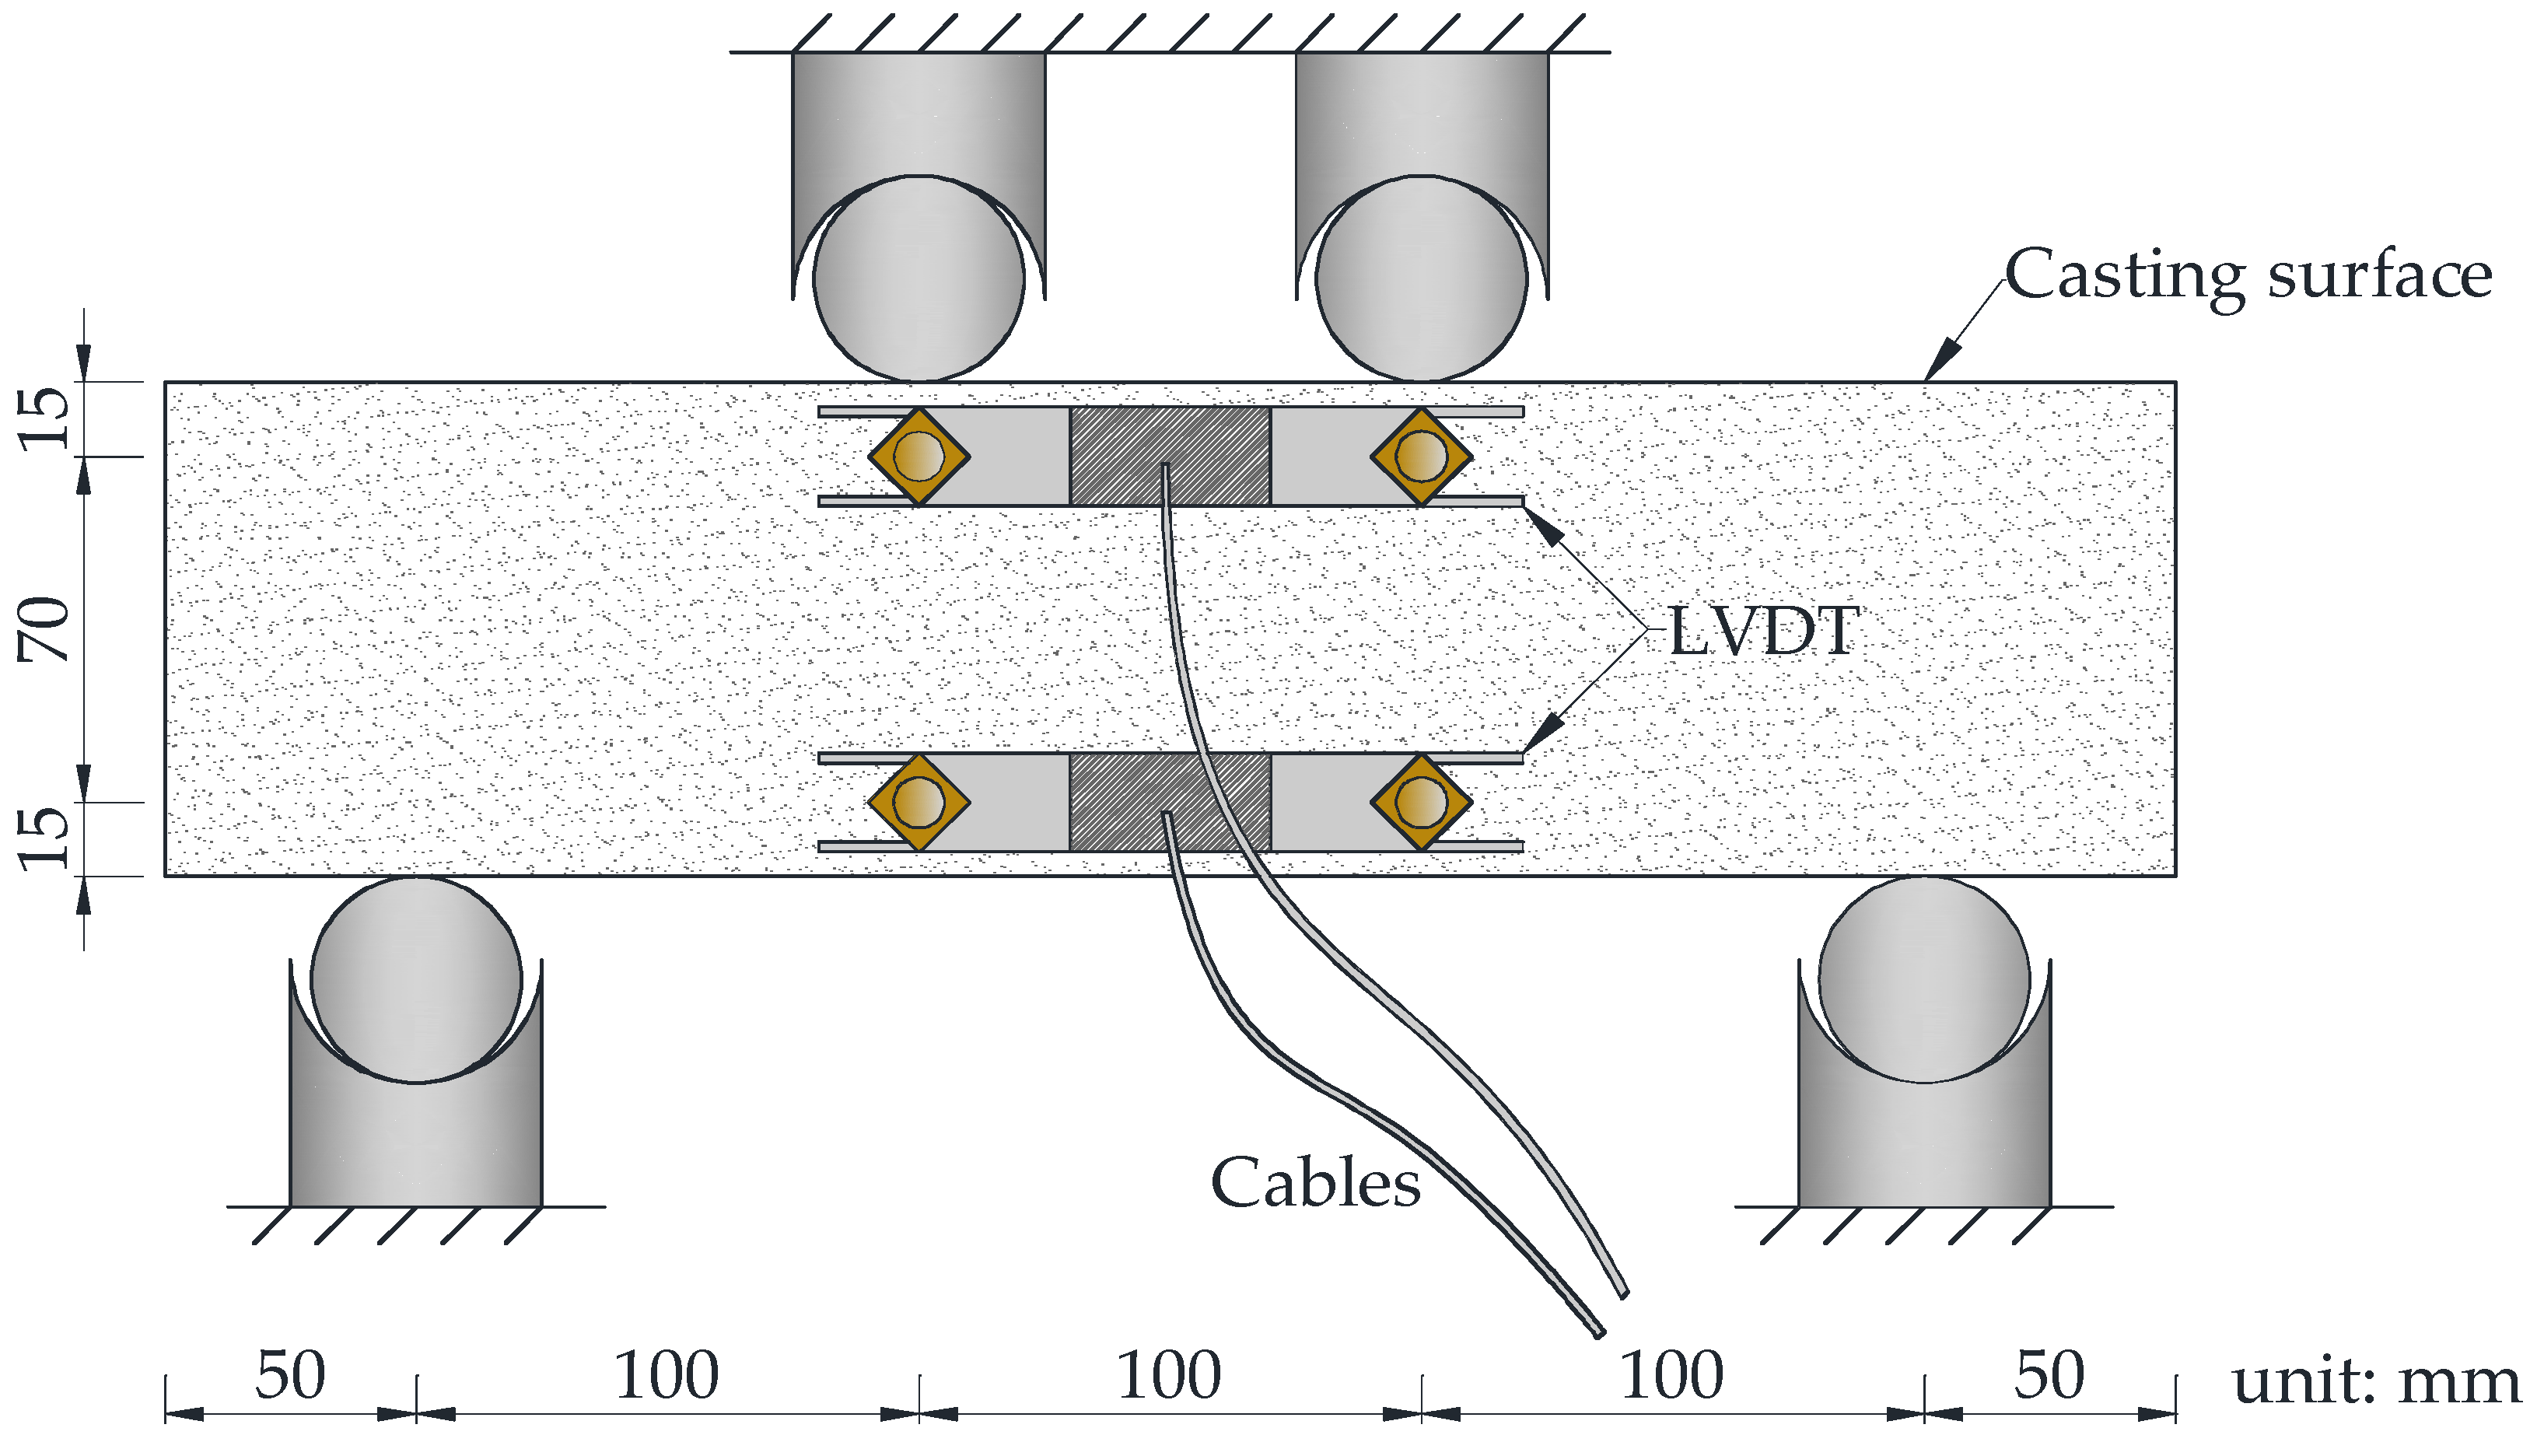
Figure 10.
Typical failure type of the specimens after loading: (a) FL-FRCC specimen; (b) Hmg-FRCC specimen.
Figure 10.
Typical failure type of the specimens after loading: (a) FL-FRCC specimen; (b) Hmg-FRCC specimen.

Figure 11.
Bending moment–curvature curves of the FL-FRCC and Hmg-FRCC specimens: (a) FL-FRCC; (b) Hmg-FRCC.
Figure 11.
Bending moment–curvature curves of the FL-FRCC and Hmg-FRCC specimens: (a) FL-FRCC; (b) Hmg-FRCC.

Figure 12.
Stress–strain models of FL-FRCC and Hmg-FRCC for the section analysis.

Figure 13.
Comparison of Popovics’ model and the compression test results.

Figure 14.
Stress distribution in the section analysis: (a) FL-FRCC; (b) Hmg-FRCC.

Table 1.
Mechanical properties of the PVA fiber applied in this study.
| Type | Diameter (mm) | Length (mm) | Tensile Strength (MPa) | Elastic Modulus (GPa) |
|---|---|---|---|---|
| PVA | 0.10 | 12 | 1200 | 28 |
Table 2.
Mixture proportion of the FRCC.
| Water to Binder Ratio | Sand by Binder Ratio | Unit Weight (kg/m3) | ||||
|---|---|---|---|---|---|---|
| Water | Cement | Fly Ash | Sand | PVA Fiber | ||
| 0.39 | 0.50 | 380 | 678 | 291 | 484 | 26 |
Table 3.
Specimen type overview.
| Specimen Type | Dimensions L × W × H (mm) | Number of Specimens |
|---|---|---|
| FL-FRCC | 400 × 100 × 10 × 9 layers | 3 |
| Hmg-FRCC | 400 × 100 × 100 | 5 |
Table 4.
Properties of epoxy adhesive.
| Specific Gravity (Hardened Product) | Viscosity | Concrete Adhesive Strength * (N/mm2) | |
|---|---|---|---|
| Test value | 1.92 | Putty-liked | 3.2 |
* Tested followed “Testing Methods for Paints (JIS K 5400)” [32].
Table 5.
Height measuring results of the FL-FRCC specimen.
| Specimen No. | Height at Measuring Point (mm) | |||||||
|---|---|---|---|---|---|---|---|---|
| 1 | 2 | 3 | 4 | 5 | 6 | 7 | Average | |
| 8 | 9 | 10 | 11 | 12 | 13 | 14 | ||
| 1 | 103.2 | 100.8 | 99.2 | 97.8 | 105.1 | 101.6 | 101.7 | 100.9 |
| 99.1 | 97.1 | 98.0 | 99.2 | 104.2 | 103.1 | 103.0 | ||
| 2 | 100.4 | 100.7 | 100.8 | 99.7 | 100.2 | 99.7 | 101.7 | 100.0 |
| 99.6 | 98.8 | 99.0 | 99.0 | 100.0 | 100.0 | 100.0 | ||
| 3 | 101.8 | 101.8 | 101.6 | 101.3 | 101.4 | 101.6 | 101.8 | 101.8 |
| 102.6 | 102.4 | 102.3 | 102.6 | 102.0 | 101.8 | 100.5 | ||
Table 6.
List of maximum bending moments.
| Experiment | Section Analysis | ||||||
|---|---|---|---|---|---|---|---|
| Specimen Type | Max. Bending Moment | Curvature at | Absorbed Energy (N·m) | Max Bending Moment | Curvature at | Ratio of Experiment to Analysis | |
| Avg. | STDV | Avg. | Avg. | ||||
| FL-FRCC | 1.62 | 0.176 | 0.022 | 47.3 | 1.66 | 0.136 | 0.98 |
| Hmg-FRCC | 0.87 | 0.036 | 0.119 | 41.6 | 0.94 | 0.048 | 0.93 |
Disclaimer/Publisher’s Note: The statements, opinions and data contained in all publications are solely those of the individual author(s) and contributor(s) and not of MDPI and/or the editor(s). MDPI and/or the editor(s) disclaim responsibility for any injury to people or property resulting from any ideas, methods, instructions or products referred to in the content. |
© 2023 by the authors. Licensee MDPI, Basel, Switzerland. This article is an open access article distributed under the terms and conditions of the Creative Commons Attribution (CC BY) license (https://creativecommons.org/licenses/by/4.0/).
Share and Cite
MDPI and ACS Style
Zhang, H.; Kanakubo, T. Flexural Characteristics of Functionally Layered Fiber-Reinforced Cementitious Composite with Polyvinyl Alcohol Fibers. J. Compos. Sci. 2023, 7, 293. https://doi.org/10.3390/jcs7070293
AMA Style
Zhang H, Kanakubo T. Flexural Characteristics of Functionally Layered Fiber-Reinforced Cementitious Composite with Polyvinyl Alcohol Fibers. Journal of Composites Science. 2023; 7(7):293. https://doi.org/10.3390/jcs7070293
Chicago/Turabian StyleZhang, Hang, and Toshiyuki Kanakubo. 2023. "Flexural Characteristics of Functionally Layered Fiber-Reinforced Cementitious Composite with Polyvinyl Alcohol Fibers" Journal of Composites Science 7, no. 7: 293. https://doi.org/10.3390/jcs7070293