Article

How Do 3D Printing Parameters Affect the Dielectric and Mechanical Performance of Polylactic Acid–Cellulose Acetate Polymer Blends?

1
UniLaSalle, Unité de Recherche Transformations et Agro-Ressources (ULR 7519 UniLaSalle–Université d’Artois), 76130 Mont-Saint-Aignan, France
2
Laboratoire de Biomatériaux, Campus de Rouyn-Noranda, Université du Québec at Abitibi Témiscamingue (UQAT), 445, Boul. de l’Université, Rouyn-Noranda, QC J9X 5E4, Canada
*
Authors to whom correspondence should be addressed.
J. Compos. Sci. 2023, 7(12), 492; https://doi.org/10.3390/jcs7120492
Submission received: 10 October 2023 / Revised: 3 November 2023 / Accepted: 22 November 2023 / Published: 28 November 2023
(This article belongs to the Special Issue Sustainable Biocomposites, Volume II)

Abstract

:
Three-dimensional printing is a prototyping technique that is widely used in various fields, such as the electrical sector, to produce specific dielectric objects. Our study explores the mechanical and dielectric behavior of polylactic acid (PLA) and plasticized cellulose acetate (CA) blends manufactured via Fused Filament Fabrication (FFF). A preliminary optimization of 3D printing parameters showed that a print speed of 30 mm·s−1 and a print temperature of 215 °C provided the best compromise between print quality and processing time. The dielectric properties were very sensitive to the three main parameters (CA content WCA, infill ratio, and layer thickness). A Taguchi L9 3^3 experimental design revealed that the infill ratio and WCA were the main parameters influencing dielectric properties. Increasing the infill ratio and WCA increased the dielectric constant ε′ and electrical conductivity σAC. It would, therefore, be possible to promote the integration of CA in the dielectric domain through 3D printing while counterbalancing its greater polarity by reducing the infill ratio. The dielectric findings are promising for an electrical insulation application. Furthermore, the mechanical findings obtained through dynamic mechanical analysis are discussed.

1. Introduction

Considering the challenges of sustainable development initiatives, designing dielectric materials based on biobased polymers would be a crucial solution to replacing synthetic polymers derived from petroleum [1,2]. It is, therefore, essential to promote biobased materials with properties similar to those of traditional polymers. Among biobased polymers, polylactic acid (PLA) was produced in the greatest quantities in 2023, according to European Bioplastics [3]. It is synthesized from renewable biomass sources such as corn starch and is a candidate to replace petroleum-based polymers such as polystyrene, polyethylene terephthalate, or polypropylene [4]. It shows excellent biocompatibility, compostability properties, and straightforward processability [1,4]. PLA is easy to formulate, making it a desirable polymer for additive manufacturing, with a broad range of applications in the biomedical, electronics, textile, agriculture, and packaging industries [5]. Cellulose is the most abundant polymer on Earth, with attractive potential for use as a raw material in biobased materials with advanced applications ranging from matrix filler for engineering applications to biomedical and electronic applications [6,7]. Cellulose is naturally present in plant biomass in both crystalline and amorphous forms. By processing cellulose through the acetylation of hydroxyl groups with acetyl groups, it is possible to obtain cellulose acetate, a cellulose-derived ester. According to the hydroxyl groups’ degree of substitution (DS), different CA grades can be produced with tunable properties. Increasing the DS of a CA can reduce the biodegradation rate, glass transition and melting, while improving film transparency and mechanical properties [8,9]. CA also exhibits excellent optical, insulating, and flame-retardant properties and good UV stability [10]. CA was among the first plastics developed in the late 19th century and is now widely used, including in commercial applications and pharmacological research [7]. However, to process it as a conventional thermoplastic, the addition of a plasticizer is needed. Various enhancement strategies can be applied to encourage the application of these new materials in the field of dielectrics and advanced electronics. An industrially viable application approach consists of the production of polymer blends. A blend’s properties are dependent on the choice of components. Concerning electrical insulator/conductor blends, Ebrahim et al. studied the impact of adding polyaniline (PAni) to cellulose triacetate (tCA) [11]. They also showed an immiscible morphology, as determined via optical microscopy. They noted that the electrical conductivity of CA can be multiplied by 2 × 10⁷, from 1 × 10⁻¹³ to 2 × 10⁻⁶ S·cm−1, by adding only 15% by weight of PAni (WPAni). The electrical percolation threshold was observed for WPAni = 10%. They pointed out that although the percolation point was reached at higher WPAni values than those reported in the literature, this addition was still low enough to maintain the mechanical properties of CA while increasing its electrical conductivity. This improvement brings the material produced into the semiconductor range. Concerning electrical insulator/insulator blends, Gasmi et al. focused on PLA and PHBV blends [12]. They noted that the dielectric loss ε″ followed the rule of mixture, varying proportionally with the polymer ratio. Furthermore, the blend did not affect glass transition temperatures, as measured with BDS, indicating that PLA and PHBV are immiscible. However, mechanical properties did not follow the rule of mixture, probably because of the specific morphology observed.
Another strategy for improving the possible applications of these new materials is to capitalize on the democratization of the 3D printing process, rethinking material architecture and products. Three-dimensional printing allows complex three-dimensional shapes to be produced using computer-assisted technology [13]. Three main technologies exist for 3D printing: Selective Laser Sintering (SLS), stereolithography (SLA), and Fused Filament Fabrication (FFF). In the FFF method, a heated nozzle deposits material (mainly polymers) in successive layers to obtain a final shape previously defined using 3D technology [13,14]. Three-dimensional printing is currently used in key applications, such as fast industrial prototyping, robotics, electronics, and the biomedical industry [15,16]. Electronics and sensors could fully benefit from this process via the design of electric conductor and insulator prototypes, further favors the integration of biopolymers into new applications [17,18,19]. Recently, Kuzmanić et al. conducted a study on the influence of the infill ratio and infill shape on the dielectric constant of 3D-printed PLA and ABS specimens [20]. They showed that the infill ratio had a clear influence on the dielectric properties of these materials. For both polymers, the infill ratio positively affected the dielectric constant, as the more porous specimens contained more voids and, therefore, had weaker polarization potentials. They also found that the form factor played a significant role in the dielectric constant, indicating that it is possible to adjust the dielectric constant of 3D-printed materials according to the chosen 3D architecture. Masarra et al. showed that the printing angle influenced the electrical resistivity of a 3D-printed PLA-based polymer composite [2]. They demonstrated that the electrical resistivity was greater for a ± 45° printing angle than a 0–90° printing angle due to the PLA printing orientation favoring conductivity. Goulas et al. have also shown the influence of architecture on dielectric properties, as the dielectric constant of ABS:ceramic composites increased with layer height due to the reduction in internal porosity [21].
Even if CA is a promising biobased polymer for electronic applications, there is a need to investigate its dielectric and mechanical behavior when blended with other biopolymers. Thus, this article compares the dielectric and mechanical properties of PLA:CA blends made via 3D printing. After optimizing the 3D printing process, the influence of CA content, infill ratio, and layer height on mechanical and dielectric properties was studied and analyzed using a Taguchi L9 (3^3) experimental design. The originality of this work lies in the dielectric analysis of the PLA:CA blends for a specific application and the concurrent analysis of the dielectric and mechanical properties of these innovative blends using a Taguchi design.

2. Materials and Methods

2.1. Materials and 3D Blend Formulation

Two biobased polymers were used to prepare the different biobased polymeric blends: PLA-20003D (PLA) was purchased from EURL BBFil (Heiligenberg-Vallée, France) and ACI-002 plasticized cellulose acetate (CA) was purchased from Natureplast (Caen, France). All biobased polymers were received in pellets with a diameter (ϕ) = 4 mm in 25 kg bags. According to the supplier, the CA had a plasticizer content of 29%. The supplier stated the Melt Flow Index (MFI at 190 °C with 2.16 kg) of PLA was 7 g·10 min−1. For the blend formulation, the first step was performed with a single-screw extruder and a SCAMEX 25-20D (SCAMEX, Isques, France). Four different PLA:CA blends were obtained with CA contents (WCA) varying up to 40%. The screw speed was set at 30 rpm, and the extrusion profile temperature was set at 160, 170, and 180 °C. The extruded filaments were water-cooled and immediately pelletized and oven-dried at 60 °C. The second processing step was the filament obtention at the ITHEMM laboratory (Charleville-Mézières, France). A 3DEVO filament maker (3DEVO, Utrecht, The Netherlands) produced the final filaments following a temperature profile of 170–180–180–170 °C and a screw speed of 5 rpm. These filaments, with a diameter of 2.85 ± 0.1 mm, were then used for the 3D printing of the samples. The last processing step was the Fused Filament Fabrication (FFF). Two different shapes were proposed (Figure 1). These parts were designed using FUSION 360 computer-aided design technology and then exported to CURA SLICER 3D printing technology and printed using a SIGMAX R19 3D printing device (BCN3D, Gavà, Spain). All filaments were conditioned in an oven at 60 °C to remove all internal moisture before printing. The printing bed was set at 60 °C, and the nozzle diameter was set at 0.8 mm. The initial parameters were inspired by the works of Kuzmanic et al. and Masarra et al. [2,20].

2.2. Methods

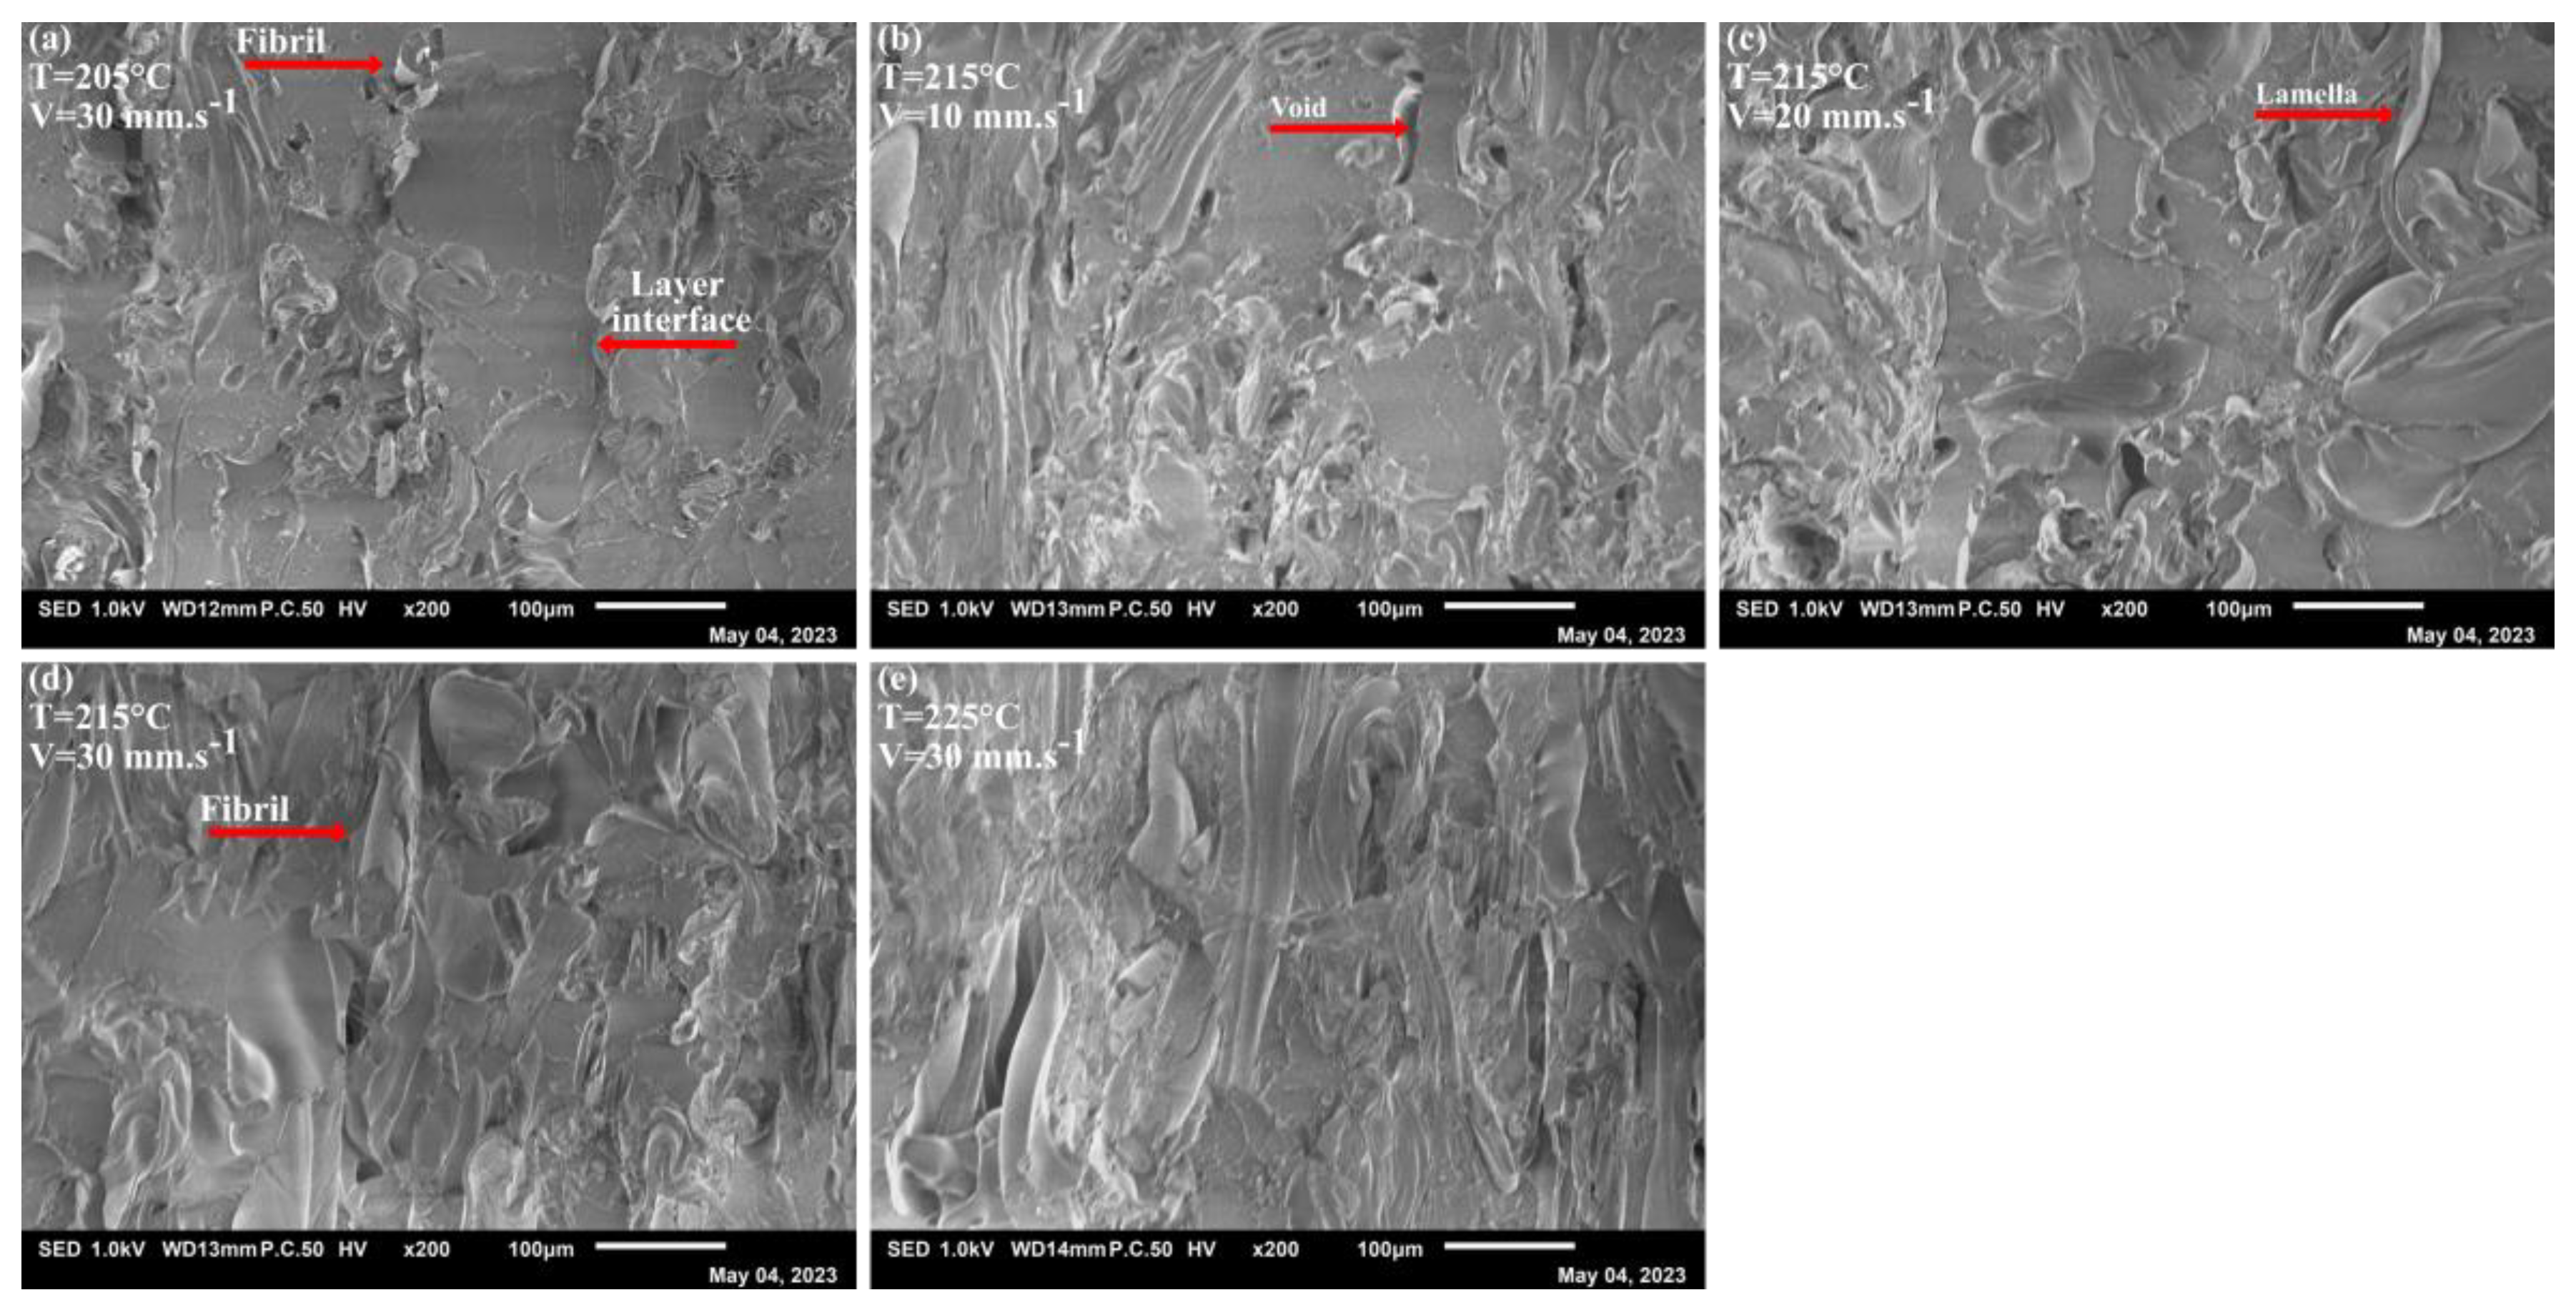
2.2.1. Scanning Electron Microscopy (SEM) Analysis

SEM analysis was performed with a JSM IT200 (Jeol, Akishima, Japan). Tests were carried out on specimens obtained via hot pressing. A cryofracture with liquid nitrogen was conducted to obtain a clean cross-section, and the selected specimens were carbon-coated. Tests were conducted at 1 kV with a magnification ranging from 40 to 200.

2.2.2. Dynamic Mechanical Analysis (DMA)

In double cantilever mode, 60 × 10 × 4 mm samples were tested on a DMA 242 E Artemis (Netschz, Selb, Germany). The dual cantilever mode was chosen instead of the 3-point bending mode because of the very low stiffness of PLA once its glass transition temperature is reached (T > 60 °C). The tests were conducted in a ramp mode between 30 and 140 °C with a heating rate of 5 °C·min−1 and a monitored force of 1 N on bar-shaped specimens. Measurements were taken for 3 different samples.

2.2.3. Broad Dielectric Spectroscopy (BDS) Analysis

BDS tests were conducted with a Keysight E4980A Precision LCR Meter (Agilent Technologies, Santa Rosa, CA, USA). An isothermal test at 20 °C with a frequency ranging from 1 × 10² and 2 × 10⁶ Hz with 20 measurements per decade was performed to obtain the dielectric properties at room temperature on disk-shaped samples. The laboratory BDS gave the capacitance (Cp) and the loss tangent (tan δ). So, the dielectric constant (ε′) and the dielectric loss (ε″) can be obtained from Equations (1) and (2) [22]:
ε = C p l ε 0 S
ε = ε tan δ
where Cp is expressed in F·m−1, l is the sample thickness in m, S is the sample section in m2, and ε0 is the vacuum permittivity and given at 8.854188 × 10⁻¹² F·m−1. Electrical conductivity σAC can be directly linked to the dielectric loss with Equation (3) [22]:
σ A C = ω ε ε 0 = 2 π f ε ε 0
where σAC is expressed as S·m−1, ω is the angular frequency, and f is the applied electrical frequency in Hz. Measurements were taken for 3 different samples.

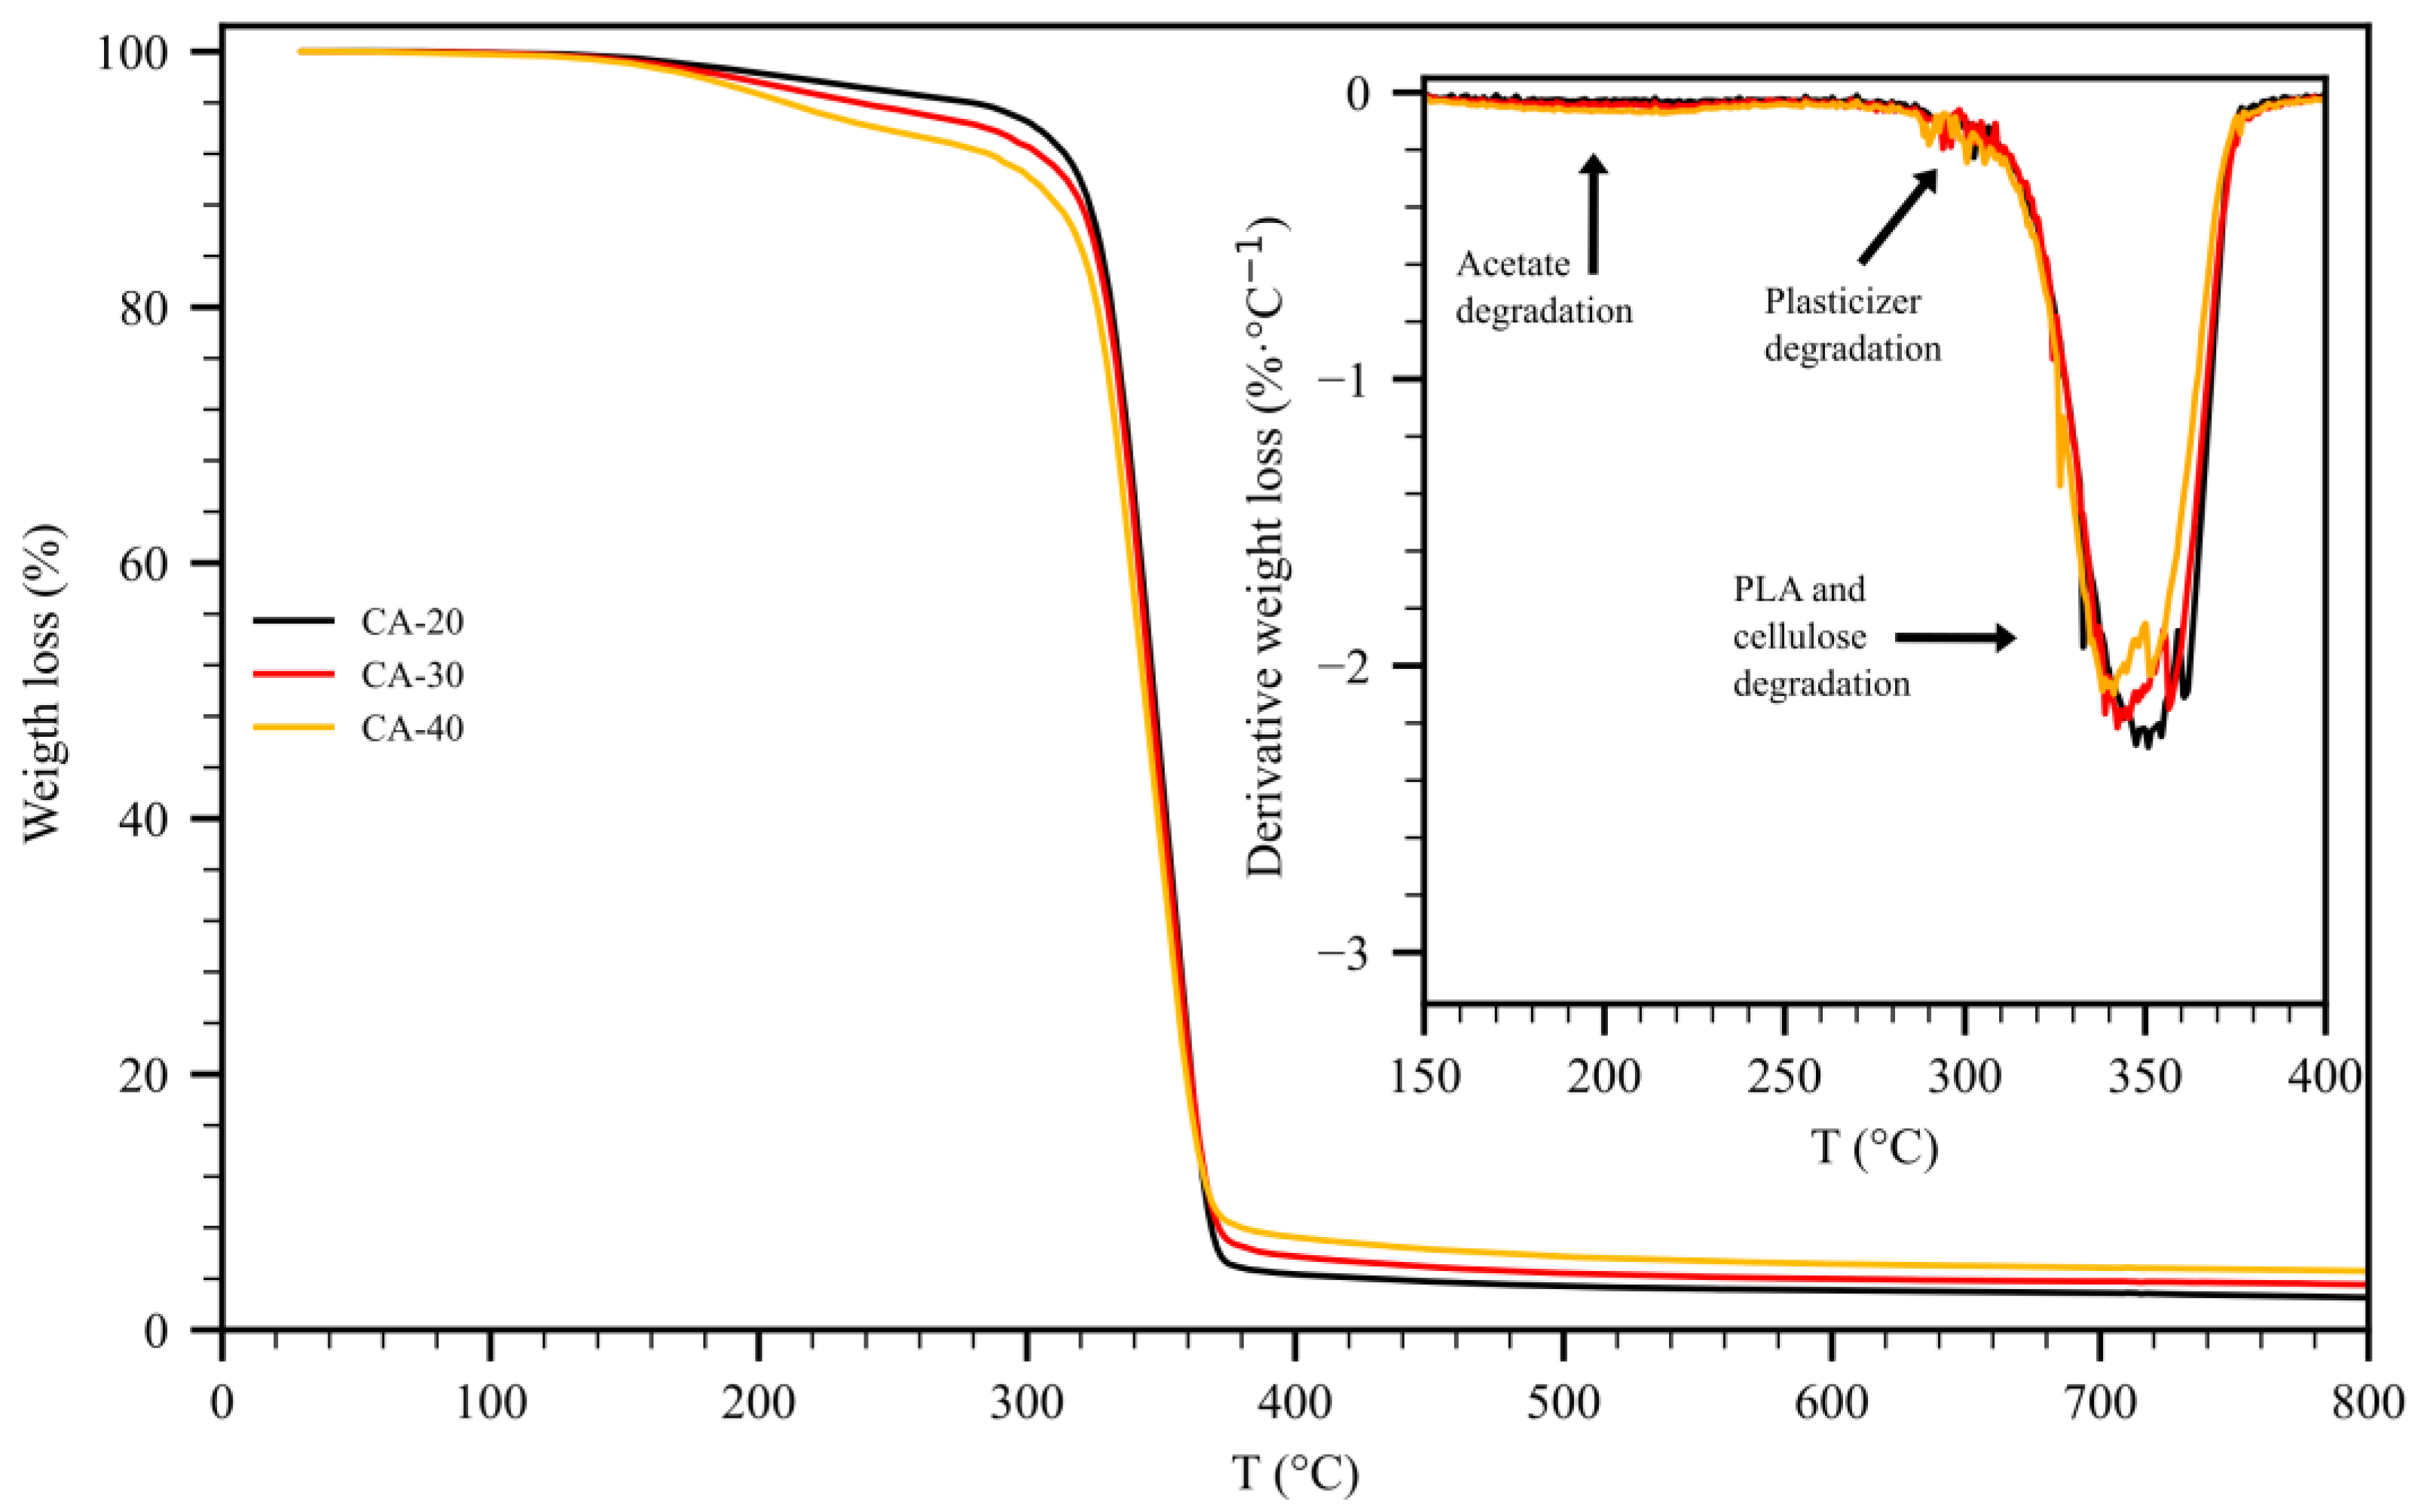
2.2.4. Thermogravimetric Analysis (TGA)

TGAs were conducted with a Tg 209 F1 (Netzsch, Selb, Germany). The analyses were conducted with a temperature ramp ranging from 20 to 800 °C and a 10 K·min−1 speed in an inert gas (argon). For each sample, 20 mg of material was taken and characterized.

2.3. Printing Process Optimization

Printing process optimization was carried out to ensure good printing conditions. Three parameters were selected: printing temperature, speed, and nozzle diameter. The variable values are summarized in Table 1. For this step, only the CA-40 blend was selected. Microstructure and mechanical analysis were conducted to assess sample quality via SEM and DMA, respectively.

2.4. Architectural Design

An architectural characterization step was performed once the printing parameters had been fixed. A Taguchi L9 (3^3) experimental design was applied to study the influence of the infill ratio, the WCA, and the layer thickness on dielectric and mechanical properties. These 3 parameters have 3 value levels. This plan required 9 different conditions, which are summarized in Table 2. All Taguchi analyses were performed with the Minitab 17 Statistical Software. All the additional statistical information is given in the Supplementary Data file.

3. Results and Discussion

3.1. Optimization of Printing Parameters

Figure 2 shows the storage modulus of PLA:CA blends with a WCA = 40% at different processing temperatures and printing speeds. All blends showed typical plasticized PLA behavior [23]. The first phase of the curves before 40 °C corresponds to the glassy state of the PLA component. The sharp drop in the storage modulus E′ between 40 and 60 °C corresponds to the glass transition of plasticized PLA. The area between 60 and 80 °C corresponds to the rubbery transition of the PLA component. Cold crystallization could be observed and led to the creation of a crystalline network, improving the blends’ mechanical properties [23]. In Figure 2, no significant change can be seen in the storage modulus with the tested parameters. Furthermore, the SEM analyses presented in Figure 3 showed the morphology of the blends. As expected and in agreement with the literature, the blend morphology was immiscible, with observable lamellae and fibrils [24,25]. Moreover, it was empirically difficult to print samples at 205 °C for a WCA = 40%, as it seems the temperature was too low to achieve good printing quality and replicability. Figure 3a shows that the interfaces between the different layers were visible. At 215 and 225 °C, the samples were much simpler to obtain, with an overall better quality, as shown in Figure 3b–e). The interfaces between layers were difficult to distinguish. The thermal stability analyses of PLA:CA blends are presented in Figure 4. The blends showed three distinct degradation peaks. Slow degradation was first visible around 200 °C. This degradation could be attributed to the esterification degradation of CA [26]. Around 300 °C, unstable degradation was also noticeable, which might have corresponded to the plasticizer degradation of CA. It is interesting to note that the degradation of both thermoplastics took place at the same time. So, to limit the degradation of CA during the process, a temperature of 215 °C was chosen for the rest of the study. Regarding the printing speed, 30 mm·s−1 was chosen for the rest of the study to speed up the printing process. For reference, printing a DMA sample takes 14 and 31 min at print speeds of 30 mm·s−1 and 10 mm·s−1, respectively.

3.2. Dielectric Analysis

Table 3 shows the dielectric constants obtained via BDS at room temperature from the 3D-printed PLA:CA biocomposite using different parameters (WCA, infill ratio, and layer thickness). The measured dielectric permittivity ranged from 1.90 to 2.46, increasing gradually with WCA and the infill ratio. The lowest dielectric constants were obtained for condition 1, corresponding to a WCA = 20%, infill ratio = 40%, and layer thickness = 0.1 mm. The highest dielectric constants were obtained for condition 9, corresponding to a WCA = 40%, infill ratio = 80%, and layer thickness = 0.2 mm. Typical dielectric constants for these conditions are summarized in Figure 5. However, the dielectric constant of PLA:CA biocomposites decreased with increasing frequency, which was associated with the limitation of dipole mobility as the frequency increased.
Figure 6 shows the results of the Taguchi analysis at 1 kHz, which we used to identify the parameters separately. All the tested parameters positively influenced the dielectric constant. The p-value indicates 0.003, 0.032, and 0.064 for the infill ratio, WCA, and layer thickness, respectively. The infill ratio significantly affected the dielectric constant. This observation has already been made by Kuzmanić et al. and was attributed to the samples’ porosity [20]. Reducing the infill ratio resulted in less dense specimens and, therefore, less susceptible to being polarized, as the dielectric constant of air ≃ 1. The impact of WCA on the dielectric constant was also significant, as cellulose acetate had polar hydroxyl functions compared with PLA. On the other hand, the layer thickness had only a slight positive impact (p-value > 0.05) on the dielectric constant. Goulas et al. also observed a slight influence associated with the diminution in porosities with increasing layer thickness [21]. So, to reduce the dielectric constant, a reduction in the filling ratio needs to be made, followed by a reduction in the WCA, and finally, a reduction in the layer thickness. Interestingly, the dielectric constants of conditions 7, 8, and 9 were between 2.11 and 2.46, values comparable with those of LDPE, HDPE and PP, synthetic polymers commonly used in electrical insulation (presented later in the document in Table 6). This proves that conditions 7 to 9 would be attractive alternatives to the above-mentioned conventional polymers.

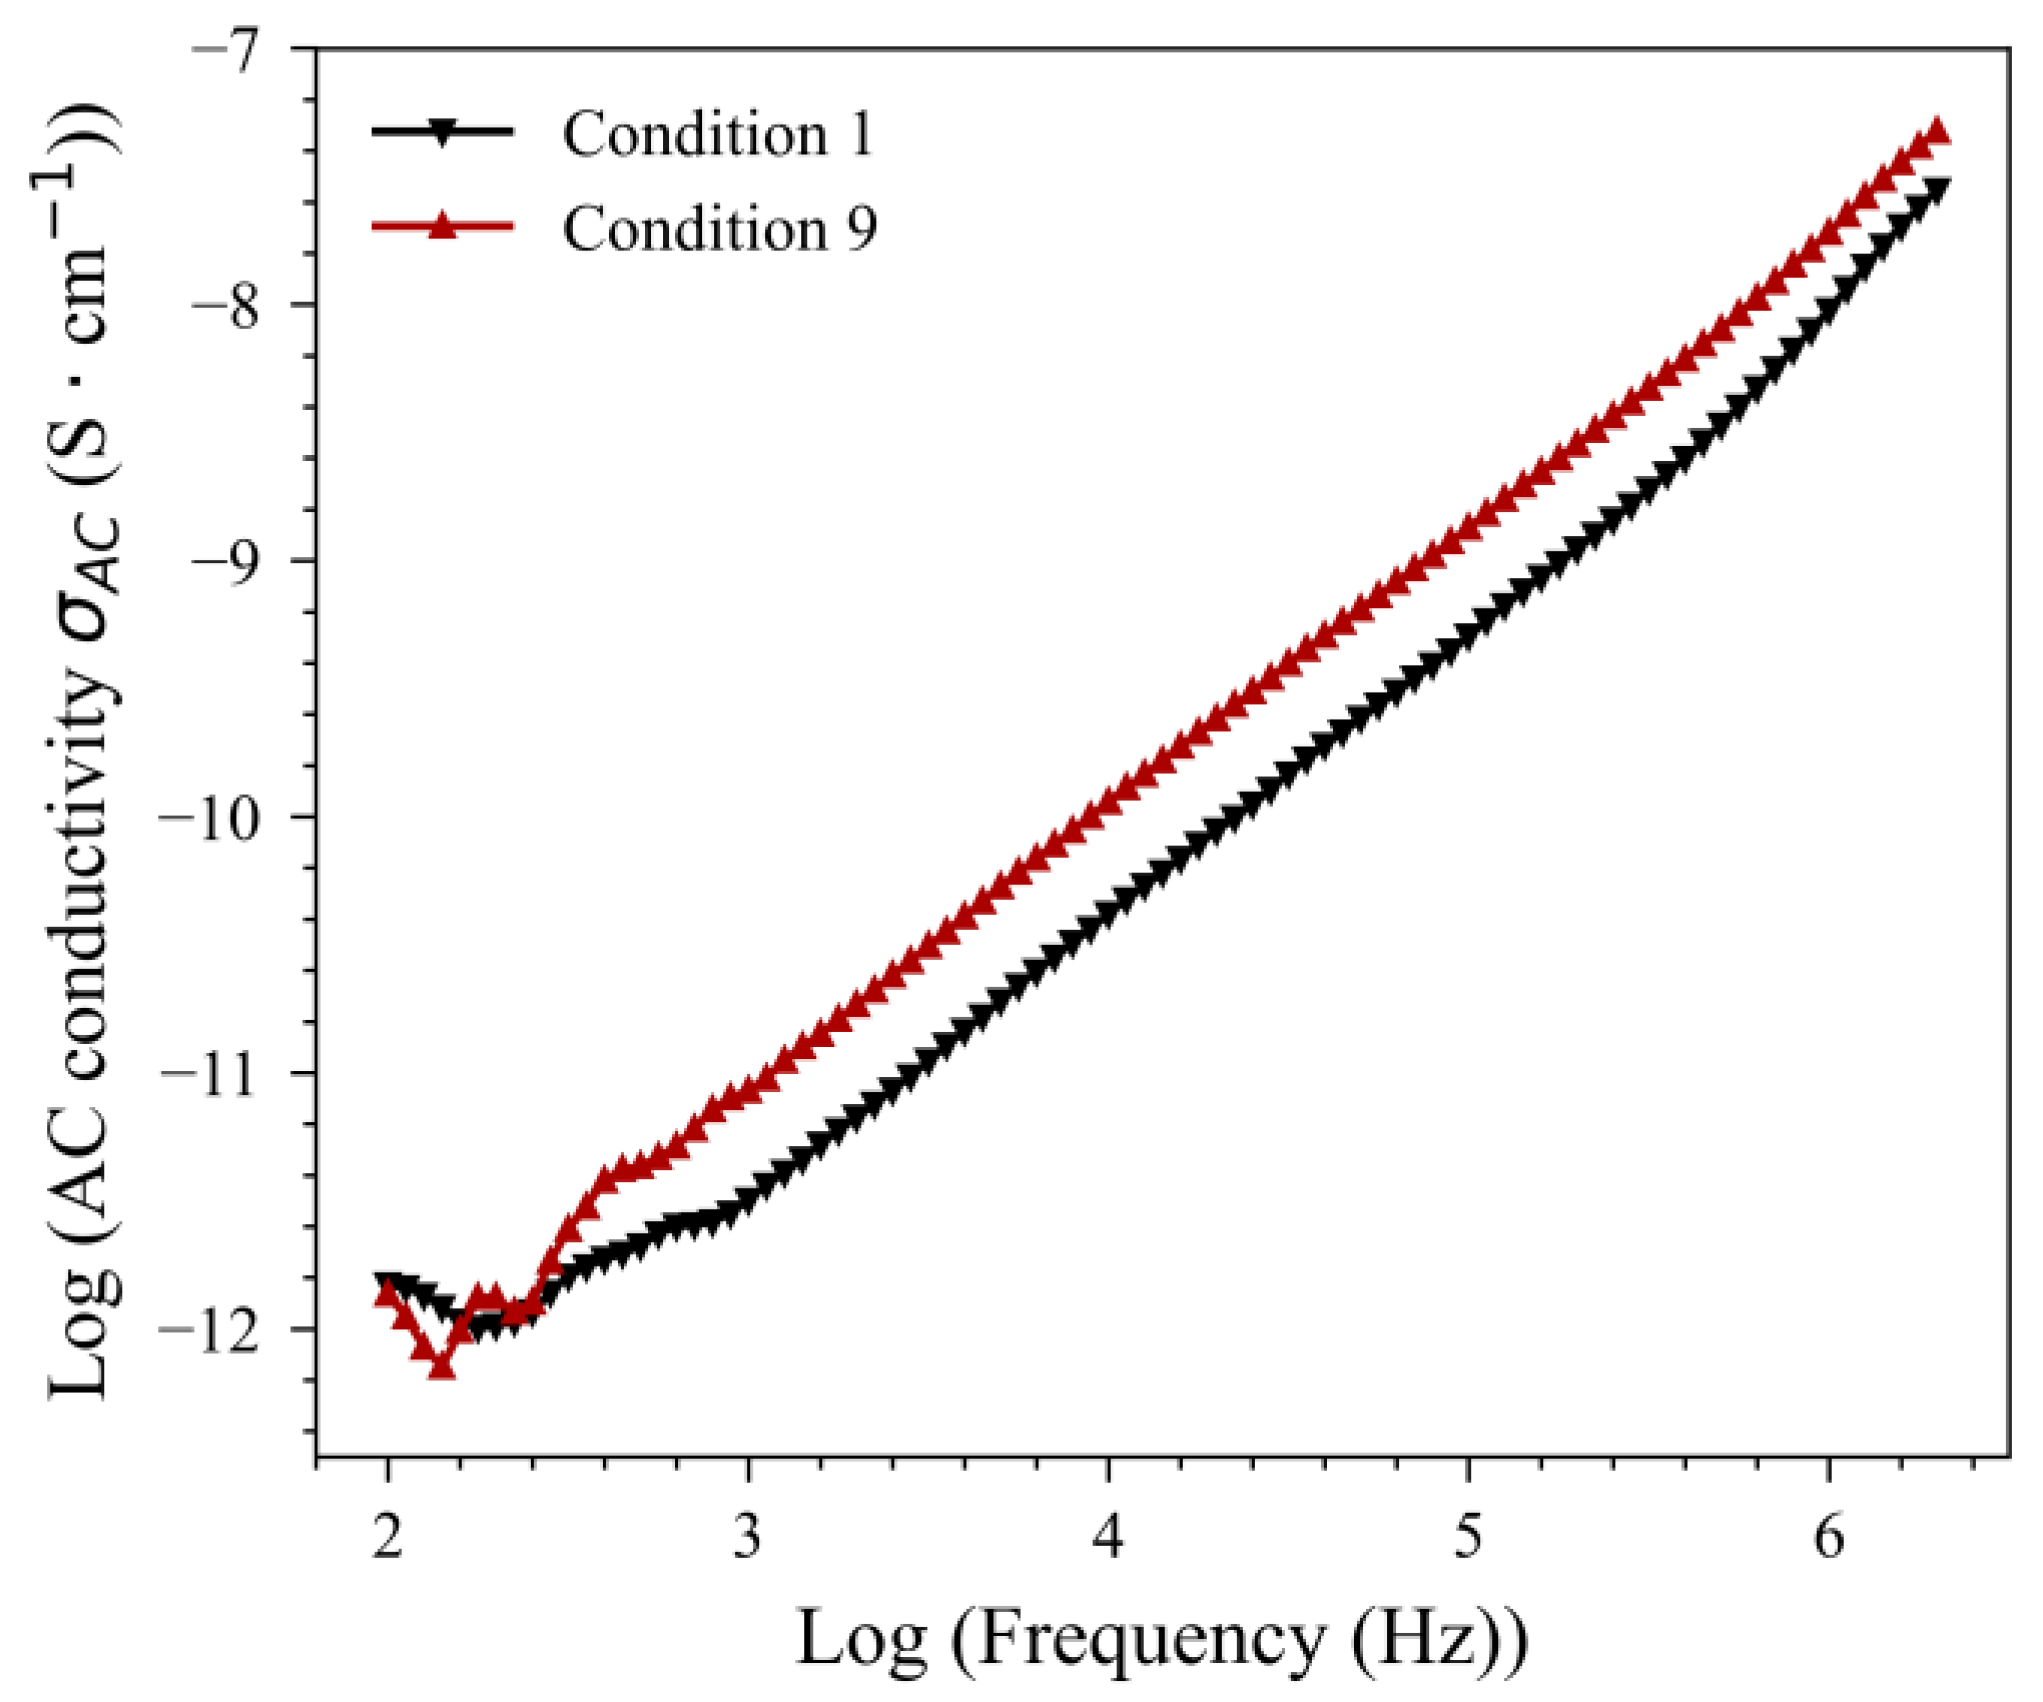
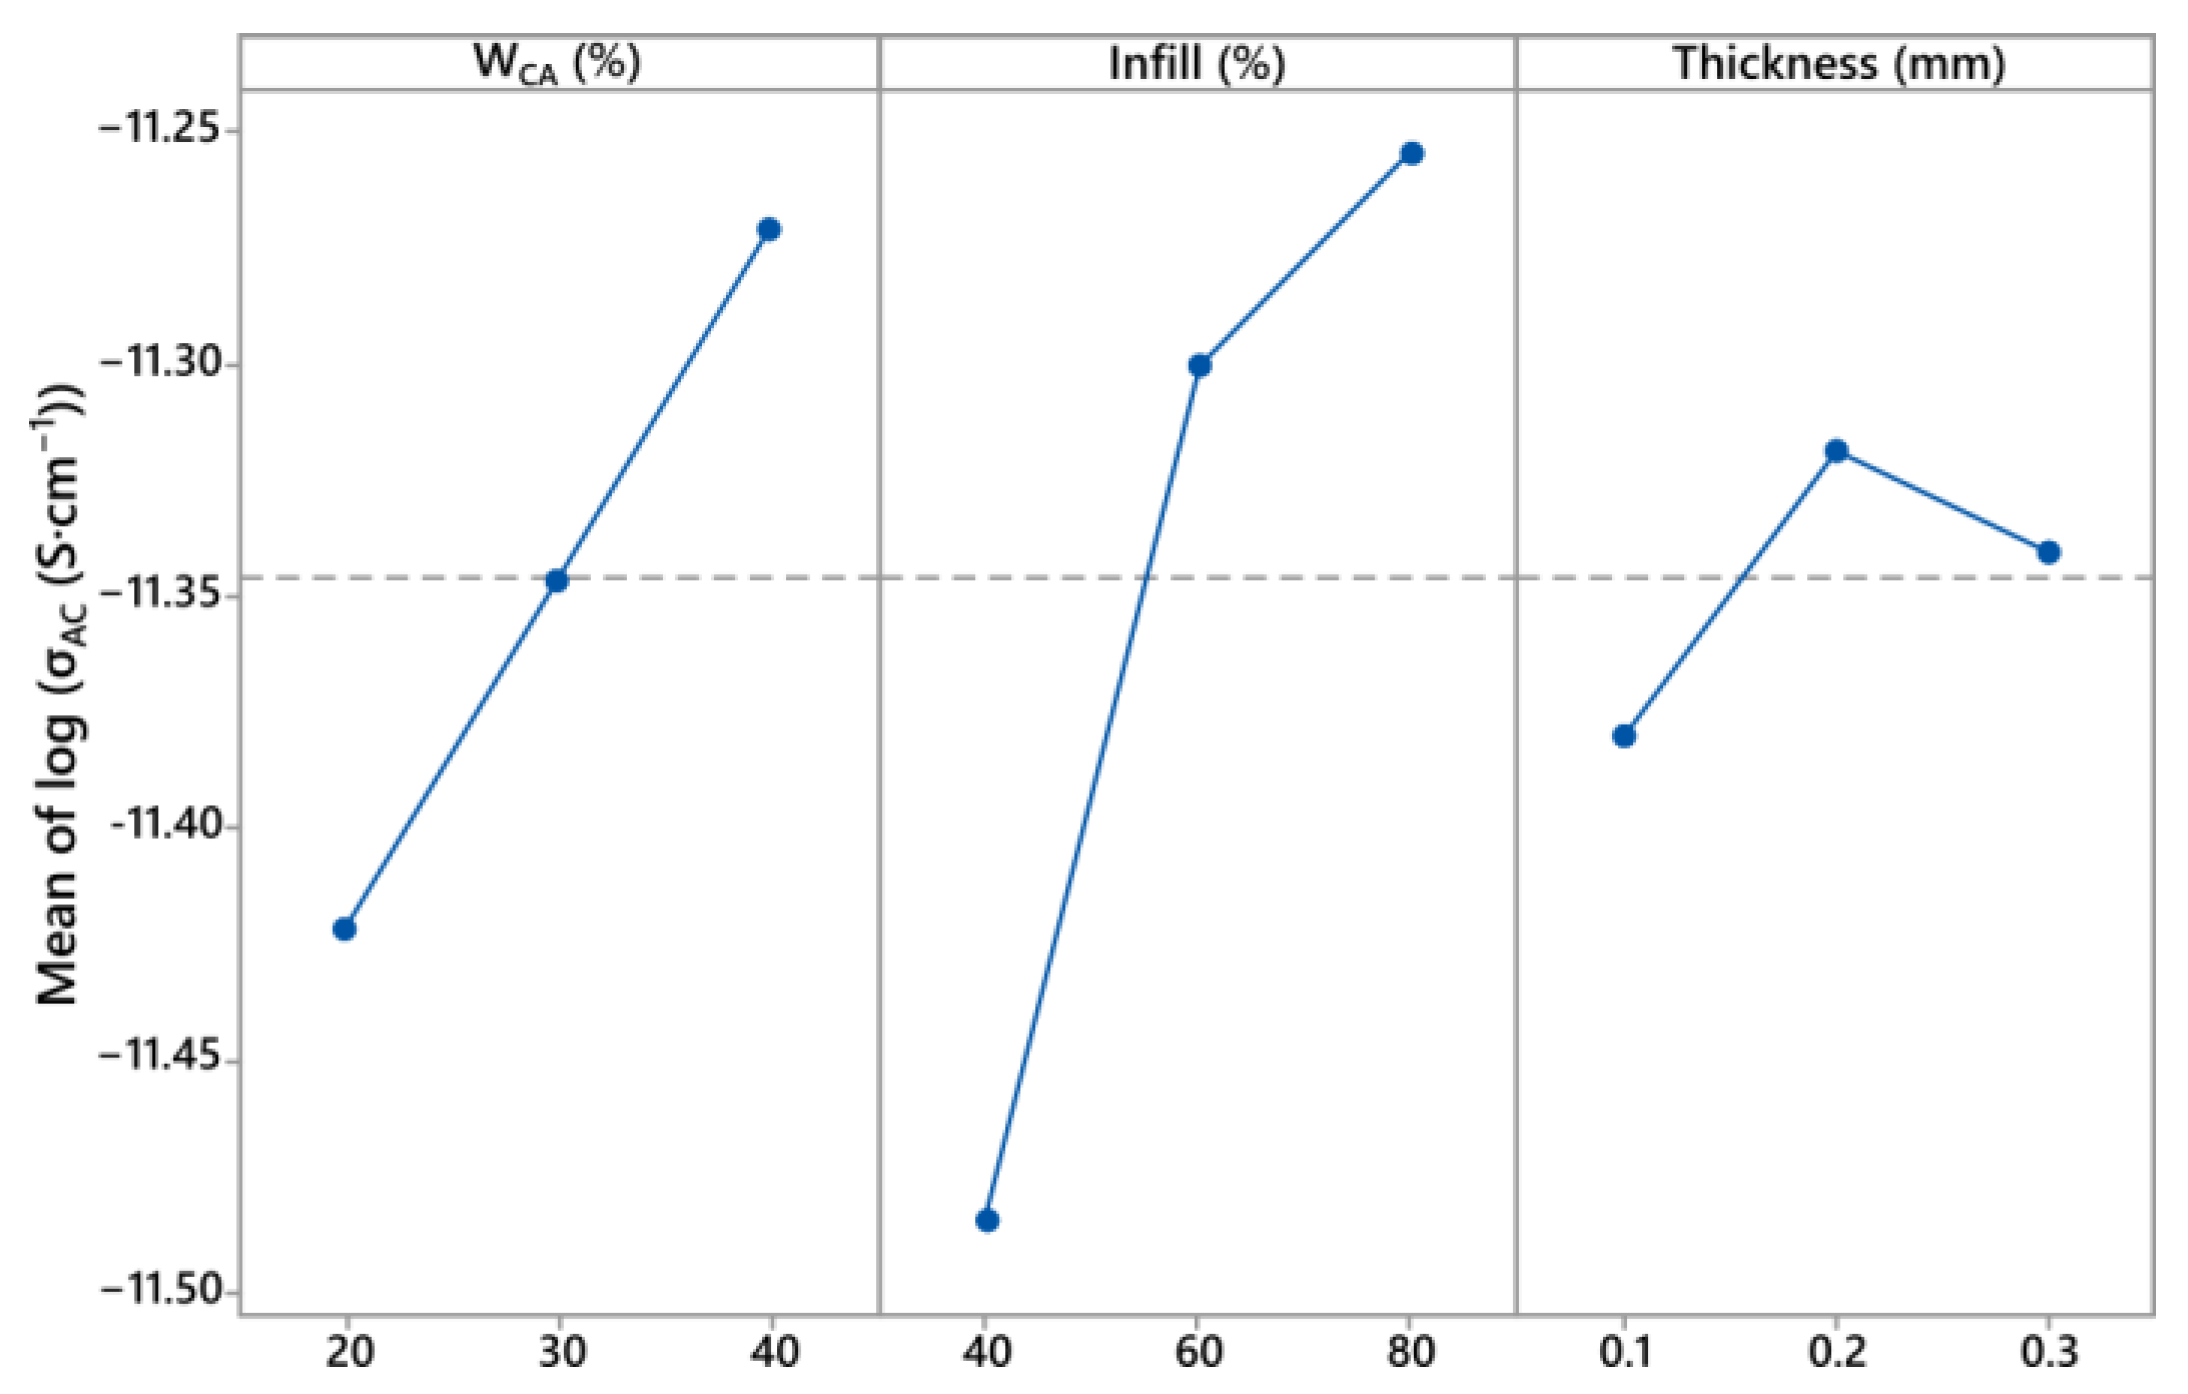
3.3. Electrical Conductivity

Table 4 shows the different electrical conductivities obtained via BDS at room temperature and 1 kHz for the 3D-printed PLA:CA biocomposite when using different parameters (WCA, infill ratio, and layer thickness). The measured electrical conductivity ranged from 2.63 × 10⁻¹² to 7.24 × 10⁻¹² S·cm−1. As for the dielectric constant, the lowest electrical conductivity was obtained for condition 1 and the highest for condition 9 (Figure 7). The electrical conductivity increased with the applied frequency for all tested conditions (1 to 9). Increasing the frequency favors the hopping carrier phenomenon, conveying the electrical current in the insulating materials. A steady increase in conductivity as a function of frequency was apparent for both conditions. Wu et al. showed this behavior is typical of an electrical insulator material [27]. Finally, all conditions tested with electrical frequencies below 100 kHz had electrical conductivity values under 10−8 S·cm−1. According to Solazzo et al., this would also make our materials electrically insulating materials [28].
Figure 8 shows the results of the Taguchi analysis at 1 kHz. The WCA and infill ratio significantly and positively influenced the electrical conductivity (p-values are 0.013 and 0.032, respectively). Adding CA into PLA increased the electrical conductivity of the latter due to the more polar nature of CA and the plasticizer, improving the carrier charges’ mobility [29]. Moreover, porosity has already been proven to reduce the electrical conductivity of polymeric materials [30]. Conversely, the layer thickness had little impact (p-value = 0.164) on the electrical conductivity. Globally, the effect of the various parameters on electrical conductivity was less significant than their effect on the dielectric constant. So, to reduce the electrical conductivity, the first step is to reduce the infill ratio, followed by a reduction in the WCA.

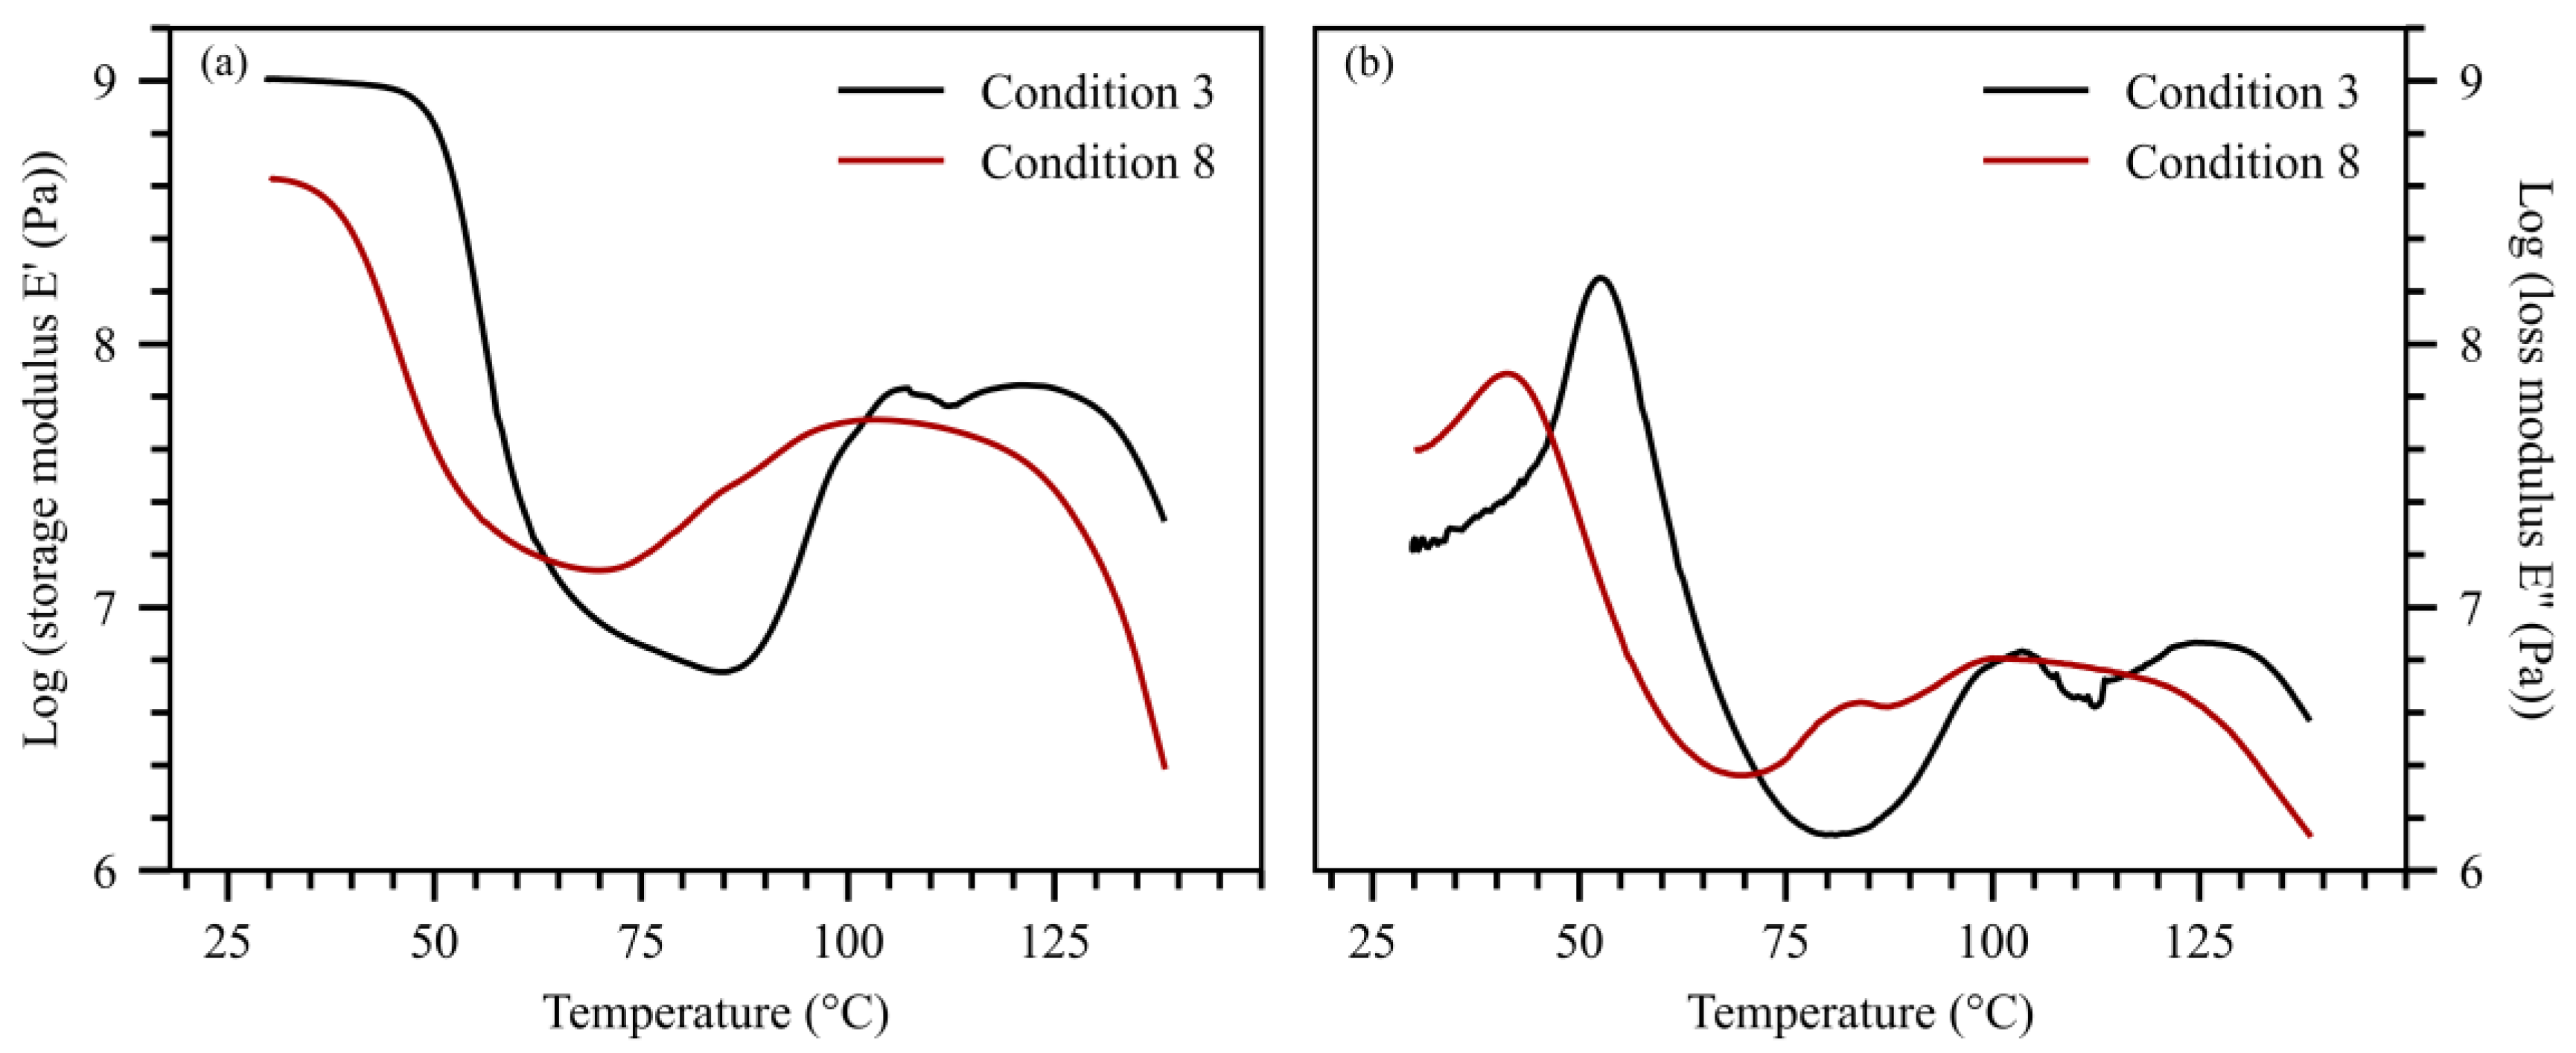
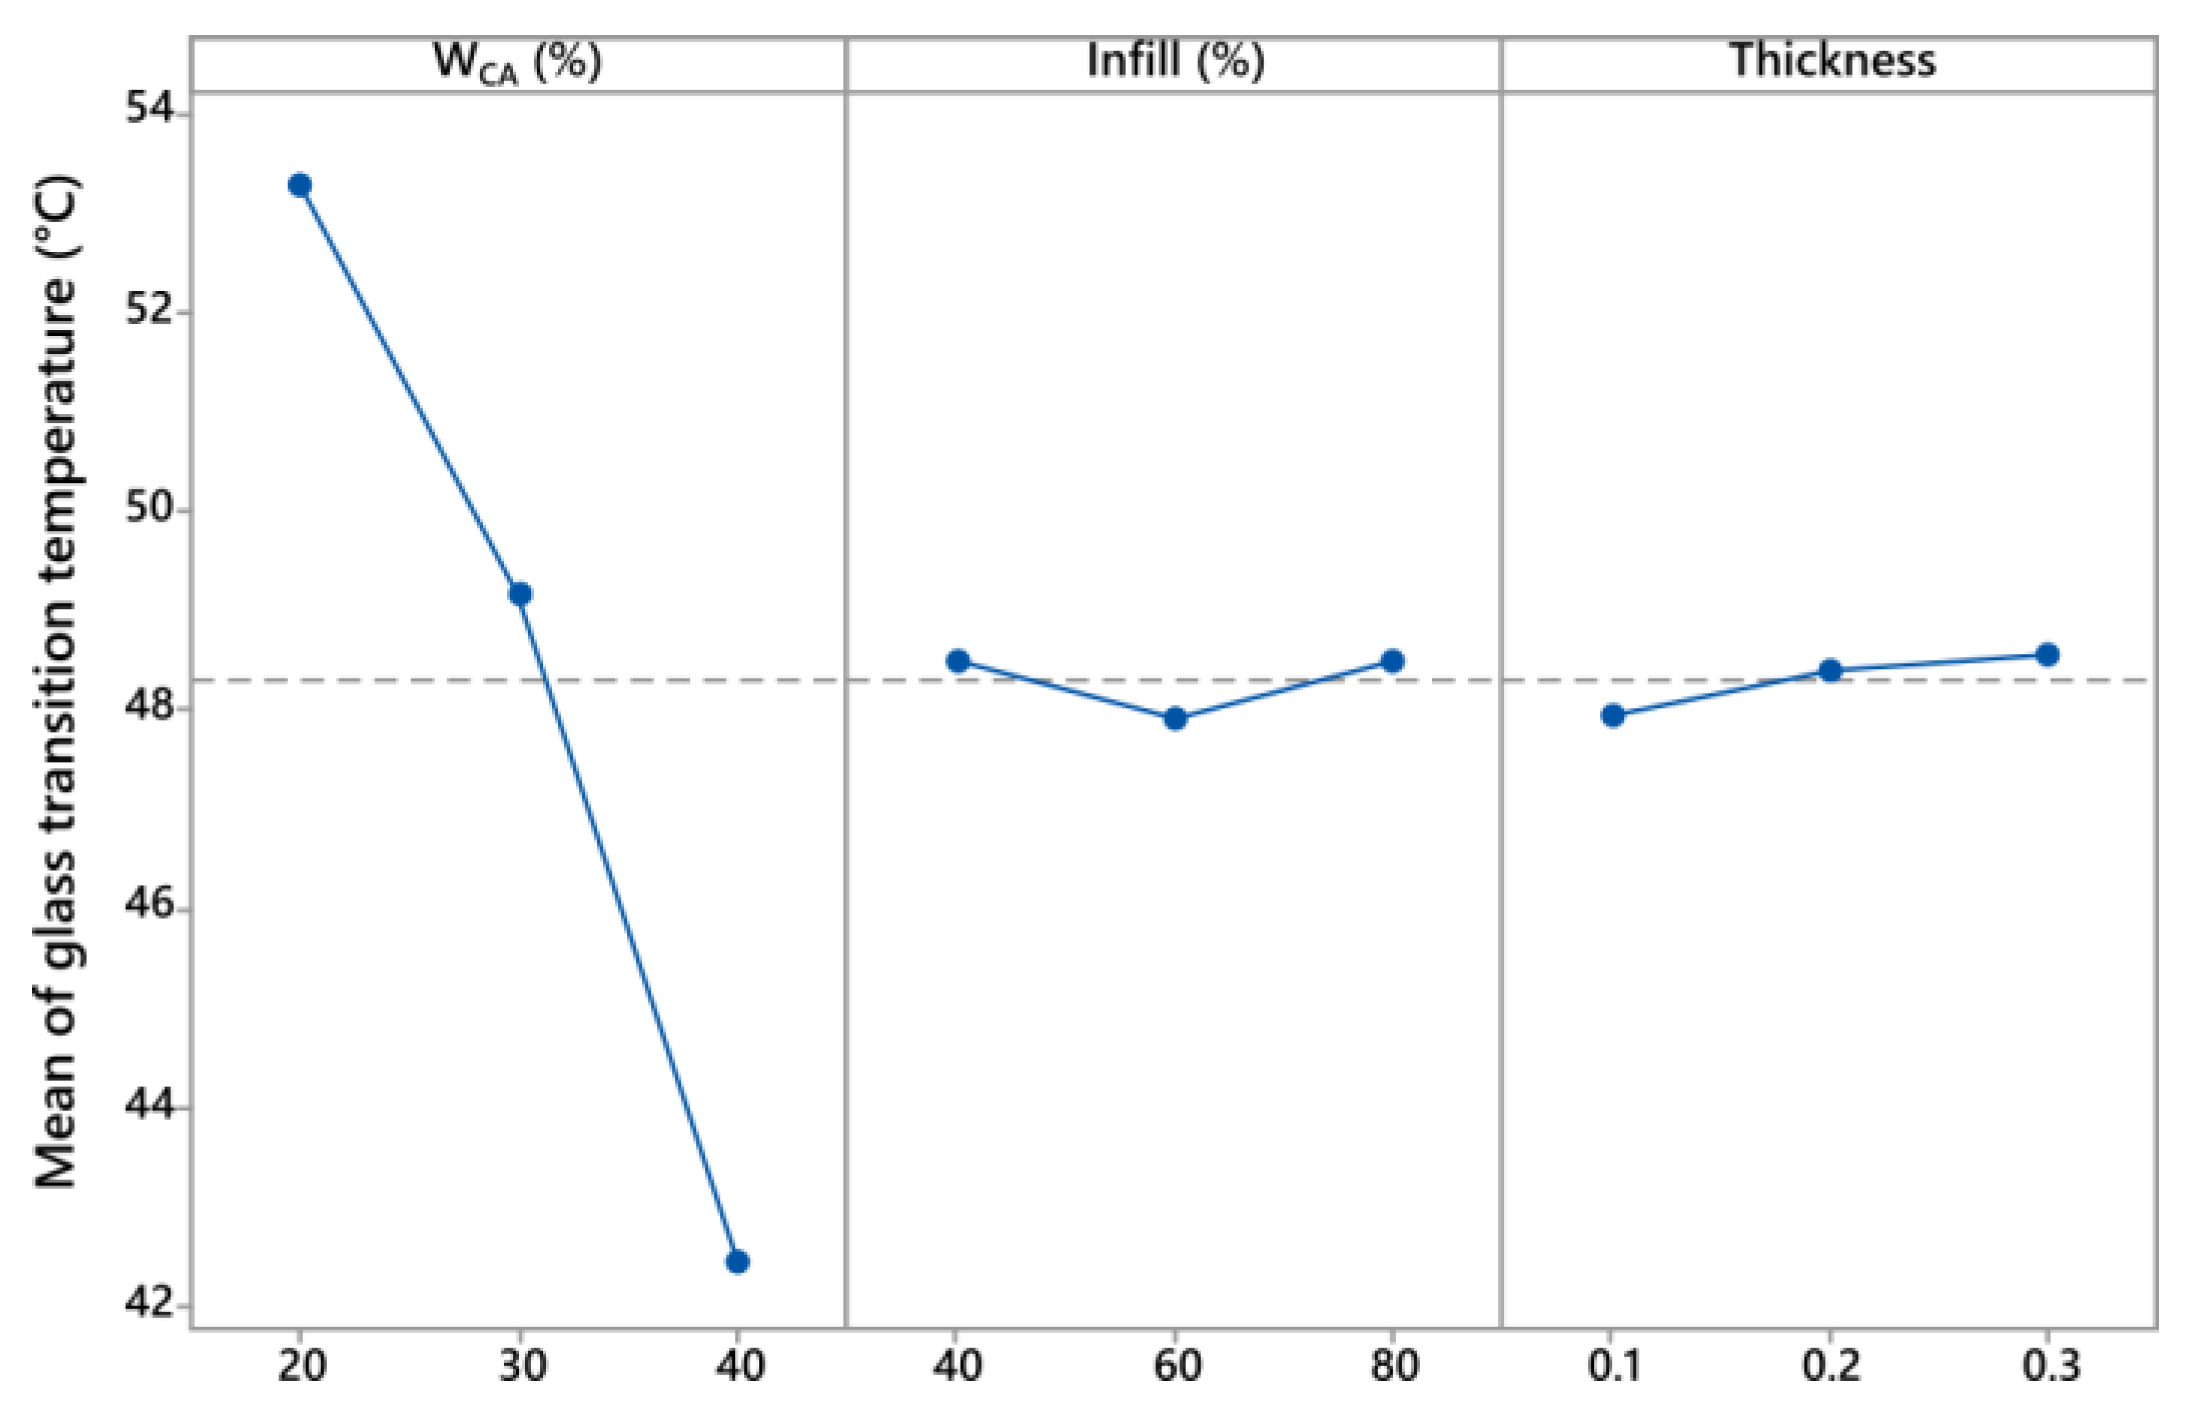
3.4. Dynamic Mechanical Analysis

Table 5 shows the different storage moduli (E′) and glass transition temperatures of PLA (Tg PLA) obtained via DMA for different parameters. At 30 °C and 1 Hz, the storage moduli ranged from 425.6 MPa to 976.8 MPa. The highest E′ was measured for condition 3 and the lowest for condition 8. The Tg PLA, measured at the loss modulus peak (peak E″), ranged from 41.3 to 53.5 °C. Complementary DSC measurements (Table S5) gave very similar values, validating the use of DMA to determine Tg. Moreover, Figure 9 presents the E′ and E″ of the Tg PLA. The curves are typical of plasticized PLA, as already described in Figure 2.
Figure 10 shows the results of the Taguchi analysis at 1 Hz. The Taguchi analyses were relatively unclear. The WCA, infill ratio, and layer thickness had p-values of 0.103, 0.186, and 0.295, respectively (Table S6). The higher p-values probably originate from two causes. Firstly, the mechanical tests were not carried out using triplicates due to material and time limitations. Secondly, the condition 8 DMA specimens exhibited an unusually poor print quality with many surface defects, resulting in mechanical properties that were well below expectations. It can be argued that immiscible PLA:CA blends had great printing difficulty at high CA content levels when small amounts of material were extruded (corresponding to a layer thickness of 0.1 mm). Furthermore, previous analyses have shown that the viscosity of PLA was greatly increased by adding CA [24], which can reduce the effectiveness of layer adhesion, especially when combined with a low infill ratio. Further tests were carried out by changing the layer thickness to 0.2 mm, and the print quality improved significantly. Condition 8 may have biased the Taguchi analysis results. However, given the literature and the observed trends, we can deduce that the infill ratio positively affected material stiffness due to a higher porosity content [31,32,33], where WCA had a slight negative effect. Layer thickness did not seem to influence the storage modulus. Further analyses are required to confirm the observed trends.
Concerning the storage modulus, a comparative analysis employing synthetic polymers was conducted, as presented in Table 6. It showed that the storage moduli obtained for PLA:CA for conditions 7, 8, and 9 were comparable with those of LDPE. It also proved once again that these materials could be relevant alternatives for replacing synthetic polymers in an electrical insulation application.
Finally, Figure 11 present the Taguchi analysis results for the PLA glass transition temperature as determined via DMA. It can be seen that the infill ratio and layer height had no significant influence on Tg PLA. On the contrary, WCA strongly influenced the Tg PLA (p-value = 0.006). This decrease can be attributed to the presence of the CA plasticizer, reducing the energy required for the α-relaxation of PLA.

4. Conclusions

Cellulose acetate is a biobased polymer with great potential for applications in the electronics industry, but there is a lack of research on its application via 3D printing. This study investigated the dielectric and mechanical properties of PLA:CA blends obtained through 3D printing. A printing optimization phase was firstly conducted to find the appropriate printing temperature and speed. The best compromise was found at 215 °C and 30 mm·s−1. A Taguchi L9 3^3 experiment was successfully performed to observe the influence of the CA content, infill ratio, and layer thickness on dielectric properties, mechanical properties, and glass temperature transition. The findings are as follows:
-
The infill ratio strongly decreased the dielectric and mechanical properties of 3D-printed PLA:CA blend samples. These observations can be linked to the more porous structure induced by the lack of infill.
-
The WCA positively influenced the dielectric constant and electrical conductivity due to the higher polar aspect of CA. The CA’s plasticizer could have caused the decrease in the storage modulus and Tg PLA induced by the WCA. These observations show that it would be possible to counterbalance the higher dielectric properties of CA by reducing the infill ratio to obtain a material with the best electrical insulating properties.
-
The layer thickness had little influence on the tested properties. However, it has been proven to cause critical failures at a high CA content. Therefore, it would be desirable to print PLA:CA blends with a layer thickness of 0.3 µm to accelerate printing speed and improve the printing quality of high-CA-content blends.
From an industrial point of view, this work is particularly promising, as it demonstrates that it is possible to manufacture and control the dielectric and mechanical properties of CA-based polymeric blends for electrical insulation applications, with the products having dielectric and mechanical properties close to those of polyethylene, a polymer commonly used in this field. In addition, it would be interesting to investigate the influence of the filling pattern on mechanical and dielectric properties to pursue architectural optimization. Furthermore, a focus on the mechanical properties of blends is needed in order to create a material able to rival the synthetic polymer commonly used in electrical insulation.

Supplementary Materials

The following supporting information can be downloaded at: https://www.mdpi.com/article/10.3390/jcs7120492/s1. Figure S1: interaction plots for dielectric constant; Figure S2: interaction plots for log (electrical conductivity); Figure S3: interaction plots for storage modulus; Figure S4: interaction plots for glass transition temperature of PLA; Table S1: variance analysis for dielectric constant; Table S2: response table for dielectric constant; Table S3: variance analysis of log (electrical conductivity); Table S4: response table for log (electrical conductivity); Table S5: notable temperature for PLA:CA blends, measured via DSC at 10K·min−1; Table S6: variance analysis of storage modulus at 30 °C (@ 1 Hz); Table S7: response table for storage modulus; Table S8: variance analysis of PLA’s glass transition temperature (@ 1 Hz).

Author Contributions

M.L.: Conceptualization, Methodology, Investigation, Software, Data Curation, Roles/Writing—Original Draft; L.B.K.: Conceptualization, Methodology, Investigation, Software, Data Curation; M.R.: Conceptualization, Supervision, Roles/Writing—Original Draft, Review and Editing; N.L.: Supervision, Review and Editing; A.K.: Conceptualization, Supervision, Writing—Review and Editing. All authors have read and agreed to the published version of the manuscript.

Funding

This research was funded by the MITACS Globalink Program and Normandy region.

Data Availability Statement

Data is contained within the article or supplementary material.

Acknowledgments

The authors acknowledge financial support from NSERC, the Canada Research Chair program, the MITACS Globalink Program, and the Normandy region research fellowship grant.

Conflicts of Interest

The authors declare no conflict of interest.

References

  1. Rezvani Ghomi, E.R.; Khosravi, F.; Saedi Ardahaei, A.S.; Dai, Y.; Neisiany, R.E.; Foroughi, F.; Wu, M.; Das, O.; Ramakrishna, S. The Life Cycle Assessment for Polylactic Acid (PLA) to Make It a Low-Carbon Material. Polymers 2021, 13, 1854. [Google Scholar] [CrossRef]
  2. Masarra, N.-A.; Batistella, M.; Quantin, J.-C.; Regazzi, A.; Pucci, M.F.; El Hage, R.; Lopez-Cuesta, J.-M. Fabrication of PLA/PCL/Graphene Nanoplatelet (GNP) Electrically Conductive Circuit Using the Fused Filament Fabrication (FFF) 3D Printing Technique; Ecole Nationale Supérieure des Mines d’Alès: Alès, France, 2022. [Google Scholar]
  3. European Bioplastics Bioplastics Market Data. Available online: https://www.european-bioplastics.org/market/ (accessed on 26 February 2023).
  4. Hamad, K.; Kaseem, M.; Deri, F.; Ko, Y.G. Mechanical Properties and Compatibility of Polylactic Acid/Polystyrene Polymer Blend. Mater. Lett. 2016, 164, 409–412. [Google Scholar] [CrossRef]
  5. Quintana, R.; Persenaire, O.; Lemmouchi, Y.; Sampson, J.; Martin, S.; Bonnaud, L.; Dubois, P. Enhancement of Cellulose Acetate Degradation under Accelerated Weathering by Plasticization with Eco-Friendly Plasticizers. Polym. Degrad. Stab. 2013, 98, 1556–1562. [Google Scholar] [CrossRef]
  6. Chen, Z.; Aziz, T.; Sun, H.; Ullah, A.; Ali, A.; Cheng, L.; Ullah, R.; Khan, F.U. Advances and Applications of Cellulose Bio-Composites in Biodegradable Materials. J. Polym. Environ. 2023, 31, 2273–2284. [Google Scholar] [CrossRef]
  7. Aziz, T.; Haq, F.; Farid, A.; Kiran, M.; Faisal, S.; Ullah, A.; Ullah, N.; Bokhari, A.; Mubashir, M.; Chuah, L.F.; et al. Challenges Associated with Cellulose Composite Material: Facet Engineering and Prospective. Environ. Res. 2023, 223, 115429. [Google Scholar] [CrossRef] [PubMed]
  8. Dreux, X. Comportement Viscoélastique à l’état Fondu et Structure d’acétates de Cellulose Plastifiés; Université de Lyon: Lyon, France, 2019. [Google Scholar]
  9. Phuong, V.T.; Verstiche, S.; Cinelli, P.; Anguillesi, I.; Coltelli, M.-B.; Lazzeri, A. Cellulose Acetate Blends-Effect of Plasticizers on Properties and Biodegradability. J. Renew. Mater. 2014, 2, 35–41. [Google Scholar] [CrossRef]
  10. Quintana, R.; Persenaire, O.; Lemmouchi, Y.; Bonnaud, L.; Dubois, P. Grafted d/l-Lactide to Cellulose Acetate by Reactive Melt Processing: Its Role as CA/PLA Blend Compatibilizer. Eur. Polym. J. 2014, 57, 30–36. [Google Scholar] [CrossRef]
  11. Ebrahim, S.M.; Kashyout, A.B.; Soliman, M.M. Electrical and Structural Properties of Polyaniline/Cellulose Triacetate Blend Films. J. Polym. Res. 2007, 14, 423–429. [Google Scholar] [CrossRef]
  12. Gasmi, S.; Hassan, M.K.; Luyt, A.S. Crystallization and Dielectric Behaviour of PLA and PHBV in PLA/PHBV Blends and PLA/PHBV/TiO2 Nanocomposites. Express Polym. Lett. 2019, 13, 199–212. [Google Scholar] [CrossRef]
  13. Dichtl, C.; Sippel, P.; Krohns, S. Dielectric Properties of 3D Printed Polylactic Acid. Adv. Mater. Sci. Eng. 2017, 2017, 6913835. [Google Scholar] [CrossRef]
  14. Veselý, P.; Tichý, T.; Šefl, O.; Horynová, E. Evaluation of Dielectric Properties of 3D Printed Objects Based on Printing Resolution. IOP Conf. Ser. Mater. Sci. Eng. 2018, 461, 012091. [Google Scholar] [CrossRef]
  15. Mullaveettil, F.N.; Dauksevicius, R.; Wakjira, Y. Strength and Elastic Properties of 3D Printed PVDF-Based Parts for Lightweight Biomedical Applications. J. Mech. Behav. Biomed. Mater. 2021, 120, 104603. [Google Scholar] [CrossRef] [PubMed]
  16. Park, S.; Shou, W.; Makatura, L.; Matusik, W.; Fu, K. (Kelvin) 3D Printing of Polymer Composites: Materials, Processes, and Applications. Matter 2022, 5, 43–76. [Google Scholar] [CrossRef]
  17. Vivaldi, F.; Sebechlebská, T.; Vaněčková, E.; Biagini, D.; Bonini, A.; Kolivoška, V. Electric Conductivity Measurements Employing 3D Printed Electrodes and Cells. Anal. Chim. Acta 2022, 1203, 339600. [Google Scholar] [CrossRef] [PubMed]
  18. Junpha, J.; Wisitsoraat, A.; Prathumwan, R.; Chaengsawang, W.; Khomungkhun, K.; Subannajui, K. Electronic Tongue and Cyclic Voltammetric Sensors Based on Carbon Nanotube/Polylactic Composites Fabricated by Fused Deposition Modelling 3D Printing. Mater. Sci. Eng. C 2020, 117, 111319. [Google Scholar] [CrossRef] [PubMed]
  19. Lin, T.-H.; Putranto, A.; Wang, Y.-T. Smart Sensor Tags for Seepage Sensing Protected by 3D-Printed Case for Embedding in Concrete Structures. Constr. Build. Mater. 2021, 284, 122784. [Google Scholar] [CrossRef]
  20. Kuzmanić, I.; Vujović, I.; Petković, M.; Šoda, J. Influence of 3D Printing Properties on Relative Dielectric Constant in PLA and ABS Materials. Prog. Addit. Manuf. 2023, 8, 703–710. [Google Scholar] [CrossRef]
  21. Goulas, A.; Zhang, S.; Cadman, D.A.; Järveläinen, J.; Mylläri, V.; Whittow, W.G.; Vardaxoglou, J.Y.C.; Engstrøm, D.S. The Impact of 3D Printing Process Parameters on the Dielectric Properties of High Permittivity Composites. Designs 2019, 3, 50. [Google Scholar] [CrossRef]
  22. Benabed, F.; Seghier, T. Dielectric Properties and Relaxation Behavior of High Density Polyethylene (HDPE). Appl. Mech. Mater. 2015, 799–800, 1319–1324. [Google Scholar] [CrossRef]
  23. Cristea, M.; Ionita, D.; Iftime, M.M. Dynamic Mechanical Analysis Investigations of PLA-Based Renewable Materials: How Are They Useful? Materials 2020, 13, 5302. [Google Scholar] [CrossRef]
  24. Lecoublet, M.; Ragoubi, M.; Leblanc, N.; Koubaa, A. Dielectric and Rheological Performances of Cellulose Acetate, Polylactic Acid and Polyhydroxybutyrate-Co-Valerate Biobased Blends. Polymer 2023, 285, 126358. [Google Scholar] [CrossRef]
  25. Coltelli, M.-B.; Mallegni, N.; Rizzo, S.; Cinelli, P.; Lazzeri, A. Improved Impact Properties in Poly(Lactic Acid) (PLA) Blends Containing Cellulose Acetate (CA) Prepared by Reactive Extrusion. Materials 2019, 12, 270. [Google Scholar] [CrossRef] [PubMed]
  26. Shaikh, H.M.; Anis, A.; Poulose, A.M.; Al-Zahrani, S.M.; Madhar, N.A.; Alhamidi, A.; Aldeligan, S.H.; Alsubaie, F.S. Synthesis and Characterization of Cellulose Triacetate Obtained from Date Palm (Phoenix Dactylifera L.) Trunk Mesh-Derived Cellulose. Molecules 2022, 27, 1434. [Google Scholar] [CrossRef] [PubMed]
  27. Wu, W.; Liu, T.; Zhang, D.; Sun, Q.; Cao, K.; Zha, J.; Lu, Y.; Wang, B.; Cao, X.; Feng, Y.; et al. Significantly Improved Dielectric Properties of Polylactide Nanocomposites via TiO2 Decorated Carbon Nanotubes. Compos. Part Appl. Sci. Manuf. 2019, 127, 105650. [Google Scholar] [CrossRef]
  28. Solazzo, M.; O’Brien, F.J.; Nicolosi, V.; Monaghan, M.G. The Rationale and Emergence of Electroconductive Biomaterial Scaffolds in Cardiac Tissue Engineering. APL Bioeng. 2019, 3, 041501. [Google Scholar] [CrossRef] [PubMed]
  29. Bandara, T.M.W.J.; Dissanayake, M.A.K.L.; Albinsson, I.; Mellander, B.-E. Mobile Charge Carrier Concentration and Mobility of a Polymer Electrolyte Containing PEO and Pr4N+I Using Electrical and Dielectric Measurements. Solid State Ion. 2011, 189, 63–68. [Google Scholar] [CrossRef]
  30. Galos, J.; Hu, Y.; Ravindran, A.R.; Ladani, R.B.; Mouritz, A.P. Electrical Properties of 3D Printed Continuous Carbon Fibre Composites Made Using the FDM Process. Compos. Part Appl. Sci. Manuf. 2021, 151, 106661. [Google Scholar] [CrossRef]
  31. Wang, K.; Xie, X.; Wang, J.; Zhao, A.; Peng, Y.; Rao, Y. Effects of Infill Characteristics and Strain Rate on the Deformation and Failure Properties of Additively Manufactured Polyamide-Based Composite Structures. Results Phys. 2020, 18, 103346. [Google Scholar] [CrossRef]
  32. Abeykoon, C.; Sri-Amphorn, P.; Fernando, A. Optimization of Fused Deposition Modeling Parameters for Improved PLA and ABS 3D Printed Structures. Int. J. Lightweight Mater. Manuf. 2020, 3, 284–297. [Google Scholar] [CrossRef]
  33. Öteyaka, M.Ö.; Aybar, K.; Öteyaka, H.C. Effect of Infill Ratio on the Tensile and Flexural Properties of Unreinforced and Carbon Fiber-Reinforced Polylactic Acid Manufactured by Fused Deposition Modeling. J. Mater. Eng. Perform. 2021, 30, 5203–5215. [Google Scholar] [CrossRef]
  34. Ahmed Dabbak, S.; Illias, H.; Ang, B.; Abdul Latiff, N.; Makmud, M. Electrical Properties of Polyethylene/Polypropylene Compounds for High-Voltage Insulation. Energies 2018, 11, 1448. [Google Scholar] [CrossRef]
  35. Chen, J.-Q.; Wang, X.; Sun, W.-F.; Zhao, H. Improved Water-Tree Resistances of SEBS/PP Semi-Crystalline Composites under Crystallization Modifications. Molecules 2020, 25, 3669. [Google Scholar] [CrossRef] [PubMed]
  36. Han, B.; Yin, C.; Chang, J.; Pang, Y.; Lv, P.; Song, W.; Wang, X. Study on the Structure and Dielectric Properties of Zeolite/LDPE Nanocomposite under Thermal Aging. Polymers 2020, 12, 2108. [Google Scholar] [CrossRef] [PubMed]
  37. Molefi, J.A.; Luyt, A.S.; Krupa, I. Comparison of the Influence of Copper Micro- and Nano-Particles on the Mechanical Properties of Polyethylene/Copper Composites. J. Mater. Sci. 2010, 45, 82–88. [Google Scholar] [CrossRef]
  38. Xu, W.; Tan, L.; Qin, S.; He, Y.; Wu, T.; Qu, J. Efficient Fabrication of Highly Exfoliated and Evenly Dispersed High-Density Polyethylene/Expanded Graphite Nanocomposite with Enhanced Dielectric Constant and Extremely Low Dielectric Loss. Compos. Part Appl. Sci. Manuf. 2021, 142, 106242. [Google Scholar] [CrossRef]
  39. Uyor, U.; Popoola, A.; Popoola, O.; Aigbodion, V. Thermal, Mechanical and Dielectric Properties of Functionalized Sandwich BN-BaTiO3-BN/Polypropylene Nanocomposites. J. Alloys Compd. 2022, 894, 162405. [Google Scholar] [CrossRef]
  40. Yeole, P.; Alwekar, S.; Veluswamy, N.K.P.; Kore, S.; Hiremath, N.; Vaidya, U.; Theodore, M. Characterization of Textile-Grade Carbon Fiber Polypropylene Composites. Polym. Polym. Compos. 2021, 29, 652–659. [Google Scholar] [CrossRef]
Figure 1. PLA:CA 3D printing samples: rectangular samples with dimensions of 60 × 10 × 4 mm for dynamic mechanical analysis and circular samples of 25 mm diameter disks with a thickness of 4 mm for dielectric analysis.
Jcs 07 00492 g001
Figure 2. Storage modulus versus temperature of PLA:CA 3D-printed blends.
Jcs 07 00492 g002
Figure 3. (ae) Scanning Electron Microscopy (SEM) picture of PLA:CA blends at WCA = 40%.
Jcs 07 00492 g003
Figure 4. Thermal stability of PLA:CA blends.
Jcs 07 00492 g004
Figure 5. Dielectric constant versus frequency. Condition 1 corresponds to a WCA = 20%, infill ratio = 40%, and layer thickness = 0.1 mm. Condition 9 corresponds to a WCA = 40%, infill ratio = 80%, and layer thickness = 0.2 mm.
Jcs 07 00492 g005
Figure 6. Means for dielectric constant at room temperature and 1 kHz.
Jcs 07 00492 g006
Figure 7. Log (electrical conductivity) at room temperature versus frequency for conditions 1 and 9.
Jcs 07 00492 g007
Figure 8. Means for electrical conductivity at room temperature and 1 kHz.
Jcs 07 00492 g008
Figure 9. Variation of storage modulus (a) and loss modulus (b) versus temperature of conditions 3 and 8.
Jcs 07 00492 g009
Figure 10. Means for storage modulus at 30 °C and 1 Hz.
Jcs 07 00492 g010
Figure 11. Main effect plot of means for glass transition temperature measured using DMA.
Jcs 07 00492 g011
Table 1. Experimental 3D printing parameters.
Print Parameters
T nozzle ( °C)205215225
Printing speed (mm·s−1)102030
Table 2. L9 (3^3) Taguchi experimental design.
ConditionWCA (%)Infill Ratio (%)Thickness (mm)
120400.1
220600.2
320800.3
430400.2
530600.3
630800.1
740400.3
840600.1
940800.2
Table 3. Variation in dielectric constant ε′ at different frequencies (at room temperature).
ConditionWCA (%)Infill
(%)
Thickness
(mm)
ε
@ 100 Hz
ε
@ 10 kHz
ε
@ 1 MHz
120400.11.91 ± 0.051.93 ± 0.061.90 ± 0.06
220600.22.21 ± 0.022.23 ± 0.082.20 ± 0.01
320800.32.32 ± 0.032.34 ± 0.042.30 ± 0.03
430400.22.04 ± 0.032.06 ± 0.012.03 ± 0.01
530600.32.31 ± 0.022.31 ± 0.022.27 ± 0.01
630800.12.36 ± 0.032.37 ± 0.042.32 ± 0.03
740400.32.11 ± 0.072.11 ± 0.072.07 ± 0.07
840600.12.25 ± 0.042.25 ± 0.042.20 ± 0.04
940800.22.46 ± 0.122.45 ± 0.112.39 ± 0.11
Table 4. Electrical conductivity σAC at room temperature and 1 kHz.
ConditionWCA (%)Infill (%)Thickness (mm)Log σac (S·cm−1) @ 1 kHz
120400.1−11.58 ± 0.03
220600.2−11.36 ± 0.04
320800.3−11.32 ± 0.04
430400.2−11.45 ± 0.05
530600.3−11.28 ± 0.04
630800.1−11.30 ± 0.06
740400.3−11.42 ± 0.06
840600.1−11.26 ± 0.06
940800.2−11.14 ± 0.07
Table 5. Storage modulus @ 1 Hz and 30 °C and glass transition temperature measured using BDS analysis.
ConditionWCA (%)Infill (%)Thickness (mm)E′ (MPa)Tg PLA (E″ Peak, °C)
120400.1694.453.5
220600.2805.853.1
320800.3976.853.3
430400.2692.249.0
530600.3774.649.4
630800.1877.449.1
740400.3656.243.0
840600.1424.641.3
940800.2654.143.1
Table 6. Comparative analysis of the dielectric constant and storage modulus for synthetic polymers.
Dielectric Constant (ε′)
Measured at 100 Hz
Storage Modulus (E′)
Measured at 1 Hz
PolymerT ( °C)εRef.PolymerT ( °C)E′ (MPa)Ref.
PLA:CA
(40%)
202.11Our StudyPLA:CA
(40%)
30656Our Study
2.25425
2.46654
LDPERoom T2.43[34]LDPE30380[35]
2.21[36]390[37]
HDPERoom T2.48[34]HDPE301710[37]
2.5[38]
PPRoom T2.3[34]PP301800[35]
2.1[39] 1816[40]
Disclaimer/Publisher’s Note: The statements, opinions and data contained in all publications are solely those of the individual author(s) and contributor(s) and not of MDPI and/or the editor(s). MDPI and/or the editor(s) disclaim responsibility for any injury to people or property resulting from any ideas, methods, instructions or products referred to in the content.

