
The 3D Printing of Biomass–Fungi Composites: Effects of Waiting Time after Mixture Preparation on Mechanical Properties, Rheological Properties, Minimum Extrusion Pressure, and Print Quality of the Prepared Mixture

 ,
,  , , and
Abstract
:1. Introduction
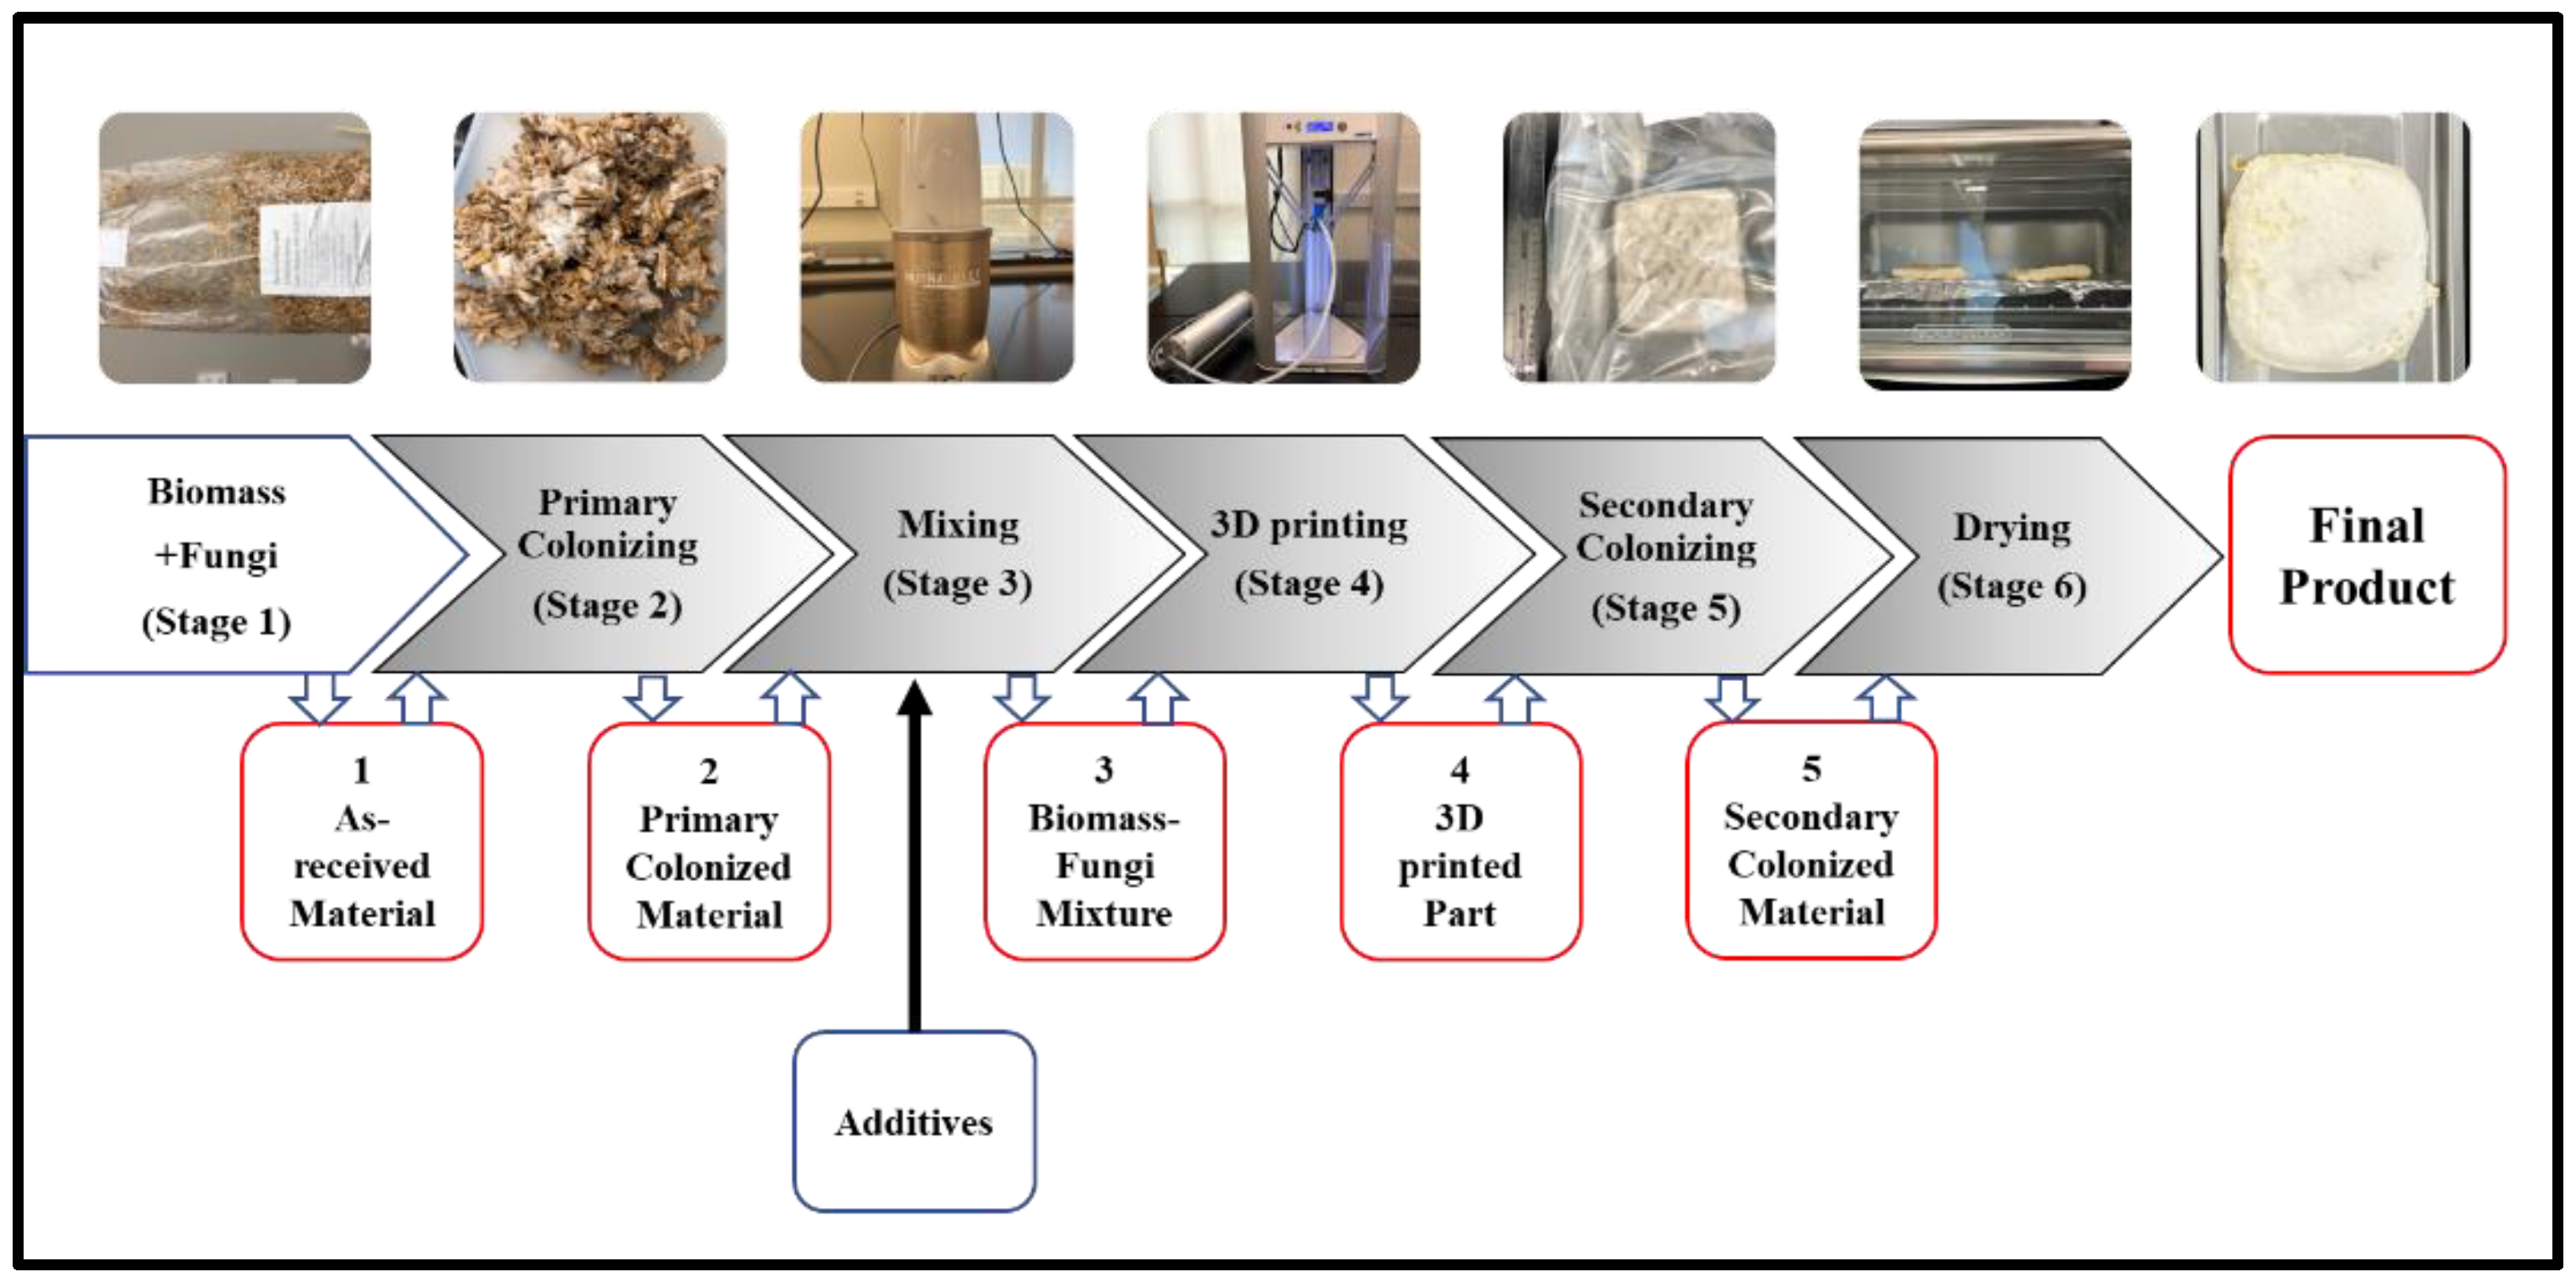
2. Methodology
2.1. Materials
2.2. Experimental Procedures
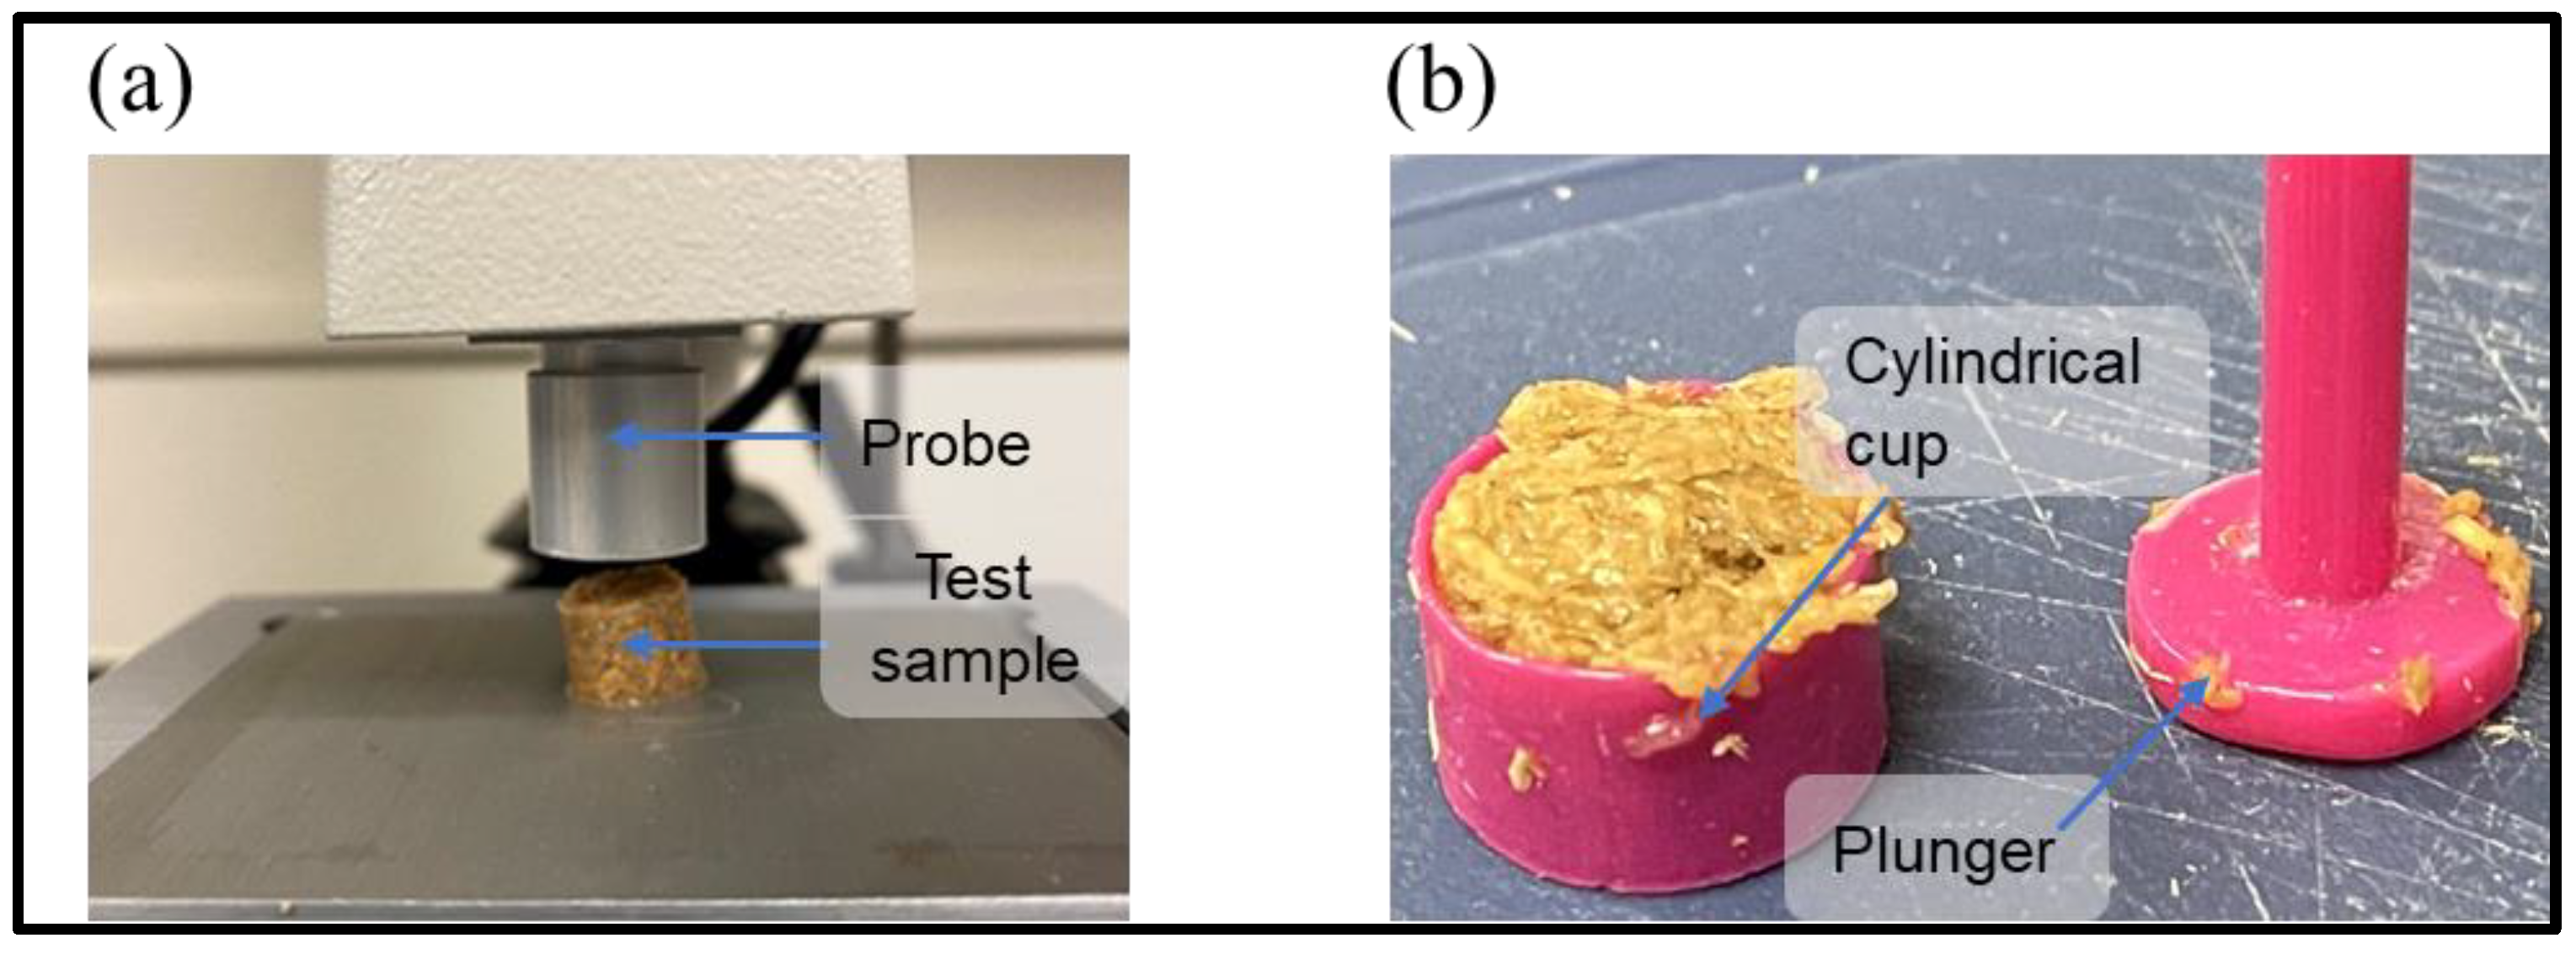
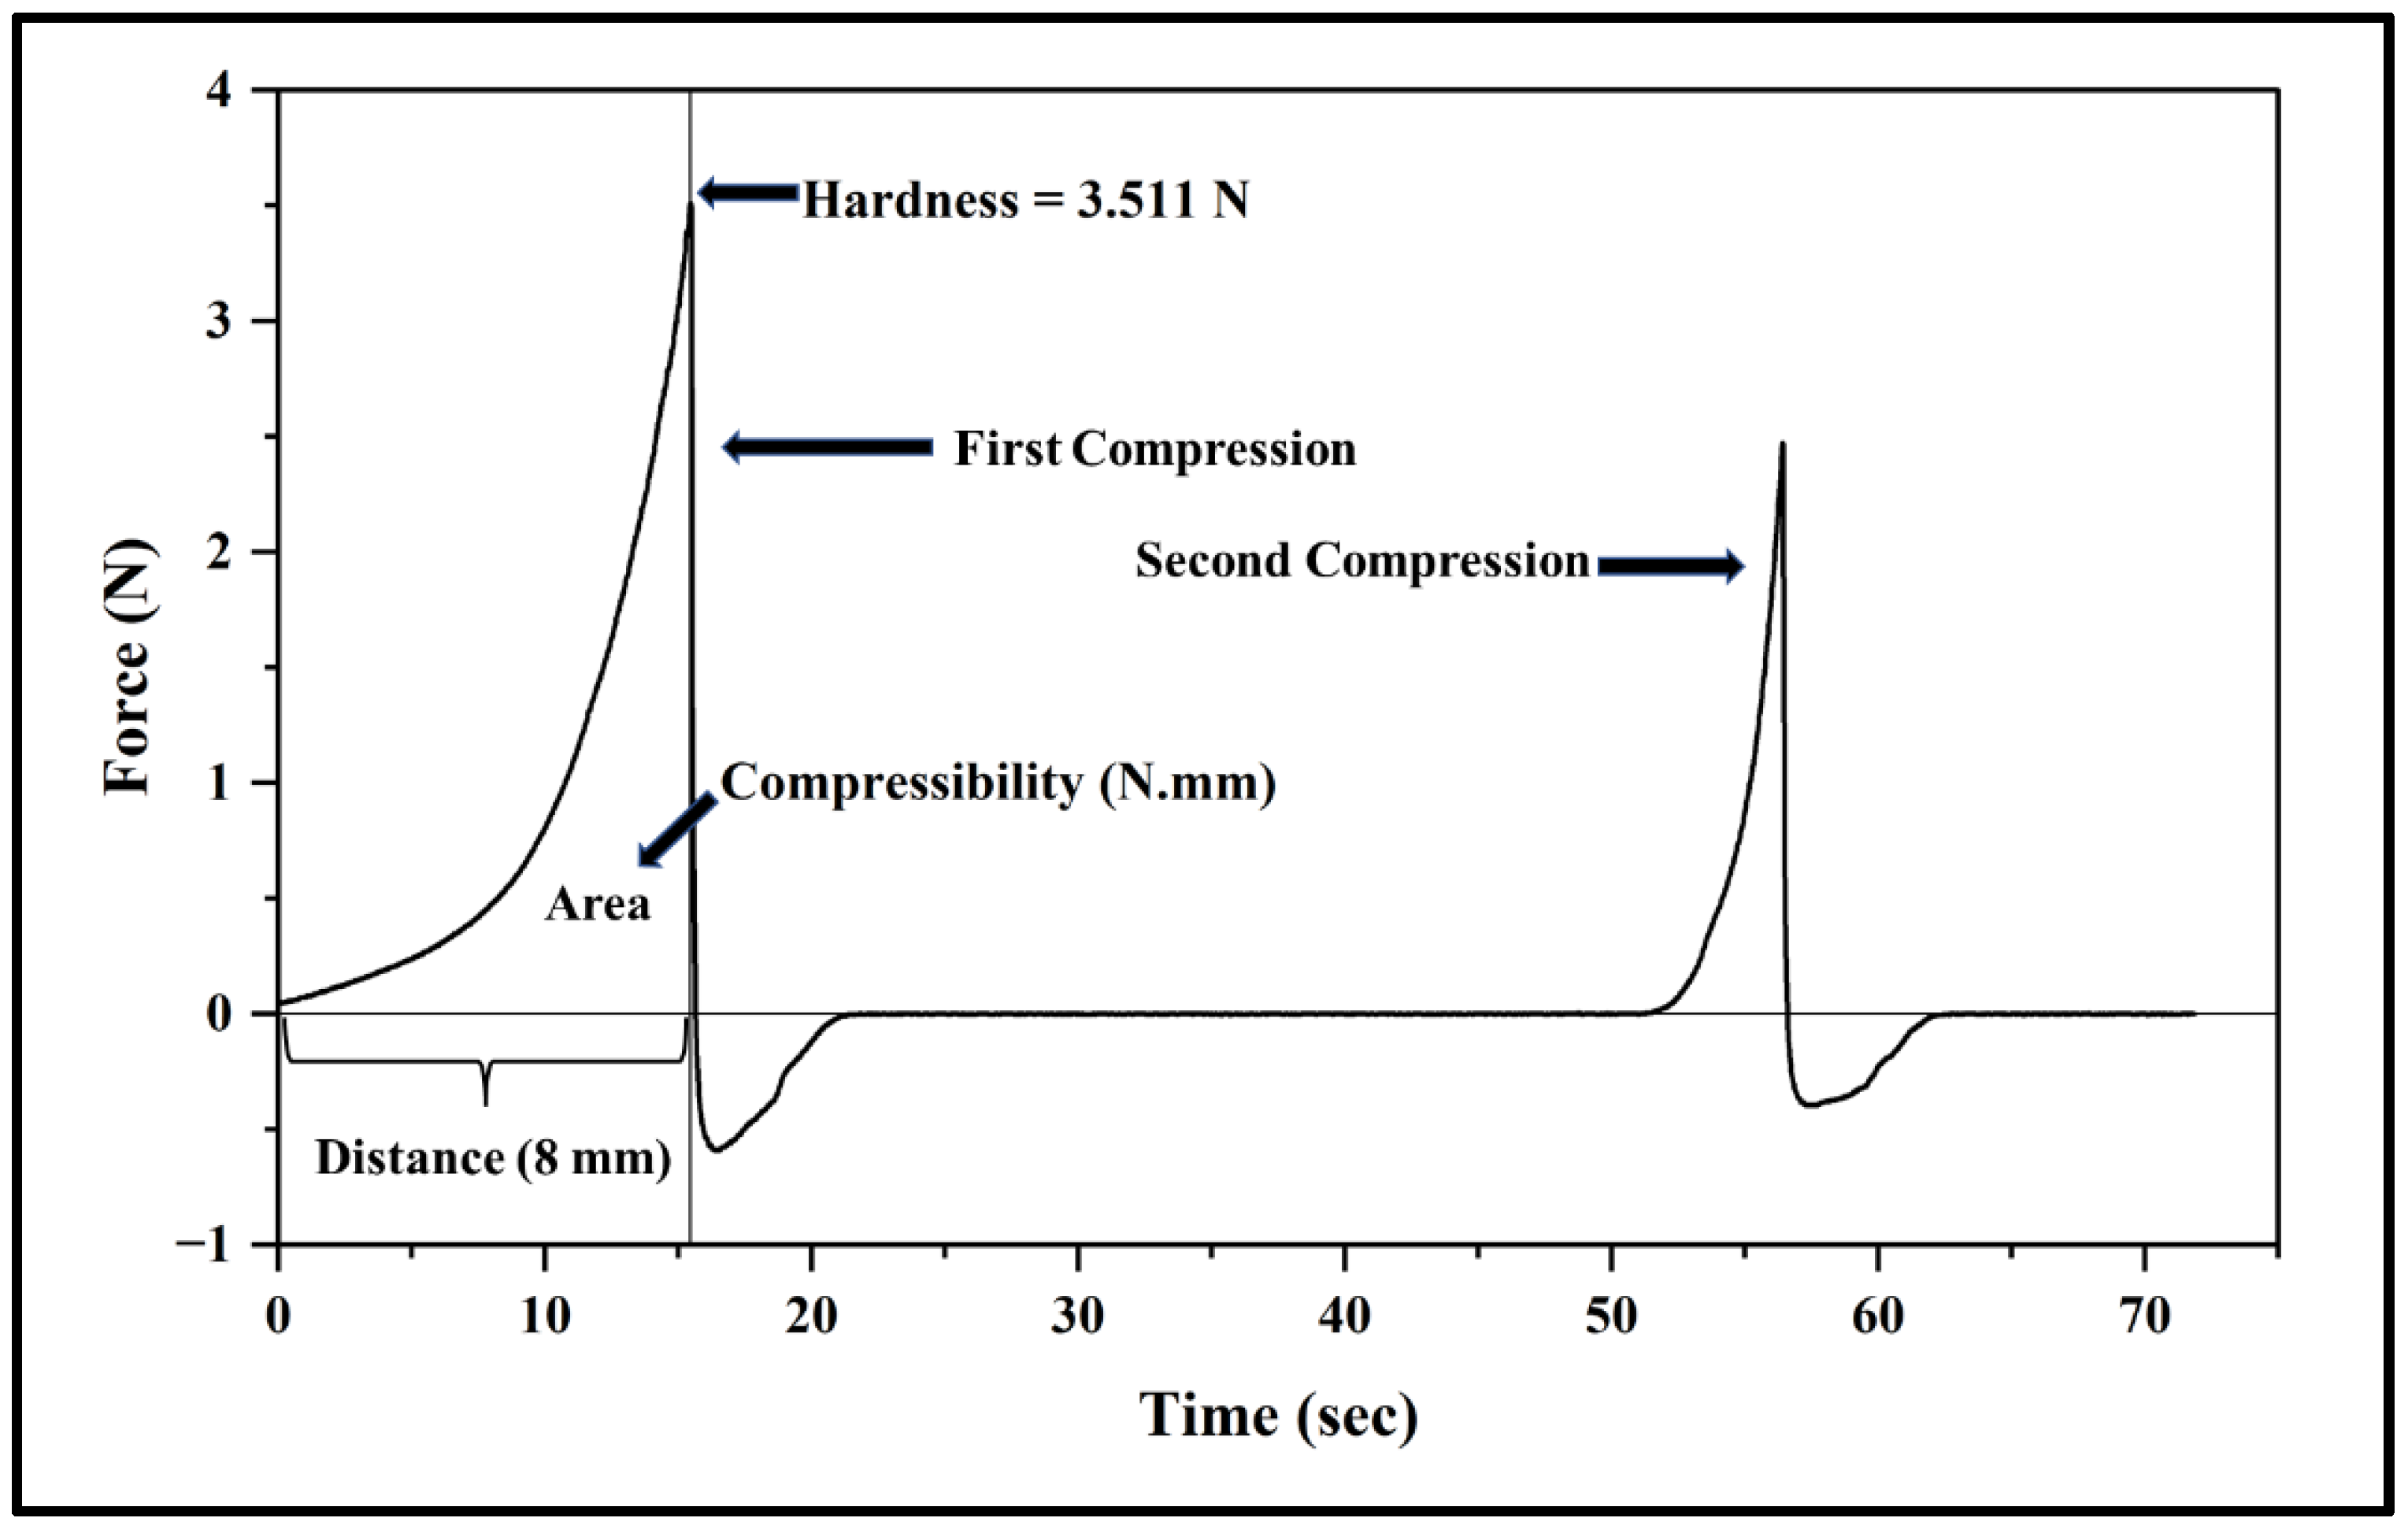
2.3. Measurement of the Mechanical Properties of the Prepared Mixture
- (1)
- Hardness (the maximum force recorded during the first compression cycle);
- (2)
- Compressibility (the work required to deform the sample during the first compression and calculated as the area under the force-distance curve for the first compression cycle).
2.4. Measurement of the Rheological Properties of the Prepared Mixture
2.5. Determination of the Minimum Printing Pressure Required for Continuous Extrusion
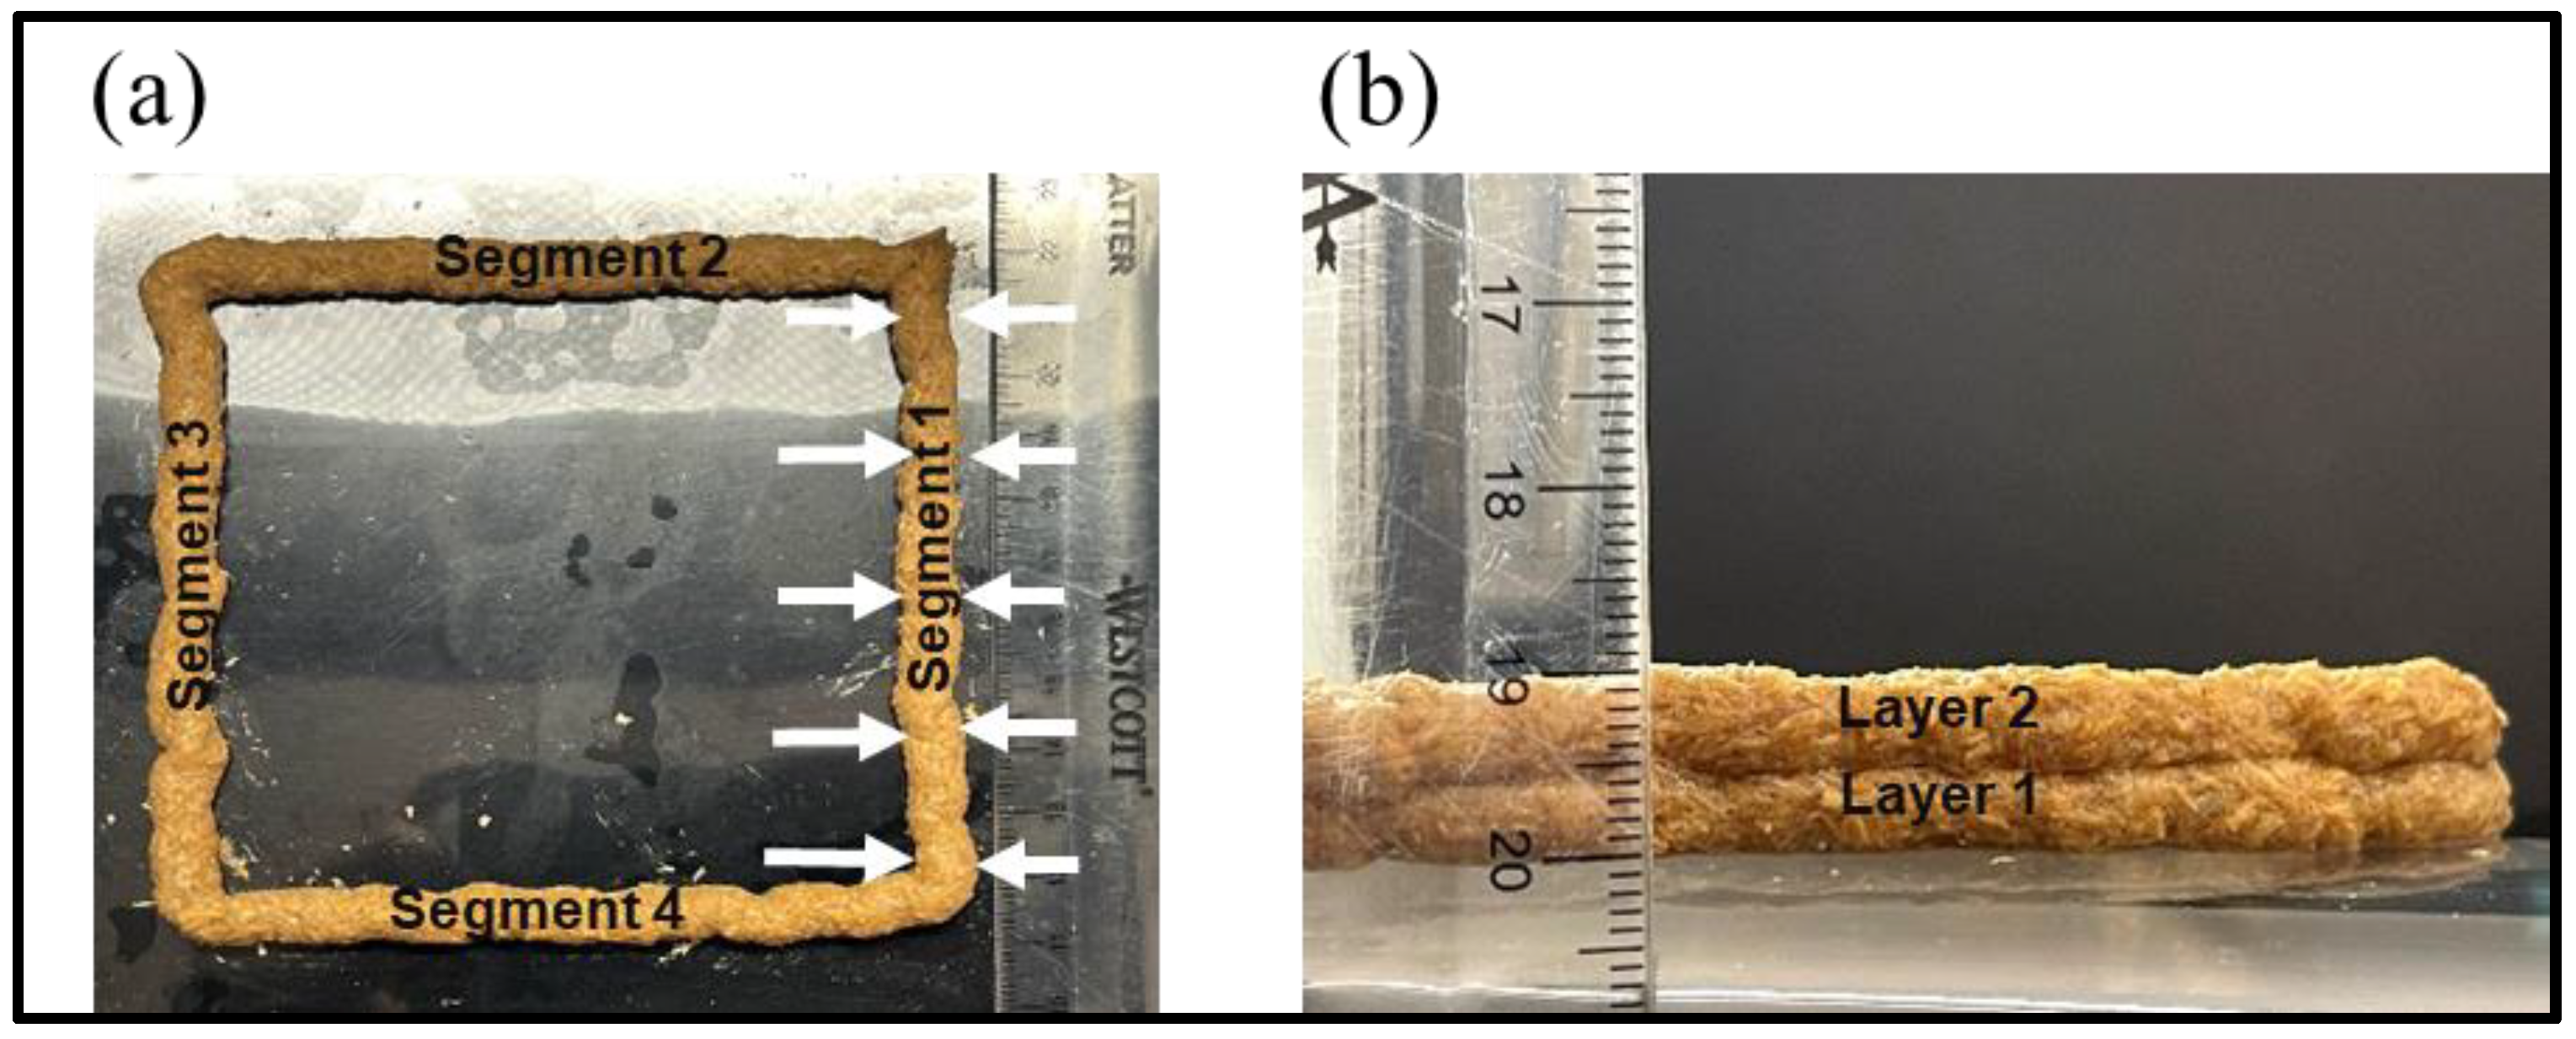
2.6. Measurement of Print Quality
2.7. Statistical Analysis
3. Results and Discussion
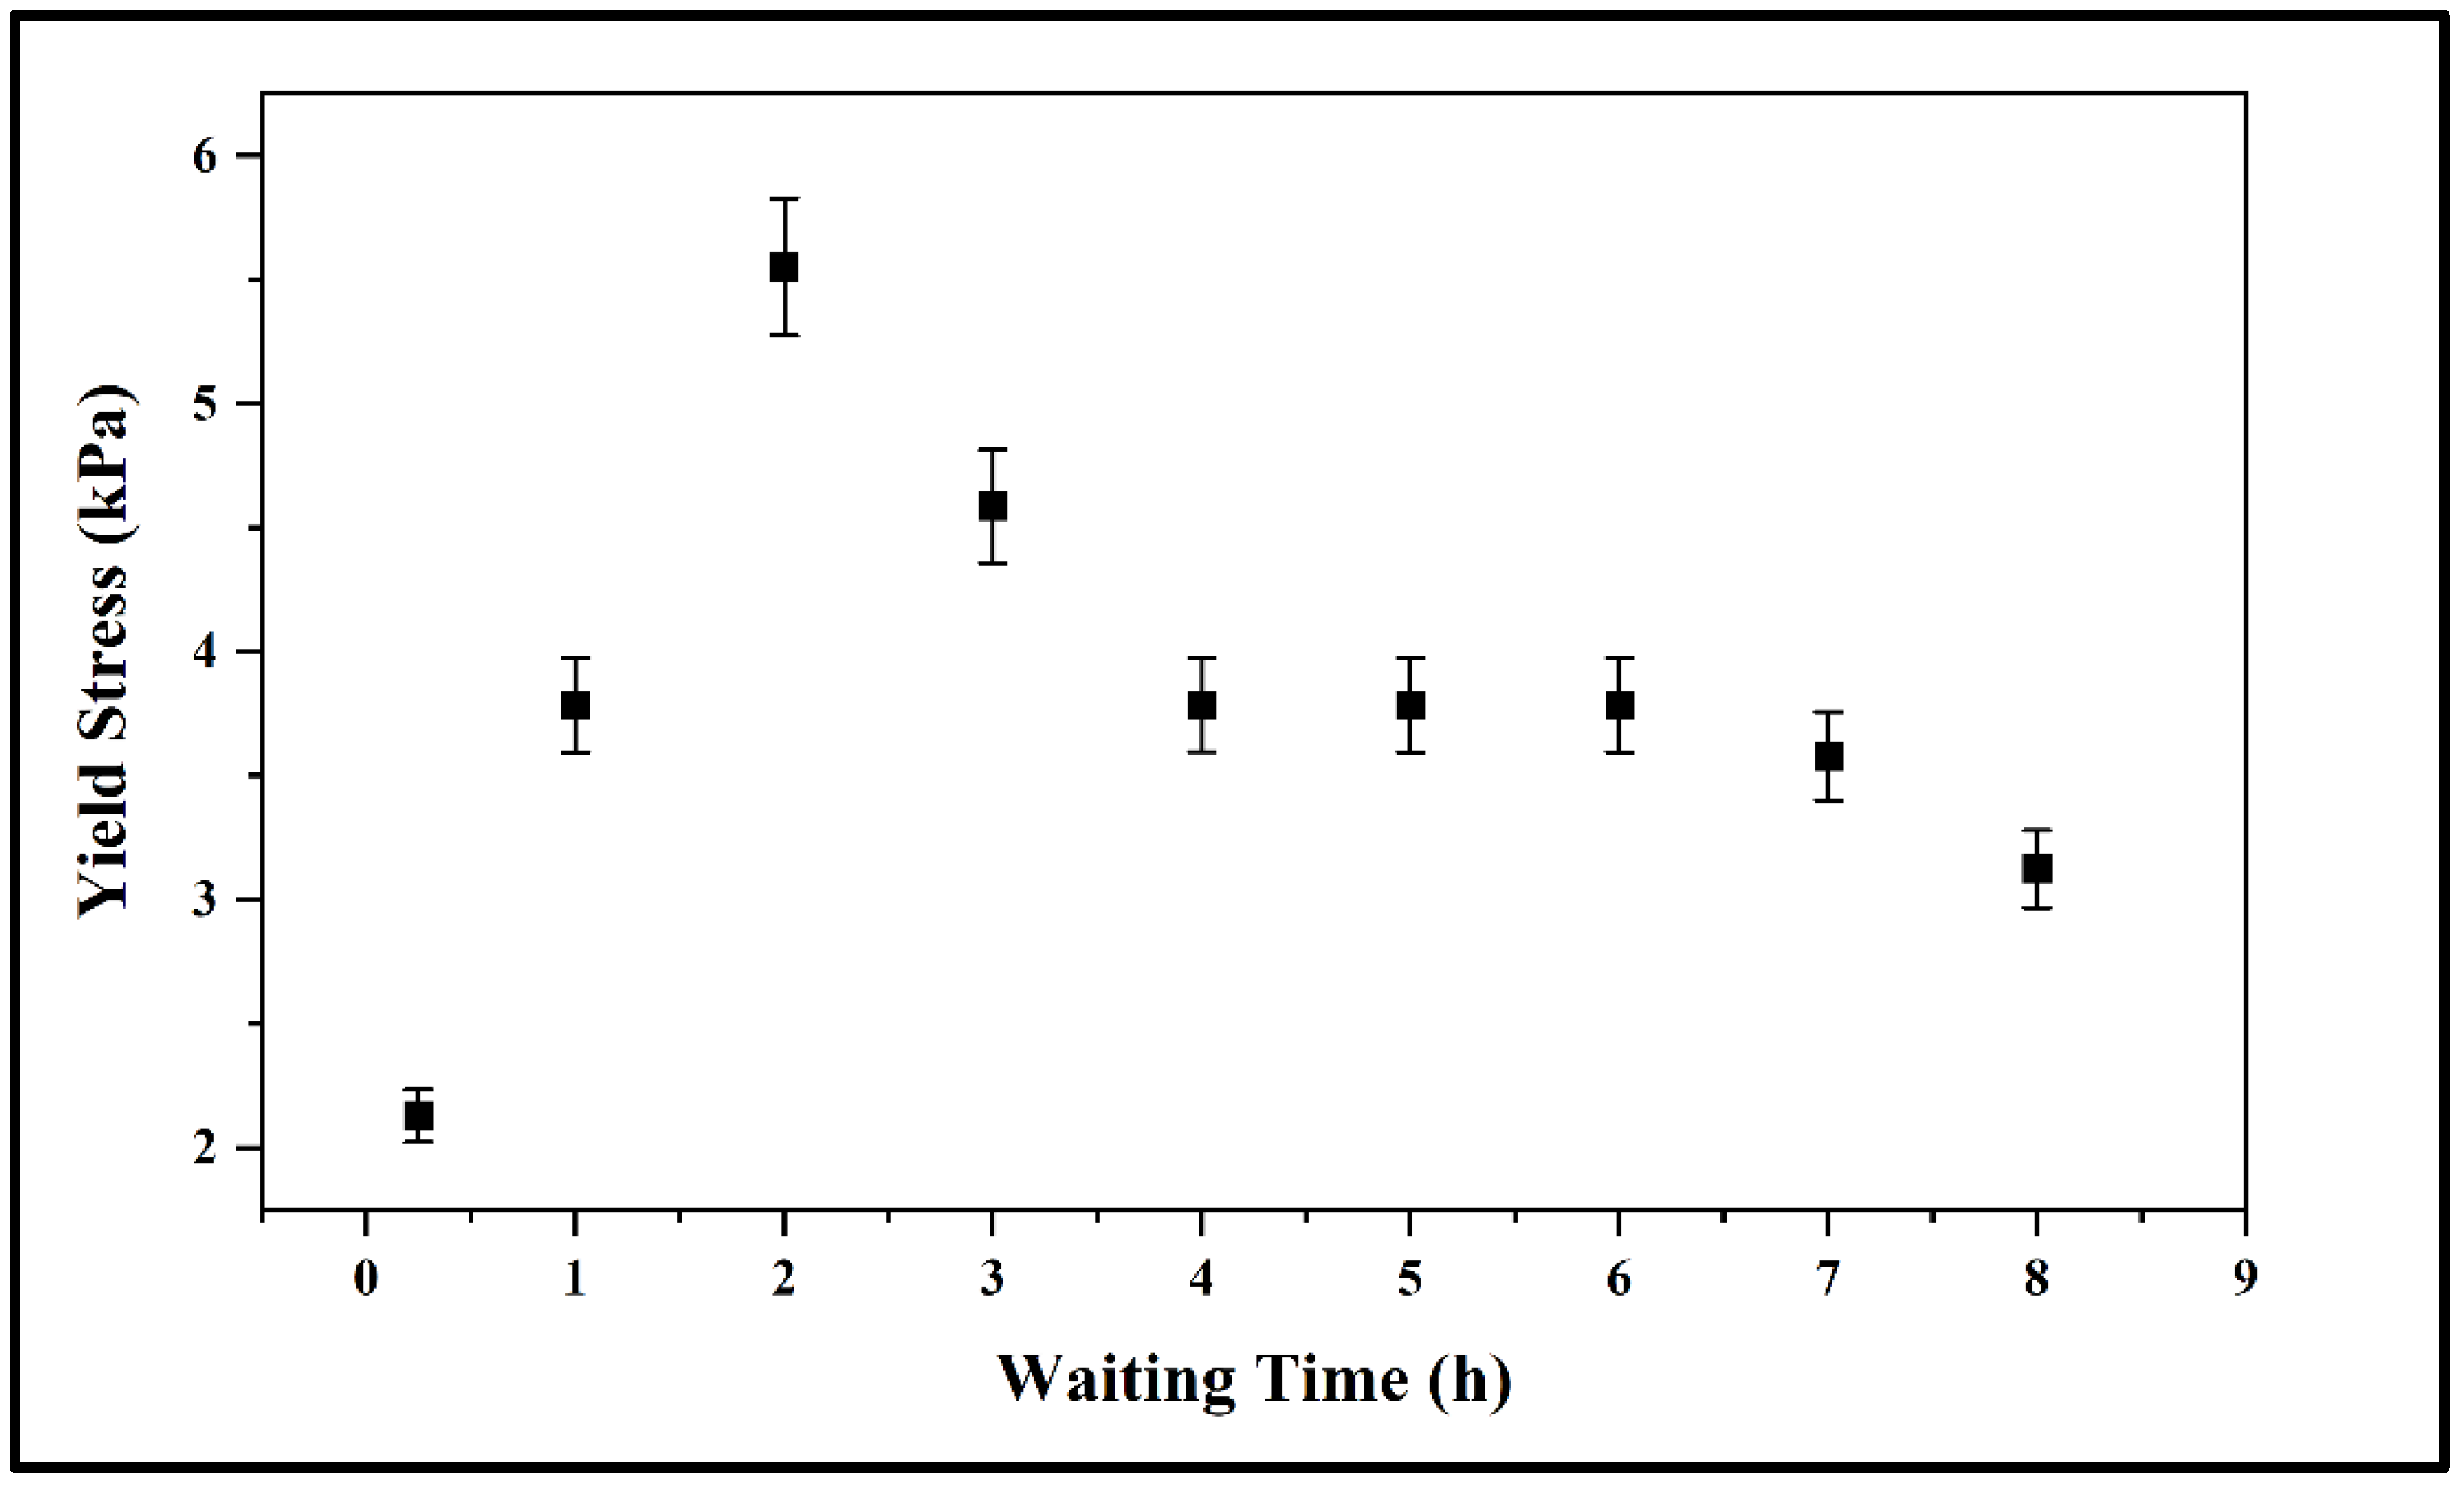
3.1. Mechanical Properties of the Prepared Mixture
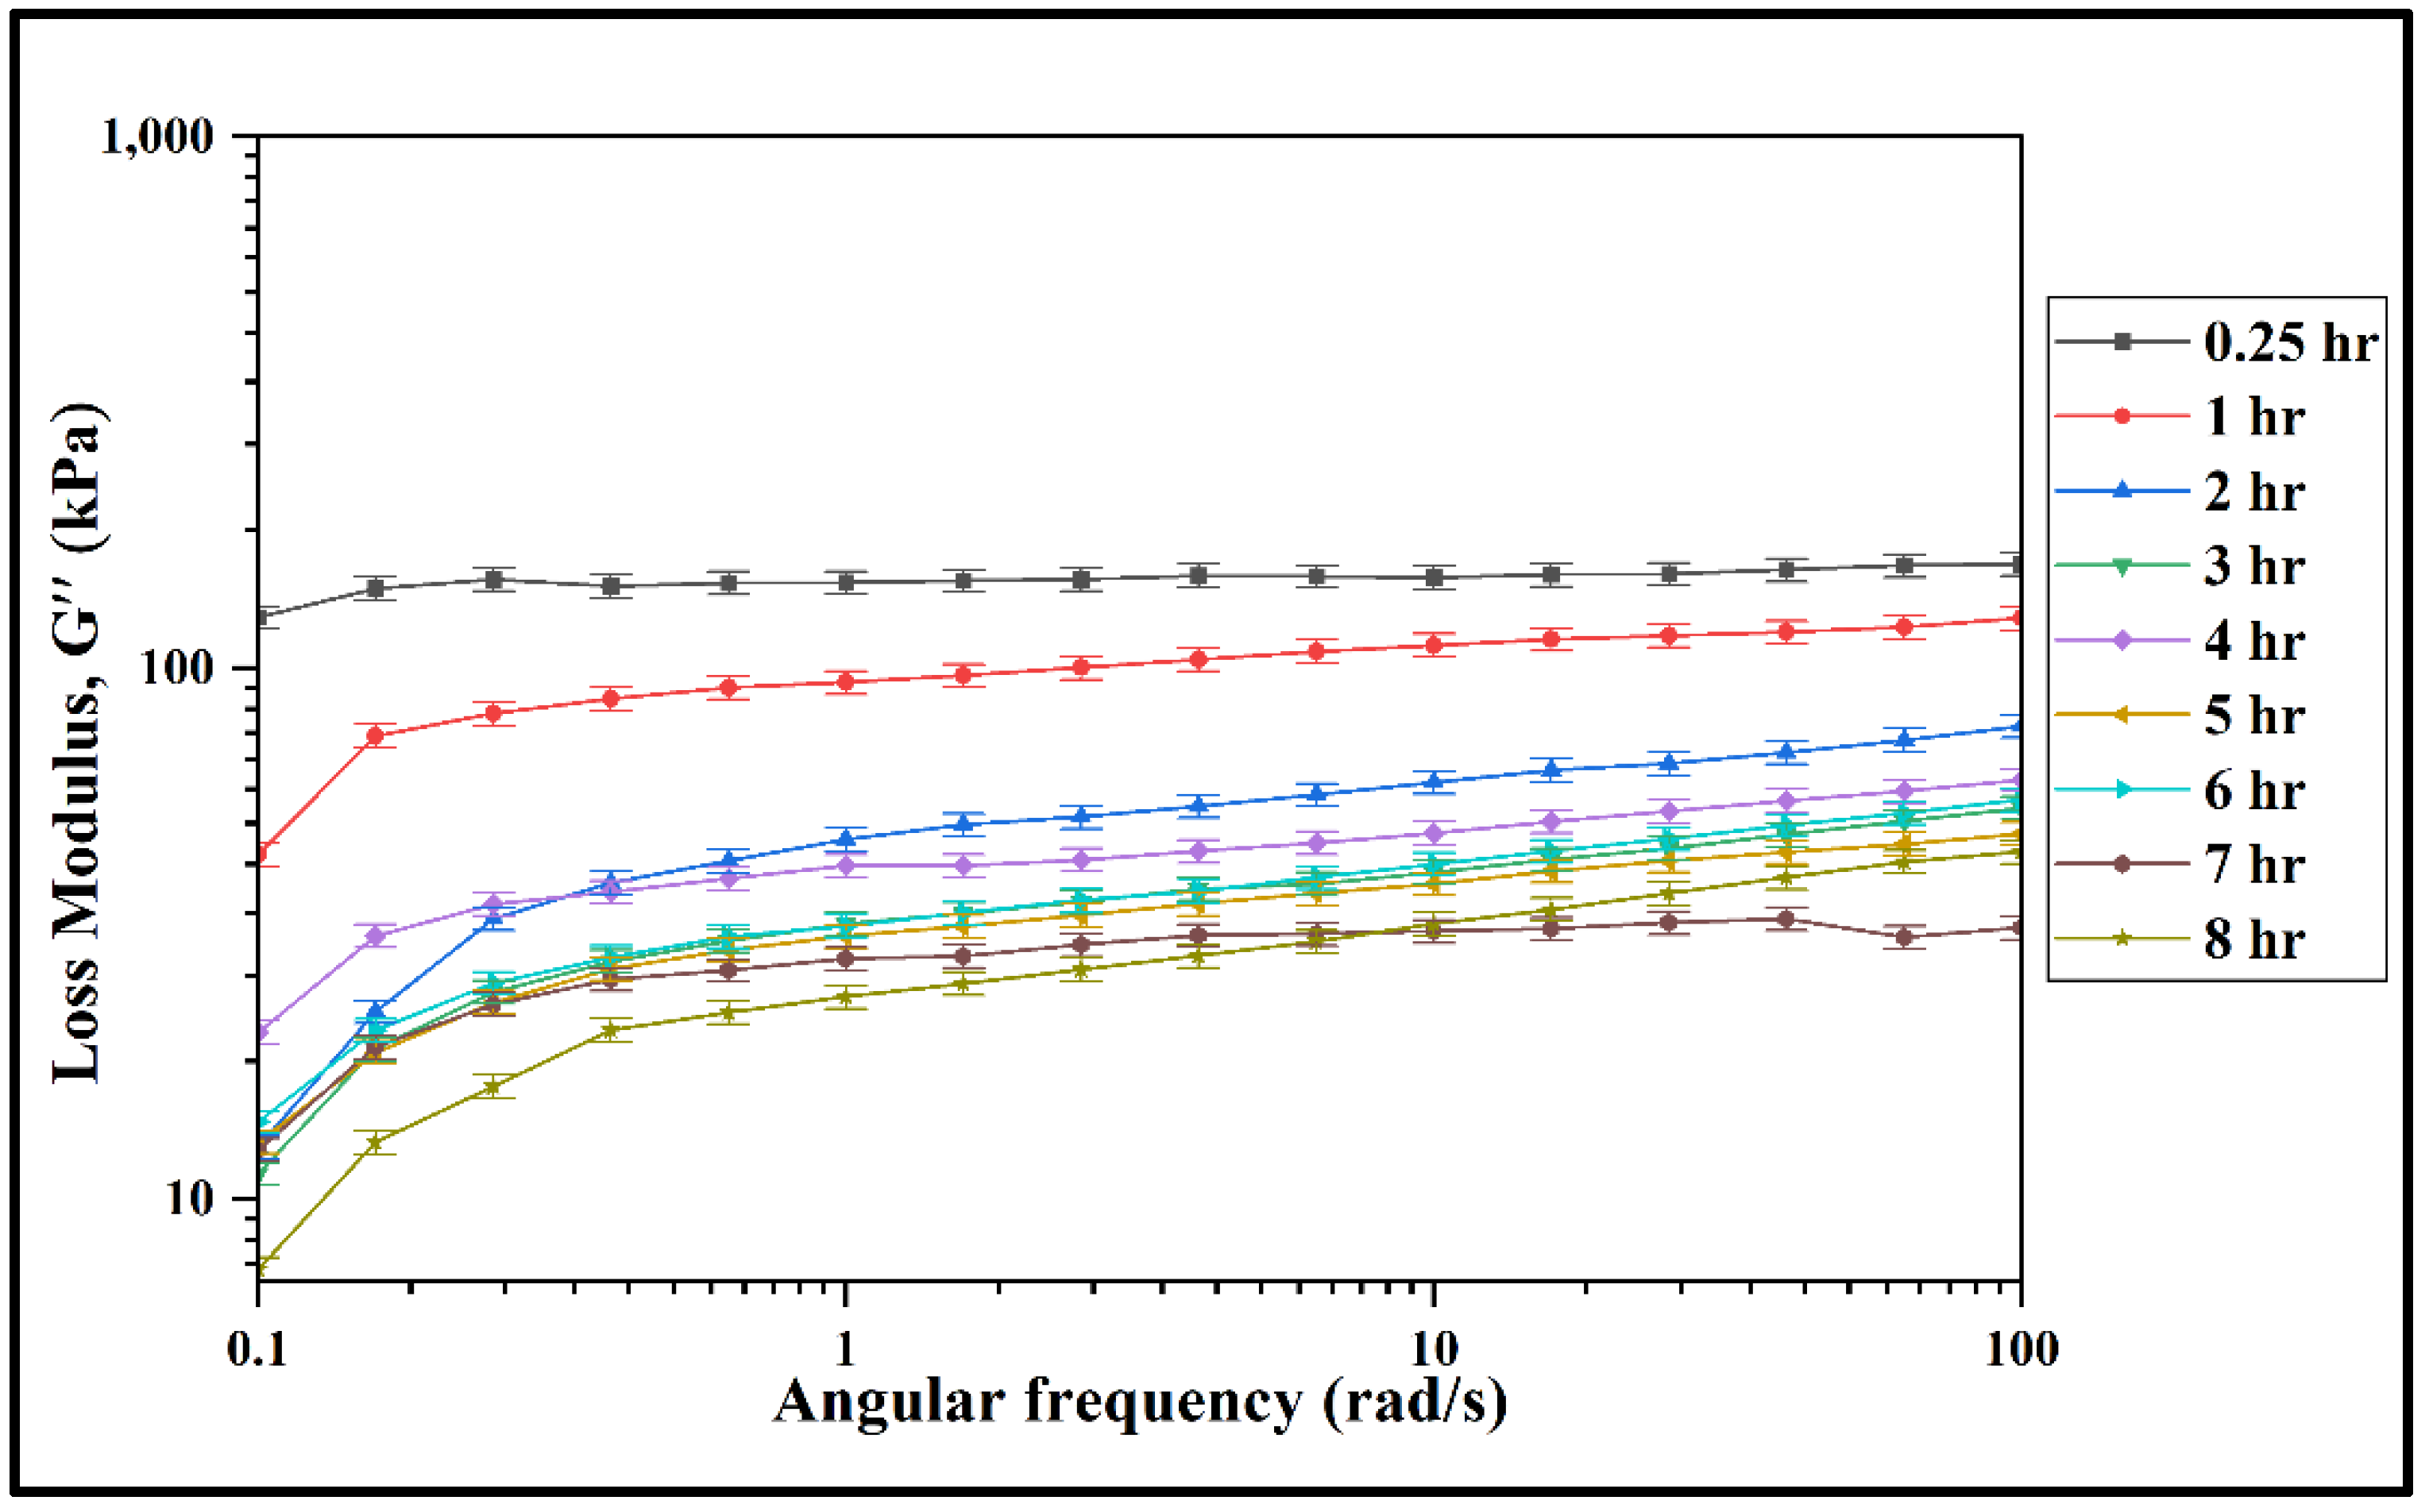
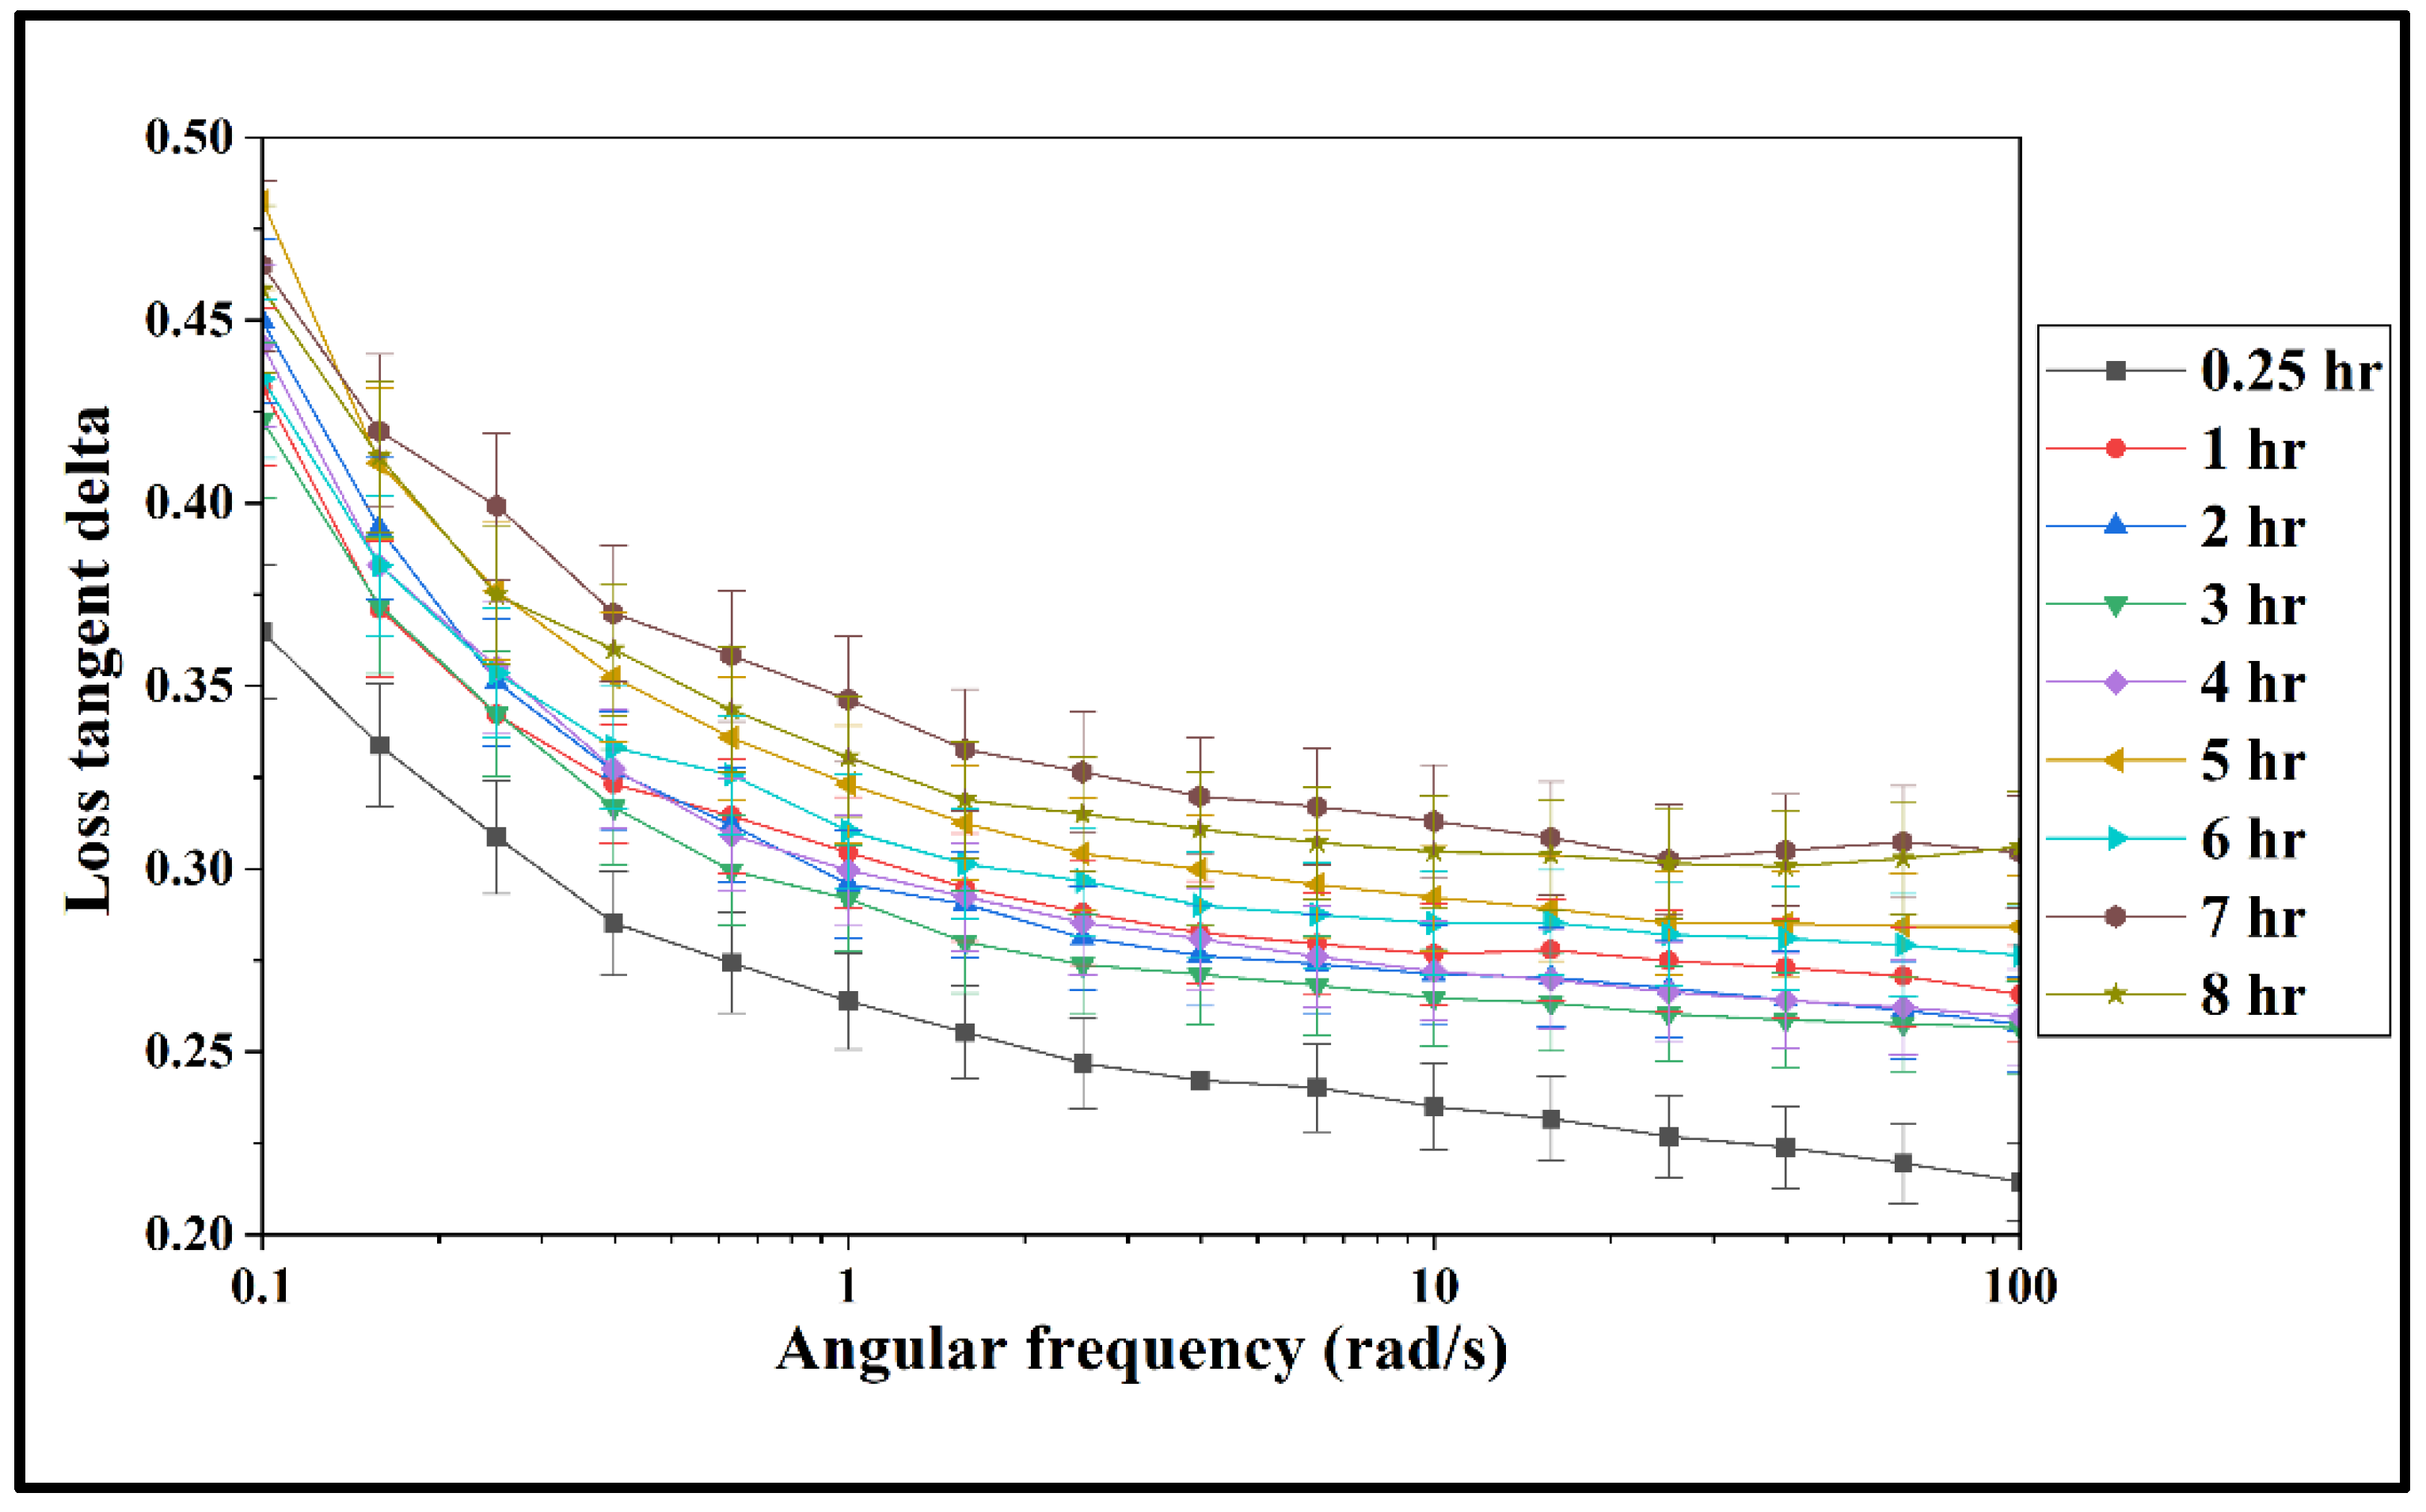
3.2. Rheological Properties of the Prepared Mixture
3.3. Minimum Printing Pressure Required for Continuous Extrusion
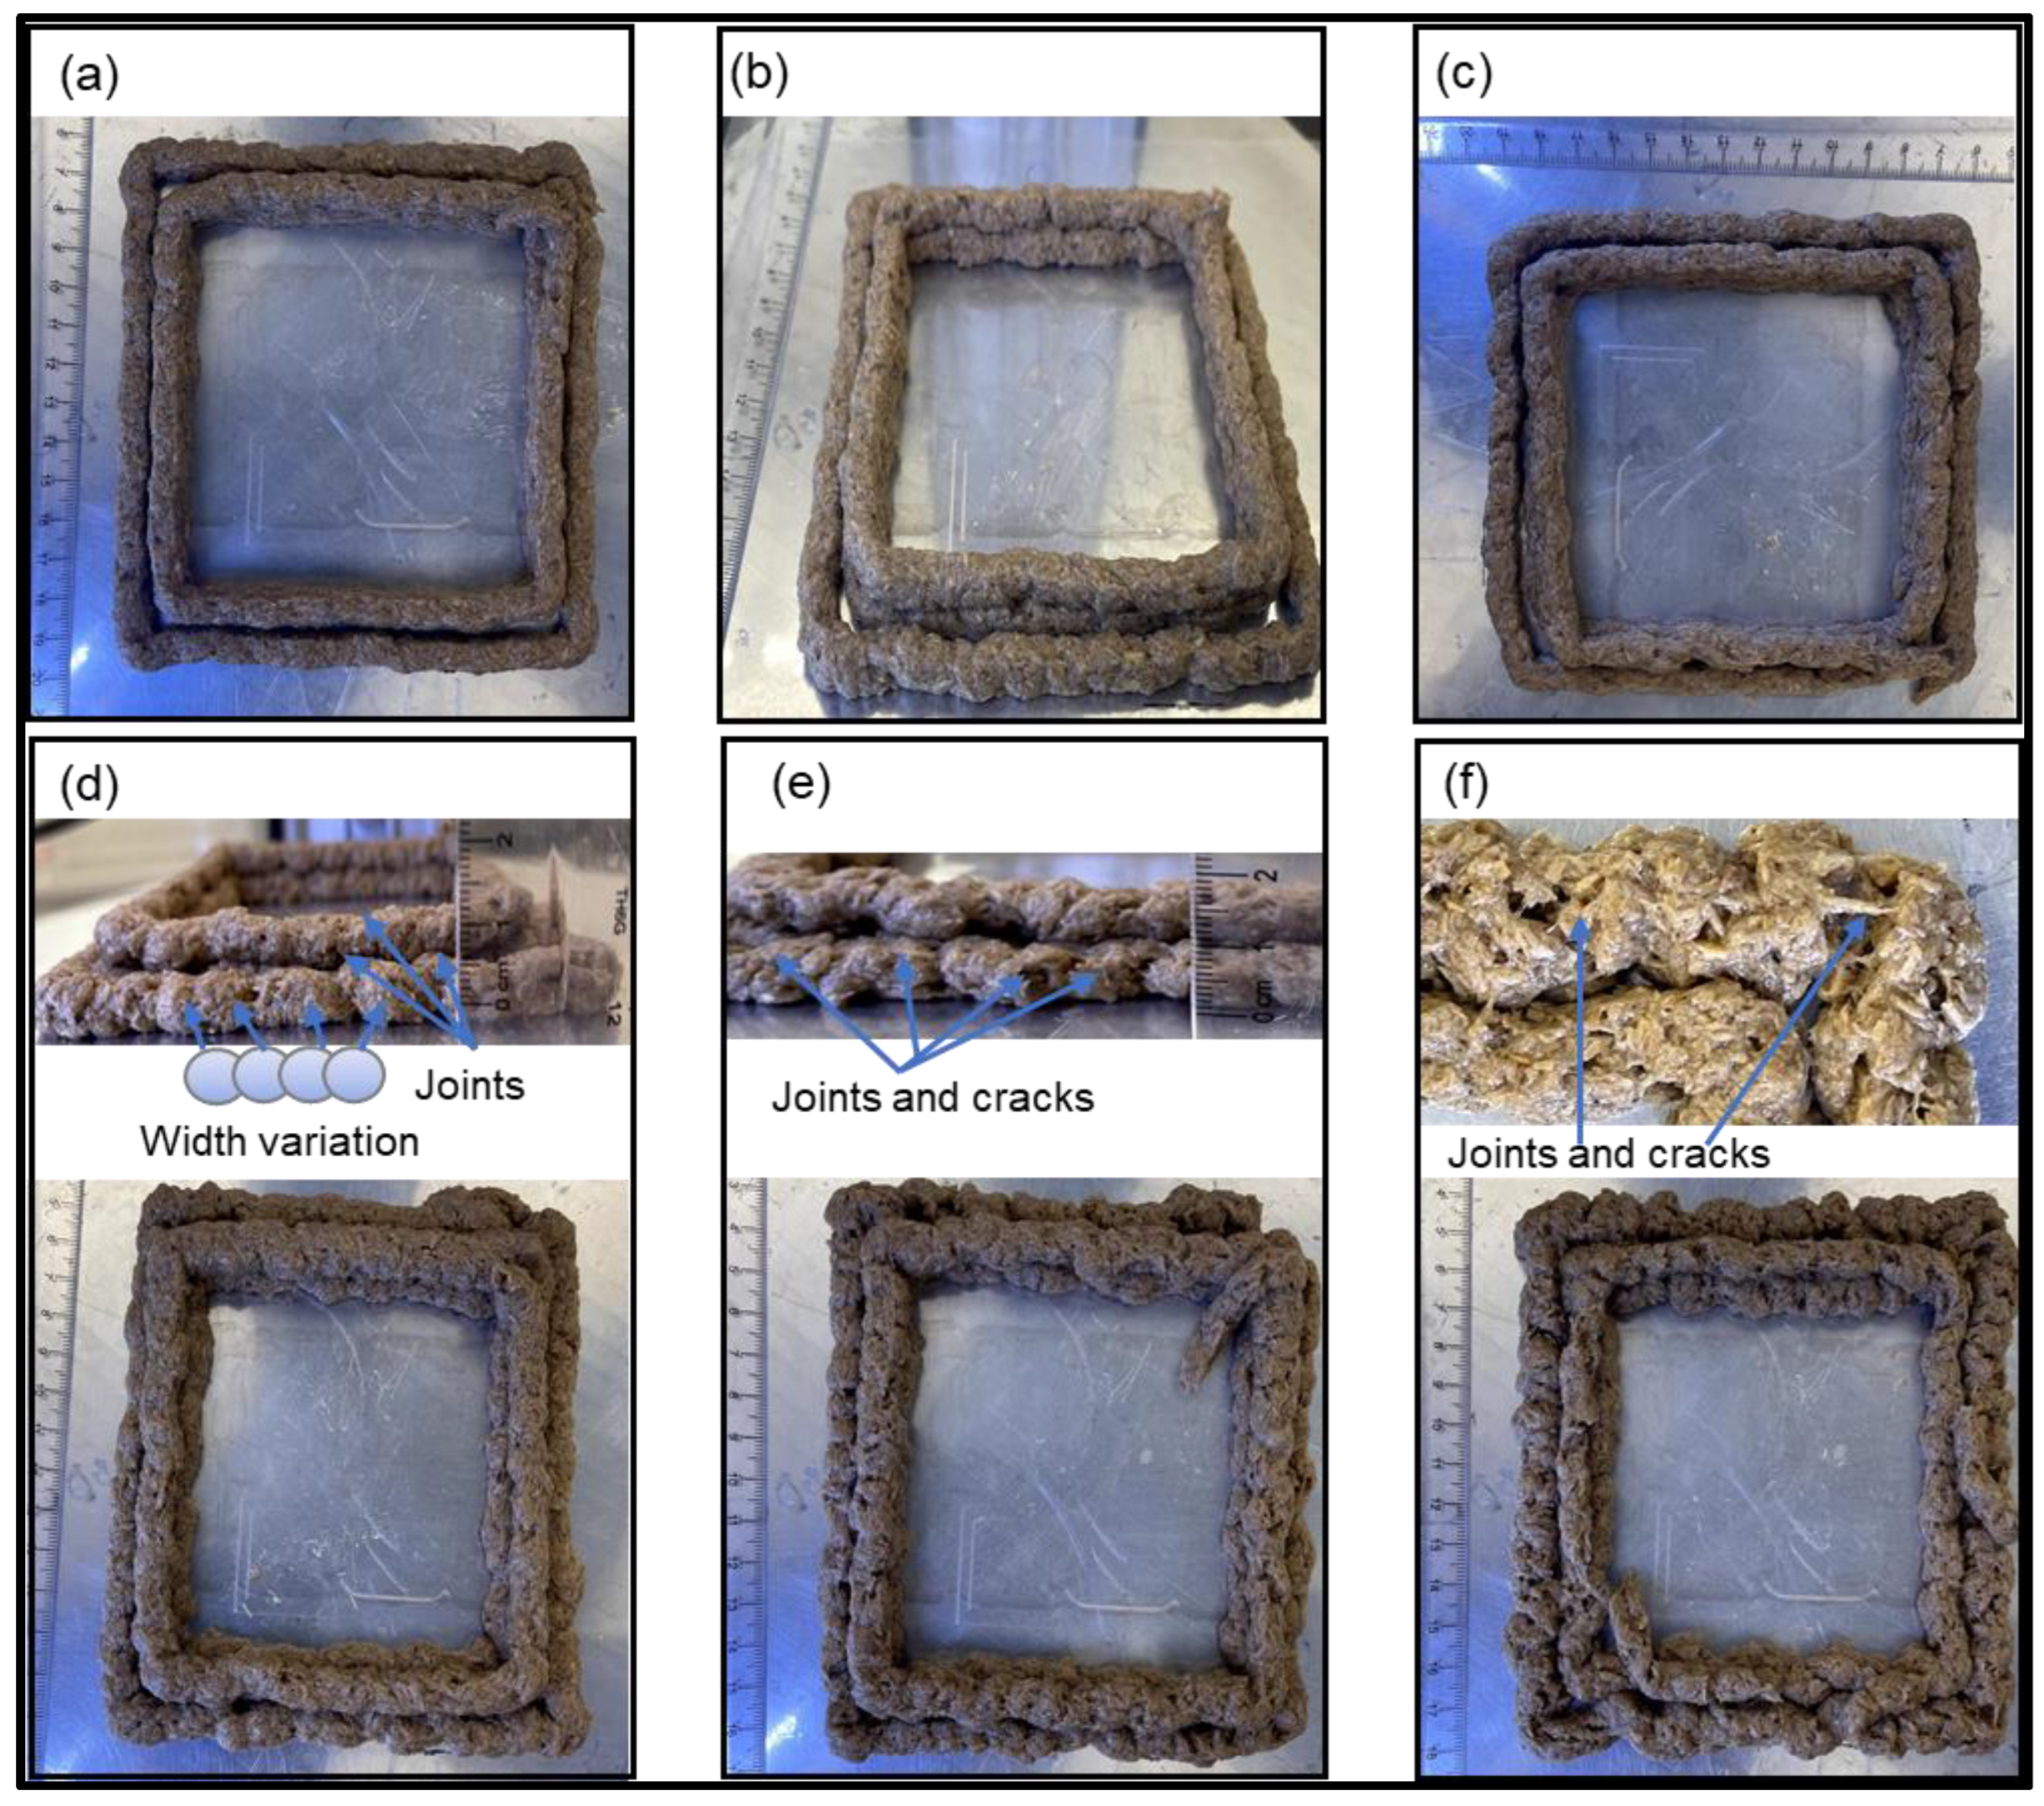
3.4. Print Quality
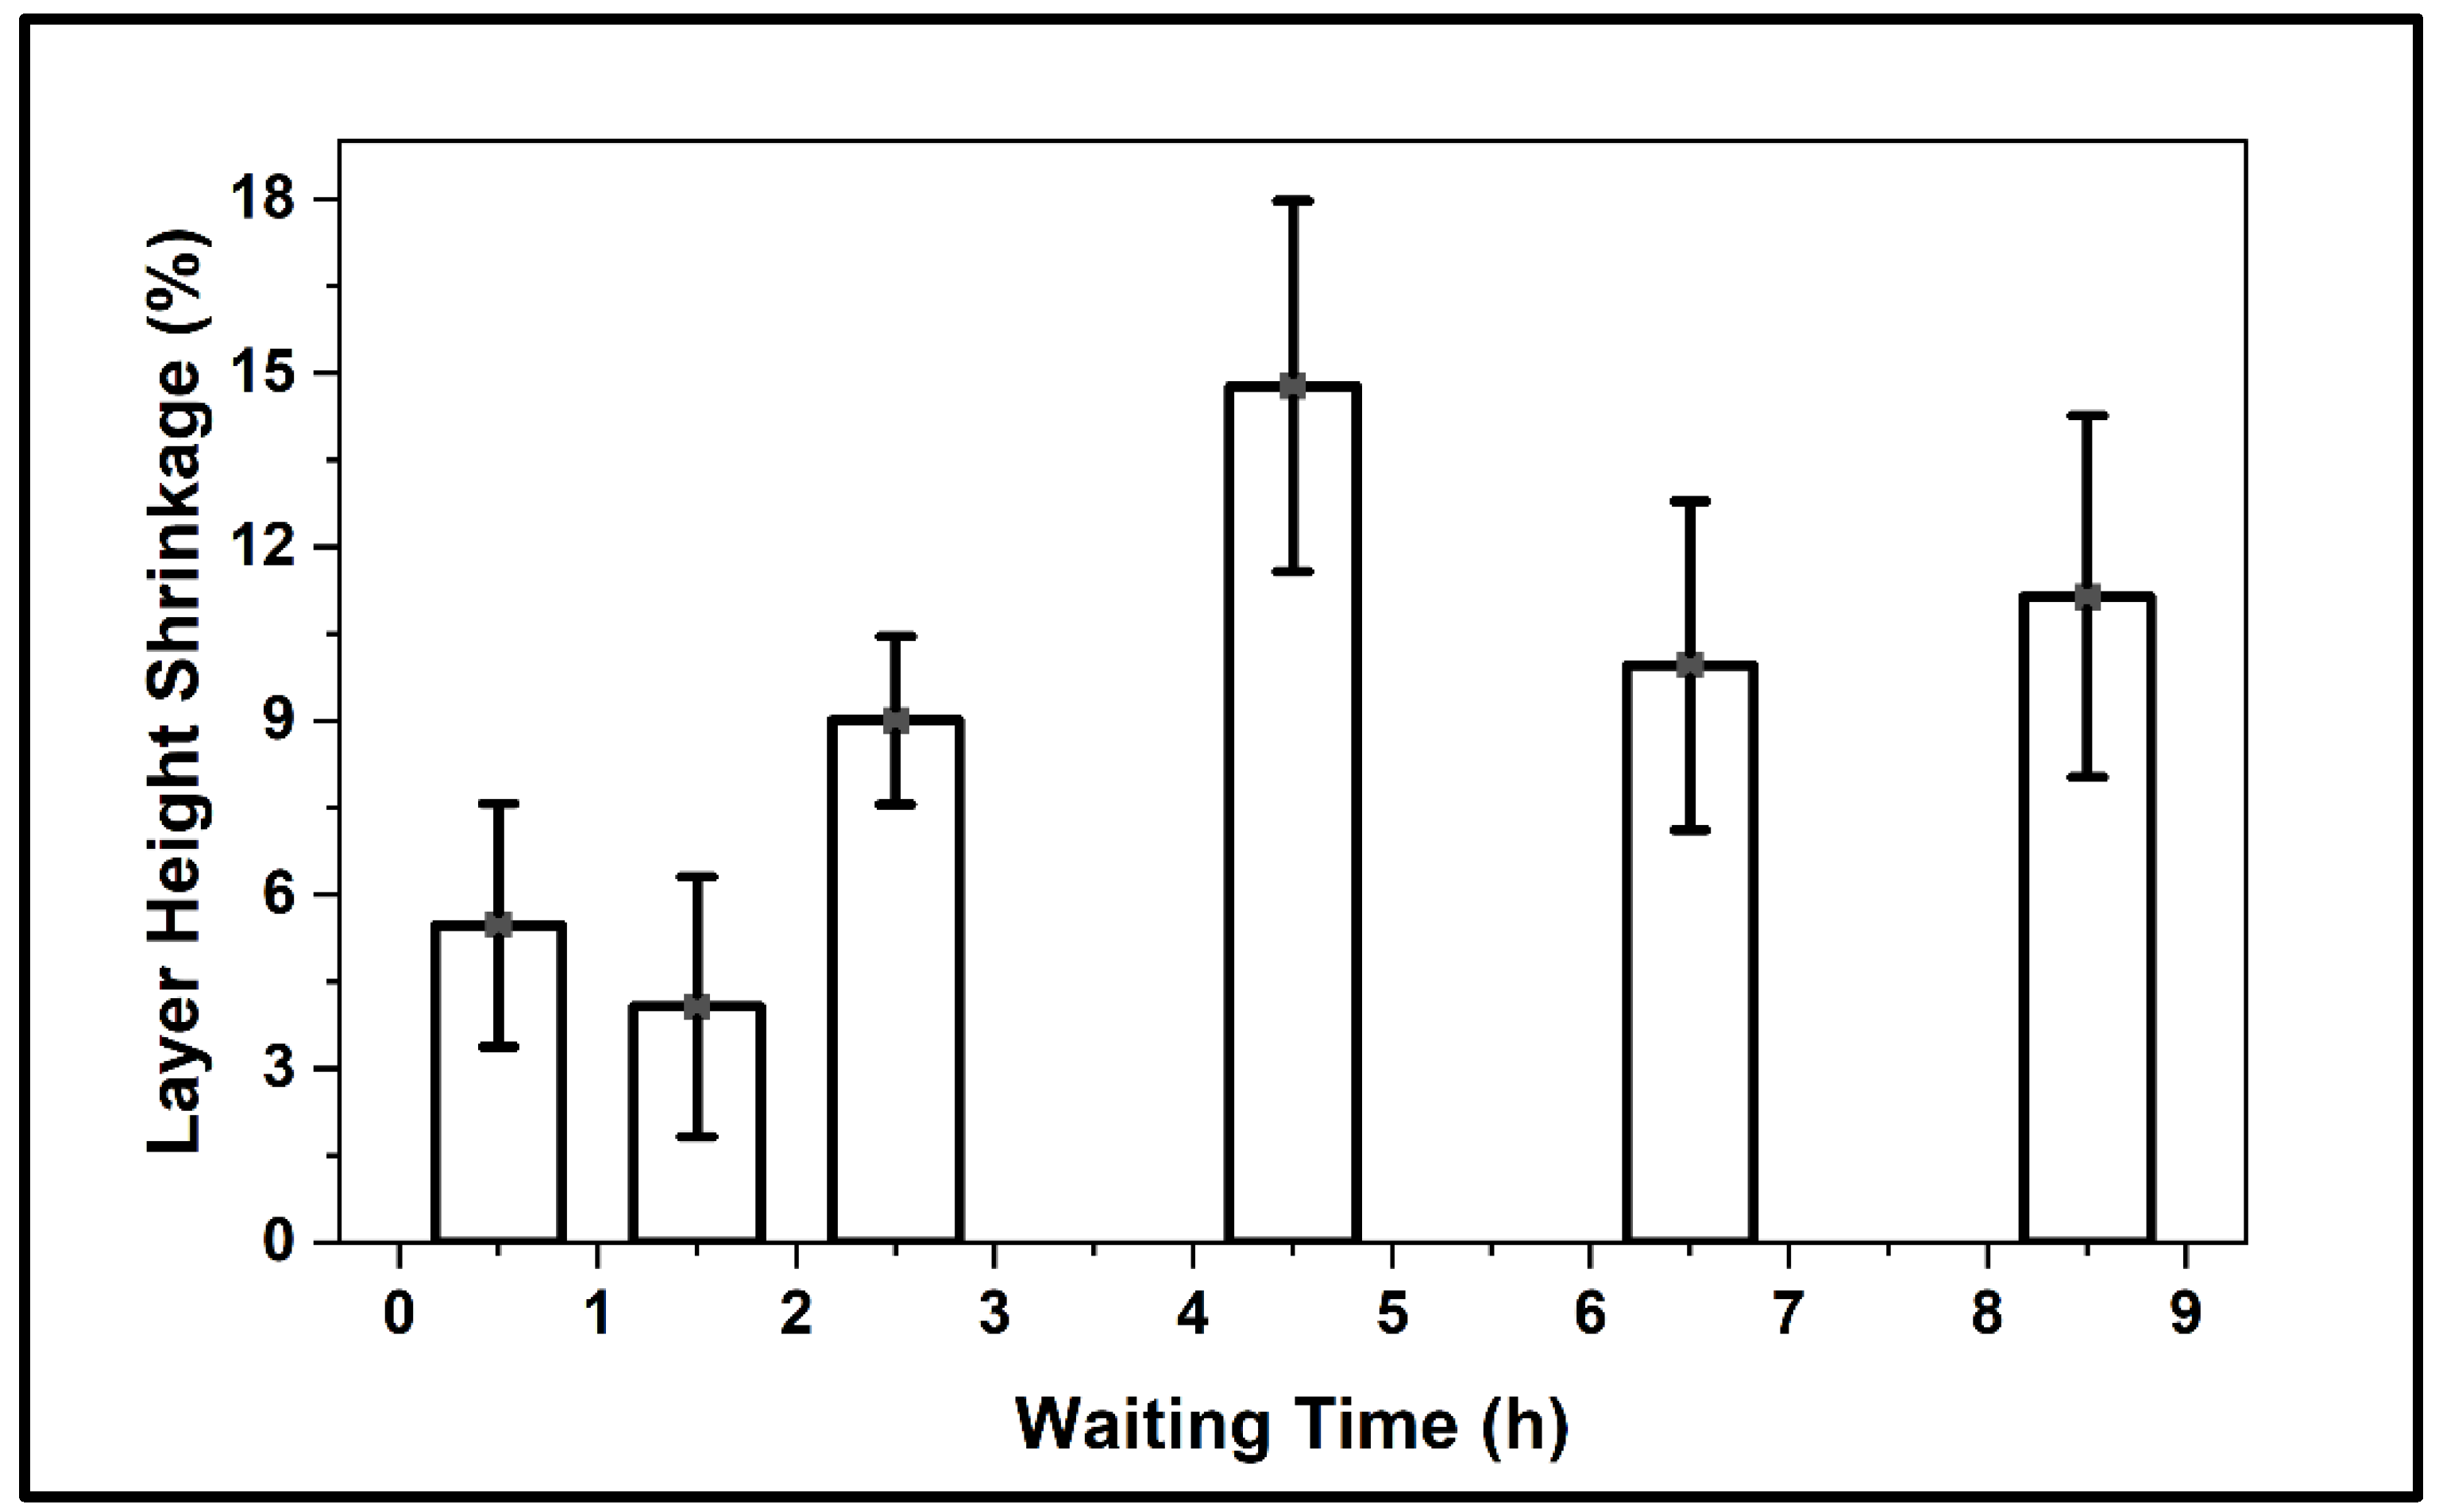
3.4.1. Layer-Height Shrinkage
3.4.2. Filament-Width Uniformity
4. Conclusions
Author Contributions
Funding
Data Availability Statement
Conflicts of Interest
References
- Zheng, J.; Suh, S. Strategies to reduce the global carbon footprint of plastics. Nat. Clim. Chang. 2019, 9, 374–378. [Google Scholar] [CrossRef]
- Leung, J. Decarbonizing US Buildings; Center for Climate and Energy Solutions: Arlington, VA, USA, 2018. [Google Scholar]
- Shen, M.; Huang, W.; Chen, M.; Song, B.; Zeng, G.; Zhang, Y. (Micro) plastic crisis: Un-ignorable contribution to global greenhouse gas emissions and climate change. J. Clean. Prod. 2020, 254, 120138. [Google Scholar] [CrossRef]
- Rabnawaz, M.; Wyman, I.; Auras, R.; Cheng, S. A roadmap towards green packaging: The current status and future outlook for polyesters in the packaging industry. Green Chem. 2017, 19, 4737–4753. [Google Scholar] [CrossRef]
- Geyer, R.; Jambeck, J.R.; Law, K.L. Production, use, and fate of all plastics ever made. Sci. Adv. 2017, 3, e1700782. [Google Scholar] [CrossRef]
- Liu, J.; Sun, L.; Xu, W.; Wang, Q.; Yu, S.; Sun, J. Current advances and future perspectives of 3D printing natural-derived biopolymers. Carbohydr. Polym. 2019, 207, 297–316. [Google Scholar] [CrossRef] [PubMed]
- Álvarez-Castillo, E.; Felix, M.; Bengoechea, C.; Guerrero, A. Proteins from agri-food industrial biowastes or co-products and their applications as green materials. Foods 2021, 10, 981. [Google Scholar] [CrossRef] [PubMed]
- Cinelli, P.; Seggiani, M.; Coltelli, M.B.; Danti, S.; Righetti, M.C.; Gigante, V.; Sandroni, M.; Signori, F.; Lazzeri, A. Overview of Agro-Food Waste and By-Products Valorization for Polymer Synthesis and Modification for Bio-Composite Production. Multidiscip. Digit. Publ. Inst. Proc. 2020, 69, 22. [Google Scholar]
- De Azeredo, H.; Rosa, M.; De Sá, M.; Souza Filho, M.; Waldron, K. The use of biomass for packaging films and coatings. In Advances in Biorefineries; Elsevier: Amsterdam, The Netherlands, 2014; pp. 819–874. [Google Scholar]
- Hasan, K.F.; Horváth, P.G.; Zsolt, K.; Alpár, T. Design and fabrication technology in biocomposite manufacturing. In Value-Added Biocomposites; CRC Press: Boca Raton, FL, USA, 2021; pp. 157–188. [Google Scholar]
- Novak, U.; Bajić, M.; Kõrge, K.; Oberlintner, A.; Murn, J.; Lokar, K.; Triler, K.V.; Likozar, B. From waste/residual marine biomass to active biopolymer-based packaging film materials for food industry applications—A review. Phys. Sci. Rev. 2020, 5, 20190099. [Google Scholar] [CrossRef]
- Picard, M.C.; Rodriguez-Uribe, A.; Thimmanagari, M.; Misra, M.; Mohanty, A.K. Sustainable biocomposites from poly (butylene succinate) and apple pomace: A study on compatibilization performance. Waste Biomass Valorization 2020, 11, 3775–3787. [Google Scholar] [CrossRef]
- Rincón, E.; Espinosa, E.; García-Domínguez, M.T.; Balu, A.; Vilaplana, F.; Serrano, L.; Jiménez-Quero, A. Bioactive pectic polysaccharides from bay tree pruning waste: Sequential subcritical water extraction and application in active food packaging. Carbohydr. Polym. 2021, 272, 118477. [Google Scholar] [CrossRef]
- Spiridon, I.; Darie-Nita, R.N.; Hitruc, G.E.; Ludwiczak, J.; Spiridon, I.A.C.; Niculaua, M. New opportunities to valorize biomass wastes into green materials. J. Clean. Prod. 2016, 133, 235–242. [Google Scholar] [CrossRef]
- Ufodike, C.O. Exploring the Wood Material Properties and Structures for Engineering Application. Ph.D. Thesis, Florida Agricultural and Mechanical University, Tallahassee, FL, USA, 2020. [Google Scholar]
- Ufodike, C.O.; Eze, V.O.; Ahmed, M.F.; Oluwalowo, A.; Park, J.G.; Liang, Z.; Wang, H. Investigation of Molecular and Supramolecular Assemblies of Cellulose and Lignin of Lignocellulosic Materials by Spectroscopy and Thermal Analysis. Int. J. Biol. Macromol. 2019, 146, 916–921. [Google Scholar] [CrossRef]
- Ufodike, C.O.; Eze, V.O.; Ahmed, M.F.; Oluwalowo, A.; Park, J.G.; Okoli, O.I.; Wang, H. Evaluation of the inter-particle interference of cellulose and lignin in lignocellulosic materials. Int. J. Biol. Macromol. 2020, 147, 762–767. [Google Scholar] [CrossRef] [PubMed]
- Żelaziński, T. Properties of biocomposites from rapeseed meal, fruit pomace and microcrystalline cellulose made by press pressing: Mechanical and physicochemical characteristics. Materials 2021, 14, 890. [Google Scholar] [CrossRef]
- Ji, A.; Zhang, S.; Bhagia, S.; Yoo, C.G.; Ragauskas, A.J. 3D printing of biomass-derived composites: Application and characterization approaches. RSC Adv. 2020, 10, 21698–21723. [Google Scholar] [CrossRef] [PubMed]
- Pérez, J.; Munoz-Dorado, J.; De la Rubia, T.; Martinez, J. Biodegradation and biological treatments of cellulose, hemicellulose and lignin: An overview. Int. Microbiol. 2002, 5, 53–63. [Google Scholar] [CrossRef] [PubMed]
- Yoo, C.G.; Meng, X.; Pu, Y.; Ragauskas, A.J. The critical role of lignin in lignocellulosic biomass conversion and recent pretreatment strategies: A comprehensive review. Bioresour. Technol. 2020, 301, 122784. [Google Scholar] [CrossRef]
- Bhardwaj, A.; Rahman, A.M.; Wei, X.; Pei, Z.; Truong, D.; Lucht, M.; Zou, N. 3D Printing of Biomass–Fungi Composite Material: Effects of Mixture Composition on Print Quality. J. Manuf. Mater. Process. 2021, 5, 112. [Google Scholar] [CrossRef]
- Appels, F.V.; Camere, S.; Montalti, M.; Karana, E.; Jansen, K.M.; Dijksterhuis, J.; Krijgsheld, P.; Wösten, H.A. Fabrication factors influencing mechanical, moisture-and water-related properties of mycelium-based composites. Mater. Des. 2019, 161, 64–71. [Google Scholar] [CrossRef]
- Bhardwaj, A.; Vasselli, J.; Lucht, M.; Pei, Z.; Shaw, B.; Grasley, Z.; Wei, X.; Zou, N. 3D Printing of Biomass-Fungi Composite Material: A Preliminary Study. Manuf. Lett. 2020, 24, 96–99. [Google Scholar] [CrossRef]
- Elsacker, E.; Vandelook, S.; Van Wylick, A.; Ruytinx, J.; De Laet, L.; Peeters, E. A comprehensive framework for the production of mycelium-based lignocellulosic composites. Sci. Total Environ. 2020, 725, 138431. [Google Scholar] [CrossRef] [PubMed]
- Elsacker, E.V. Mycelium Matters: An Interdisciplinary Exploration of the Fabrication and Properties of Mycelium-Based Materials. Ph.D. Thesis, Vrije Universiteit Brussel, Brussel, Belgium, 2021. [Google Scholar]
- Soh, E.; Chew, Z.Y.; Saeidi, N.; Javadian, A.; Hebel, D.; Le Ferrand, H. Development of an extrudable paste to build mycelium-bound composites. Mater. Des. 2020, 195, 109058. [Google Scholar] [CrossRef]
- Capezza Villa, A.J.; Robert, E.; Lundman, M.; Newson, W.R.; Johansson, E.; Hedenqvist, M.S.; Olsson, R.T. Extrusion of Porous Protein-Based Polymers and Their Liquid Absorption Characteristics. Polymers 2020, 12, 459. [Google Scholar] [CrossRef] [PubMed]
- Ghazvinian, A.; Gursoy, B. Basics of Building with Mycelium-Based Bio-Composites: A Review of Built Projects and Related Material Research. J. Green Build. 2022, 17, 37–69. [Google Scholar] [CrossRef]
- Ghazvinian, A.; Gürsoy, B. Mycelium-Based Composite Graded Materials: Assessing the Effects of Time and Substrate Mixture on Mechanical Properties. Biomimetics 2022, 7, 48. [Google Scholar] [CrossRef] [PubMed]
- Jones, M.; Mautner, A.; Luenco, S.; Bismarck, A.; John, S. Engineered mycelium composite construction materials from fungal biorefineries: A critical review. Mater. Des. 2020, 187, 108397. [Google Scholar] [CrossRef]
- Ekielski, A.; Żelaziński, T.; Mishra, P.K.; Skudlarski, J. Properties of Biocomposites Produced with Thermoplastic Starch and Digestate: Physicochemical and Mechanical Characteristics. Materials 2021, 14, 6092. [Google Scholar] [CrossRef]
- Haneef, M.; Ceseracciu, L.; Canale, C.; Bayer, I.S.; Heredia-Guerrero, J.A.; Athanassiou, A. Advanced materials from fungal mycelium: Fabrication and tuning of physical properties. Sci. Rep. 2017, 7, srep41292. [Google Scholar] [CrossRef]
- Appels, F.V.; Dijksterhuis, J.; Lukasiewicz, C.E.; Jansen, K.M.; Wösten, H.A.; Krijgsheld, P. Hydrophobin gene deletion and environmental growth conditions impact mechanical properties of mycelium by affecting the density of the material. Sci. Rep. 2018, 8, 4703. [Google Scholar] [CrossRef]
- Sun, W.; Tajvidi, M.; Hunt, C.G.; Cole, B.J.; Howel, C.; Gardner, D.J.; Wang, J. Fungal and enzymatic pretreatments in hot-pressed lignocellulosic bio-composites: A critical review. J. Clean. Prod. 2022, 353, 131659. [Google Scholar] [CrossRef]
- Attias, N.; Danai, O.; Abitbol, T.; Tarazi, E.; Ezov, N.; Pereman, I.; Grobman, Y.J. Mycelium bio-composites in industrial design and architecture: Comparative review and experimental analysis. J. Clean. Prod. 2020, 246, 119037. [Google Scholar] [CrossRef]
- Elsacker, E.; Peeters, E.; De Laet, L. Large-scale robotic extrusion-based additive manufacturing with living mycelium materials. Sustain. Futures 2022, 4, 100085. [Google Scholar] [CrossRef]
- Modanloo, B.; Ghazvinian, A.; Matini, M.; Andaroodi, E. Tilted Arch; Implementation of Additive Manufacturing and Bio-Welding of Mycelium-Based Composites. Biomimetics 2021, 6, 68. [Google Scholar] [CrossRef] [PubMed]
- Sydor, M.; Bonenberg, A.; Doczekalska, B.; Cofta, G. Mycelium-based composites in art, architecture, and interior design: A review. Polymers 2021, 14, 145. [Google Scholar] [CrossRef] [PubMed]
- Zheng, J.; Rehmann, L. Extrusion pretreatment of lignocellulosic biomass: A review. Int. J. Mol. Sci. 2014, 15, 18967–18984. [Google Scholar] [CrossRef] [PubMed]
- Jungst, T.; Smolan, W.; Schacht, K.; Scheibel, T.; Groll, J. Strategies and molecular design criteria for 3D printable hydrogels. Chem. Rev. 2016, 116, 1496–1539. [Google Scholar] [CrossRef] [PubMed]
- Lewis, J.A. Direct ink writing of 3D functional materials. Adv. Funct. Mater. 2006, 16, 2193–2204. [Google Scholar] [CrossRef]
- Maniglia, B.C.; Lima, D.C.; Junior, M.D.M.; Le-Bail, P.; Le-Bail, A.; Augusto, P.E. Hydrogels based on ozonated cassava starch: Effect of ozone processing and gelatinization conditions on enhancing 3D-printing applications. Int. J. Biol. Macromol. 2019, 138, 1087–1097. [Google Scholar] [CrossRef]
- Breene, W.M. Application of texture profile analysis to instrumental food texture evaluation. J. Texture Stud. 1975, 6, 53–82. [Google Scholar] [CrossRef]
- Friedman, H.H.; Whitney, J.E.; Szczesniak, A.S. The texturometer—A new instrument for objective texture measurement. J. Food Sci. 1963, 28, 390–396. [Google Scholar] [CrossRef]
- Henry, W.F.; Katz, M.H.; Pilgrim, F.J.; May, A.T. Texture of semi-solid foods: Sensory and physical correlates. J. Food Sci. 1971, 36, 155–161. [Google Scholar] [CrossRef]
- Szczesniak, A.S. Textural characterization of temperature sensitive foods. J. Texture Stud. 1975, 6, 139–156. [Google Scholar] [CrossRef]
- Jones, D.S.; Woolfson, A.D.; Brown, A.F. Textural, viscoelastic and mucoadhesive properties of pharmaceutical gels composed of cellulose polymers. Int. J. Pharm. 1997, 151, 223–233. [Google Scholar] [CrossRef]
- Jones, D.S.; Woolfson, A.D.; Djokic, J. Texture profile analysis of bioadhesive polymeric semisolids: Mechanical characterization and investigation of interactions between formulation components. J. Appl. Polym. Sci. 1996, 61, 2229–2234. [Google Scholar] [CrossRef]
- Cui, T.; Wu, Y.; Ni, C.; Sun, Y.; Cheng, J. Rheology and texture analysis of gelatin/dialdehyde starch hydrogel carriers for curcumin controlled release. Carbohydr. Polym. 2022, 283, 119154. [Google Scholar] [CrossRef] [PubMed]
- Huang, M.; Kennedy, J.; Li, B.; Xu, X.; Xie, B. Characters of rice starch gel modified by gellan, carrageenan, and glucomannan: A texture profile analysis study. Carbohydr. Polym. 2007, 69, 411–418. [Google Scholar] [CrossRef]
- Mahajan, P.; Bera, M.B.; Panesar, P.S. Modification of Kutki millet (Panicum sumatrense) starch properties by the addition of amino acids for the preparation of hydrogels and its characterization. Int. J. Biol. Macromol. 2021, 191, 9–18. [Google Scholar] [CrossRef] [PubMed]
- Fischer, M.H.; Yu, N.; Gray, G.R.; Ralph, J.; Anderson, L.; Marlett, J.A. The gel-forming polysaccharide of psyllium husk (Plantago ovata Forsk). Carbohydr. Res. 2004, 339, 2009–2017. [Google Scholar] [CrossRef]
- Chen, H.; Xie, F.; Chen, L.; Zheng, B. Effect of rheological properties of potato, rice and corn starches on their hot-extrusion 3D printing behaviors. J. Food Eng. 2019, 244, 150–158. [Google Scholar] [CrossRef]
- Studart, A.R. Additive manufacturing of biologically-inspired materials. Chem. Soc. Rev. 2016, 45, 359–376. [Google Scholar] [CrossRef] [PubMed]
- Huan, S.; Mattos, B.D.; Ajdary, R.; Xiang, W.; Bai, L.; Rojas, O.J. Two-phase emulgels for direct ink writing of skin-bearing architectures. Adv. Funct. Mater. 2019, 29, 1902990. [Google Scholar] [CrossRef]
- Agarwal, P.S.; Poddar, S.; Varshney, N.; Sahi, A.K.; Vajanthri, K.Y.; Yadav, K.; Parmar, A.S.; Mahto, S.K. Printability assessment of psyllium husk (isabgol)/gelatin blends using rheological and mechanical properties. J. Biomater. Appl. 2021, 35, 1132–1142. [Google Scholar] [CrossRef] [PubMed]
- Siacor, F.D.C.; Chen, Q.; Zhao, J.Y.; Han, L.; Valino, A.D.; Taboada, E.B.; Caldona, E.B.; Advincula, R.C. On the additive manufacturing (3D printing) of viscoelastic materials and flow behavior: From composites to food manufacturing. Addit. Manuf. 2021, 45, 102043. [Google Scholar] [CrossRef]
- Zhang, M.; Vora, A.; Han, W.; Wojtecki, R.J.; Maune, H.; Le, A.B.; Thompson, L.E.; McClelland, G.M.; Ribet, F.; Engler, A.C. Dual-responsive hydrogels for direct-write 3D printing. Macromolecules 2015, 48, 6482–6488. [Google Scholar] [CrossRef]
- Farahnaky, A.; Askari, H.; Majzoobi, M.; Mesbahi, G. The impact of concentration, temperature and pH on dynamic rheology of psyllium gels. J. Food Eng. 2010, 100, 294–301. [Google Scholar] [CrossRef]
- Guo, Q.; Cui, S.W.; Wang, Q.; Goff, H.D.; Smith, A. Microstructure and rheological properties of psyllium polysaccharide gel. Food Hydrocoll. 2009, 23, 1542–1547. [Google Scholar] [CrossRef]
- Le Tohic, C.; O’Sullivan, J.J.; Drapala, K.P.; Chartrin, V.; Chan, T.; Morrison, A.P.; Kerry, J.P.; Kelly, A.L. Effect of 3D printing on the structure and textural properties of processed cheese. J. Food Eng. 2018, 220, 56–64. [Google Scholar] [CrossRef]


| Material | Amount |
|---|---|
| Biomass–fungi-mix material | 50 g ± 0.02 g |
| Wheat flour | 20 g ± 0.02 g |
| Water | 200 mL ± 0.02 mL |
| Psyllium husk powder | 10 g ± 0.02 g |
| Waiting Time (h) | Hardness (N) | Compressibility (N.mm) |
|---|---|---|
| 0.25 | 3.53 ± 0.58 | 6.70 ± 0.82 |
| 0.5 | 3.83 ± 0.41 | 6.90 ± 0.78 |
| 1 | 4.98 ± 1.05 | 9.05 ± 1.51 |
| 2 | 5.55 ± 0.32 | 9.64 ± 0.50 |
| 3 | 6.00 ± 0.81 | 10.89 ± 1.37 |
| 4 | 5.09 ± 0.63 | 9.15 ± 0.93 |
| 5 | 5.53 ± 0.34 | 10.24 ± 0.4 |
| 6.5 | 5.75 ± 0.86 | 10.25 ± 1.55 |
| 8 | 5.42 ± 0.63 | 9.82 ± 0.83 |
| Waiting Time (h) | Pressure (kPa) | |||||||
|---|---|---|---|---|---|---|---|---|
| 100 | 150 | 200 | 250 | 300 | 320 | 360 | 400 | |
| 0.25 | 0 | 1 | 1 | 1 | 1 | 1 | 1 | 1 |
| 0.5 | 0 | 0 | 1 | 1 | 1 | 1 | 1 | 1 |
| 0.75 | 0 | 0 | 0 | 1 | 1 | 1 | 1 | 1 |
| 1 | 0 | 0 | 0 | 0 | 1 | 1 | 1 | 1 |
| 1.5 | 0 | 0 | 0 | 0 | 1 | 1 | 1 | 1 |
| 2 | 0 | 0 | 0 | 0 | 1 | 1 | 1 | 1 |
| 2.5 | 0 | 0 | 0 | 0 | 1 | 1 | 1 | 1 |
| 3 | 0 | 0 | 0 | 0 | 0 | 1 | 1 | 1 |
| 3.5 | 0 | 0 | 0 | 0 | 0 | 0 | 1 | 1 |
| 4 | 0 | 0 | 0 | 0 | 0 | 0 | 1 | 1 |
| 4.5 | 0 | 0 | 0 | 0 | 0 | 0 | 1 | 1 |
| 5 | 0 | 0 | 0 | 0 | 0 | 0 | 1 | 1 |
| 5.5 | 0 | 0 | 0 | 0 | 0 | 0 | 1 | 1 |
| 6.5 | 0 | 0 | 0 | 0 | 0 | 0 | 1 | 1 |
| 7.5 | 0 | 0 | 0 | 0 | 0 | 0 | 1 | 1 |
| 9 | 0 | 0 | 0 | 0 | 0 | 0 | 1 | 1 |
Publisher’s Note: MDPI stays neutral with regard to jurisdictional claims in published maps and institutional affiliations. |
© 2022 by the authors. Licensee MDPI, Basel, Switzerland. This article is an open access article distributed under the terms and conditions of the Creative Commons Attribution (CC BY) license (https://creativecommons.org/licenses/by/4.0/).
Share and Cite
Rahman, A.M.; Bhardwaj, A.; Pei, Z.; Ufodike, C.; Castell-Perez, E. The 3D Printing of Biomass–Fungi Composites: Effects of Waiting Time after Mixture Preparation on Mechanical Properties, Rheological Properties, Minimum Extrusion Pressure, and Print Quality of the Prepared Mixture. J. Compos. Sci. 2022, 6, 237. https://doi.org/10.3390/jcs6080237
Rahman AM, Bhardwaj A, Pei Z, Ufodike C, Castell-Perez E. The 3D Printing of Biomass–Fungi Composites: Effects of Waiting Time after Mixture Preparation on Mechanical Properties, Rheological Properties, Minimum Extrusion Pressure, and Print Quality of the Prepared Mixture. Journal of Composites Science. 2022; 6(8):237. https://doi.org/10.3390/jcs6080237
Chicago/Turabian StyleRahman, Al Mazedur, Abhinav Bhardwaj, Zhijian Pei, Chukwuzubelu Ufodike, and Elena Castell-Perez. 2022. "The 3D Printing of Biomass–Fungi Composites: Effects of Waiting Time after Mixture Preparation on Mechanical Properties, Rheological Properties, Minimum Extrusion Pressure, and Print Quality of the Prepared Mixture" Journal of Composites Science 6, no. 8: 237. https://doi.org/10.3390/jcs6080237