
Prediction of Damage in Non-Crimp Fabric Composites Subjected to Transverse Crushing: A Comparison of Two Constitutive Models


Department of Mechanical, Automotive and Materials Engineering, University of Windsor, 401 Sunset Ave., Windsor, ON N9B 3P4, Canada
*
Author to whom correspondence should be addressed.
J. Compos. Sci. 2022, 6(8), 224; https://doi.org/10.3390/jcs6080224
Submission received: 12 July 2022
/
Revised: 22 July 2022
/
Accepted: 2 August 2022
/
Published: 4 August 2022
(This article belongs to the Special Issue Characterization and Modelling of Composites, Volume III)
Abstract
:Non-crimp fabrics (NCFs) are increasingly used in industry for manufacturing of composite structures due to a combination of high mechanical properties and excellent manufacturability. As with other composites, in-service damage can be a cause for severe reduction in load-carrying capacity of NCF-reinforced plastics. In this experimental and numerical study, two constitutive material models previously used only for damage prediction in unidirectional (UD) tape and woven fabric-reinforced materials (LS-DYNA’s *MAT_ENHANCED_COMPOSITE_DAMAGE—MAT54 and *MAT_LAMINATED_COMPOSITE_FABRIC—MAT58) were evaluated for simulating transverse crushing of composite parts processed from a non-crimp carbon fabric. For this purpose, UD NCF components of tubular shape were subjected to transverse crushing through a controlled indentation of a metallic cylinder, and results of the experiment were compared with numerical modeling. Considered verification metrics included the observed and the predicted patterns of interlaminar damage, the extent of delamination, as well as the ability of the models to replicate force-displacement response exhibited by the tested specimens.
1. Introduction
Non-crimp fabrics are increasingly used in industry for manufacturing of composite structures due to a combination of high mechanical properties and excellent manufacturability. Typical applications of non-crimp fabrics include load-bearing aerospace structures [1], automotive components [2], and wind energy applications [3].
NCFs consist of multiple straight and parallel yarn bands joined by polyester stitching (binder), as exemplified in Figure 1, for a unidirectional non-crimp carbon fiber fabric. On the mesoscale, such a structure usually produces distinct fiber bundles separated by resin-rich regions (unlike homogeneously distributed fibers in conventional UD tape composites). On the macrolevel, presence of the binder enhances manufacturability as compared to UD tape-based composites, while significantly lower crimp, as compared to woven fabric-based materials, has a positive effect on the mechanical properties of NCFs.
However, similarly to conventional unidirectional tape- and woven fabric-based materials (see, e.g., [4,5,6,7,8,9,10,11,12,13,14,15,16,17,18,19]), in-service damage, such as tool dropping or unintended collision, can be a cause for severe reduction in load-carrying capacity of NCF composites [20,21,22,23,24,25]. For example, Bibo et al. [24] demonstrated that resistance to propagation of damage and the compression after impact strength of NCF panels were not superior to their unidirectional prepreg tape equivalents. The latter reduced quickly with the increase of impact energy from the level of strength established for the intact panels.
Assessments of damage and residual load-bearing capacity of composite parts, regardless of the type of reinforcement, can be conducted using the integrated application of experimental destructive and non-destructive methods, which usually requires considerable financial and time investments. Understandably, the availability of a simulation approach suitable for this purpose would provide significant cost savings and accelerate the decision making when such assessments are required. While such processes are generally established for composites with conventional UD tape and fabric-based reinforcements, damage modeling in NCF structures using numerical simulation tools remains a challenge. Previous studies in this field considered detailed meso-scale simulations of non-crimp fabrics (see, e.g., [26,27,28]) and proposed new macroscale constitutive models for NCF materials [29,30,31,32]. However, such models are often not available to the general industry as part of commercial software, which limits their utilization at this point.
While development of novel macroscale constitutive relationships for NCFs is a promising approach in the long-term perspective, this study focuses on a short-term goal of evaluating existing material models available to the industry as part of commercial software and investigates their applicability to modeling of damage formation in structural elements made of NCF. In particular, two LS-DYNA material models were evaluated: *MAT_ENHANCED_COMPOSITE_DAMAGE (MAT 54) and *MAT_LAMINATED_COMPOSITE_FABRIC (MAT 58). Both constitutive models have been widely used for modeling of variety of in-service damage scenarios in UD tape and woven fabric composites, including damage induced by axial crushing (MAT 54: [5,12,33,34,35,36]; MAT 58: [12,37,38,39,40,41,42]) and transverse loading (MAT 54: [36,43,44]; MAT 58: [6,45,46,47]). The main takeaway from these studies is that both constitutive models can quite accurately predict the behavior of tape and woven fabric materials but require determination of their non-physical parameters (so-called stress limit factors, element erosion strain, etc.) through calibration with experimental data or, often, using the guidelines that can be deduced from the previous investigations.
To achieve the declared goals, the following approach was used in this study. First, the NCF material—a unidirectional non-crimp carbon fabric—was characterized using mechanical testing. Second, representative structural components—hollow CFRP tubes—were manufactured and subjected to transverse loading, in which damage was induced in the structural components through a controlled indentation of a metallic cylinder. Third, the physical experiment was replicated in LS-DYNA with MAT 54 and MAT 58 representations of the NCF composite. Finally, results of the physical experiments and numerical simulations were compared, and conclusions were made regarding the applicability and the best practices for using these constitutive models for simulating the behavior of non-crimp fabric materials.
2. Physical Experiments
2.1. Materials and Manufacturing
A unidirectional intermediate modulus (IM) non-crimp carbon fabric pre-impregnated with epoxy resin was used in this study. The fabric has the areal density of 140 g/m2, the resin content of 38 ± 3%, and is built from 12 K carbon fiber tows stitched together with polyester binder (see Figure 1). As per the manufacturer’s recommendation, the curing cycle involved heating the material to 132 °C with the 4 °C/min ramp rate, holding at this temperature for 4 h and cooling to the room temperature with the same rate. The curing was conducted using a desktop oven with a programmable logic controller (PLC).
In addition to the temperature, fabrication of composite parts from the pre-impregnated non-crimp fabric implied application of pressure. For this purpose, and to obtain composite parts of the desired shapes, two aluminum molds were designed and manufactured: one to process flat composite panels (used to cut specimens from for material characterization) and another for manufacturing of the tubular components. A steel mandrel consisting of two wedge-shaped sections was used with the latter mold to form the interior of composite tubes. Pressure to composite laminates in both molds was applied by adjusting torque on the closing screws. The molds along with processed composite parts are shown in Figure 2. In-plane dimensions of the processed flat composite panels were 100 × 300 mm. The tubular specimens had the length of 200 mm and the dimensions of the internal cross-section of 25.4 mm × 25.4 mm. Thickness of a single ply in the laminates post-curing was measured to be equal to 0.15 mm.
The flat panels of different thickness were subsequently used to cut test specimens—with parameters listed in Table 1—for NCF characterization. Digital image correlation (DIC) speckling was applied to all tensile test specimens (groups #1–3 in Table 1).
Two groups of tubular components (see Figure 2) featuring different layups— or (angles measured from the longitudinal axis of the tube)—were manufactured for this study.
2.2. Material Characterization
All material characterization tests have been conducted in this study using the electromechanical load frame MTS Criterion C43.504, equipped with the 50 kN LPS-504 load cell. Mechanical V-shaped wedge grips were affixed to the test pieces on both ends (see Figure 3). Strain measurements during the tests have been conducted using the Advantage AVX Video Extensometer Manta G146B ASG camera and digital image correlation software (MTS AVX Digital Extensometer software for all tensile tests except 10° off-axis experiments, where test video was post-processed using the GOM Correlate software).
Stress–strain diagrams obtained for the NCF material during the mechanical characterization campaign are shown in Figure 4, while the measured mechanical properties are summarized in Table 2. Along with the measured parameters, Table 2 includes compressive properties of the material, which were evaluated in this study using the available micromechanical models [52,53] rather than determined experimentally.
2.3. Component Testing
Physical experiments involving transverse crushing of the NCF specimens of the tubular cross-section were carried out in this study. In the experiment, central loading of the tube by a cylindrical indenter introduced local deformation and damage of the NCF material (fiber breakage, matrix cracking, and delamination), as well as a reduction of cross-section in the middle of the tube. Crosshead displacements and forces were recorded to compare these test outputs with predictions of numerical simulations. Loading cylinder(s) were allowed to move 12 mm downward with the speed of 0.5 mm/min.
The experiments were conducted with composite tubes of two different layups: and (0 and 90—ply orientation, subscripts—number of plies in the corresponding direction, “S” stands for “symmetry”). Force–displacement diagrams resulted from these tests are also shown in Figure 5. After crushing, a 100 mm central segment of the tube with layup was subjected to X-ray computed tomography to provide the measure of the extent of induced damage phase and assist with verification of numerical models. Some of the CT scan outputs are exemplified in Figure 6, illustrating the multiplicity of failure modes experienced by the specimen.
3. Numerical Model
3.1. General Description of the Numerical Model
A numerical model that replicates the tubular component crushing test described in the previous section was developed in LS-DYNA. Its major features are depicted in Figure 7. In the model, the composite layup was represented using stacked TSHELL elements (same formulation as conventional shells with Reissner–Mindlin kinematics, but shaped as solid elements), each representing one “physical” ply of the NCF material. A uniform element size of 0.7 mm was used. The support and the loading cylinder were represented as rigid bodies.
As both investigated material models—MAT54 and MAT58—are typically used in modeling of dynamic processes using LS-DYNA’s explicit solver, the same solver was employed in simulations with these constitutive models in this study. To reduce the computational time when modeling the quasi-static processes using an explicit solver, the loading speed was increased from 0.5 mm/min as in the experiments to 2 m/s. To further reduce simulation time and take advantage of the geometrical and loading symmetry, only quarter of the NCF tube was modeled and symmetry boundary conditions were applied. The developed numerical models incorporated one of the two layups used in the physical experiments: or .
3.2. Modeling of Intra-Ply Damage
3.2.1. MAT54—*MAT_ENHANCED_COMPOSITE_DAMAGE
Material failure in this model is governed by the Chang–Chang stress criterion, given as (see, e.g., [54]):
where are in-plane stresses in a ply and , , , and are the failure indices for longitudinal tensile, longitudinal compressive, transverse tensile, and transverse compressive failure, correspondingly. Parameter β (BETA) is defined in Table 3. In addition, the material model takes into account a decrease of longitudinal compressive strength of a ply (XC) in case of transverse matrix failure, caused by reduction of matrix efficiency in supporting fibers against microbuckling. This is represented by a reduction factor YCFAC, such that the compressive strength in the fiber direction after compressive matrix failure is reduced to .
In addition to parameters that can be and were determined experimentally (see Table 1), MAT54 has a set of non-physical input parameters, which can be categorized into 3 groups:
- (1)
- (element deletion) parameters;
- (2)
- parameters controlling crashfront softening;
- (3)
- those characterizing material behavior after failure initiation.
Parameters of the first group control automatic removal of heavily distorted elements from the model upon satisfaction of a timestep- or strain-based criteria. In this study, in order to reduce the number of parameters requiring calibration, only two out of six available criteria for erosion were used: one based on a minimal timestep (TFAIL), and another based on effective strain of an element (EPS). In the latter criterion, the effective strain that triggers element deletion was set to 55%, i.e., a value that significantly exceeds any of the directional failure strains of the composite. This ensures that erosion never precedes the complete physical failure of elements.
Parameters of the second group are intended to represent a damage zone that may develop in the material ahead of the crashfront (i.e., in elements that are adjacent to those that will be deleted next in the simulation) and can also be viewed as a simple numerical measure to avoid global buckling during simulation. As elements are removed from the simulation due to erosion, the elements which share nodes with them may have their strength reduced by some factor given by the SOFT parameter.
Post-failure response of composite is mainly governed by an array of stress limit factors (SLIM_), which represent the amount of residual strength that composite retains after satisfaction of any of the failure criteria provided by Equations (1)–(4). For example, even a completely crushed composite usually can retain some resistance to compressive loading. All of the non-physical parameters of MAT54, together with the rationale used for their initial choice, are listed in Table 3.
3.2.2. MAT58–*MAT_LAMINATED_COMPOSITE_FABRIC
MAT058 or *MAT_LAMINATED_COMPOSITE_FABRIC—a continuum damage mechanics (CDM)-based model, which accounts for both pre- and post-peak softening of composite plies—was used to model the intra-ply behavior of the NCF-reinforced composite tubes. Details of this model’s implementation can be found in [55]. The following set of failure criteria was used in this study to represent failure of the NCF material:
The effective stresses () in the expressions (5)–(8) are related to the nominal stresses through the damage parameters , also known as area loss parameters, such that:
where damage evolution with straining is assumed as and m, and are the parameter controlling shape of the stress–strain response, strain and strain at maximum directional stress, correspondingly. Thus, the components of the constitutive tensor C(d) can be represented as functions of the damage parameters and the properties of undamaged layer:
where .
Such CDM-based formulation provides smooth increase of damage and, upon failure initiation, prevents the immediate drop of stresses to the level determined by the SLIM_ factors, as it is the case with MAT 54, but rather makes it a gradual reduction to that level. Moreover, it should be noted, that the two damage parameters and assume different values for tension ( and ) and compression ( and ). Additional non-physical parameters associated with MAT 58, as well as rationale for their choice, are described in Table 4.
3.3. Modeling of Delamination
The walls of the tube were modeled using 14 layers of stacked TSHELL elements (TSHELL ELFORM 1 in LS-DYNA), each representing one physical ply of the UD NCF material. To represent delamination, the contact interfaces between the 14 TSHELL layers were added using *CONTACT_AUTOMATIC_ONE_WAY_SURFACE_TO_SURFACE_TIEBREAK with OPTION 9 [56] This contact algorithm is equivalent to using zero-thickness cohesive zone elements and is based on the fracture model with bilinear traction-separation law, mixed mode delamination criterion, and damage formulation [54]. This delamination model’s parameters include normal and shear failure stresses at the interface between the adjacent layers (NFLS and SFLS parameters, respectively), mode I and mode II critical strain energy release rates ( and ), and the normal (CN) and tangential (CT; CT = CT2CN × CN, where CT2CN is a coefficient between 0 and 1) stiffness of the material in the interlaminar region. For each mode of fracture (normal or shear), the ultimate separation displacement (δult) is calculated based on the provided values of initial stiffness, peak stress, and fracture toughness. After satisfaction of the failure criterion (), the failed interface (master segment–slave node pair) can only resist compressive force. The parameters of the delamination model used in this study, as well as the rationale for their choice, are summarized in Table 5.
4. Results and Discussion
Metrics to evaluate the numerical predictions specific to the crushing phase included comparison of the damage in the outer layer of the specimen (visual vs. predicted), extent of delamination (CT-scan vs. models), and the force-displacement diagrams (recorded in experiments vs. produced by LS-DYNA).
Figure 8 and Figure 9 show visual damage induced due to crushing to the outer layer of the [04, 903]S specimen, as well as predictions of it obtained using MAT54 (Figure 10) and MAT58 (Figure 11). As can be seen in Figure 8, the outer layer exhibited fiber breakage (crack propagates under the crushing cylinder perpendicular to the fibers in the outer layer) and multiple matrix cracks (propagate along fibers), which are especially noticeable near the top and bottom surfaces of the specimen in the central region and also seen on the sides.
The predicted damage is depicted in terms of the history variables of the material models, which included longitudinal tensile and compressive and transverse tensile and compressive failure (see Equations (1)–(4)) for MAT54, as well as longitudinal, transverse, and shear damage for MAT58. It should be noted that MAT54 does not have a separate history variable for in-plane shear, while MAT58 does not distinguish between tensile and compressive modes (only cumulative longitudinal or transverse damage). As MAT54 predicts only instant failure (rather than gradual damage), any colors other than grey (not failed material) and red (failed material) appear in Figure 8 due to nodal averaging employed during post-processing.
As can be deduced from the figures, both material models predict fiber breakage observed experimentally in the central region of the specimen’s outer ply. The shapes of the predicted crack (true for both MAT54 and MAT58) is more simplistic (straight path) than that observed experimentally, which can be attributed to the quarter-symmetrical nature of the models. With MAT54, by the end of the crushing phase it is represented by the row of eroded elements, while erosion had not yet happened at that point in MAT58 model, and the crack can be identified by the elements fully damaged in the fiber direction (MAT58 history variable 1). Additional fiber damage that can be seen in Figure 9 (blue area) can be attributed to the initial accumulation of defects during the pre-peak softening phase in MAT58.
Both models seem to be able to replicate the qualitative pattern of matrix cracking observed experimentally and described above (history variables 3 and 4 in Figure 8, and 2 and 3 in Figure 9). This includes predicted high density of matrix cracks in the upper and lower areas of the central region of the specimen, as well as multiplicity of scattered matrix cracks at the sides (MAT54 history variable 3 and MAT58 history variable 2).
The model of the crushed tube with [04, 903]S layup obtained using X-ray computed tomography was processed using the Porosity Analysis module of myVGL software to visualize the region of the tube affected by delamination. In particular, the “Equivalent diameter” feature of the module was used, which indicates the diameter of a sphere that has the same volume as the detected defect in the material. In Figure 10a, delamination is represented by pink color, which highlights defects with the equivalent diameter of 3 mm and larger.
In modeling, delamination was visualized as contact gap between stacked TSHELL elements connected using *CONTACT_AUTOMATIC_ONE_WAY_SURFACE_TO_SURFACE_TIEBREAK (OPTION 9), as described in Section 3.3. In total there are 13 ply interfaces in each model on which delamination (contact gap) can be displayed. To make the modeling results comparable with the X-ray output, the contact gap images from ply interfaces were made half-transparent and placed on top of each other. Comparison of the regions of the crushed specimen affected by delamination—as measured experimentally and predicted—is shown in Figure 10. It should be noted that unlike the equivalent diameter feature in the CT-scan processing software, contact gap in LS-DYNA is a unitless measure of delamination. Pink color in Figure 10b,c represents completely debonded regions between plies (contact gap = 1). As can be deduced from the figure, all three images show similar extent of delamination. Conducted measurements indicated that the area affected by delamination constitutes 26.6% of the image (a) in Figure 10, 26.9% of the image (b), and 25.8% of the image (c).
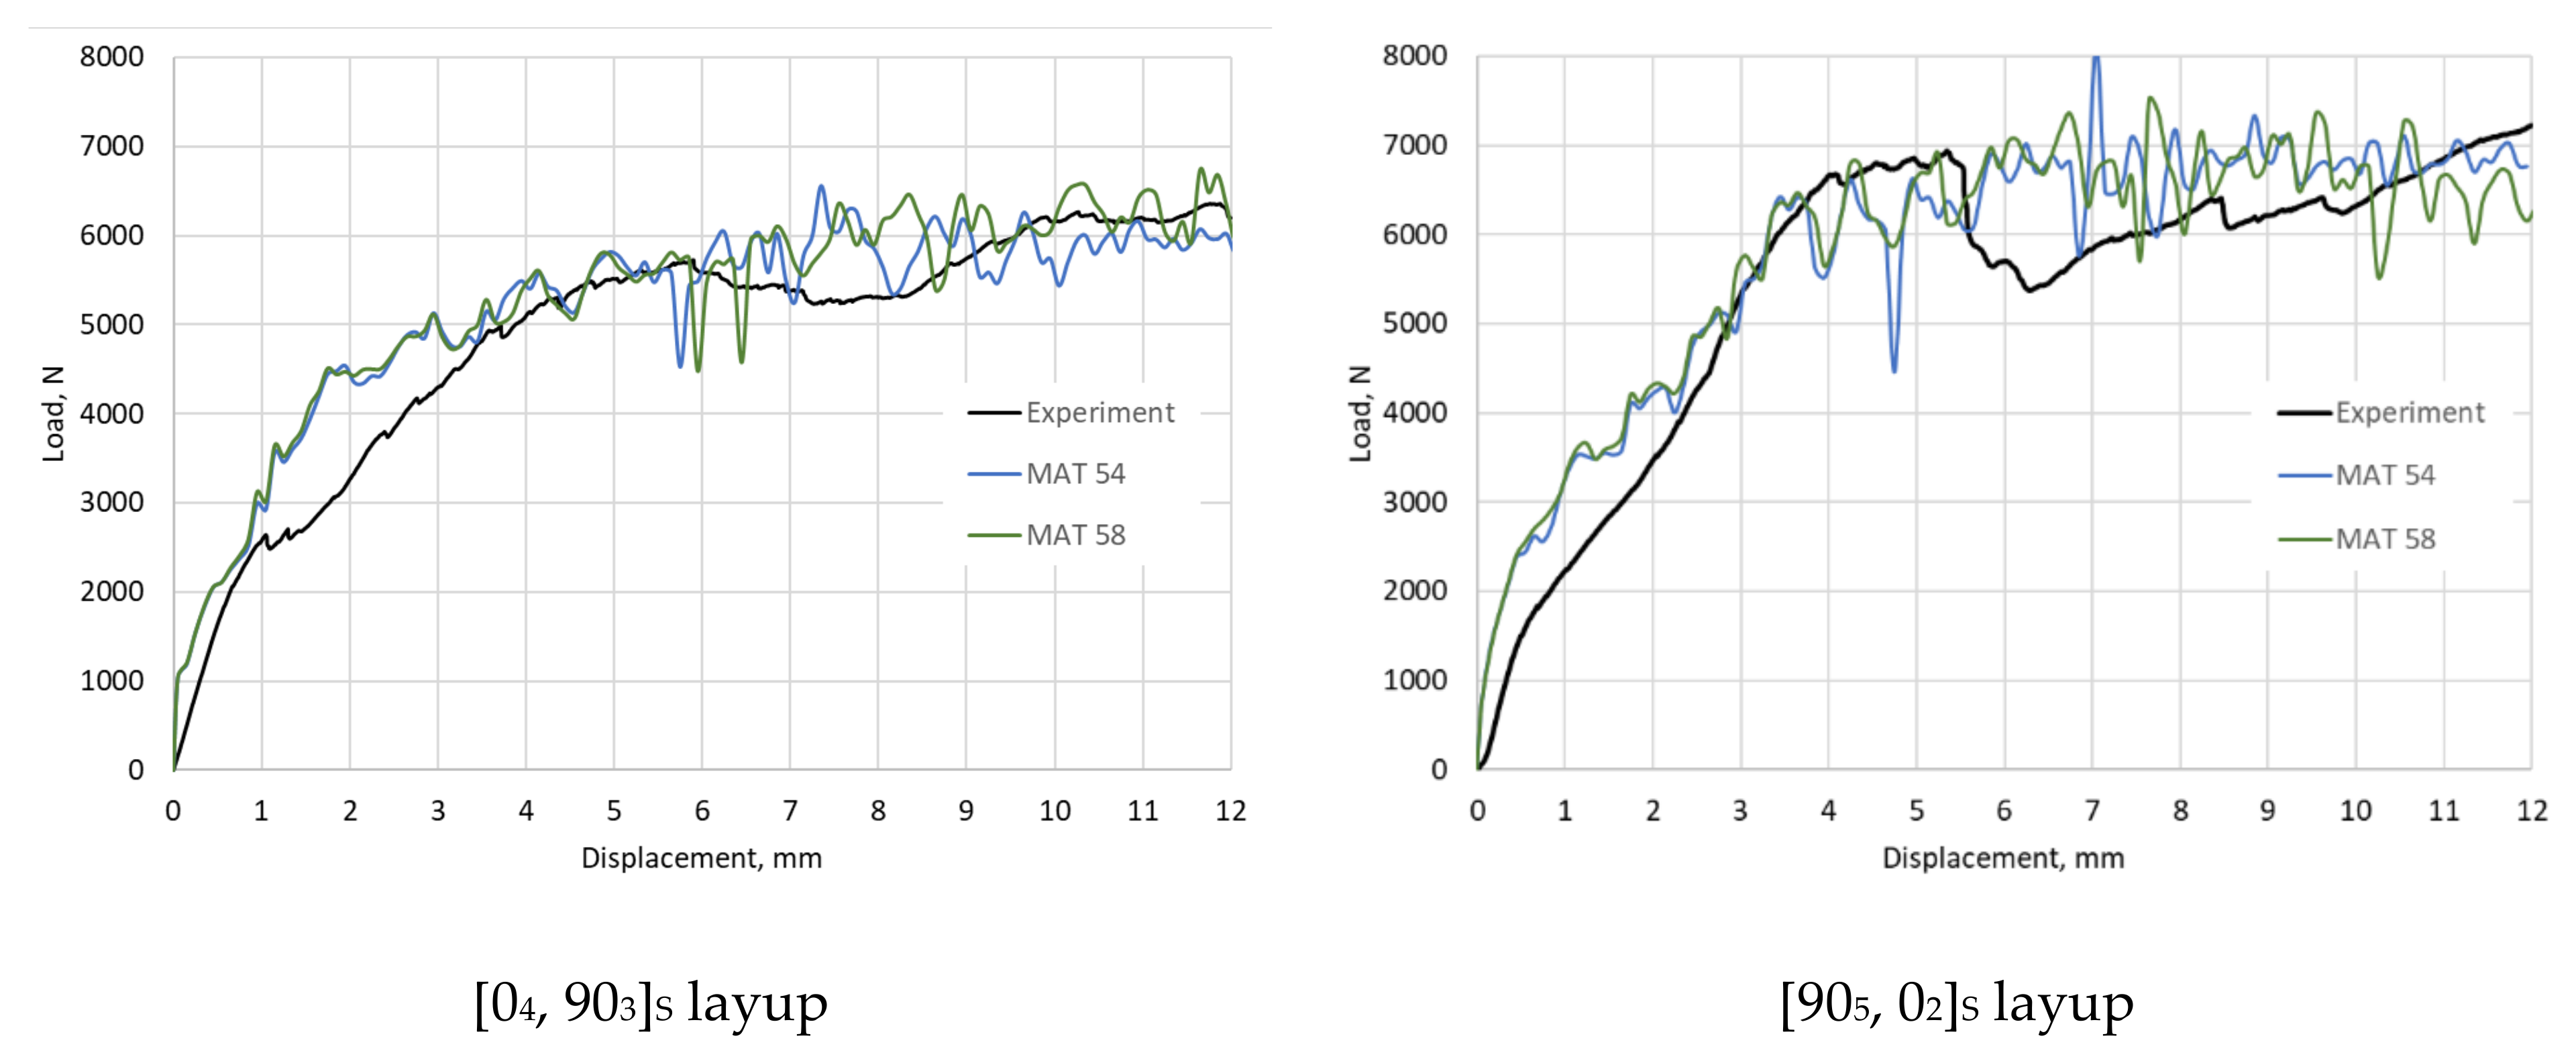
The force–displacement diagrams corresponding to the crushing phase of the specimens with [04, 903]S and [905, 02]S layups are shown in Figure 11, comparing the experimental results and the modeling predictions. As can be deduced from the figure, both constitutive models equally adequate predict the force–displacement response of the specimen during this phase. This is true for both considered composite layups.
5. Conclusions
This numerical and experimental study was conducted to investigate the applicability of two constitutive material models previously used only for UD tape and woven fabric-reinforced materials to modeling of damage in composite parts processed from non-crimp carbon fabric. Despite the differences in their formulations (strength criteria-based MAT54 vs. CDM-based MAT58), both material models were found to be robust and able to predict damage induced by transverse crushing in UD NCF parts reasonably well. This included the representation of qualitative patterns of interlaminar damage and the extent of intralaminar damage (delamination), as well as the prediction of force-displacement response exhibited by the tested tubular components. Future work must be focused on investigating the applicability of MAT54 and MAT58 for prediction of residual load-bearing capacity of damaged NCF parts under transverse loading, as well as consideration of other loading scenarios, such as axial crushing.
Author Contributions
Methodology, A.C.; modeling and validation, M.K.; experimental work, M.K.; writing—original draft preparation, M.K. and A.C.; supervision, A.C.; funding acquisition, A.C. All authors have read and agreed to the published version of the manuscript.
Funding
The authors would like to acknowledge financial support of this study provided by the University of Windsor and Mitacs (Mitacs Research Training Award).
Institutional Review Board Statement
Not applicable.
Informed Consent Statement
Not applicable.
Data Availability Statement
Not applicable.
Acknowledgments
The authors would like to thank Kevin Harkai, Bruce Durfy, and Andrew Jenner for machining test specimens for NCF characterization, as well as for their help in the design and manufacturing of mold for processing of NCF components.
Conflicts of Interest
The authors declare no conflict of interest.
References
- Middendorf, P.; Metzner, C. Aerospace application of non-crimp fabric composites. In Non-Crimp Fabric Composites, Philadelphia; Woodhead Publishing: Sawston, UK, 2011; pp. 441–449. [Google Scholar]
- Sköck-Hartmann, B.; Gries, T. Automotive applications of non-crimp fabric composites. In Non-Crimp Fabric Composites, Philadelphia; Woodhead Publishing: Sawston, UK, 2011; pp. 461–480. [Google Scholar]
- Adolphs, G.; Skinner, C. Non-crimp fabric composites in wind turbines. In Non-Crimp Fabric Composites, Philadelphia; Woodhead Publishing: Sawston, UK, 2011; pp. 481–493. [Google Scholar]
- Mouli, Y.S.C.; Upadhyay, C.S.; Mohite, P.M. Intra-ply Damage Modeling of Low-Velocity Impact on Composite Laminates. In Proceedings of the 1st International Conference on Emerging Trends in Engineering (ICETE), Hyderabad, India, 22–23 March 2020. [Google Scholar]
- Moncayo, E.; Wagner, H.; Drechsler, K. Benchmarks for Composite Delamination Using LS-Dyna 971: Low Velocity Impact. In Proceedings of the 6th LS-DYNA Anwenderforum, Frankental, Germany, 11 October 2007. [Google Scholar]
- Cherniaev, A.; Pavlova, S.; Pavlov, A.; Komarov, V. Prediction of Load-Bearing Capacity of Composite Parts with Low-Velocity Impact Damage: Identification of Intra- and Inter-Ply Constitutive Models. Appl. Mech. 2020, 1, 5. [Google Scholar] [CrossRef] [Green Version]
- Heimbs, S.; Heller, S.; Middendorf, P. Simulation of low velocity impact on composite plates with compressive preload. In LS-DYNA Anwenderforum; DYNAmore GmbH: Banberg, Germany, 2008. [Google Scholar]
- Aymerich, F.; Dore, F.; Priolo, P. Prediction of impact-induced delamination in cross-ply composite laminates using cohesive interface elements. Compos. Sci. Technol. 2008, 68, 2383–2390. [Google Scholar] [CrossRef] [Green Version]
- Di Caprio, F.; Langella, A.; Lopresto, V.; Caprino, G. Numerical, Experimental and Analytical Correlation for Predicting the Structural Behavior of Composite Structures under Impact. Procedia Eng. 2016, 167, 80–87. [Google Scholar] [CrossRef]
- Long, S.; Yao, X.; Zhang, X. Delamination prediction in composite laminates under low-velocity impact. Compos. Struct. 2015, 132, 290–298. [Google Scholar] [CrossRef]
- Zhang, J.; Li, Z.; Zhang, Q.; Huili, Y. Study of fiber modulus effect on impact energy absorption characteristics of composite laminates at normal and oblique impacts. Mater. Res. Express 2019, 6, 085610. [Google Scholar] [CrossRef]
- Cherniaev, A.; Butcher, C.; Montesano, J. Predicting the axial crush response of CFRP tubes using three damage-based constitutive models. Thin-Walled Struct. 2018, 129, 349–364. [Google Scholar] [CrossRef]
- Geier, N.; Szalay, T.; Takács, M. Analysis of thrust force and characteristics of uncut fibres at non-conventional oriented drilling of unidirectional carbon fibre-reinforced plastic (UD-CFRP) composite laminates. Int. J. Adv. Manuf. Technol. 2018, 100, 3139–3154. [Google Scholar] [CrossRef]
- Sapozhnikov, S.; Swolfs, Y.; Lomov, S. Pseudo-ductile unidirectional high modulus/high strength carbon fibre hybrids using conventional ply thickness prepregs. Compos. Part B Eng. 2020, 198, 108213. [Google Scholar] [CrossRef]
- Sy, B.L.; Fawaz, Z.; Bougherara, H. Damage evolution in unidirectional and cross-ply flax/epoxy laminates subjected to low velocity impact loading. Compos. Part A Appl. Sci. Manuf. 2018, 112, 452–467. [Google Scholar] [CrossRef]
- Liv, Y.; Guillamet, G.; Costa, J.; González, E.; Marín, L.; Mayugo, J. Experimental study into compression after impact strength of laminates with conventional and nonconventional ply orientations. Compos. Part B Eng. 2017, 126, 133–142. [Google Scholar] [CrossRef] [Green Version]
- Sabah, S.A.; Kueh, A.; Al-Fasih, M. Comparative low-velocity impact behavior of bio-inspired and conventional sandwich composite beams. Compos. Sci. Technol. 2017, 149, 64–74. [Google Scholar] [CrossRef]
- Vignjevic, R.; Campbell, J.; Hughes, K.; Orłowski, M.; Garcea, S.; Withers, P.; Reed, J. Soft body impact resistance of composite foam core sandwich panels with unidirectional corrugated and tubular reinforcements. Int. J. Impact Eng. 2019, 132, 103320. [Google Scholar] [CrossRef]
- Liu, H.; Falzon, B.; Tan, W. Experimental and numerical studies on the impact response of damage-tolerant hybrid unidirectional/woven carbon-fibre reinforced composite laminates. Compos. Part B Eng. 2018, 136, 101–118. [Google Scholar] [CrossRef] [Green Version]
- Shyr, T.-W.; Pan, Y.-H. Impact resistance and damage characteristics of composite laminates. Compos. Struct. 2003, 62, 193–203. [Google Scholar] [CrossRef]
- Greve, L.; Pickett, A. Modelling damage and failure in carbon/epoxy non-crimp fabric composites including effects of fabric pre-shear. Compos. Part A Appl. Sci. Manuf. 2006, 37, 1983–2001. [Google Scholar] [CrossRef] [Green Version]
- Lomov, S.V.; Bogdanovich, A.E.; Ivanov, D.S.; Mungalov, D.; Karahan, M.; Verpoest, I. A comparative study of tensile properties of non-crimp 3D orthogonal weave and multi-layer plain weave E-glass composites. Part 1: Materials, methods and principal results. Compos. Part A Appl. Sci. Manuf. 2009, 40, 1134–1143. [Google Scholar] [CrossRef]
- Segreto, T.; Bottillo, A.; Teti, R. Advanced ultrasonic non-destructive evaluation for metrological analysis and quality assessment of impact damaged non-crimp fabric composites. Procedia CIRP 2016, 41, 1055–1060. [Google Scholar] [CrossRef]
- Bibo, G.; Hogg, P.; Backhouse, R.; Mills, A. Carbon-fibre non-crimp fabric laminates for cost-effective damage-tolerant structures. Compos. Sci. Technol. 1998, 58, 129–143. [Google Scholar] [CrossRef]
- Berketis, K.; Tzetzis, D. The compression-after-impact strength of woven and non-crimp fabric reinforced composites subjected to long-term water immersion ageing. J. Mater. Sci. 2010, 45, 5611–5623. [Google Scholar] [CrossRef]
- Zhao, L.; Warrior, N.; Long, A. Finite element modelling of damage progression in non-crimp fabric reinforced composites. Compos. Sci. Technol. 2006, 66, 36–50. [Google Scholar] [CrossRef]
- Yin, H.; Li, Q.; Iannucci, L. Meso-scale Finite Element (FE) modelling of biaxial carbon fibre non-crimp-fabric (NCF) based composites under uniaxial tension and in-plane shear. Compos. Struct. 2022, 290, 115538. [Google Scholar] [CrossRef]
- Rouf, K.; Worswick, M.J.; Montesano, J. A multiscale framework for predicting the mechanical properties of unidirectional non-crimp fabric composites with manufacturing induced defects. J. Compos. Mater. 2020, 55, 741–757. [Google Scholar] [CrossRef]
- Costa, S.; Bru, T.; Olsson, R.; Portugal, A. Improvement and validation of a physically based model for the shear and transverse crushing of orthotropic composites. J. Compos. Mater. 2018, 53, 1681–1696. [Google Scholar] [CrossRef]
- Gouskos, D.; Iannucci, L. A failure model for the analysis of cross-ply Non-Crimp Fabric (NCF) composites under in-plane loading: Experimental & numerical study. Eng. Fract. Mech. 2022, 271, 108575. [Google Scholar]
- Senner, T.; Kreissl, S.; Merklein, M.; Meinhardt, M.; Lipp, A. Bending of unidirectional non-crimp-fabrics: Experimental characterization, constitutive modeling and application in finite element simulation. Prod. Eng. 2015, 9, 1–10. [Google Scholar] [CrossRef]
- Soto, A.; González, E.V.; Maimí, P.; Escalera, F.M.D.L.; Aja, J.S.D.; Alvarez, E. Low velocity impact and compression after impact simulation of thin ply laminates. Compos. Part A Appl. Sci. Manuf. 2018, 109, 413–427. [Google Scholar] [CrossRef]
- Feraboli, P.; Wade, B.; DeLeo, F.; Rassaian, M.; Higgins, M.; Byar, A. LS-DYNA MAT54 modeling of the axial crushing of a composite tape sinusoidal specimen. Compos. Part A Appl. Sci. Manuf. 2011, 42, 1809–1825. [Google Scholar] [CrossRef]
- Zhang, J.; Lu, B.; Zheng, D.; Li, Z. Experimental and numerical study on energy absorption performance of CFRP/aluminum hybrid square tubes under axial loading. Thin-Walled Struct. 2020, 155, 106948. [Google Scholar] [CrossRef]
- Liu, Q.; Fu, J.; Ma, Y.; Zhang, Y.; Li, Q. Crushing responses and energy absorption behaviors of multi-cell CFRP tubes. Thin-Walled Struct. 2020, 155, 106930. [Google Scholar] [CrossRef]
- Zhou, G.; Tang, H.; Sun, Q.; Li, D.; Peng, Y.; Zeng, D.; Su, X. Analysis of the crushing behaviors of woven carbon fiber reinforced plastic hat section component under dynamic bending and axial crushing loading. Thin-Walled Struct. 2021, 161, 107426. [Google Scholar] [CrossRef]
- Pohl, C.; Toenjes, M.; Liebold, C.; Ploeckl, M.; Koerber, H.; Gray, L.A.; Colin, D.; Drechsler, K. Numerical prediction of composite damage behavior: A modeling approach including the strain-rate-dependent material response. Compos. Struct. 2022, 292, 115628. [Google Scholar] [CrossRef]
- Mansor, M.; Ahmad, Z.; Abdullah, M. Crashworthiness capability of thin-walled fibre metal laminate tubes under axial crushing. Eng. Struct. 2021, 252, 113660. [Google Scholar] [CrossRef]
- Lanzi, L. Composite stiffened panels in postbuckling: Experiments and dynamic explicit analyses with LS-DYNA. In Proceedings of the 30th Europian Rotor Craft Forum, Marseilles, France, 14–16 September 2004. [Google Scholar]
- Xiao, X.; McGregor, C.; Vaziri, R.; Poursartip, A. Progress in braided composite tube crush simulation. Int. J. Impact Eng. 2009, 36, 711–719. [Google Scholar] [CrossRef]
- Jackson, K.E.; Fasanella, E.L.; Littell, J.D. Development of a continuum damage mechanics material model of a graphite-kevlar hybrid fabric for simulating the impact response of energy absorbing subfloor concepts. In Proceedings of the 73rdAHS International Annual Forum & Technology Display, Fort Worth, TX, USA, 9–11 May 2017. [Google Scholar]
- Reiner, J.; Vaziri, R. Progressive Axial Crushing of Composite Laminates: A Comparison Between LS-DYNA Continuum Damage Models. In Proceedings of the American Society for Composites—Thirty-Third Annual Technical Conference, Seattle, WA, USA, 24–26 September 2018. [Google Scholar]
- Panciroli, R.; Giannini, O. Comparing the impact resistance of flax/epoxy and glass/epoxy composites through experiments and numerical simulations. Compos. Struct. 2021, 264, 113750. [Google Scholar] [CrossRef]
- Metin, F.; Avcı, A. In-plane quasi-static and out-of-plane dynamic behavior of nanofiber interleaved glass/epoxy composites and finite element simulation. Compos. Struct. 2021, 270, 114085. [Google Scholar] [CrossRef]
- Yan, J.; Liu, Y.; Yan, Z.; Bai, F.; Shi, Z.; Si, P.; Huang, F. Ballistic characteristics of 3D-printed auxetic honeycomb sandwich panel using CFRP face sheet. Int. J. Impact Eng. 2022, 164, 104186. [Google Scholar] [CrossRef]
- Wei, Q.; Gu, B.; Sun, B. Ballistic penetration damages and energy absorptions of stacked cross-plied composite fabrics and laminated panels. Int. J. Damage Mech. 2020, 29, 1465–1484. [Google Scholar] [CrossRef]
- Yu, H.; Zhao, H.; Shi, F. Bending Performance and Reinforcement of Rocker Panel Components with Unidirectional Carbon Fiber Composite. Materials 2019, 12, 3164. [Google Scholar] [CrossRef] [Green Version]
- No. D3039/D3039M-17; Standard Test Method for Tensile Properties of Polymer Matrix Composite Materials. Annual Book of ASTM Standards: West Conshohocken, PA, USA, 2017.
- Chamis, C.C.; Sinclair, J.H. Ten Deg. Off-Axis Tensile Test for Intralaminar Shear Characterization of Fiber Composites; NASA Technical Note (TN-D-8215); National Aeronautics and Space Administration: Washington, DC, USA, 1976.
- No. D 5528-01 (Reapproved 2007); Standard Test Method for Mode I Interlaminar Fracture Toughness of Unidirectional Fiber-Reinforced Polymer Matrix Composites1. Annual Book of ASTM: West Conshohocken, PA, USA, 2007.
- Carlsson, L.A.; Adams, D.F.; Pipes, R.B. Characterization of Delamination Failure. In Experimental Characterization of Advanced Composite Materials; CRC Press: Boca Raton, FL, USA, 2014; pp. 250–262. [Google Scholar]
- Lo, K.; Chim, E.-M. Compressive Strength of Unidirectional Composites. J. Reinf. Plast. Compos. 1992, 11, 838–896. [Google Scholar] [CrossRef]
- Chamis, C.C. Simplified composite micromechanics equations for hygral, thermal and mechanical properties. In Proceedings of the Thirty-Eight Annual Conference of Society of the Plastics Industry (SPI) Reinforced Plastics/Composites Institute, Houston, TX, USA, 7–11 February 1983. [Google Scholar]
- Livermore Software Technology Corporation (LSTC). LS-DYNA ® Keyword User’s Manual Volume II: Material Models; LSTC: Canonsburg, PA, USA, 2013. [Google Scholar]
- Matzenmiller, A.; Lubliner, J.; Taylor, L.R. A constitutive model for anisotropic damage in fiber-composites. Mech. Mater. 1995, 20, 125–152. [Google Scholar] [CrossRef]
- Livermore Software Technology Corporation (LSTC). LS-DYNA ® Keyword User’s Manual Volume I; LSTC: Canonsburg, PA, USA, 2019. [Google Scholar]
- Graf, T.; Haufe, A.; Andrade, F. Adhesives modeling with LS-DYNA: Recent developments and future work. In Proceedings of the Nordic LS-DYNA Forum, Stuttgart, Germany, 6–8 October 2014. [Google Scholar]
Figure 1.
Non-crimp unidirectional carbon fabric.
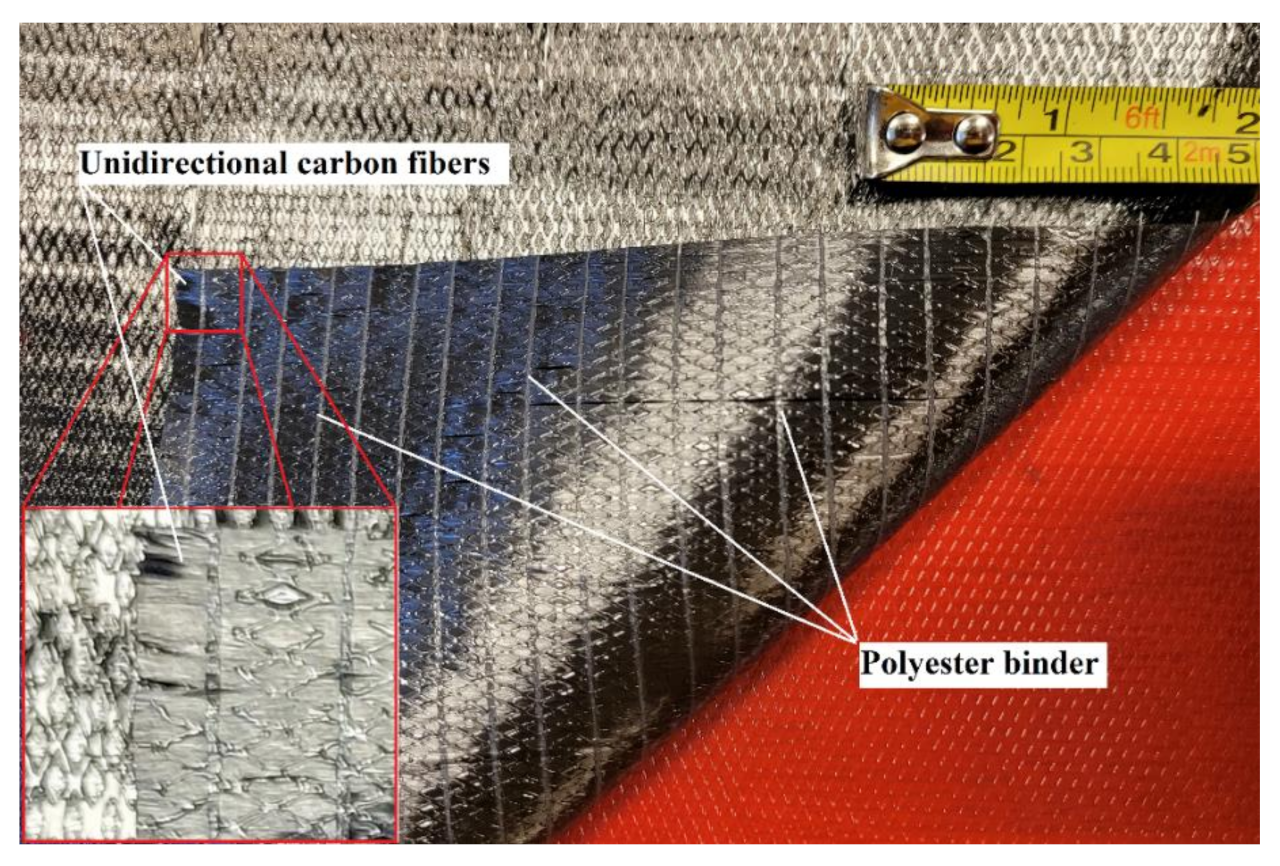
Figure 2.
Manufacturing of NCF components: the molds and the processed parts.

Figure 3.
Test setup for material characterization experiments.

Figure 4.
Stress–strain diagrams for the NCF material.
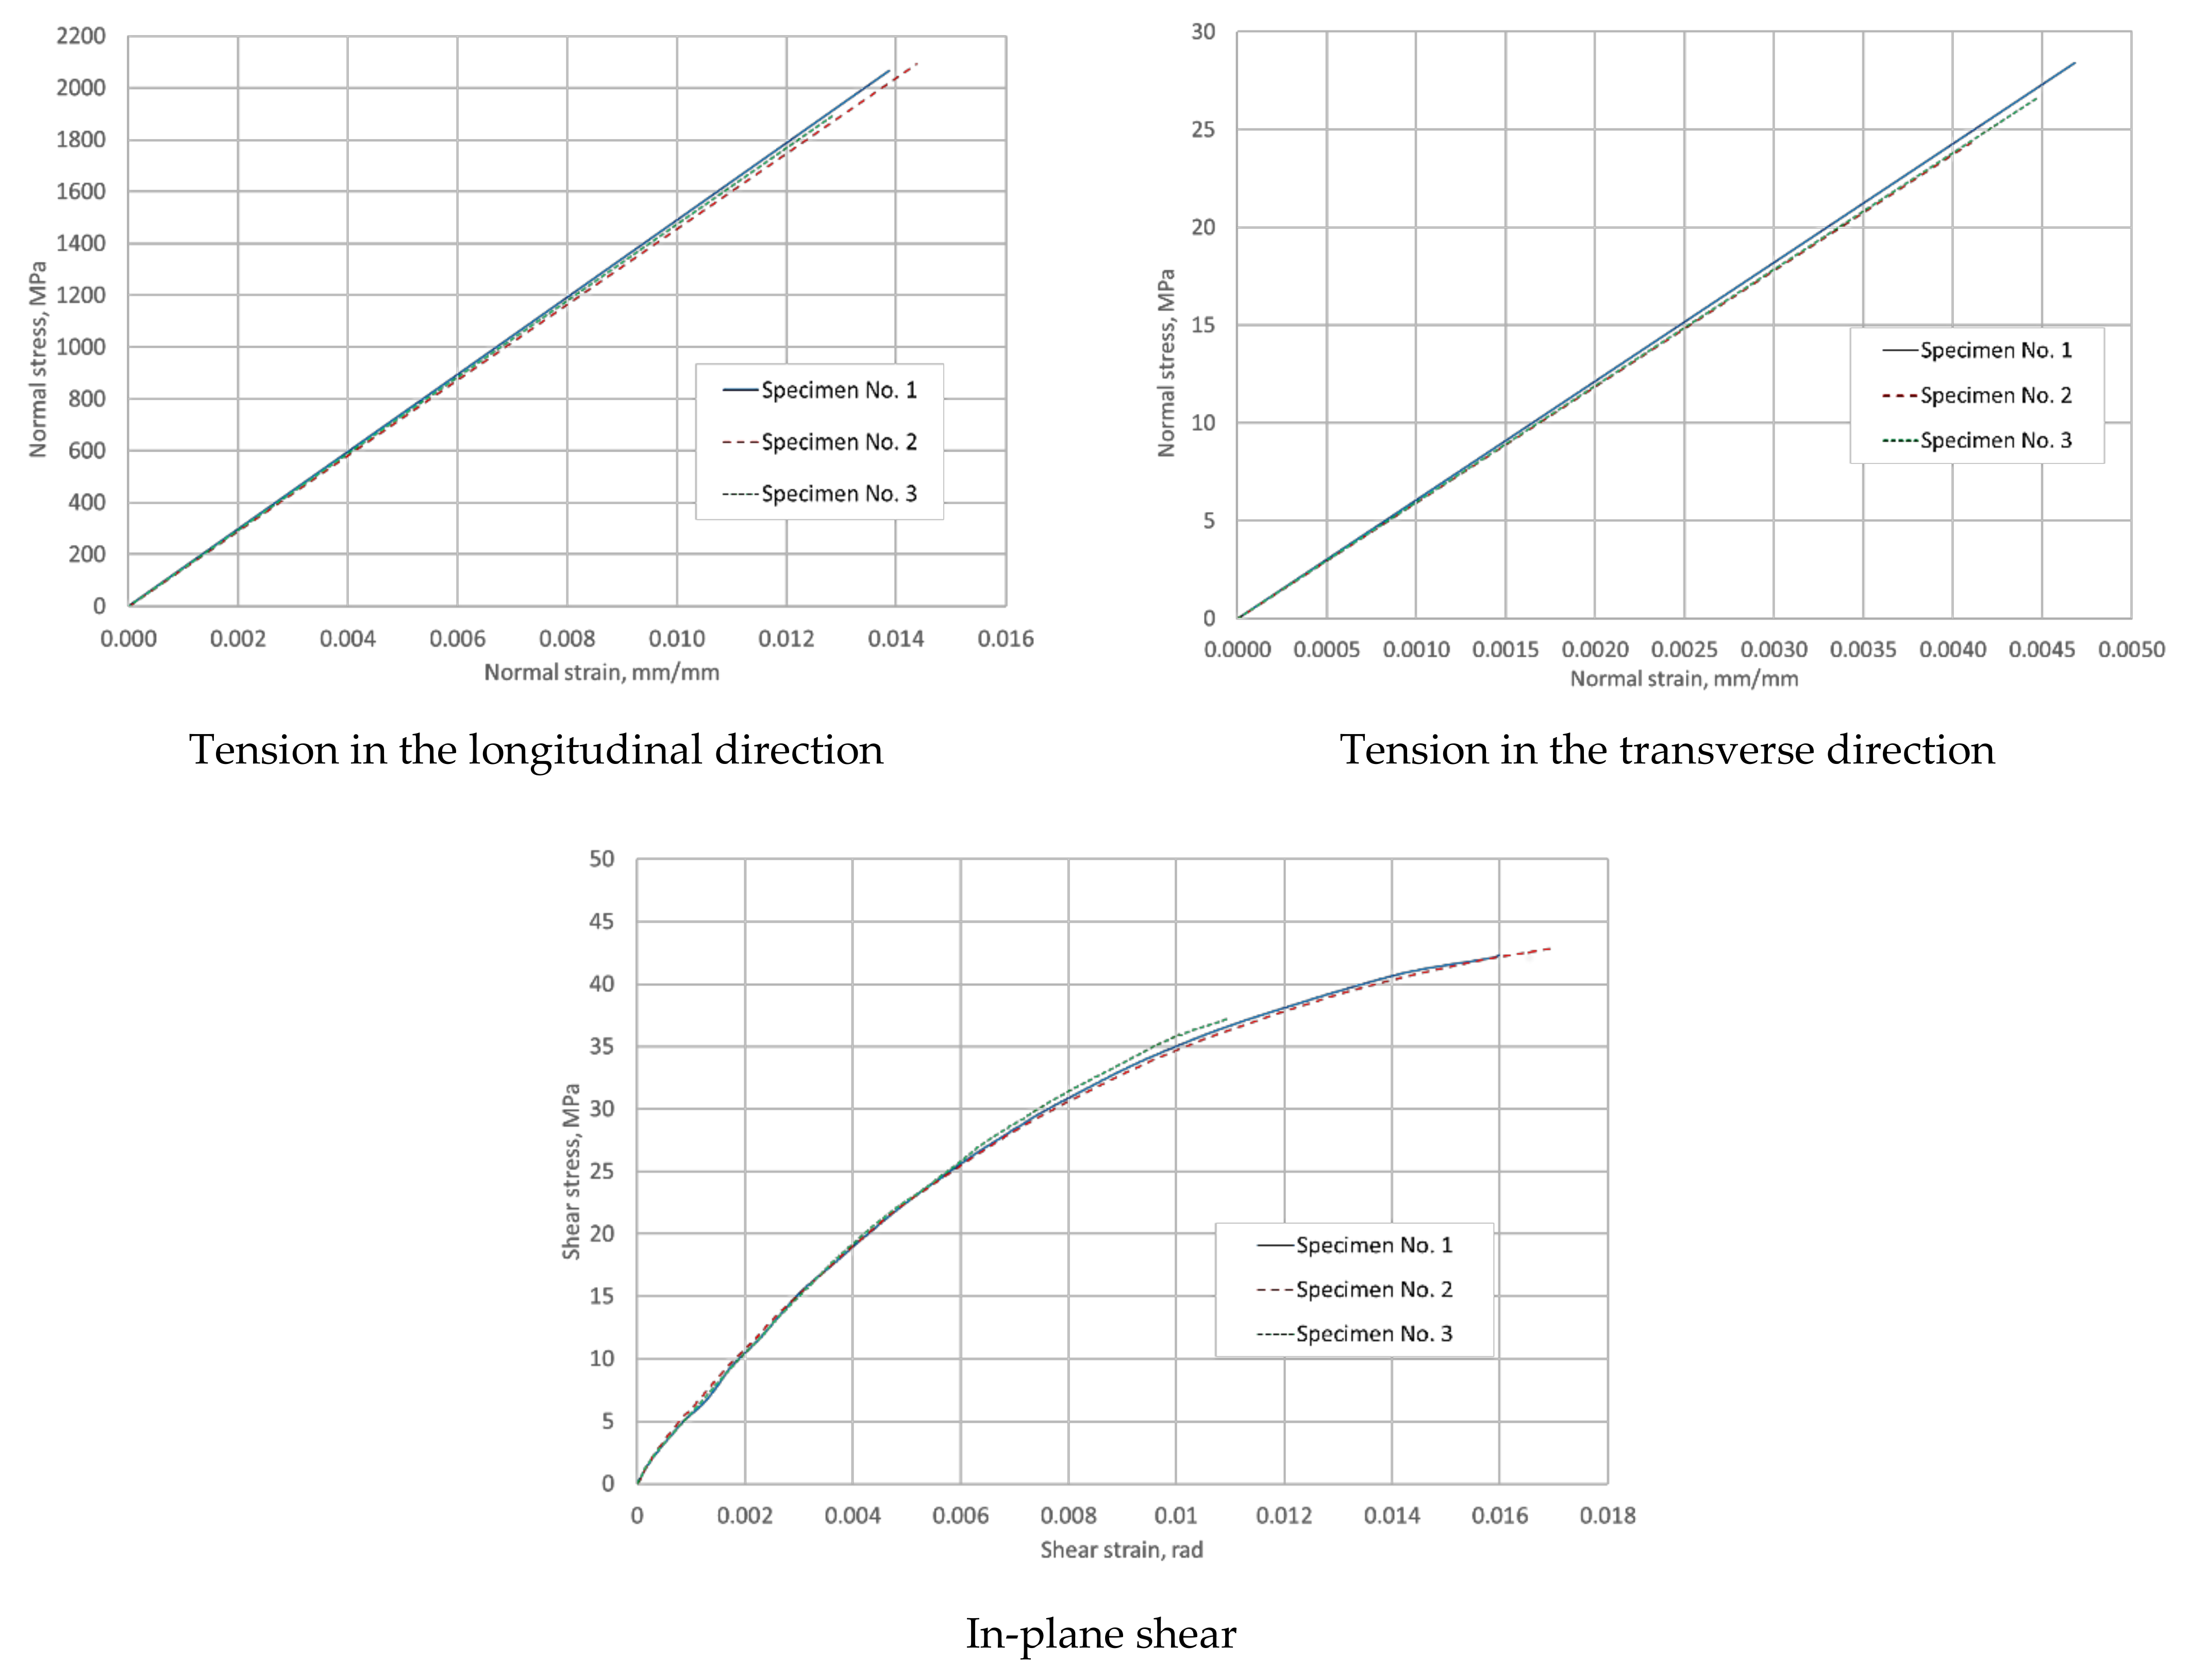
Figure 5.
Transverse crushing of the tubular NCF specimen.
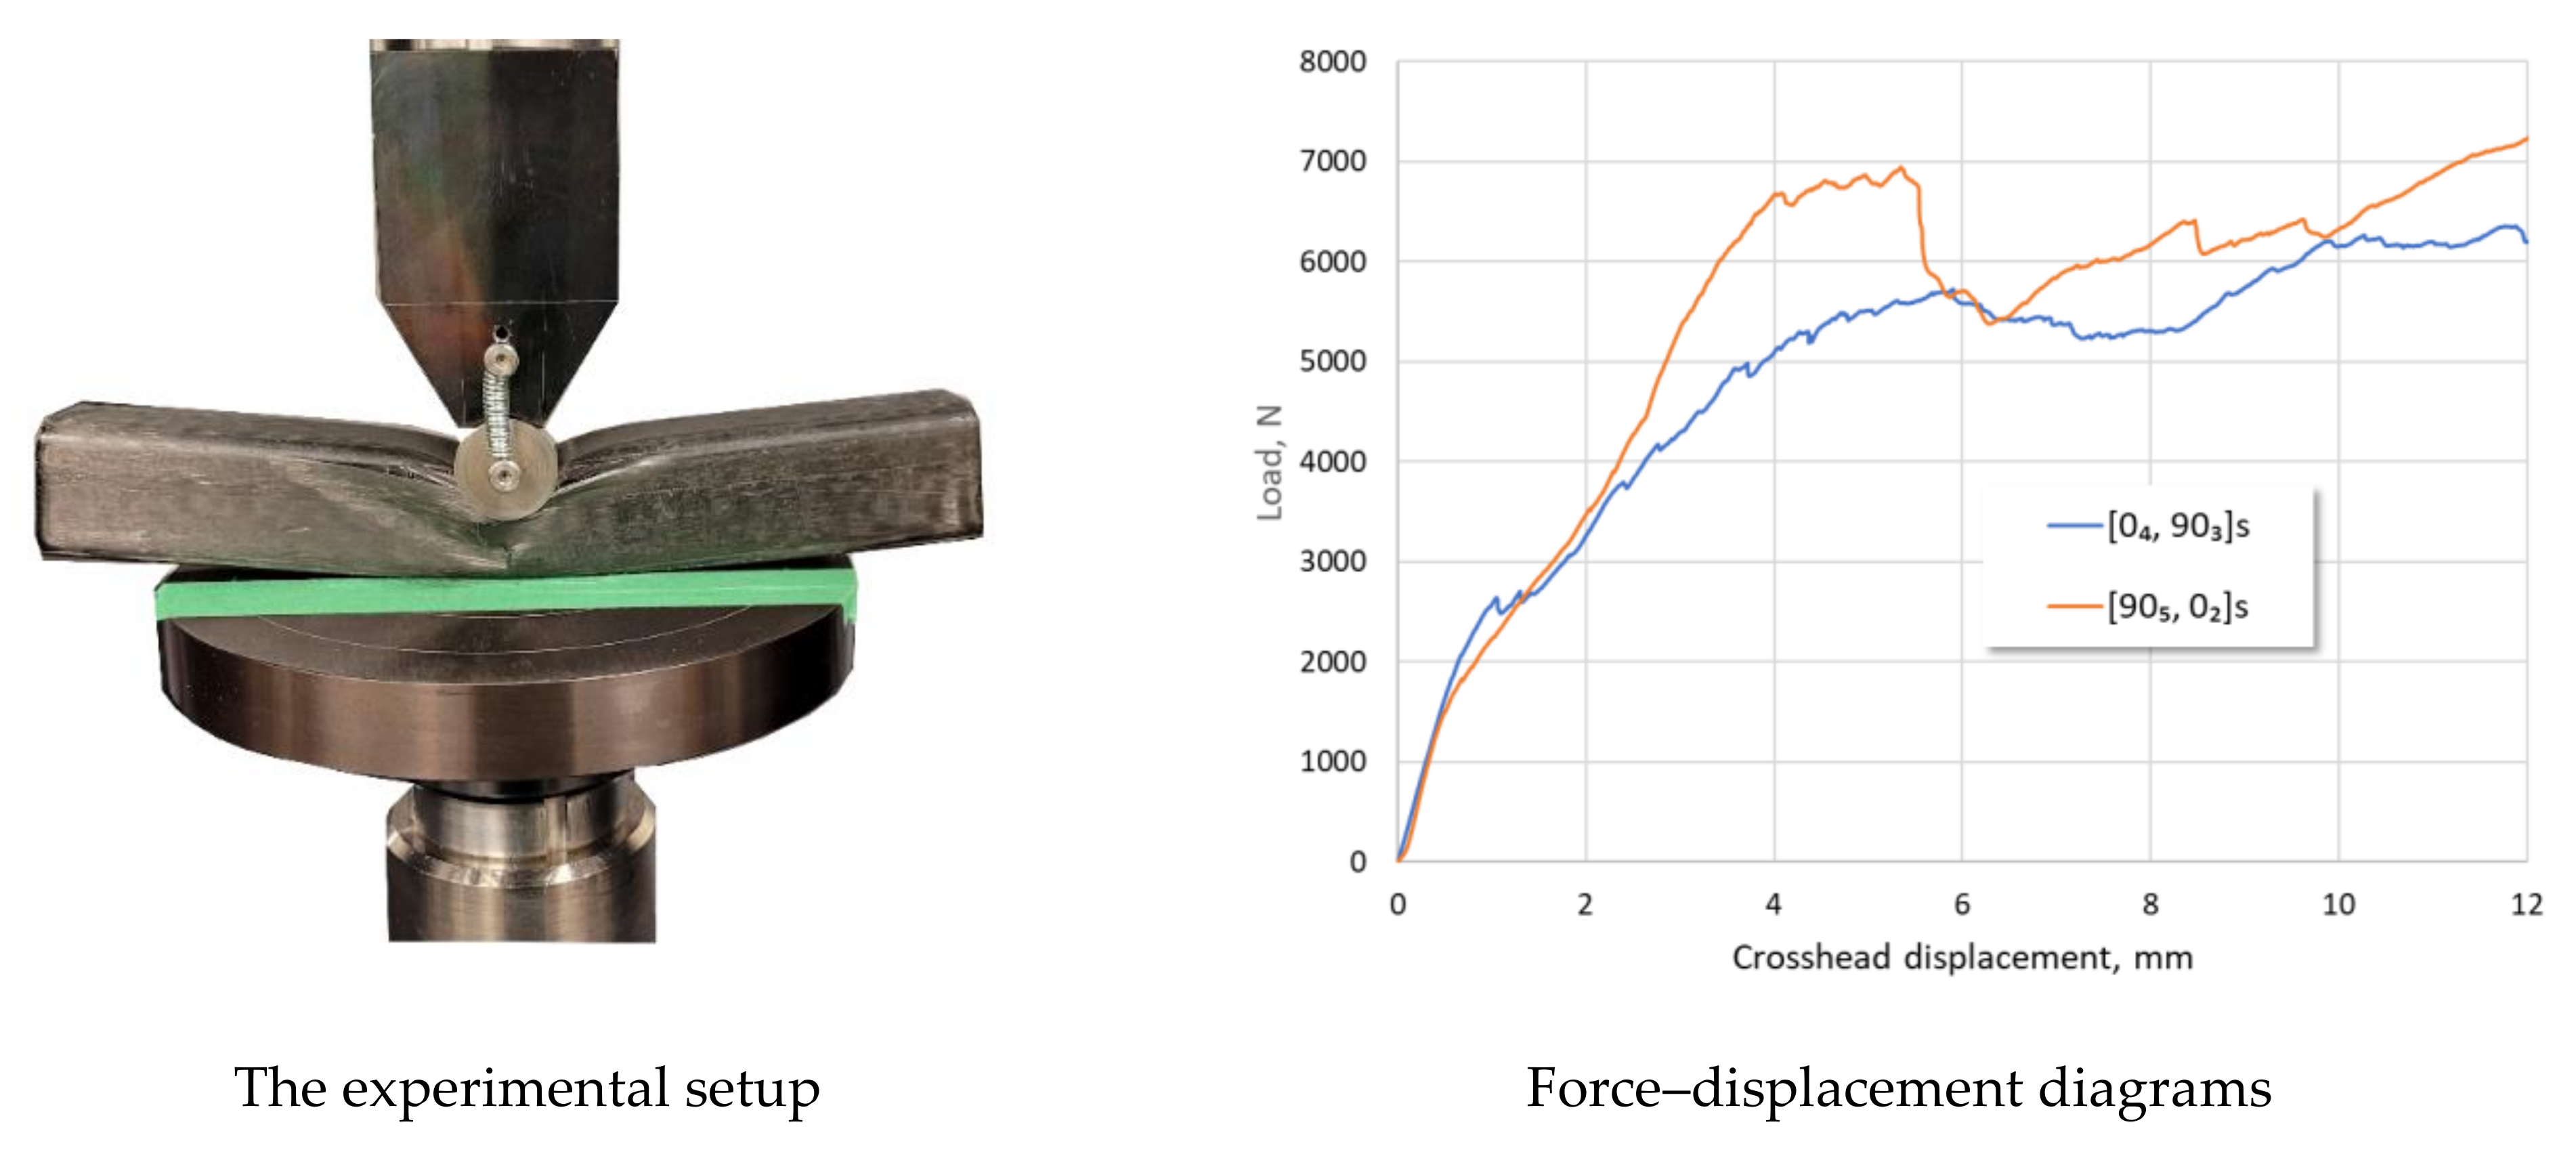
Figure 6.
Image of the crushed specimen obtained using X-ray computed tomography.

Figure 7.
Developed LS-DYNA numerical model (the quarter-model reflected to enhance representation).
Figure 7.
Developed LS-DYNA numerical model (the quarter-model reflected to enhance representation).
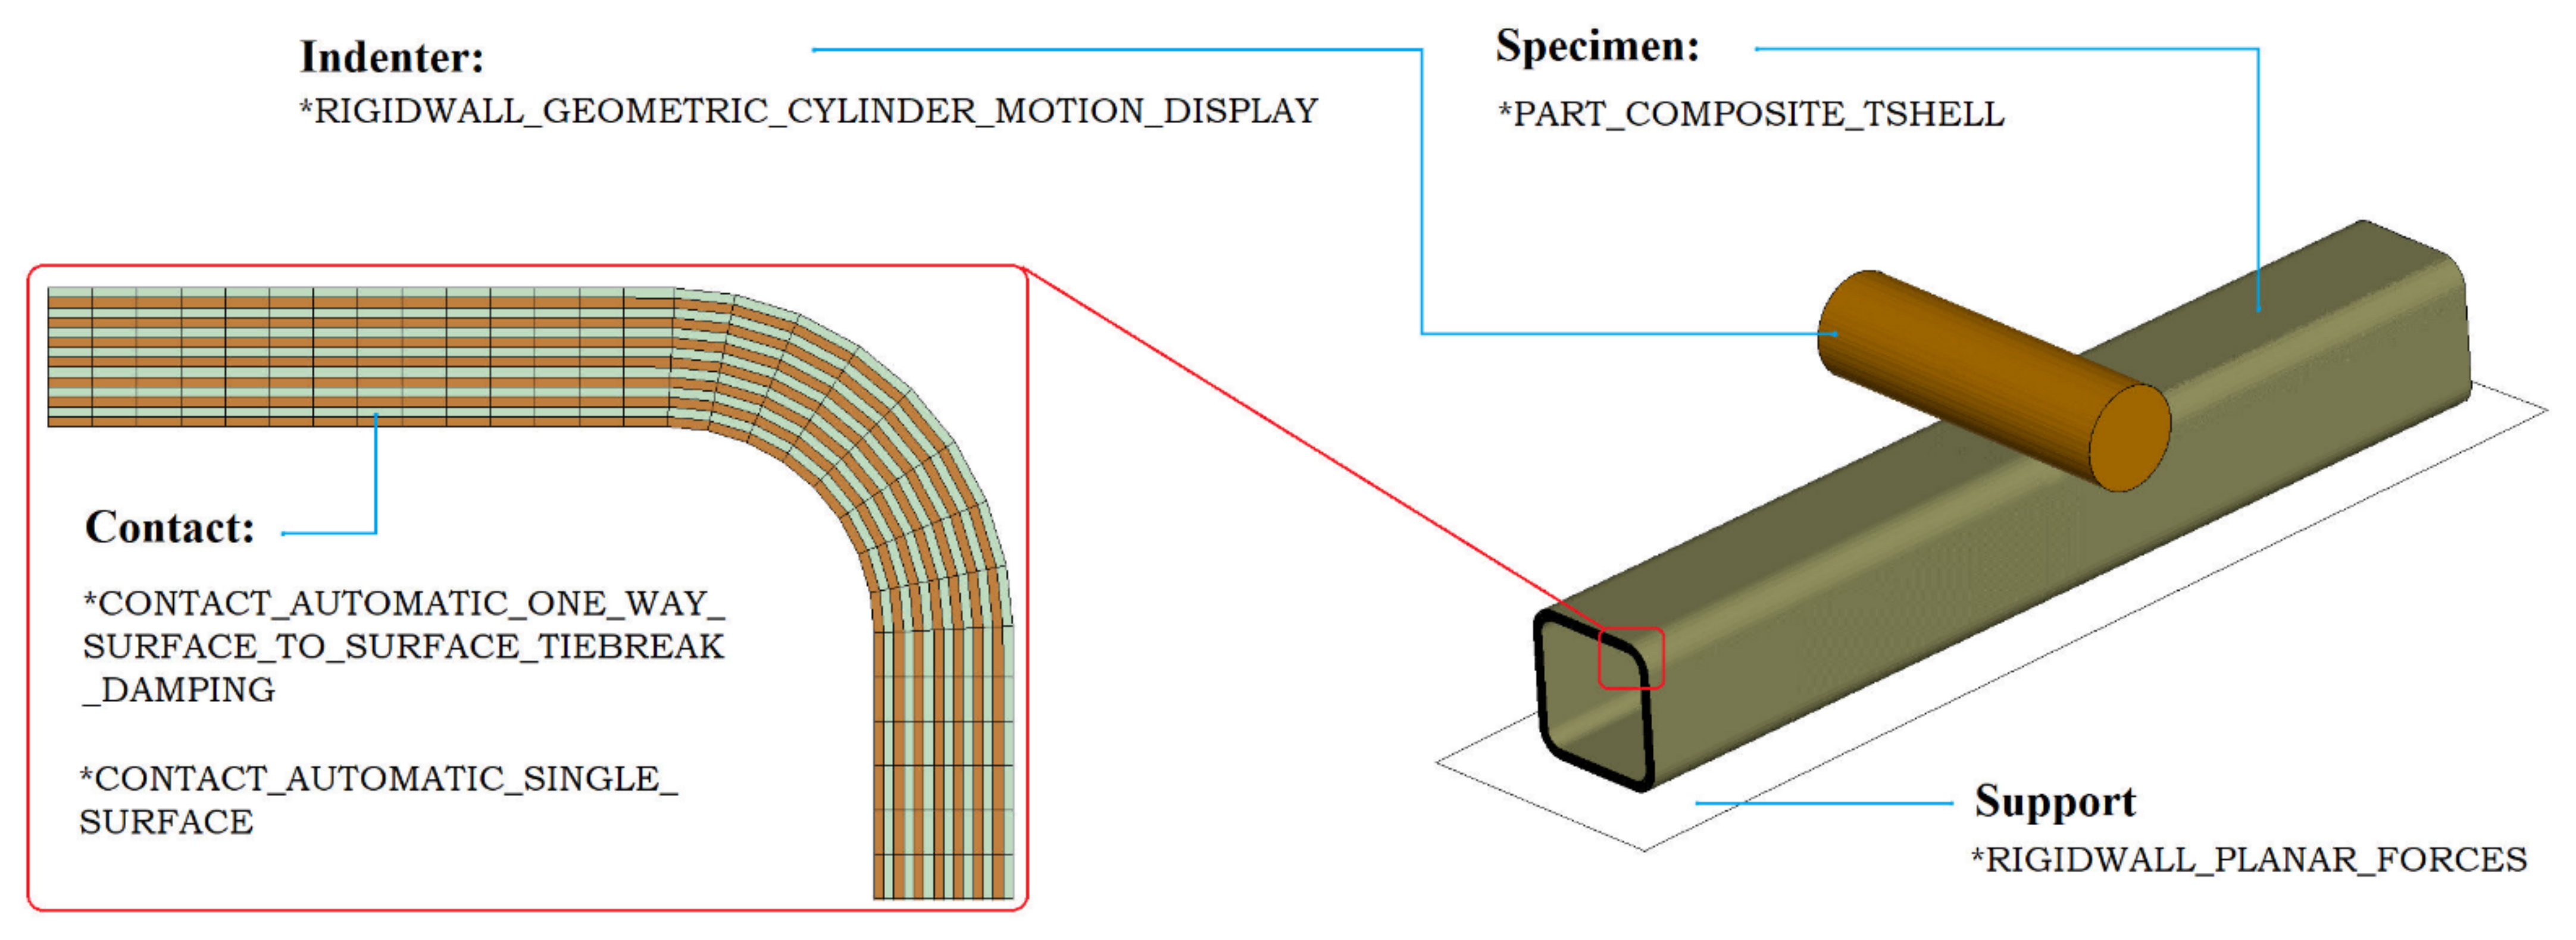
Figure 8.
Visual and predicted (MAT54) damage in the outer layer of the [04, 903]S specimen (color scheme: gray—not damaged, red—fully damaged; indenter shown for scale representation only).
Figure 8.
Visual and predicted (MAT54) damage in the outer layer of the [04, 903]S specimen (color scheme: gray—not damaged, red—fully damaged; indenter shown for scale representation only).
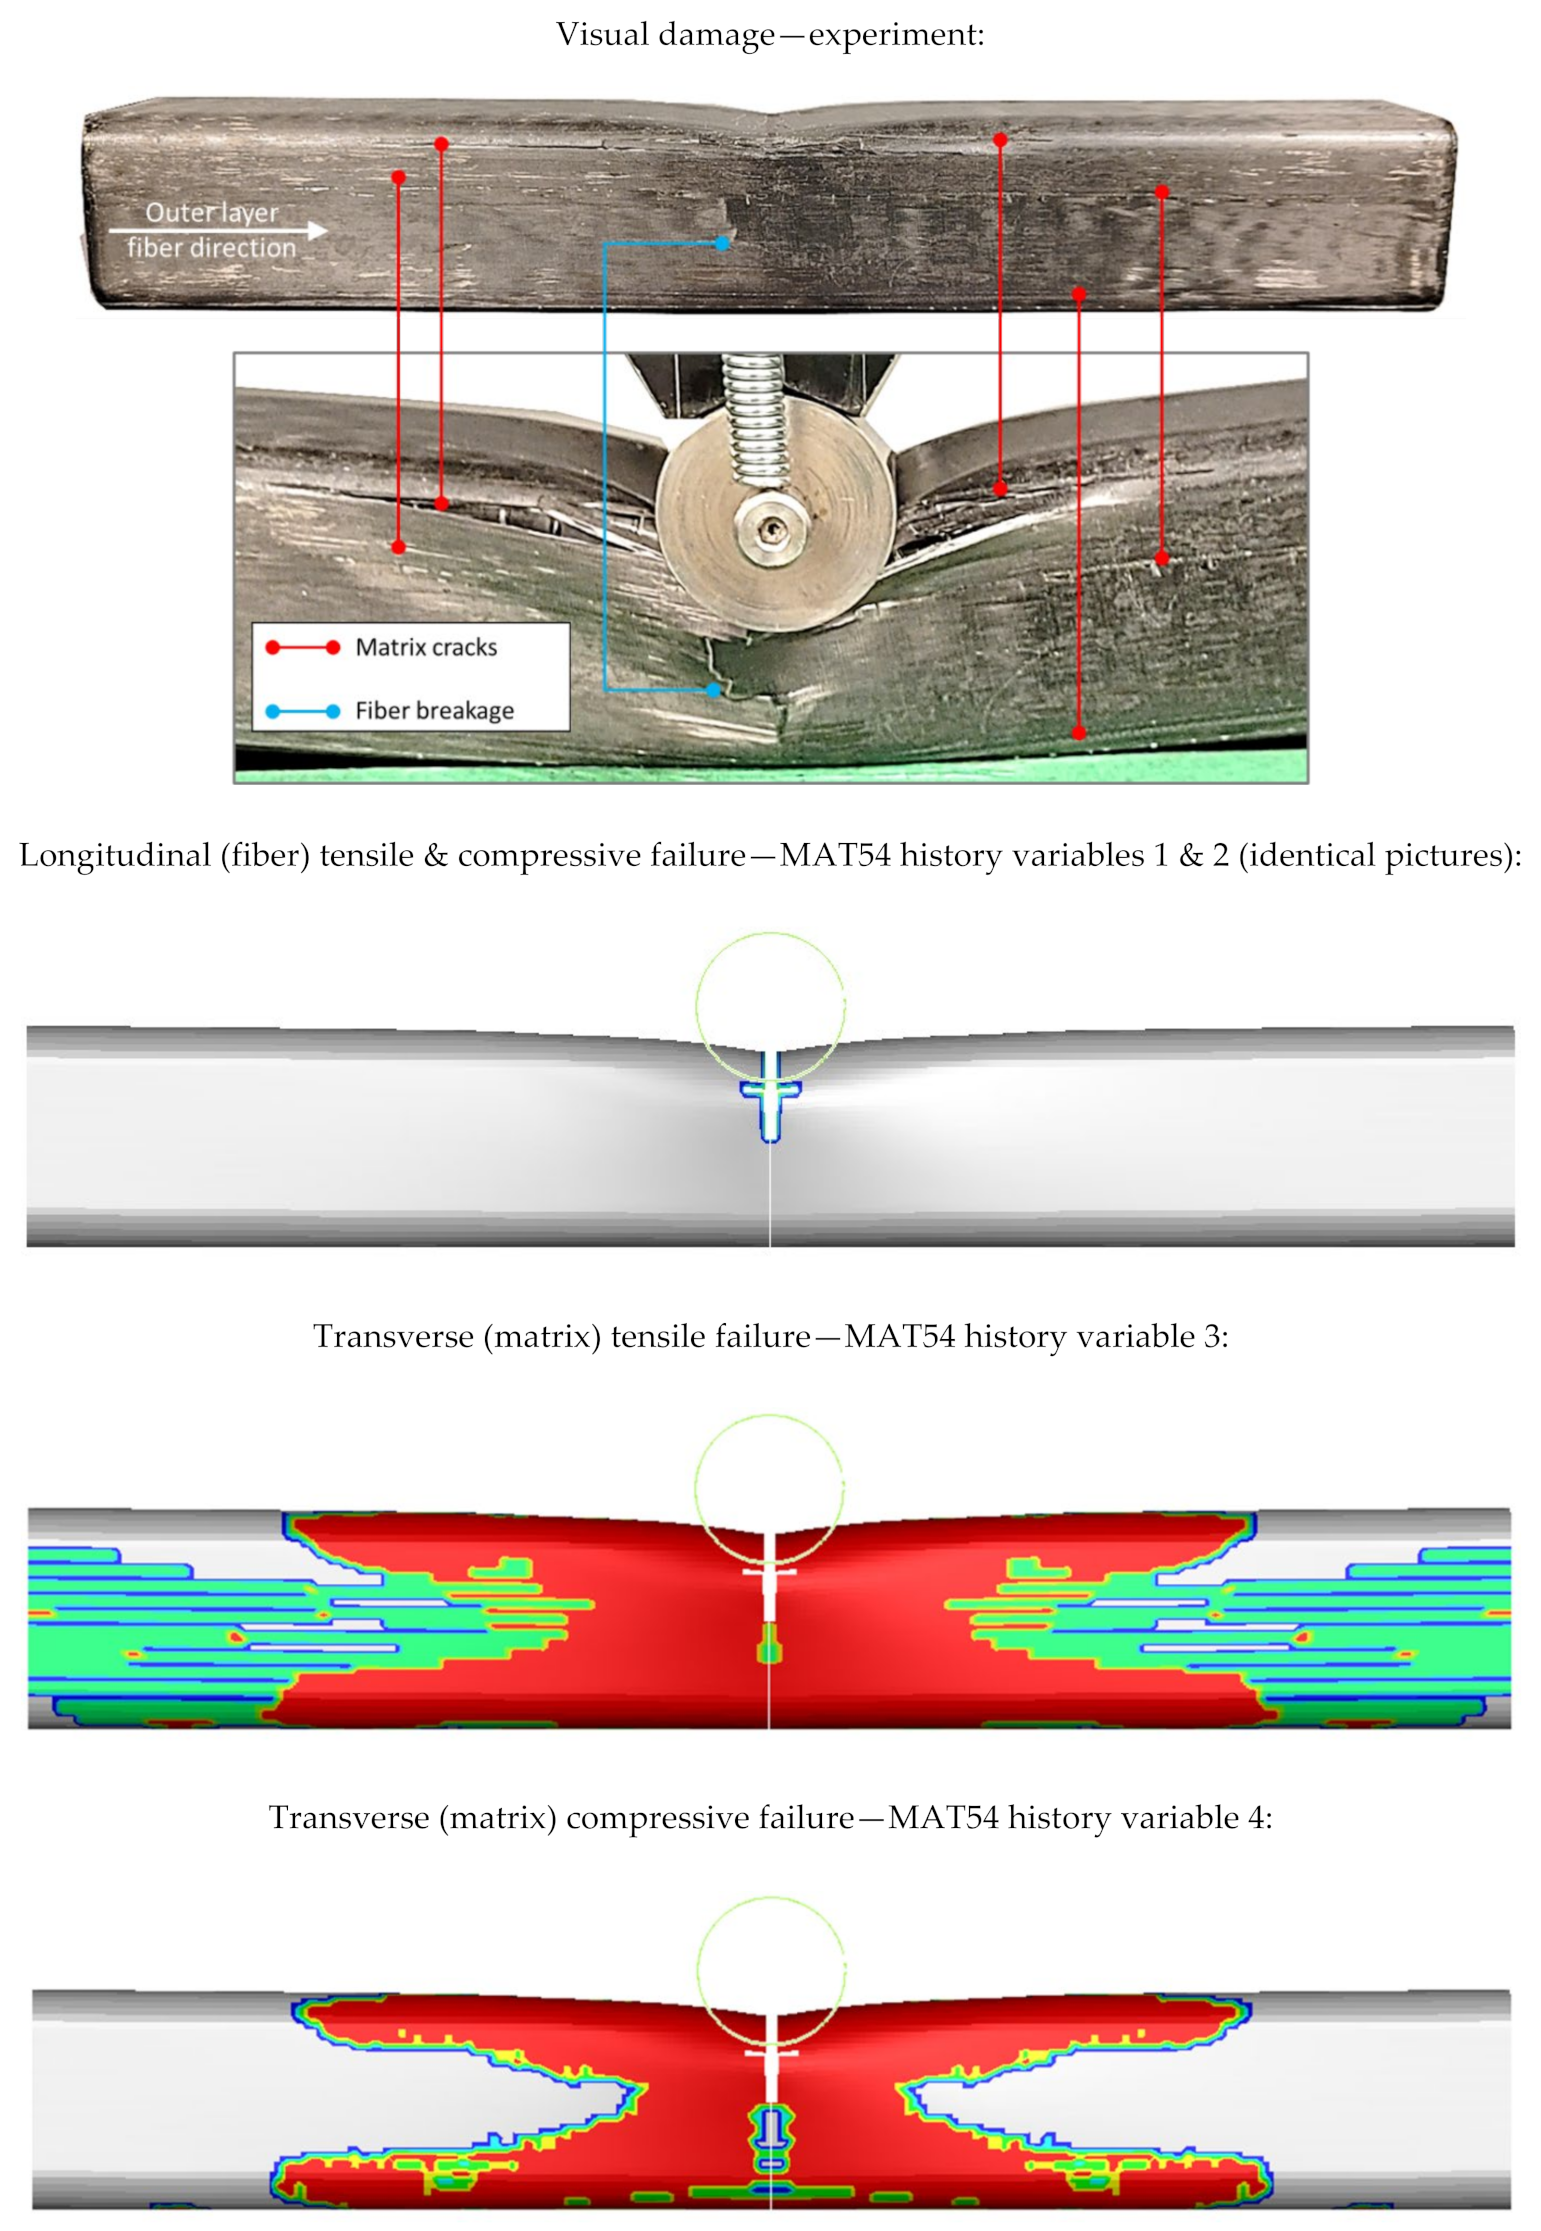
Figure 9.
MAT58 predicted damage in the outer layer of the [04, 903]S specimen (color scheme: gray—not damaged, red—fully damaged; indenter shown for scale representation only).
Figure 9.
MAT58 predicted damage in the outer layer of the [04, 903]S specimen (color scheme: gray—not damaged, red—fully damaged; indenter shown for scale representation only).

Figure 10.
Delamination in the central 100 mm-long segment of the crushed [04, 903]S specimen: CT-scan vs. numerical modeling. (a) X-ray computed tomography; (b) MAT54 model: delamination (overlayed images); (c) MAT58 model: delamination (overlayed images).
Figure 10.
Delamination in the central 100 mm-long segment of the crushed [04, 903]S specimen: CT-scan vs. numerical modeling. (a) X-ray computed tomography; (b) MAT54 model: delamination (overlayed images); (c) MAT58 model: delamination (overlayed images).

Figure 11.
Force–displacement diagrams: experiment vs. numerical modeling.

Table 1.
Parameters of the processed tests specimens for NCF mechanical characterization.
| # | Test Type | In-Plane Dimensions, mm × mm | Number of NCF Layers | Test Procedure |
|---|---|---|---|---|
| 1 | Longitudinal tensile test | 250 × 15 | 8 | ASTM D3039 [48] |
| 2 | Transverse tensile test | 175 × 25 | 14 | ASTM D3039 [48] |
| 3 | 10°off-axis tensile test | 250 × 15 | 8 | Ref [49] |
| 4 | Double-cantilever beam (DCB) test (specimen with Teflon insert) | 125 × 25 | 32 | ASTM 5528b [50] |
| 5 | End-notched flexure (ENF) test (specimen with Teflon insert) | 120 × 25 | 32 | Ref [51] |
Table 2.
Mechanical properties of the unidirectional NCF material.
| Property | Units | Mean Value |
|---|---|---|
| Longitudinal Young’s modulus, | MPa | 149,018 |
| Transverse Young’s modulus, | MPa | 6071 |
| Major in-plane Poisson’s ratio, | - | 0.32 |
| In-plane shear modulus, | MPa | 4217 |
| Longitudinal tensile strength, | MPa | 2060 |
| Longitudinal compressive strength *, | MPa | 1539 |
| Transverse tensile strength, | MPa | 29.1 |
| Transverse compressive strength *, | MPa | 126.6 |
| In-plane shear strength, | MPa | 44.5 |
| Longitudinal tensile strain-at-failure, | % | 1.37 |
| Transverse tensile strain-at-failure, | % | 0.40 |
| In-plane shear strain-at-failure, | % | 1.71 |
| Mode I strain energy release rate, GIc | 0.66 | |
| Mode II strain energy release rate, GIIc | 2.77 | |
| Shear stress at onset of non-linearity | MPa | 30 |
| Shear strain at onset of non-linearity | % | 0.711 |
Table 3.
The non-physical parameters for MAT 54.
| Parameter | Meaning | Units | Value | Comment for the Chosen Initial Value |
|---|---|---|---|---|
| DFAIL | Maximum strains for directional straining at which element will be eroded. | mm/mm | – | Disabled to control elements’ erosion by timestep (TFAIL) and effective strain (EPS) only. |
| TFAIL | Element is deleted when its time step is smaller than the given value. | s | 10−7 | Element is deleted when current timestep is less 10−7s |
| EPS | Effective failure strain | mm/mm | 0.55 | Chosen as to be significantly higher than any directional strain at failure initiation, as used in [12] |
| SOFT | Softening reduction factor for material strength in crash front elements | – | 0.90 | Slight (10%) reduction of strength in crashfront elements is assumed |
| SOFT2 | Optional transverse softening reduction factor | – | no input | Softening is assumed to be isotropic |
| PFL | Percentage of layers which must fail until crash front is initiated | – | 100 | Default value |
| BETA | Weighting factor for shear term in tensile fiber mode (see Equation (1)) | – | 0 | No effect of shear stresses on fiber tensile failure (max stress criterion), which usually provides good agreement with experimental data. |
| SLIMT1 | Factor to determine the minimum stress limit after stress maximum (fiber tension). | – | 0.010 | Small but non-zero residual strength is assumed after tensile failure to avoid numerical instabilities |
| SLIMC1 | Factor to determine the minimum stress limit after stress maximum (fiber tension). | – | 0.375 | A post-calibration value obtained in [12] |
| SLIMT2 | Factor to determine the minimum stress limit after stress maximum (matrix tension). | – | 0.010 | Small but non-zero residual strength is assumed after tensile failure to avoid numerical instabilities |
| SLIMC2 | Factor to determine the minimum stress limit after stress maximum (matrix compression). | – | 0.375 | A post-calibration value obtained in [12] |
| SLIMS | Factor to determine the minimum stress limit after stress maximum (shear). | – | 1.000 | A recommended value [54] |
| FBRT | Reduction factor for fiber tensile strength after matrix compressive failure | – | 0 | A zero effect of transverse matrix cracking on fiber tensile strength is assumed |
| YCFAC | Reduction factor for compressive fiber strength Xc after matrix compressive failure | – | 12 | Assume no influence of the matrix failure on the longitudinal compressive strength |
Table 4.
The non-physical parameters for MAT 58.
| Parameter | Meaning | Units | Value | Comment for the Chosen Initial Value |
|---|---|---|---|---|
| TFAIL | Timestep for automatic element deletion | s | 10−7 | Element is deleted when current timestep is less 10−7 s |
| ERODS | Maximum effective strain for element failure. If lower than zero, element fails when the effective strain calculated from the full strain tensor exceeds ERODS | mm/mm | −0.55 | Chosen as to be significantly higher than any directional strain at failure initiation |
| SOFT | Softening reduction factor for material strength in crash front elements | – | 0.90 | Slight (10%) reduction of strength in crashfront elements is assumed |
| SLIMT1 | Factor to determine the minimum stress limit after stress maximum (fiber tension) | – | 0.010 | Small but non-zero residual strength is assumed after tensile failure to avoid numerical instabilities |
| SLIMC1 | Factor to determine the minimum stress limit after stress maximum (fiber tension). | – | 0.375 | A post-calibration value obtained in [12] |
| SLIMT2 | Factor to determine the minimum stress limit after stress maximum (matrix tension) | – | 0.010 | Small but non-zero residual strength is assumed after tensile failure to avoid numerical instabilities |
| SLIMC2 | Factor to determine the minimum stress limit after stress maximum (matrix compression) | – | 0.375 | A post-calibration value obtained in [12] |
| SLIMS | Factor to determine the minimum stress limit after stress maximum (shear) | – | 1.000 | A recommended value [54] |
Table 5.
Input data for *CONTACT_AUTOMATIC_ONE_WAY_SURFACE_TO_SURFACE_TIEBREAK.
| Property | Unit | Value | Rationale |
|---|---|---|---|
| NFLS | MPa | 75.00 | The ultimate strength of bulk epoxy resin multiplied by a scaling factor of 0.95 to account for the mesh dependency (see the recommendation provided in [57] for meshes with element sizes of 0.7 mm). |
| SFLS | MPa | 43.30 | Assumed as (von Mises criterion) |
| G_Ic | 0.66 | Measured experimentally, see Table 1 | |
| G_IIc | 2.77 | Measured experimentally, see Table 1 | |
| CN | MPa/mm | 200,000 | CN = Eepoxy/δRRR, where Eepoxy is the Young’s modulus of epoxy matrix (~3650 MPa) and δRRR is the thickness of the interlaminar resin-rich region (typically within 0.01 and 0.10 mm). Thus, the lower and upper bounds for CN correspond to 36,500 MPa/mm and 365,000 MPa/mm, accordingly. This averages to 200,000 MPa/mm as an estimate for the CN parameter. |
| CT2CN | - | 0.37 | CT2CN = CT/CN = Gepoxy/Eepoxy = 1/2 × (1 + νepoxy), where Gepoxy and νepoxy are the shear modulus and the Poisson’s ratio (~0.35) of epoxy resin, correspondingly. |
Publisher’s Note: MDPI stays neutral with regard to jurisdictional claims in published maps and institutional affiliations. |
© 2022 by the authors. Licensee MDPI, Basel, Switzerland. This article is an open access article distributed under the terms and conditions of the Creative Commons Attribution (CC BY) license (https://creativecommons.org/licenses/by/4.0/).
Share and Cite
MDPI and ACS Style
Kazemian, M.; Cherniaev, A. Prediction of Damage in Non-Crimp Fabric Composites Subjected to Transverse Crushing: A Comparison of Two Constitutive Models. J. Compos. Sci. 2022, 6, 224. https://doi.org/10.3390/jcs6080224
AMA Style
Kazemian M, Cherniaev A. Prediction of Damage in Non-Crimp Fabric Composites Subjected to Transverse Crushing: A Comparison of Two Constitutive Models. Journal of Composites Science. 2022; 6(8):224. https://doi.org/10.3390/jcs6080224
Chicago/Turabian StyleKazemian, Milad, and Aleksandr Cherniaev. 2022. "Prediction of Damage in Non-Crimp Fabric Composites Subjected to Transverse Crushing: A Comparison of Two Constitutive Models" Journal of Composites Science 6, no. 8: 224. https://doi.org/10.3390/jcs6080224