
Energy Harvesting Using a Stacked PZT Transducer for Self-Sustainable Remote Multi-Sensing and Data Logging System


Department of Electrical and Computer Engineering, The University of Texas at San Antonio, 1 UTSA Circle, San Antonio, TX 78249, USA
*
Author to whom correspondence should be addressed.
J. Compos. Sci. 2022, 6(2), 49; https://doi.org/10.3390/jcs6020049
Submission received: 15 December 2021
/
Revised: 29 January 2022
/
Accepted: 2 February 2022
/
Published: 6 February 2022
Abstract
:The work discussed is developing a self-sustainable low-power remote multi-sensing and data logging system for traffic sensing. The system is powered by the energy harvested using a stacked PZT (Lead zirconate titanate) transducer from the mechanical vibration from the vehicles passing over roads. The system is capable of multi-sensing functionality, logging the sensor data, and wirelessly transferring sensory data to an end-user device. Various power management techniques and engineering applications were made to achieve low power operation of the system while maintaining the full functionality and the accuracy of the sensor data. The energy harvester used is a custom-designed and fabricated stacked piezoelectric transducer optimized for maximum energy harvesting from the mechanical vibration from roadway traffic. A custom-built AC to DC converter is used to convert the harvested energy into useable electrical power. The system was tested under various experimental setups yielding satisfactory data accuracy while operating at low power. The system also successfully transferred sensor data remotely. All these features make the system self-sustainable and suitable for remote sensing applications without a conventional power source.
1. Introduction
The importance of alternative energy sources to power various electronics devices is prevailing to reduce the environmental impact of using fossil fuels. Some special measures are being taken which include the use of more environmentally friendly energy sources and simultaneously developing devices and systems capable of running at low power to adapt to these sources. Contemporary alternative energy sources have limited energy generation capability and their energy generation depends on external factors. Therefore, the systems and devices are needed to operate at low power to be powered by alternative energy sources. Concurrent remote sensing systems cannot reliably run using alternative energy sources. Developing sensing systems capable of running at low power can resolve this issue when powered by alternative energy sources. Disposing of batteries causes a huge environmental impact because of their toxic contents. Moreover, improper disposal of batteries can cause fires, putting people, and property at risk [1]. Most remote sensing systems are powered by either batteries or conventional power sources. Powering these systems with alternative energy sources will prolong the life of batteries and hence, will decrease the production of waste from battery disposals. Some researchers are working on deploying artificial intelligence in IoT (Internet of things) devices that require huge processing power leading to reduced battery life [2]. Such IoT devices, if powered by alternative energy sources, can solve this issue by replacing batteries or prolonging battery life.
Remote sensing and data logging are used in various applications in both industries and research alike due to the usefulness of real-time monitoring and data storage for analysis [3,4]. Remote sensing is rapidly creating its place in various applications. With the advent of advanced technologies in remote sensing, it is imperative to consider alternative energy sources to power remote sensing systems. It will also facilitate deploying such systems in adverse and non-reachable locations to collect valuable data ensuring sustainable energy supply to power the remote sensing systems.
Weigh-in-motion (WIM) is the technology used to overcome the limitations of static weighing scales. These systems are used to estimate the weight of the vehicles while they are traveling at high velocities. But the most fatal weakness of WIM systems is the limitation of the accuracy of load identification. Smart traffic monitoring is growing in demand as part of the smart city concept around the world. However, this requires a sophisticated and interconnected network of sensors and control units all around the city generating continuous data to be stored and analyzed in real-time. This setup is not only complicated to coordinate but also requires large energy consumption to maintain this system. Thus, utilizing alternative energy sources to power such networks is imperative for energy conservation and expanding the use of alternative energy sources. One such alternative energy source is the mechanical vibrations of the vehicles on the roadways. Piezoelectric transducers can be used to efficiently convert those mechanical vibrations into electrical power. The piezoelectric materials were earlier widely used for pressure sensing. Hence, piezoelectric transducers can also be used to sense traffic parameters acting as embedded sensors in the roads.
Zang et al. discusses a smart traffic monitoring method using embedded cement-based piezoelectric sensors to enable real-time detection of the traffic flows [5]. The proposed system addresses the issue associated with conventional WIM systems. PMN ceramic [Pb (Mg1/3Nb2/3) O3 · PbTiO3 · PbZrO3] (active phase) ceramic rods were uniformly embedded in the cement matrix. The system is composed of two weigh-beams, a data acquisition card, and a computer to record and analyze the voltage signals. A 16-bit resolution, 8-channel, 250 kbps digital data acquisition card is employed in the monitoring system. The paper reported approximately 90% accuracy in axle load sensing in comparison to about 80% accuracy obtained by WIM systems. The system, although yielding good sensing accuracy, requires an external power supply for the computer and other electronic devices associated with the system. Moreover, the energy harvesting part of the system requires a larger area of the road to be utilized for burying the PMN ceramic roads.
Tayahi et al. propose a remote sensor system powered by piezoelectric materials where they implemented low-power operation of the system by putting the sensors into sleep mode along with the communication unit [6]. They transmitted temperature and vibration data from the system by waking the sensors up after certain times. However, sustainability under continuous operation is not mentioned. This setup is not applicable for roadway traffic parameters sensing as it requires continuous sensing and hence, the sleep-mode methodology cannot be applied for traffic sensing. Sharma et al. mention a cantilevered plate-based piezoelectric energy generator (PEG) using MEMS devices [7]. However, the power generated by this PEG, which is 155.2 μW, is not sufficient to power a multi-sensing system. Several methods have been proposed in previous years for the generation of energy. These methods include harvesting energy with electrostatic, electromagnetic, piezoelectric, and thermoelectric transduction with a sufficient amount of energy generated to power the sensor nodes in wireless sensor networks or to enable the transmission of data. Most of these are a part of vibrational harvesters which operate at more than 100 Hz of frequencies [7]. These ranges of frequencies are rarely found on roadway traffic and hence are not suitable choices for road traffic sensing applications. Moreover, among the methods mentioned above, piezoelectric energy harvesting is considered the best alternative to generate power because of its better coupling properties.
State of the art focuses on energy harvesting using PEGs and none mentions a fully functional remote sensing system. Consequently, there remains a huge gap in the knowledge of developing a fully functional remote multi-sensing system powered by alternative energy sources. This paper discusses the research that focuses on filling this gap by successful design, development, and testing of a remote sensing and data logging system that is capable of being powered solely by alternative energy sources that can be cyclic or non-cyclic. Piezoelectric devices are used as transducers harvesting energy from the mechanical vibration from the roadway caused by vehicles passing over. The system was tested under an electromechanical testing platform and also using custom generated electrical signals from a signal generator that replicates a piezoelectric signal generated by the stress when subjected to vehicle pressure. The system consists of four essential functional blocks, these are piezoelectric transducer as the energy harvester which converts the mechanical vibrations into electrical power, AC-to-DC energy converter responsible for collecting maximum charges from the piezoelectric signals, microcontroller-based data acquisition, and power management block, and wireless communication block consisting of Bluetooth module.
2. Methodology
2.1. Brief Descriptions of the Functional Blocks of the System
- Energy harvester: The energy harvester is a custom-designed stacked piezoelectric transducer that harvests the mechanical vibrations caused by the roadway traffic into electrical power. Piezoelectric materials have the intrinsic property of generating surface charges while subjected to stress and strain. Based on this property, piezoelectric materials are used as energy harvesters and sensors as well. Lead Zirconate Titanate (PZT) material was used to fabricate the transducer. The custom-fabricated stacked PZT transducer is the PEG used to generate the necessary power to run the remote multi-sensing system.
- AC-DC energy converter: The signal generated from the stacked PZT transducer is intrinsically a damped sinusoid signal with high amplitude and having multiple consecutive peaks. To charge the charge storage device, which is a rechargeable battery pack, this damped sinusoid signal must be converted into a useful DC signal. However, the prime objective of the energy converter is to collect maximum charges generated by the stacked PZT transducer in both the positive and negative cycles of the input signal. The converter can be modified to convert signals from a non-cyclic alternative energy source such as Thermoelectric Generator (TEG).
- Sensory data acquisition and power management: The sensory data acquisition, computation, and power management are done by a microcontroller that carries the program to control the connected hardware of the system and also conducts the power management to run the system at low power. The microcontroller performs software-driven hardware control, data acquisition, data linearization, data storage, and data transmission using wireless communication. Several communication protocols are incorporated in the program to establish communication between peripheral devices dedicated to particular functions. For instance, the Serial Peripheral Interface (SPI) protocol was used by the microcontroller to establish communication with the micro SD card and the Bluetooth module.
- Wireless communication using Bluetooth module: A Bluetooth module called HC-06 is used as the module for wireless communication. Aforementioned, the module is connected to the microcontroller using Serial Peripheral Interface (SPI) protocol which allows the I/O pins of the microcontroller to act as a serial bus for data transfer. The HC-06 module has a range of 10 m and runs at low power based on Bluetooth Low Energy (BLE) technology. An app on an Android device such as a tablet or phone can display the data stored in the micro SD card.
2.2. Fabrication of the Stacked PZT Based Transducer
A custom-designed stacked piezoelectric transducer was used to harvest energy from the mechanical vibration caused by the vehicles passing over the roadway. To understand piezoelectric materials, explaining the concept of the piezoelectric effect is imperative. The generation of electrical charges in response to applied mechanical stress is known as the direct piezoelectric effect while the generation of mechanical strain in response to electrical charges is known as the converse piezoelectric effect [8,9]. The electromechanics underlying the direct piezoelectric and converse piezoelectric effects can be best explained with Equations (1) and (2).
where x is the mechanical strain (m/m), E is the electric field (V/m) and in Equation (2), P represents electric displacement (C/m2) and X is the stress (N/m2). In both equations, d is the piezoelectric coefficient [C/N or m/V] which determines the sensitivity of the response of the sample under stress or in an applied electric field [9]. These relationships of piezoelectric materials can be utilized to make piezoelectric materials function as energy harvesters.
Direct piezoelectric effect: Pi = dkijXjk
Converse Piezoelectric effect: xij = dijkEk
Lead Zirconate Titanate (PZT) was the piezoelectric used to fabricate the transducer [8]. PZT (Lead Zirconate Titanate) materials are now of particular interest for harvesting energy because these materials have more integration potential, high energy densities, high electromechanical coupling coefficient (represented by K = 0.75), require no external voltage sources, and are pollution-free. These materials can withstand a large amount of strain. Polycrystalline ferroelectric ceramics such as barium titanate (BaTiO3) and lead zirconate titanate (PZT) exhibit larger displacements when deformed or induce larger electric voltages when compressed and hence are best choices for PEGs. Materials with a high dielectric constant and an inherent directional quality can be made to produce surface charges or electrical polarization by applying mechanical stress.
The stacked PZT transducer was fabricated for optimized energy harvesting [9] and it was compared with various other piezoelectric transducers in terms of energy generation capability. The testing and evaluation of three types of stacked PZT transducers were conducted; 1:3 composite stacked PZT transducer, specially designed and fabricated stacked PZT transducer, and a commercially available stacked sample. Due to the high piezoelectric constant, PZT-5H material samples were chosen to fabricate the stacked PZT transducer. PZT-5H is used for high permittivity, high coupling, and sensitivity. The fabricated transducer gave maximum power density per unit transducer volume, measured 0.615 mW/mm3 at 965 kN/m2 (140 psi) [9]. The 1:3 composite stacked sample proved to be the best performer in terms of power density per unit active volume. Considering power density per unit transducer volume as the more appropriate way of determining the type of stacked transducer to be used, the fabricated stacked PZT transducer was chosen to be used for this research.
Figure 1a shows the block design of the assembled stacked PZT transducer. The transducer consisted of 21 active plates and one insulating plate (black). Each PZT plate was of a length and width of 20 mm and a thickness of 2 mm. To ease the alignment issues during fabrication, the stacks were first built in separate 10 and 11 plates and then combined as shown in Figure 1b. Indium was chosen as the electrode bonding between the plates and is connected in a way forming parallel connections between the plates. The final fabricated stacked PZT transducer is shown in Figure 1c, dimensions, h = 50 mm, l = w = 20 mm [9]. To characterize the transducer in detail a d33 m was used to measure the piezoelectric constant and was found to be 840 pC/N. The elastic modulus of the PZT-5H was taken to be 66 GPa.
A study of the electrical and mechanical degradations of the transducer under repetitive cyclic load similar to that of the traffic stress conditions was tested to determine the sustainability of the stacked PZT transducer. This is done by replicating traffic loading and frequency conditions conducted by uniaxial compression tests in an MTS Acumen electromechanical testing platform applying forces in the range 50 N to 600 N at a frequency of 10 Hz over a total number of cycles ranging from a few thousand cycles to 2 × 10⁶ cycles. The tests were conducted on electrical series and parallel connected stacked PZT plates where each PZT plate has dimensions 20 mm × 20 mm × 2 mm. Pole et al. mentioned in the results that the stacked PZT plates that are connected in parallel exhibit better electrical output on a repetitive number of compression load cycles but undergo higher degradation of 11% compared to 3% for the stack with the PZT plates connected in series [10]. There was no piezoelectric coefficient change or visible mechanical degradation. There may be some surface crack possibilities however, the stress from the roadways decreases as it travels deeper into the surface. This means that in real conditions, the equivalent road pressure on the buried stacked PZT transducer will not be high enough to cause significant mechanical degradation of the stacked PZT transducer.
The three main design decisions for how fasteners will be implemented on the housings of the stacked PZT transducer are the magnitude of the pre-stress to apply, the number of fasteners, and the spring constant. These effects were studied by experimenting with PZT-5H and PZT-5A samples, a fixture that holds the sample between two steel plates and compresses the sample with steel springs [11]. The fixture replicates the casting that is held together with eight steel fasteners because steel fasteners behave as linear elastic springs. The experiment aimed at finding out the effects of spring constant, pre-stress, and numbers of fasteners on the power generation output of the stacked PZT transducer. The experiment was conducted by subjecting the fixture holding the sample to a sinusoidal force in the range of 50–1050 N at a frequency of 50 Hz. MTS Acumen electromechanical testing platform was used to apply the input force on the fixture. The obtained results showed a non-linear relationship between the applied pre-stress and power generation output. The maximum power generation output is found to be at 26 MPa pre-stress and it is the pre-stress maintained in the final design. It was also found that 8 fasteners yielded more power generation than 4 fasteners. It was concluded that the maximum power generation occurs at 19.07 MPa pre-stress with 8 fasteners in place. The final design of the prototype of the enclosure housing the stacked PZT transducer maintained the experimentally found optimum pre-stress and number of fasteners. This is achieved by fabricating an enclosure consisting of two steel plates of dimensions 6″ × 6″ with the stacked PZT transducer placed in the middle in between the plates. The top and the bottom plates are then fastened together by 8 fasteners on the sides. Thus, the sides of the top plate are held fixed in the X and Y directions such that the top plate can only move downward. Figure 2 shows the illustration of the top view and the custom-built enclosure housing the stacked PZT transducer.
2.3. Design of AC to DC Energy Converter for the Stacked PZT Transducer
To ensure maximum charge collection from the transducer and conversion to DC power, a highly efficient converter was built based on the Voltage-doubler circuit principle. The Thevenin equivalent circuit of the stacked PZT transducer as derived from the lumped electrical modeling (LEM) is depicted in Figure 3. The SPICE (Simulation Program with Integrated Circuit Emphasis) schematic of the designed converter is shown in Figure 4. The value of the voltage source used in the SPICE schematic is the value obtained from the experimental result. The frequency is chosen to be 10 Hz and it is the frequency at which lab tests were conducted while evaluating the stacked transducer power generation. The capacitor C1 plays an important part in matching the impedance for maximum power transfer and the value of C1 is chosen to match that of the stacked PZT transducer. Based on the maximum power transfer theorem, the converter input impendence was designed to match the intrinsic impedance of the transducer. The capacitance of the transducer was determined under experimental testing and then the capacitor C1 was selected accordingly to match them closely in values. Since the transducer generates charges in both positive and negative cycles, the capacitance at the input of the converter stores the charge in the negative cycle and delivers these stored charges along with the charges during the positive cycle into the rechargeable battery pack. The battery pack consists of three 1.2 V (3 × 1.2 V) 800 mA-hr Nickel-cadmium (Ni-Cd) batteries connected in parallel.
2.4. System Power Management Utilizing Microcontroller Internal Clock Prescaling and Sequential Hardware Switching
2.4.1. Prescaling of the Internal Clock Frequency of the Microcontroller to Reduce Power Consumption
The microcontroller used in the system is ATMega328 based Arduino Pro Mini microcontroller. The microcontroller carried out sensing data collection, data processing, data storage, and serial data transfer with the Bluetooth module. Hence, the microcontroller was the prime source of power consumption in the system. To reduce this power consumption, program codes for the firmware were implemented to prescale the internal clock frequency of the microcontroller by changing the registry bits [12]. As shown in Figure 5, with each selection of the prescaling bits in the registry, clock prescaling can be achieved. The internal clock speed is directly related to the amount of power consumed by the microcontroller. This fact is utilized to reduce the processing power consumption of the microcontroller while ensuring the intended operations of the microcontroller. The pre-scaler instruction codes have implemented that work by taking the basic clock frequency and dividing it by a certain value as per the configured pre-scaler register. Lowering the clock frequency by prescaling runs the microcontroller in power saving mode. Prescale factors can be set to 1, 2, 4, 8, 16, 32, 64, 128, and 256 depending on the Prescaler register bits for the basic system clock frequency. In our research, the registry bit chosen was 256 and hence the internal clock which has a default frequency of 16 MHz was prescaled to 62.5 kHz to attain a significant reduction in the processing power of the microprocessor.
Internal clock prescaling also facilitated running the microcontroller in the region of the Near Threshold Voltage (NTV) region [13] which is approximately 1.75 V. The microcontroller with clock prescaled runs successfully at DC 1.75 V supply consuming just 1.12 mW of power. However, for ensuring the proper functionality of the system, a DC 3.6 V power source was provided from a collection of three 1.2 V NiCad batteries (3 × 1.2 V = 3.6 V). The trade-off of clock prescaling is that the Serial Port Data Transfer Rate (SPDTR) needed to be adjusted for the lower clock frequency [14]. The prescaling of the basic system clock requires adjustment of SPDTR (Serial Port Data Transfer Rate) to maintain synchronization with the lowered system clock frequency. The SPDTR was altered as desired by programming to adapt to the prescale factor of the basic system clock. The default SPDTR of AVR RISC-based microcontroller boards is 9600 bps. Therefore, to cope with the prescaling of the system clock by a certain factor, the SPDTR must be increased exactly by that factor and should be calculated by multiplying the default SPDTR with the prescale factor. Reducing internal clock frequency also decreases the sampling frequency of the I/O pins of the microcontroller and hence impacted the sensing abilities that required faster sampling of the electrical parameters generated by the sensors.
2.4.2. Implementation of Sequential Hardware Switching to Cope with Energy Limitation
Another technique used to cope with the limited energy budget was to sequentially switch the hardware on and off, sensing hardware, SD card module, and Bluetooth device to reduce power consumption by the hardware. Hence, some sensing hardware such as temperature sensors was activated and deactivated periodically instead of being continuously active. Negative Temperature Coefficient (NTC) temperature sensor was used for such purpose in combination with a high resistance network drawing merely 40 μA for temperature sensing. Similarly, the micro SD card was programmed to be periodically activated to store data. The serial peripheral interfacing (SPI) technique was used for serial communication between the microcontroller and the SD card module by enabling assigned I/O pins of the microcontroller to act as serial communication ports [15]. The program worked by activating the SD card while writing the data in the DATA text file and then the text file was closed, once that is done, the SD card module was deactivated. For communication between the microcontroller and the HC-06 Bluetooth module, Inter-Integrated Circuit (I2C) serial communication protocol was used [16].
2.5. Vehicle Weight and Axle Count Sensing Using Predetermined Quantized Force-Voltage Relationship
The sensing of the weight of the vehicles and the axle count was conducted using the stacked PZT transducer as a pressure sensor since the transducer generates a voltage when subjected to mechanical stress. To attain a correct relationship between the mechanical stress and the voltage level, an experiment was conducted for a range of forces and corresponding voltages were recorded. A lookup table is then formed from the testing for various loads and implemented in the program codes. The voltage read from the transducer is converted into quantized integers and the value of the integer is then searched in the lookup table. The best-matched weight is then allocated corresponding to this value of the voltage. An illustration of the lookup table and searching mechanism is shown in Figure 6. The Axle count sensing was conducted by repeatedly sensing the voltage peaks from the transducer when a vehicle passes and using a comparison algorithm to compare the peak with a precisely determined threshold obtained from multiple lab tests with various loads. This process is illustrated in Figure 7. The completed system package is shown in Figure 8.
3. Experimental Setup
MTS Acumen Electrodynamic testing platform and a signal generator are the two platforms used to test the prototype system to validate its functionality and sensory data accuracy. The first platform is the MTS Acumen Electrodynamic testing platform shown in Figure 9. It comes with a Human Machine Interface (HMI) via a computer with a software called TestSuite installed. The movement of the crosshead is controlled using Proportional-integral-derivative (PID) control loop mechanism that takes input from the user interface executes a pre-designed program template and displays in real-time the force, stress, and displacement. A custom-designed program template is created to match the roadway force profile and frequency condition. Certain boundary limits on the values are also chosen to protect the crosshead from undergoing damage due to off-limits movement and force exertion. The controller also displays the force the crosshead is exerting, the stress, and the displacement it is causing on the enclosure housing the stacked PZT transducer.
The actuator and load cell are attached to the crosshead and is capable of large movements of approximately 1 m. The load cell is capable of a 35 mm bilateral movement meaning it can go from +35 mm to −35 mm for a full displacement range of 70 mm. The customized program templated consists of basic blocks to input force, frequency, and displacements. The procedure block is the interface to input all the necessary values of the program. These values are provided after the crosshead touches the top plate of the enclosure so that the initial positioning of the crosshead can be determined. Concerning the crosshead’s initial displacement value, the boundary limits are set up for the displacement of the crosshead. Several waveforms such as sinusoidal, sawtooth, square, and triangular can be selected for the program. Parameters of the selected waveform will be determined by the user input. The other platform used to test the functionality of the developed system is by using a signal generator. The purpose of using the signal generator is to input PZT like sinusoidal signals of high frequencies and high amplitude and observe the sensory accuracy of the system. It was assumed that certain accuracy would be lost at higher frequencies due to sampling clock frequency pre-scaling. Testing with the signal generator also validates the functionality of the system on a separate platform in addition to MTS Acumen electrodynamic testing platform.
Figure 10 and Figure 11 show the experimental setup for testing the system under the MRS Acumen Electrodynamic testing platform and the signal generator platform. The workflow during the testing under MRS Acumen is shown with arrows to give the direction of the workflow. The enclosure housing the stacked PZT transducer is put under the MTS Acumen crosshead. The TestSuite runs the custom template with user input values to exert the programmed stress at the programmed frequency. Wires from the transducer are connected to the sensing and data logging system including the Bluetooth module (Shown as the blue box in Figure 10). Once the test is completed, the SD card is removed from the SD Card module. The experimentally obtained data written through the test as a text file inside the SD card is then read in the computer to validate with estimated values. For the signal generator platform, a signal replicating that of a PZT transducer of desired amplitude and frequency is applied to the sensing and data logging system. After completion of the test, the text file containing data is checked on the computer for validation.
4. Results and Discussion
Figure 12a,b show the DATA files in the SD card for two different test setups. The first column of data in the DATA file represents axle counts, the second column represents weight, and the third column represents the pavement temperature. In the first setup, the MTS Acumen machine ran at 10 Hz frequency with 1 KN force corresponding to the weight of approximately 224 lbs. Sensor data was written on the SD card every 5 min. With this setup, the total axle count after every 5 min should be 3000 considering individual thrusts of the crosshead as an axle. Hence, the data obtained from the experiment yielded good accuracy with expected values as shown in Figure 12a,b shows the snap of the DATA file while testing the system with the signal generator with a signal amplitude corresponding to 2 KkN of force equivalent to 448 lbs and 71 Hz signal frequency with data written every 5 min. With this experimental setup, the total axle counts every 5 min should be 21,300. Once again, axle count data written in the first column of the DATA file exhibits good accuracy with the expected value.
Bluetooth communication was successfully established, the commands for reading the data on an Android device using Bluetooth are shown in Figure 13. As can be interpreted from the designated commands for the Bluetooth, pressing ‘1’ on the Android device will extract the data stored in the SD card and display them on the screen of the Android device. Pressing ‘2’ will abort the process of data transfer from the DATA file in the SD card to the Android device. Table 1 shows the hardware and the associated power consumptions for the system to run successfully. Power consumption by the system during sensing, data acquisition, data processing, and wireless transmission of data to the Android device were measured and found to be within the range of 3 mW for sensing, data acquisition, and data processing. As expected, wireless transfer of data required the highest power consumption of 15 mW for about 5–10 s. Hence, it was inferred that scheduling the communication is the most effective way to minimize power consumption. In this regard, wireless transmission of data can be scheduled to be only a few times per day and the rest of the time the data will be stored in the micro SD card.
The values obtained during the test were close to the expected sensory values. The temperature sensed by the temperature sensor was also close to the then ambient temperature of the laboratory which was 75.64 °F, yielding 98–99% accuracy. Over 95% accuracy for axle count and weight sensing was achieved which are significantly higher than contemporary systems and conventional WIMs. The average power consumption by the system was 219 mW per hour while conducting multi-sensing, data logging, and wireless transmission of data once every hour. This is certainly a significant achievement in comparison to the state-of-the-art systems mentioned earlier in terms of power consumption and the number of simultaneous sensing possible. The batteries used in the system have 800 mA-h at 3.6 V equal to 2880 mW per hour which is sufficient enough to restore operation during lack of energy from the transducer. For estimating the energy that will be generated by implementing the developed system on highways and thus validating the sustainability of the system we considered the US-59 highway as an example. Table 2 provides the traffic data of highway US-59 by the Texas Department of Transport (TxDOT). Here, ADT is average daily traffic and ADDT is average daily truck traffic. It also gives the average truck speed which is 66.5 miles per hour. Experimentally, the stacked PZT transducer generated on average approximately 0.8 mW of power at 140 PSI. From the traffic data and with the experimentally found power generation data, it can be stated that the stacked PZT transducer will generate approximately 4 W of power per day. The per-day power consumption of the sensing and data logging system is approximately 5.2 W. This consumption can be reduced by increasing the period between each wireless data transmission. Hence, it can be estimated that the power generation will be sufficient enough to replenish the battery power consumed by the sensing and data logging system.
5. Conclusions
The work presented in this paper aimed to resolve some of the most critical difficulties involving the wider use of alternative energy sources as power sources for devices and systems, remote sensing in particular. Successful design and implementation were achieved of a low-power remote sensing data logging system for roadway traffic sensing solely powered by a stacked PZT transducer acting as an energy harvester. Experimental test results proved high sensing accuracy despite operating at low power in the range of milliwatts. Road traffic axle count, vehicle weight, and pavement temperature sensing were successfully implemented and yielded good agreement with expected values. Power management through periodic hardware switching and prescaling of the microcontroller leading to low power operation was achieved. The system resolves the issues mentioned in the contemporary literature by not only achieving high sensing accuracy but also operating at low power ensuring sustainability in operation. In comparison to the harvesters for wireless networks mentioned in the literature which generate power in the microwatt range, the harvester in this research generates power in the milliwatt range. Hence, the power generated is also a significant improvement from contemporary harvesters. However the standout factor for the developed system in comparison to the state-of-the-art is the energy-efficient way of utilizing the generated power to conduct multi-sensing and wireless communication. The entire system is programmable and additional sensing capabilities can be incorporated with ease. This facilitates the adaptability of the system for multiple applications. Bluetooth communication was also successfully implemented to extract data stored in the SD card onto an Android device making the system useful for remote sensing and data logging applications in adverse and inaccessible locations. The ideas and techniques implemented in this work can be utilized in many ways for other sensing applications powered by alternative energy sources. Through this research and its impact, we envisage an entirely new generation of sensors based on the concept of low-power remote sensing powered by the energy harvested from various alternative energy sources leading to a positive impact on the environment.
Author Contributions
Conceptualization, methodology, software, validation, investigation, data curation, writing—original draft preparation, W.D.; investigation, writing—review and editing, B.G.; supervision, project administration, R.G. and A.B.; funding acquisition, R.G., and A.B. All authors have read and agreed to the published version of the manuscript.
Funding
This research was funded by the Texas State Department of Transportation, grant number #SAT0001339.
Acknowledgments
The authors would like to thank George Nall and Max Estrada for their technical contributions.
Conflicts of Interest
The authors declare no conflict of interest.
References
- Winslow, K.M.; Laux, S.J. Townsend, T.G. A review on the growing concern and potential management strategies of waste lithium-ion batteries. Resour. Conserv. Recycl. 2018, 129, 263–277. [Google Scholar] [CrossRef]
- Zhou, J.; Wang, Y.; Ota, K.; Dong, M. AAIoT: Accelerating artificial intelligence in IoT systems. IEEE Wirel. Commun. Lett. 2019, 8, 825–828. [Google Scholar] [CrossRef]
- Taraba, M.; Adamec, J.; Danko, M.; Drgona, P. Utilization of modern sensors in autonomous vehicles. In Proceedings of the 2018 ELEKTRO, Mikulov, Czech Republic, 21–23 May 2018; IEEE: Piscataway, NJ, USA, 2018; pp. 1–5. [Google Scholar]
- Kerr, J.T.; Ostrovsky, M. From space to species: Ecological applications for remote sensing. Trends Ecol. Evol. 2003, 18, 299–305. [Google Scholar] [CrossRef]
- Jinrui, Z.; Lu, Y.; Zeyu, L.; Chao, L.; Guoxing, S.; Zongjin, L. A new smart traffic monitoring method using embedded cement-based piezoelectric sensors. Smart Mater. Struct. 2015, 24, 025023. [Google Scholar]
- Tayahi, M.B.; Johnson, B.; Holtzmann, M.; Cadet, G. Piezoelectric materials for powering remote sensors. In Proceedings of the PCCC 2005. 24th IEEE International Performance, Computing, and Communications Conference, Phoenix, AZ, USA, 7–9 April 2005; IEEE: Piscataway, NJ, USA, 2005. [Google Scholar]
- Sharma, S. Piezoelectric energy harvesting in wireless sensor networks. In Proceedings of the 2015 2nd International Conference on Recent Advances in Engineering & Computational Sciences (RAECS), Chandigarh, India, 21–22 December 2015. [Google Scholar]
- Takeshi, Y.; Ueda, T.; Kitayama, T. Piezoelectricity of a high-content lead zirconate titanate/polymer composite. J. Appl. Phys. 1982, 53, 4328–4332. [Google Scholar]
- Gamboa, B.M.; Guo, R.; Bhalla, A. Stacked piezoelectric transducer evaluation and comparison for optimized energy harvesting. Ferroelectrics 2018, 535, 8–17. [Google Scholar] [CrossRef]
- Pole, M.; Gamboa, B.; Bhalla, A.; Guo, R. Degradation of piezoelectric device as an energy harvester under equivalent traffic stress condition. Ferroelectrics 2019, 540, 112–123. [Google Scholar] [CrossRef]
- Nall, G.; Gamboa, B.; Estrada, M.; Guo, R.; Bhalla, A.S. Effect of mechanical fastener induced pre-stress on power efficiency of soft PZT energy harvesters. Ferroelectrics 2020, 555, 124–131. [Google Scholar] [CrossRef]
- Longyue, Z.; Siqi, Z.; Yuepeng, Y. A novel 4/5 prescaler with automatic power down. J. Semicond. 2008, 29, 1449–1452. [Google Scholar]
- Nguyen, B.; Tang, N.; Hong, W.; Zhou, Z.; Heo, D. Clock-Voltage Co-Regulator with Adaptive Power Budget Tracking for Robust Near-Threshold-Voltage Sequential Logic Circuits. IEEE Trans. Circuits Syst. I Regul. Pap. 2019, 67, 622–633. [Google Scholar] [CrossRef]
- Ibrahim, S.K.; Hathal, H.M.; Riyadh, A.A. Baud rate variations effect on virtual channel based on PIC microcontroller. Telkomnika 2019, 17, 2755–2763. [Google Scholar] [CrossRef]
- Marinkovic, S.J.; Popovici, E.M. Nano-power wireless wake-up receiver with serial peripheral interface. IEEE J. Sel. Areas Commun. 2011, 29, 1641–1647. [Google Scholar] [CrossRef]
- Panich, S. A mobile robot with a inter-integrated circuit system. In Proceedings of the 2008 10th International Conference on Control, Automation, Robotics, and Vision, Hanoi, Vietnam, 17–20 December 2008; IEEE: Piscataway, NJ, USA, 2008. [Google Scholar]
Figure 1.
(a). Block diagram of the assembled stack, (b). PZT stacks of 10 and 11 plates, and (c). Final stacked PZT transducer.
Figure 1.
(a). Block diagram of the assembled stack, (b). PZT stacks of 10 and 11 plates, and (c). Final stacked PZT transducer.
Figure 2.
(a). Illustration of the top view of the enclosure with 8 threaded bolts acting as fasteners (b). The custom-designed and built enclosure housing the stacked PZT transducer.
Figure 2.
(a). Illustration of the top view of the enclosure with 8 threaded bolts acting as fasteners (b). The custom-designed and built enclosure housing the stacked PZT transducer.
Figure 3.
Thevenin equivalent circuit of the stacked PZT transducer.

Figure 4.
SPICE schematic of the AC to DC converter.
Figure 5.
Clock Prescaler Register of AVR RISC-based microcontroller.
Figure 6.
Predetermined payload lookup table for vehicle weight sensing.

Figure 7.
Illustration of the axle count algorithm from the signal generated by the transducer.
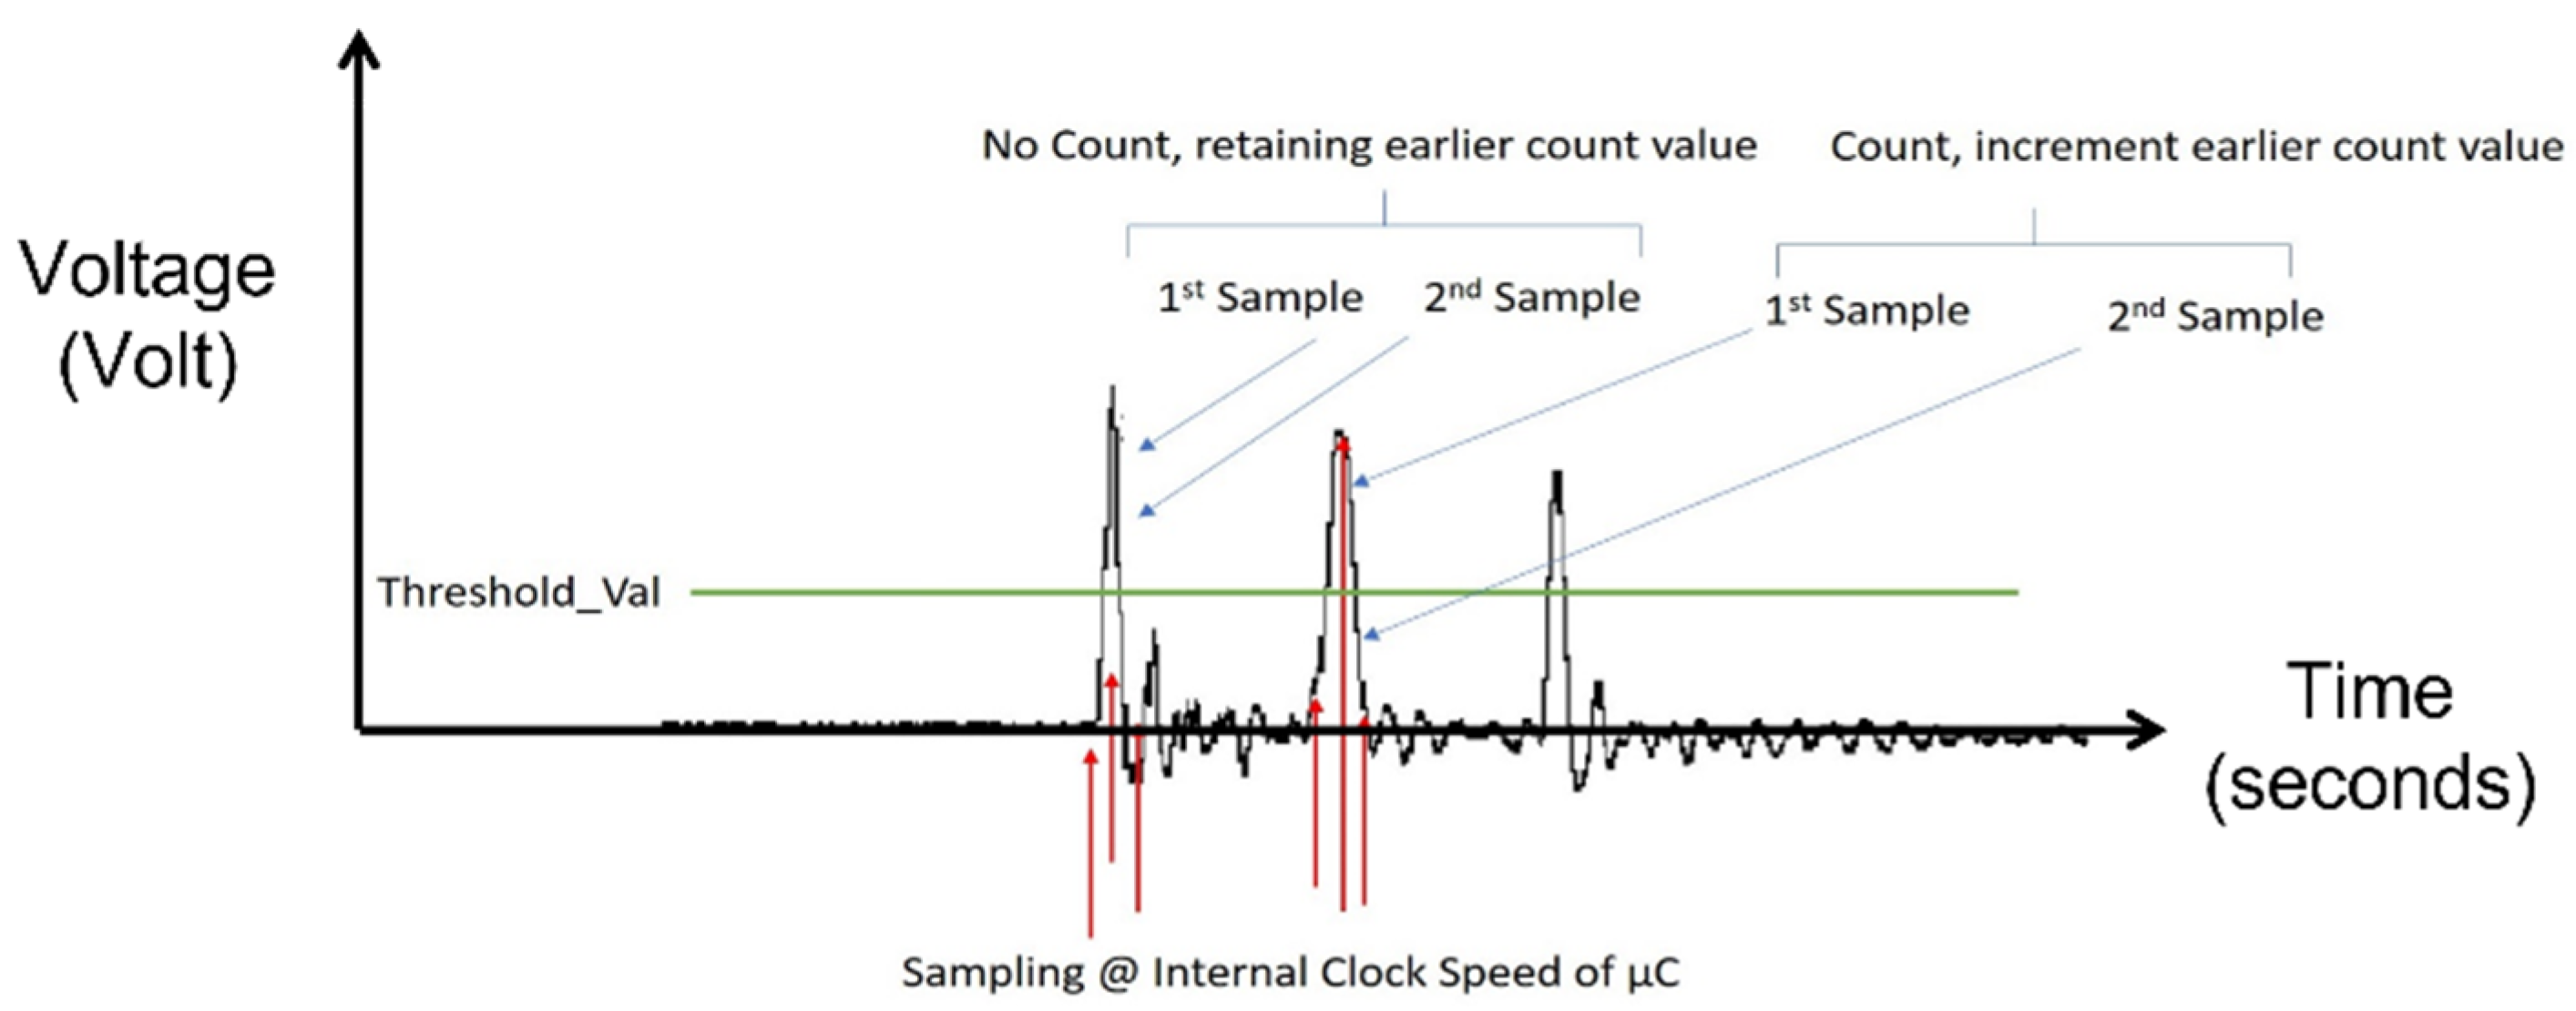
Figure 8.
The packaged remote sensing data logging system.
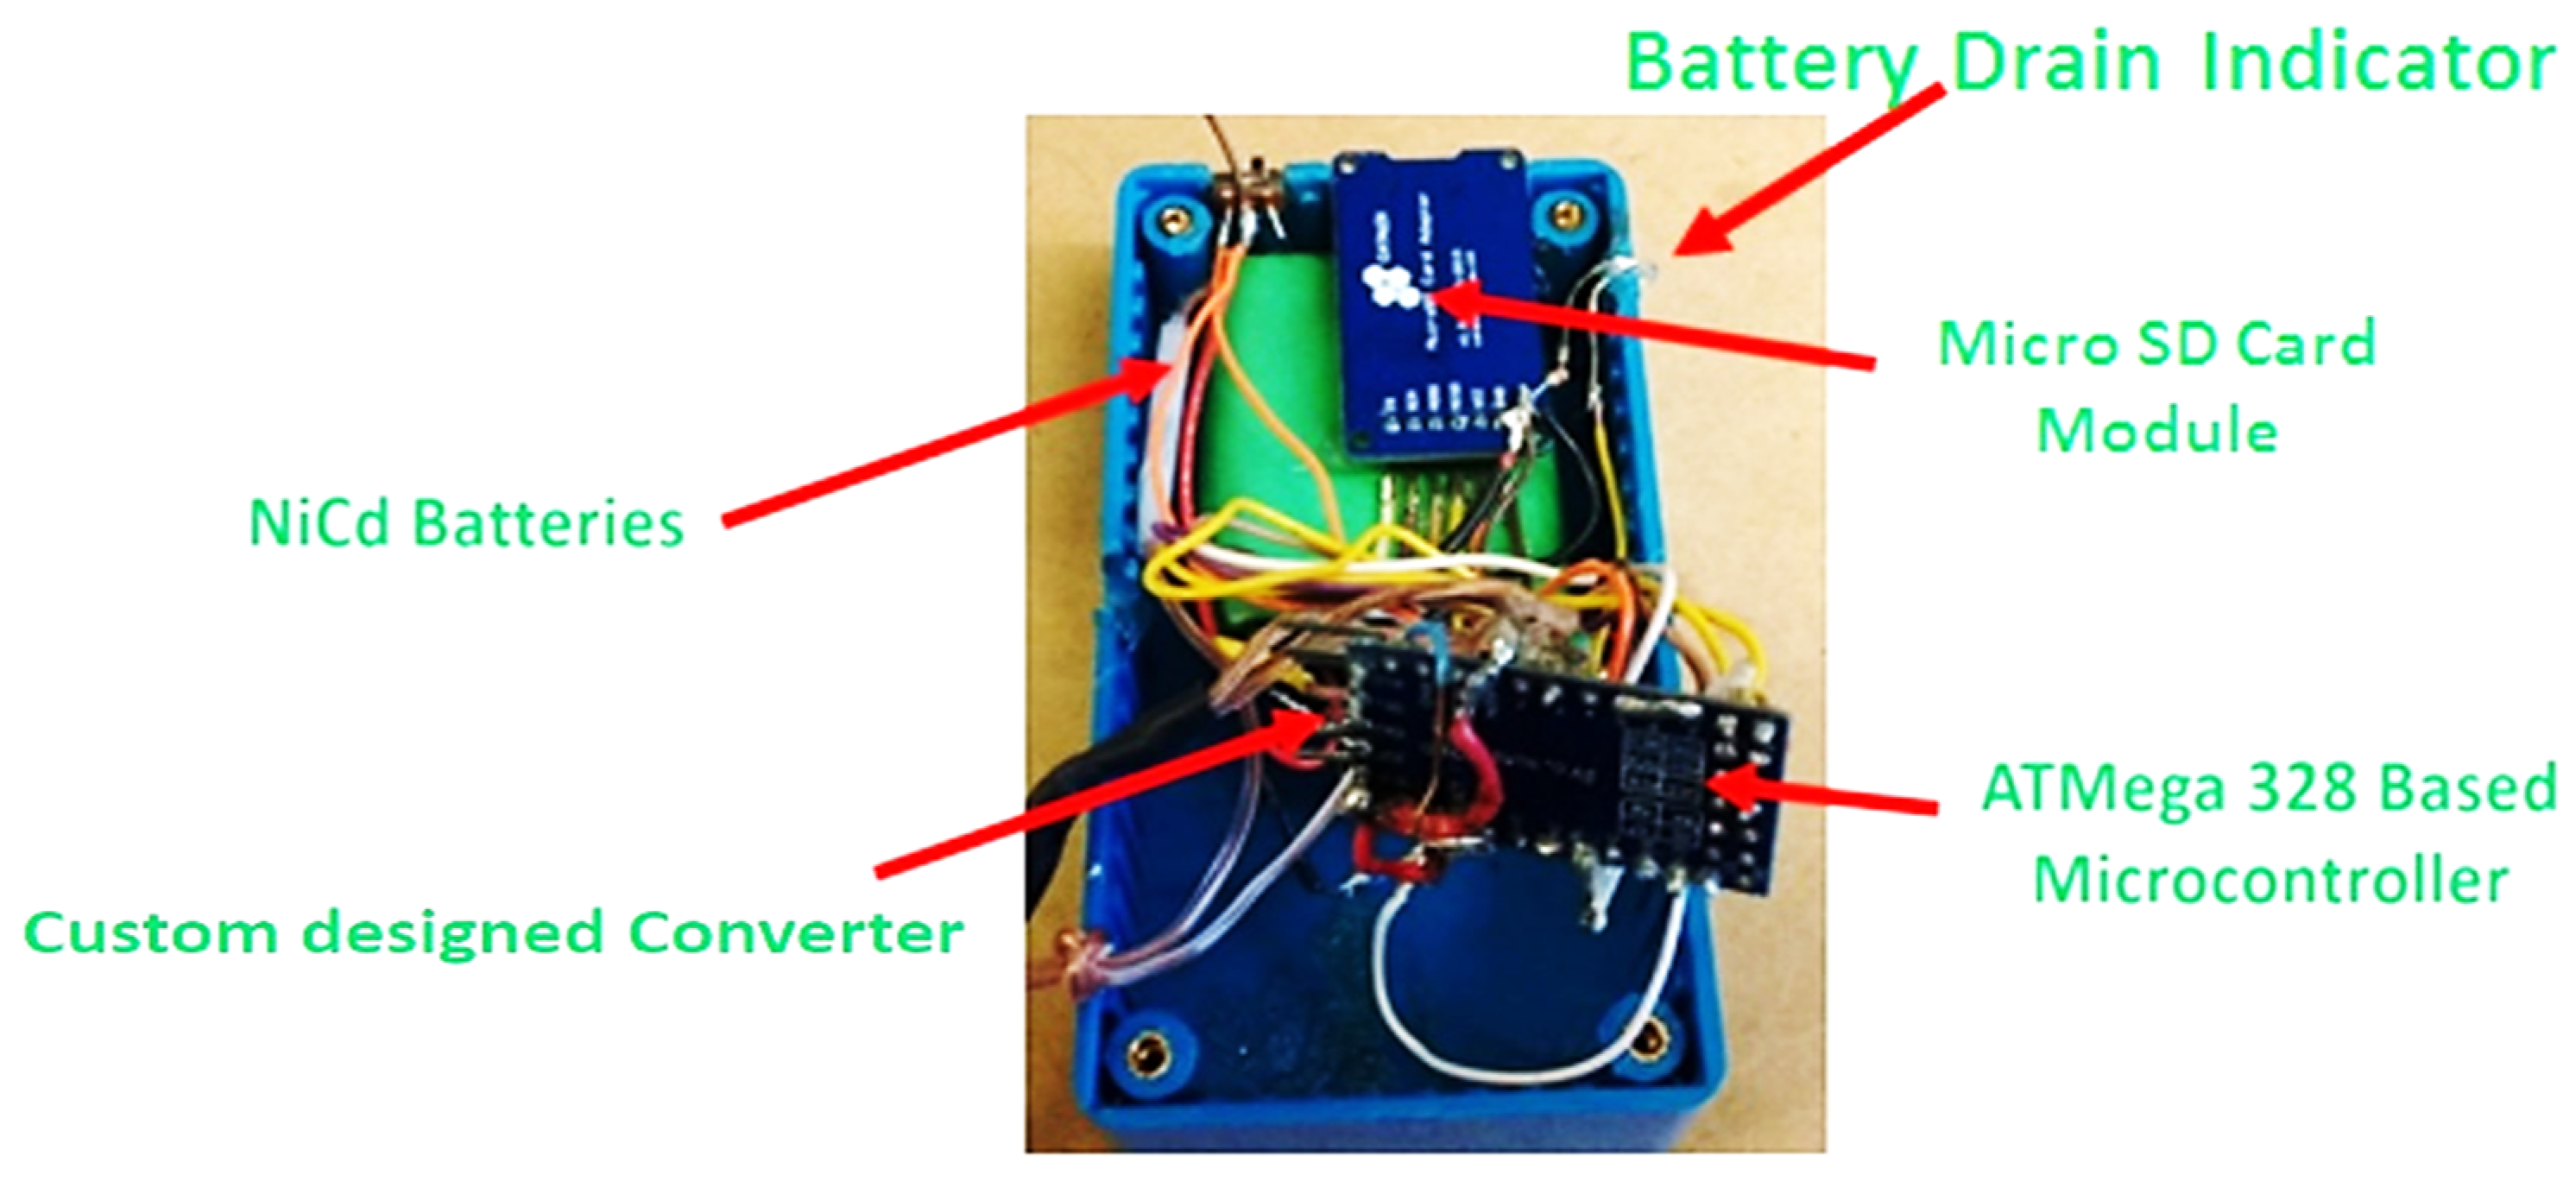
Figure 9.
MTS Acumen Electrodynamic System. (1). Crosshead (2). Loadcell and actuator. (3). Controller.
Figure 9.
MTS Acumen Electrodynamic System. (1). Crosshead (2). Loadcell and actuator. (3). Controller.

Figure 10.
Experimental setup and workflow using MTS Acumen Electrodynamic testing platform.
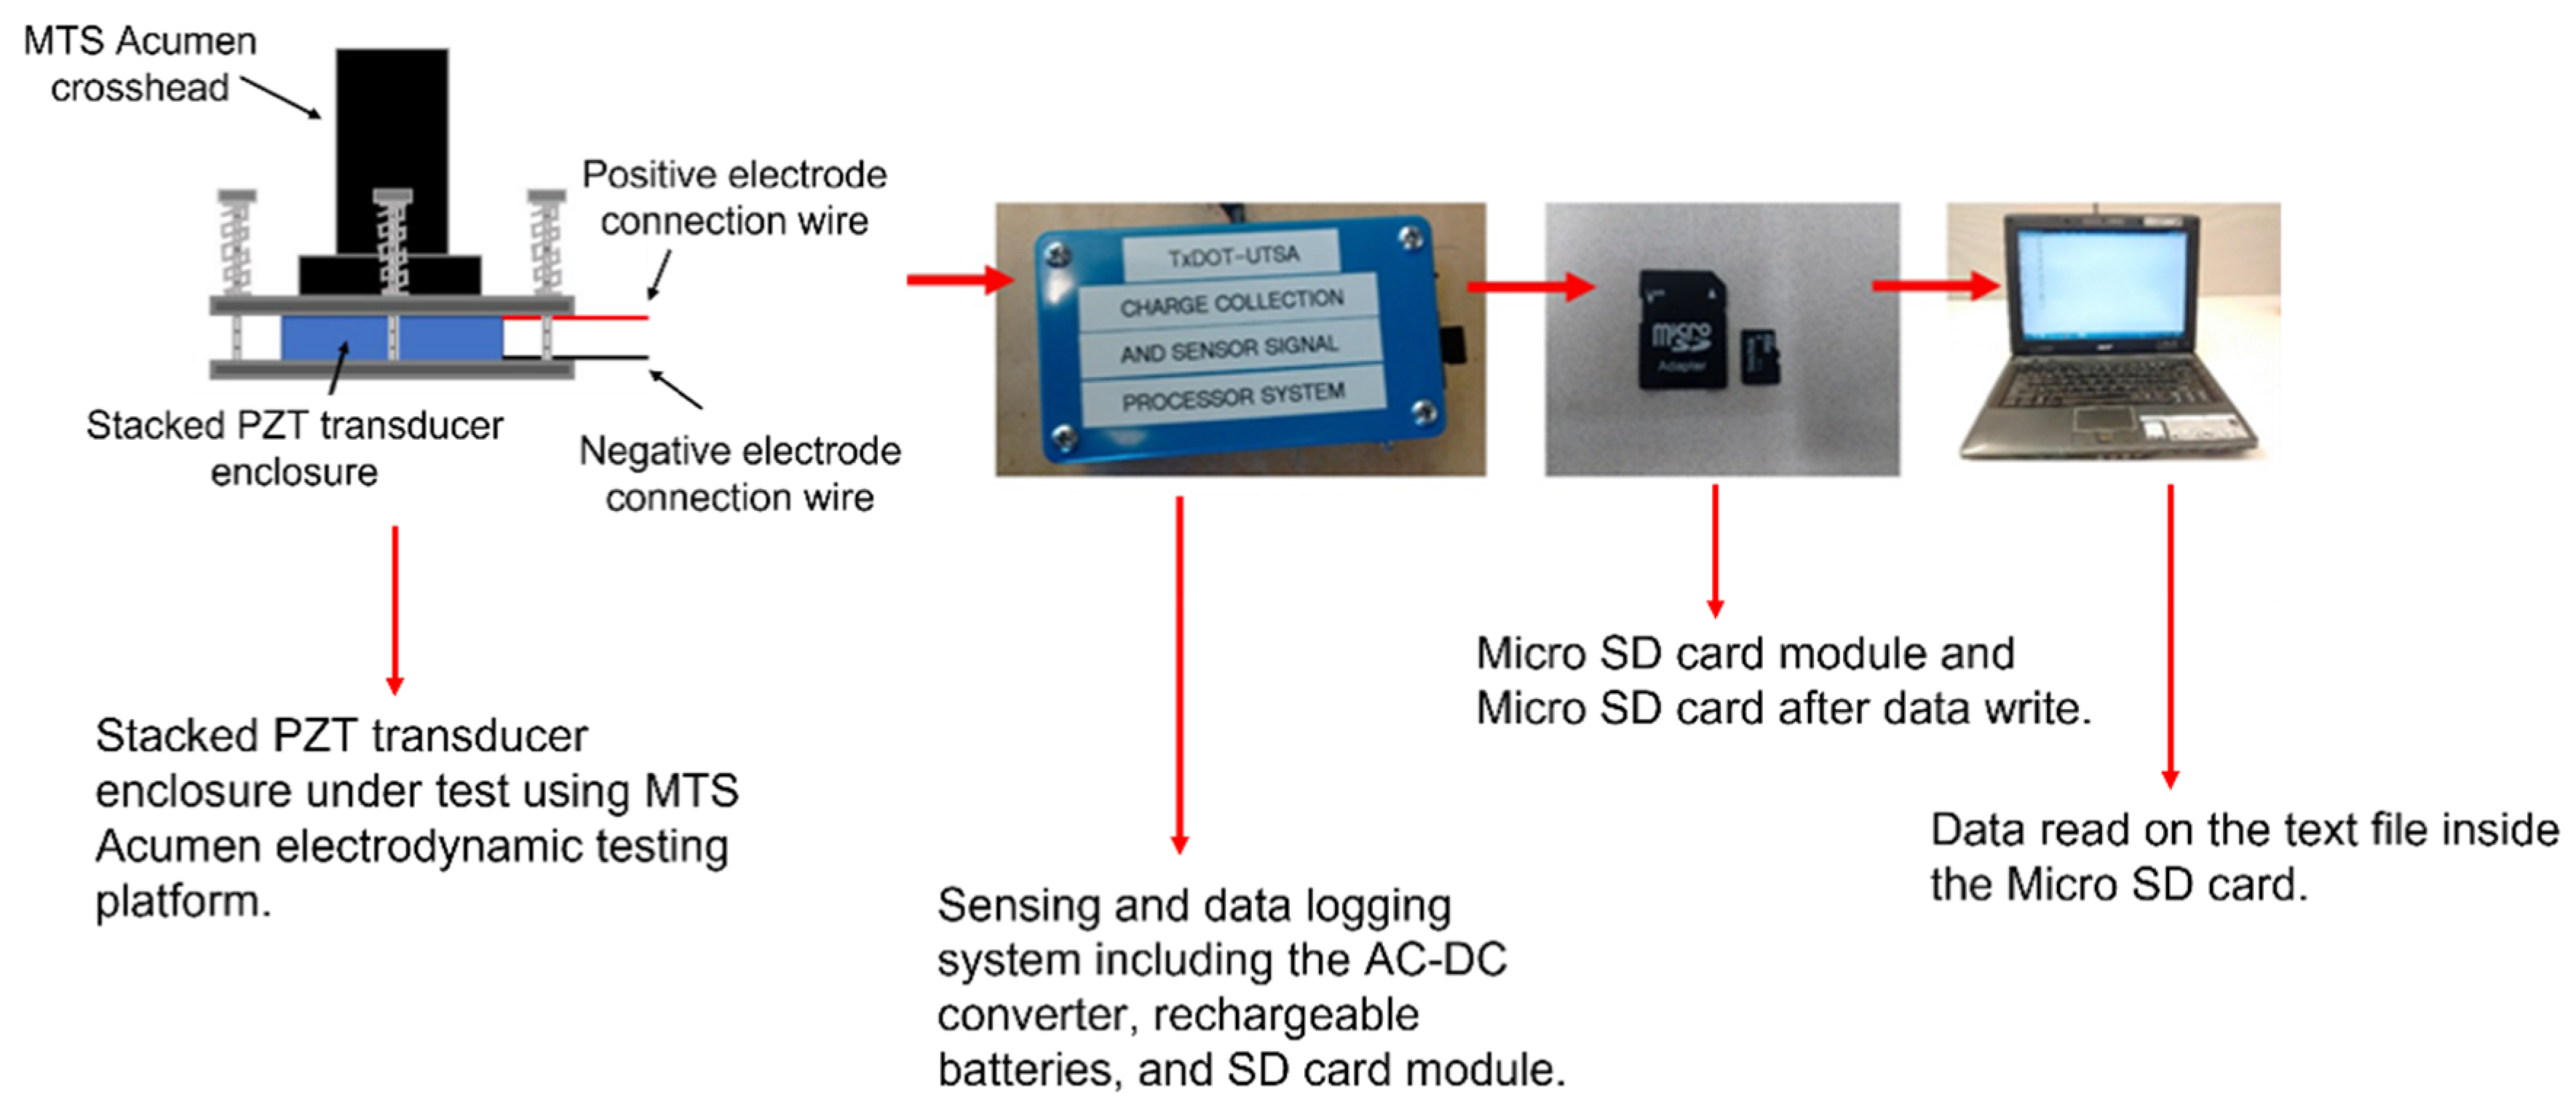
Figure 11.
Signal generator replicating a similar signal as stacked PZT transducer testing operation of the system.
Figure 11.
Signal generator replicating a similar signal as stacked PZT transducer testing operation of the system.

Figure 12.
(a) DATA.txt file in SD card written at 10 Hz every 5 min. (b) DATA.txt file in SD card written at 71 Hz every 5-min.
Figure 12.
(a) DATA.txt file in SD card written at 10 Hz every 5 min. (b) DATA.txt file in SD card written at 71 Hz every 5-min.
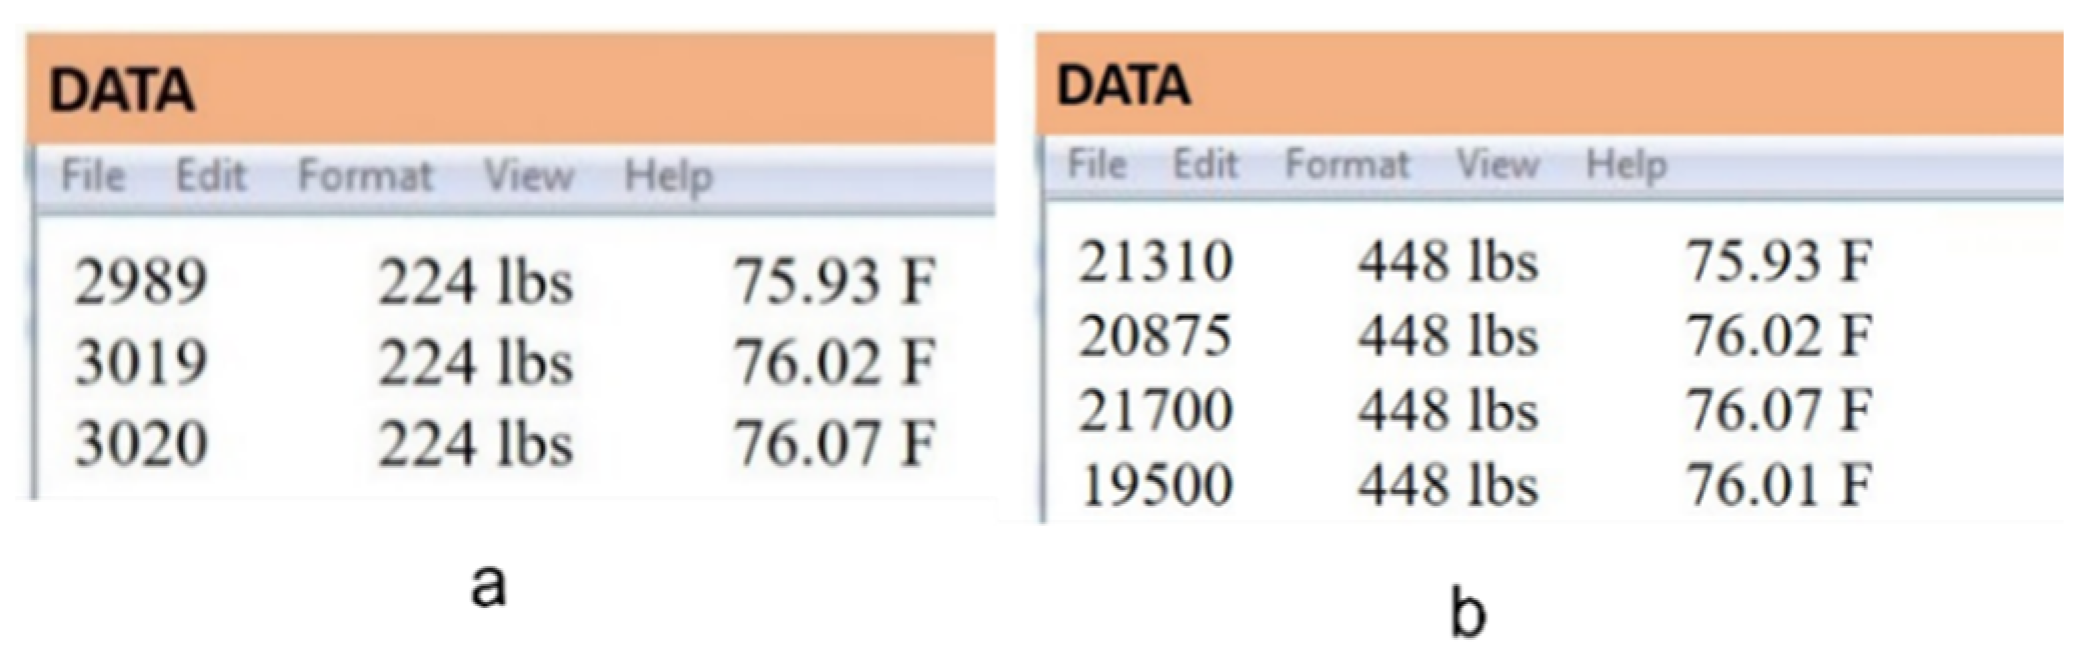
Figure 13.
Android phone showing commands on the HC-06 app.


Table 1.
Hardware or processes and corresponding power consumptions.
| Hardware/Process | Power Consumption |
|---|---|
| Microcontroller/Central control and processing unit | 3 mW for low-speed traffic sensing including SD Card power. 6 mW for high-speed traffic sensing up to 100 mph |
| SD card module Read/Write | 15 mW for 5–10 s for data transfer once in an hour |
| Bluetooth Module (HC-06) | 30–40 mW transmission power for 20 s once a day |
Table 2.
US-59 traffic data collected in the spring 2014 (TxDOT).
| # | Parameter | Value |
|---|---|---|
| 1 | Speed Limit (mph) | 75 |
| 2 | Average truck speed (mph) | 66.5 |
| 3 | Design lane (outside lane) ADT | 4208 |
| 4 | Design Lane (outside lane) ADTT | 1599 |
| 5 | Tire pressure (PSI) (vary from truck to car) | 30–120 |
Publisher’s Note: MDPI stays neutral with regard to jurisdictional claims in published maps and institutional affiliations. |
© 2022 by the authors. Licensee MDPI, Basel, Switzerland. This article is an open access article distributed under the terms and conditions of the Creative Commons Attribution (CC BY) license (https://creativecommons.org/licenses/by/4.0/).
Share and Cite
MDPI and ACS Style
Dipon, W.; Gamboa, B.; Guo, R.; Bhalla, A. Energy Harvesting Using a Stacked PZT Transducer for Self-Sustainable Remote Multi-Sensing and Data Logging System. J. Compos. Sci. 2022, 6, 49. https://doi.org/10.3390/jcs6020049
AMA Style
Dipon W, Gamboa B, Guo R, Bhalla A. Energy Harvesting Using a Stacked PZT Transducer for Self-Sustainable Remote Multi-Sensing and Data Logging System. Journal of Composites Science. 2022; 6(2):49. https://doi.org/10.3390/jcs6020049
Chicago/Turabian StyleDipon, Wasim, Bryan Gamboa, Ruyan Guo, and Amar Bhalla. 2022. "Energy Harvesting Using a Stacked PZT Transducer for Self-Sustainable Remote Multi-Sensing and Data Logging System" Journal of Composites Science 6, no. 2: 49. https://doi.org/10.3390/jcs6020049