
Mechanical and Durability Characteristics Assessment of Geopolymer Composite (GPC) at Varying Silica Fume Content


1
Civil Department, GLA University, Mathura 281406, India
2
Mechanical Department, GLA University, Mathura 281406, India
*
Author to whom correspondence should be addressed.
J. Compos. Sci. 2021, 5(9), 237; https://doi.org/10.3390/jcs5090237
Submission received: 18 July 2021
/
Revised: 23 August 2021
/
Accepted: 30 August 2021
/
Published: 5 September 2021
(This article belongs to the Special Issue Multidisciplinary Composites)
Abstract
:The present study aimed at assessing mechanical and durability characteristics of ground granulated blast furnace slag (GGBS)-based geopolymer composites at 5%, 10%, 15%, 20%, 25%, and 30% replacement proportion of silica fume at 12 molarity of NaOH. Mechanical properties were assessed using compression and tension tests, whereas durability characteristics were evaluated using ultrasonic pulse velocity test (UPV), acid test, and rapid chloride permeability test (RCPT), and water absorption (WA) test. Additionally, reduction in mass and strength were also determined due to the acid action on the developed composites. A correlation of compressive strength was also established with the splitting tensile strength, UPV, RCPT, and WA. The presence of silica fume and high NaOH concentration in GPC tends to improve the mechanical strength up toa certain level. UPV values obtained were falling in the range of medium to good category. Chloride ion penetration and water absorption values were reduced by around 23% and 26%, respectively, at 10% silica fume replacement. Mass loss and strength loss were reduced as the % of silica fume increased. A good correlation of compressive strength was obtained with tensile strength, UPV, and RCPT with a coefficient of determination of 0.9681, 0.9665, and 0.9208, respectively. Poor correlation was obtained between compressive strength and water absorption.
1. Introduction
Amongthe variety of materials used for construction these days, cement concrete has become the most widely used material in the world, after water. Manufacturing of cement causes the generation of around 7–8% of the total worldwide carbon dioxide emissions, including emissions because of the burning of fuels and formation of CaO from Ca (OH)2 [1]. The cement industry is causing rapid degradation to the environment also due to the excavation of argillaceous and calcareous materials for the manufacturing of cement. All these concerns have now become a serious threat to the environment and demand for sustainable and non-polluting materials that can either partially or completely replace cement in the concrete. The search for an alternative material had already been initiated in 1978 by the French scientist Davidovits, who coined the concept of geopolymerisation in the world [2].
The use of blast furnace slag in ground granulated form was prominent as a cementitious material. When used as a partial replacement of cement, GGBS resulted in improved mechanical properties and better durability properties [3]. Additionally, the incorporation of GGBS tends to reduce the need for temperature curing. Many studies in the literature are available on the performance evaluation of mortars and concrete containing GGBS [4,5]. Various factors such as the curing conditions, proportioning of GGBS, chemical composition, etc. influence the strength characteristics. Research works have revealed that the strength is reduced athigher percentages of GGBS in the cement concrete mixes [6,7]. The reduction in the number of large pores due to the incorporation of GGBS helps in improving the resistance against aggressive environmental conditions [8,9].
Silica fume has also been used as an SCM in the production of concrete since the late 1970s [10]. Its particle size lies in the submicron range, and therefore, it was widely used for increasing the density of the concrete by filling the micro voids between the cement particles. Elyamany et al. studied the sulphuric acid resistance of the geopolymer concrete and found that slag-based concrete developed the highest resistance against sulphuric acid attack [11]. Kurtoğlu et al. reported that geopolymer concrete made using 100% GGBS showed better strength properties than 100% fly-ash-based geopolymer concrete [12]. Okoye et al. reported that SF-incorporated GPC has significantly higher resistance in 2% H2SO4 and 5% NaCl solution, as compared to the standard concrete [13]. A number of researchers have validated the test results by establishing correlations using artificial neural network techniques [14,15,16,17]. Shahmansouri et al. found that the SF incorporation up to 30% in GGBS based geopolymer concrete can enhance the strength in compression, tension, and flexure by 30%, 25%, and 20%, respectively [18]. Mustakim et al. obtained an increase in early strength development of GGBS based GPC at 1.5% SF replacement [19]. Much research is still needed to arrive at some conclusions related to the mechanical and durability characteristics of GGBS- and silica-fume-blended geopolymer concrete at varying proportions of both GGBS and SF.
In the current study, geopolymer concrete with GGBS as a binder was developed by replacing it with silica fume in a proportion of 5%, 10%, 15%, 20%, 25%, and 30%. The concentration of NaOH was taken as 12 M molarity, and the proportion of silicate to hydroxide was considered as 2. The developed geopolymer concrete was assessed for its mechanical and durability properties. Additionally, a correlation of compressive strength with splitting tensile strength, UPV, RCPT, and water absorption test results was also established.
2. Materials and Methods
2.1. Materials
Both slag and silica fumes were procured from Astra chemicals Ltd., Chennai, India. Table 1 represents the chemical compositions of GGBS and SF as obtained from the supplier. Specific gravity (SG) of slag and silica fumes, determined as per the Indian Standard Code IS 1727:1967, was obtained as 2.83 and 2.25, respectively. Sand used in the study belongs to Zone-III, as per IS 383:1970, [20] of medium size, and aggregates belong to sub-angular category aggregates. Aggregates of size range 20–10 mm with specific gravity 2.64 and 10–4.75 mm with a specific gravity of 2.72 were used in a proportion of 60:40. Water absorption of coarse and fine aggregates was obtained as 0.52 % and 0.97%, respectively. The fineness modulus (FM) of fine aggregates was calculated as 2.87. A combination of Na2SiO3 and NaOH in a ratio of 2:1 was taken for activating the aluminosilicates, i.e., GGBS and silica fumes. Hydroxide solution of 12 M was considered in the present study. Sodium hydroxide solution preparation was performed one day before the casting by dissolving flakes of NaOH in distilled water. It was carried out to escape the enormous amount of heat liberated from mixing soda flakes in water. Na2SiO3 is composed of total soluble silicates (33.35% by mass), total alkalinity (14.10% by mass), and water (52.55% by mass). The specific gravity of the silicate solution was around 1.56.
2.2. Mix Proportion
In the present study, 7 mixes with slag to silica fume ratio of 100:0, 95:05, 90:10, 85:15, 80:20, 75:25, and 70:30 were developed. These were denoted as G100, G95S5, G90S10, G85S15, G80S20, G75S25, and G70S30, respectively. A mixture of 2:1 Na2SiO3 and NaOH solutions was used as an alkaline activator to activate the geopolymer mixes. Preparation of NaOH solution of 12 M molarity was performed one day before the casting. For preparing 1 L of 12 M NaOH solution, 480 gms of flakes were dissolved in 1000 mL of distilled water. The ratio of alkaline activator solution and aluminosilicate was kept constant at 0.4 for all mixes. The proportions of various ingredients of geopolymer composite and the activator solution are given in Table 2 and Table 3, respectively.
2.3. Methodology
A total of 91 cubic specimens of size 100 mm, 63 cylindrical specimens of height 200 mm and diameter 100 mm, and 56 cylindrical specimens of height 50 mm and diameter 100 mm were cast. All the ingredients of the geopolymer composite, i.e., GGBS, silica fume, activator solution, fine and coarse aggregates, etc. required for preparing mixes were measured by weight. Aluminosilicates (slag and silica fume) were first poured into the mixer, and they were mixed dry for one minute. Coarse and fine aggregates were then added to the dry mixed aluminosilicates, and they are again mixed for one and half minutes. Finally, the activator solution and the required quantity of water were poured in the mixture, and the mixing was sustained for next 4–5 min. All the moulds after being filled in three layers were vibrated using a vibrating table for 20–25 s. The specimens were demoulded after 24 h and were kept in an oven for the next 24 h at a temperature of 60 °C for heat curing.
2.4. Testing
Tests for the strength in compression and tension were conducted in accordance with IS 516 (1959), using a compression testing machine of capacity 2000 kN after 7, 28, and 56 days of ambient air curing post 24 h of heat curing. Durability properties were assessed using ultrasonic pulse velocity test (UPV)in accordance with IS 1311 (Part-1) 1992, rapid chloride ion permeability test (RCPT) in accordance with ASTM C 1202, water absorption test, and acid attack test using 5% H2SO4 solution. UPV measured the results in terms of the velocity of the ultrasonic waves passing through the specimen, RCPT measured the charge passing through the specimen, water absorption test measured the % of water absorbed, and acid attack test measured the reduction in mass and strength of the geopolymer composites in an acidic environment.
3. Results and Discussions
3.1. Mechanical Strength
Compressive and splitting tensile strengths were calculated as a part of the mechanical strength after 7, 28, and 56 days of ambient air curing. Figure 1a,b represents the test results for the compression and tension, respectively. The compressive strength (in MPa) of G100, G95S5, G90S10, G85S15, G80S20, G75S25, and G70S30 samples at 28 and 56 days were found to be 37.6, 39.2, 40.1, 35.4, 29.2, 20.2, 16.6, and 41.3, 44, 46.3, 40.7, 33.5, 22.4, 18.9, respectively. The splitting tensile strength (in MPa) of G100, G95S5, G90S10, G85S15, G80S20, G75S25, and G70S30 samples at 28 and 56 days were found to be 2.7, 3, 3.3, 2.5, 2.4, 1.5, 1.2, and 3.2, 3.7, 3.9, 3, 2.7, 1.6, 1.3, respectively. As compared to the G100 specimen, the maximum increase in strength under compression and tension was obtained for the G90S10 specimen after 56 days of curing. The inclusion of silica fume tends to increase the mechanical strength up to 10% silica fume proportion and thereafter the strength started decreasing [21]. A similar trend in mechanical strength of the GGBS- and SF-based geopolymer concrete has been observed by other researchers [22]. This might be becauseup to 10% silica fume proportion leads to the effective increase in the silica content of the mix which is responsible for the increase in the strength characteristics [23]. Further increase in the silica fume proportion leads to the accumulation of the un-reactive silica in the mix which tends to lower down the strength of the mix [24].
Figure 2 shows the correlation between compressive strength and splitting tensile strength of geopolymer composites made with different proportions of GGBS and silica fume acquired from the current experimental investigation. The linear Equation (1) shows the relations between compressive strength (σ) and splitting tensile strength (S) in percentage, along with the coefficient of determination (R2) resulting from the following equation:
σ = 0.0869S − 0.3261
R2 = 0.9681
R2 = 0.9681
The above value of R2 (=0.968) shows a good relationship between the regression curve and the data points of the compressive strength and the splitting tensile strength values. Equation (1) shows that the higher the splitting tensile strength is, the higher is the compressive strength. Therefore, it can be stated that the splitting tensile strength and compressive strength are strongly correlated with each other [25]. A good correlation has been obtained between these mechanical strengths even after exposure to the deteriorating environment [26].
3.2. Ultrasonic Pulse Velocity (UPV)
Figure 3a shows the ultrasonic pulse velocity values for the geopolymer composite specimens at 28 and 56 days. The UPV values (in m/s) for G100, G95S5, G90S10, G85S15, G80S20, G75S25, and G70S30 samples at 28 and 56 days were obtained as 3892, 4014, 4158, 3944, 3521, 3306, 2919, and 4122, 4199, 4305, 4093, 3659, 3395, 3026, respectively. As expected from the compressive strength test results, the ultrasonic pulse velocity also reached the maximum values at 10% silica fume replacement. A similar trend in results has also been observed in past research works [21]. The reason for this might be attributed to the fact that an increase in strength leads to the densification of the mix and reduction of the porosity, and the velocity of the ultrasonic pulse increases as the density is increased, and porosity is decreased [27]. An increase in UPV values also reflects the filling of the voids by the fine particles of the silica fume. The UPV value for G90S10 samples shows that the geopolymer composite matrix at 10% silica fume replacement has very limited voids and cracks left in it.
Figure 3b shows the correlation between compression strength and pulse velocity values of geopolymer composite made with different proportions of GGBS and silica fume, acquired from the current experimental investigation. The linear Equation (2) shows the correlation between compressive strength (σ) and UPV (U) in percent, along with the coefficient of determination (R2) resultingfrom the following equation:
σ = 44.441U + 2277.1
R2 = 0.9665
R2 = 0.9665
The above value of R2(=0.9665) shows a good relationship between the regression curve and the data points of the compressive strength and the ultrasonic pulse velocity values. Equation (2) shows that the higher the ultrasonic pulse velocity is, the higher is the compressive strength [28].
3.3. Acid Attack
Reduction in mass and strength due to the acid attack on the developed geopolymer composites were assessed after one and two months of 28 days curing in ambient air. Figure 4a represents the mass loss in the specimens when kept immersed in 5% H2SO4 solution for a period of one and two months, whereas Figure 4b shows the change in the strength of the specimens under the same conditions. The values of % mass loss for G100, G95S5, G90S10, G85S15, G80S20, G75S25, and G70S30 specimens after one and two months of immersion in acidic solution were found to be 0.51, 0.48, 0.42, 0.40, 0.44, 0.53, 0.64, and 0.96, 0.91, 0.83, 0.81, 0.91, 1.11, 1.32, respectively. The values of % loss in strength of the specimens G100, G95S5, G90S10, G85S15, G80S20, G75S25, and G70S30 after one and two months of immersion in acidic solution were obtained as 2.47, 2.36, 2.01, 1.89, 2.19, 2.64, 3.11, and 5.55, 5.29, 4.89, 4.65, 5.03, 5.92, 6.87, respectively. Both the loss in mass and strength were reduced as the silica fume proportion was increased in the mix and the minimum loss is observed at 15% silica fume replacement. The reason for this might be the filling of the voids and cracks by the fine particles of the silica fume which subsequently results in reduced capillary action in the matrix [29].
3.4. Rapid Chloride Ion Permeability Test
This test measured the resistance of the geopolymer composite against the chloride permeability. Figure 5a represents the total charge passed through the developed specimens at 28 and 56 days of testing. The total charge passed (in coulombs) through G100, G95S5, G90S10, G85S15, G80S20, G75S25, and G70S30 samples at 28 and 56 days was 1234, 1109, 958, 1054, 1299, 1654, 2110, and 982, 882, 826, 912, 1212, 1542, 1987, respectively. All values of charge passed through specimenswere in the moderate permeability range as per the ASTM standards. The greatest resistance to the chloride ion penetration was achieved at 10% silica fume replacement [21]. Further, the charge passed through the specimen was reduced as the duration increased. The reason for this might again be attributed to the improved density and reduced voids and cracks in the composite matrix. Additionally, the presence of sodium silicate leads to the reduced porosity of the matrix and thereby reduced chloride ion permeability through the specimens.
Figure 5b shows the correlation between compressive strength and RCPT test results of geopolymer composite made with different proportions of GGBS and silica fume, procured from the current experimental investigation. The linear equation shows the relations between compressive strength (σ) and RCPT (C), along with the coefficient of determination (R2) resulting from the following equation:
σ = −39.243C + 2572.6
R2 = 0.9208
R2 = 0.9208
The above value of R2 (=0.9208) shows a good relationship between the regression curve and the data points of the compressive strength and RCPT test results. Equation (3) delineates that the lower the chloride permeability is, the higher is the compressive strength [30].
3.5. Water Absorption
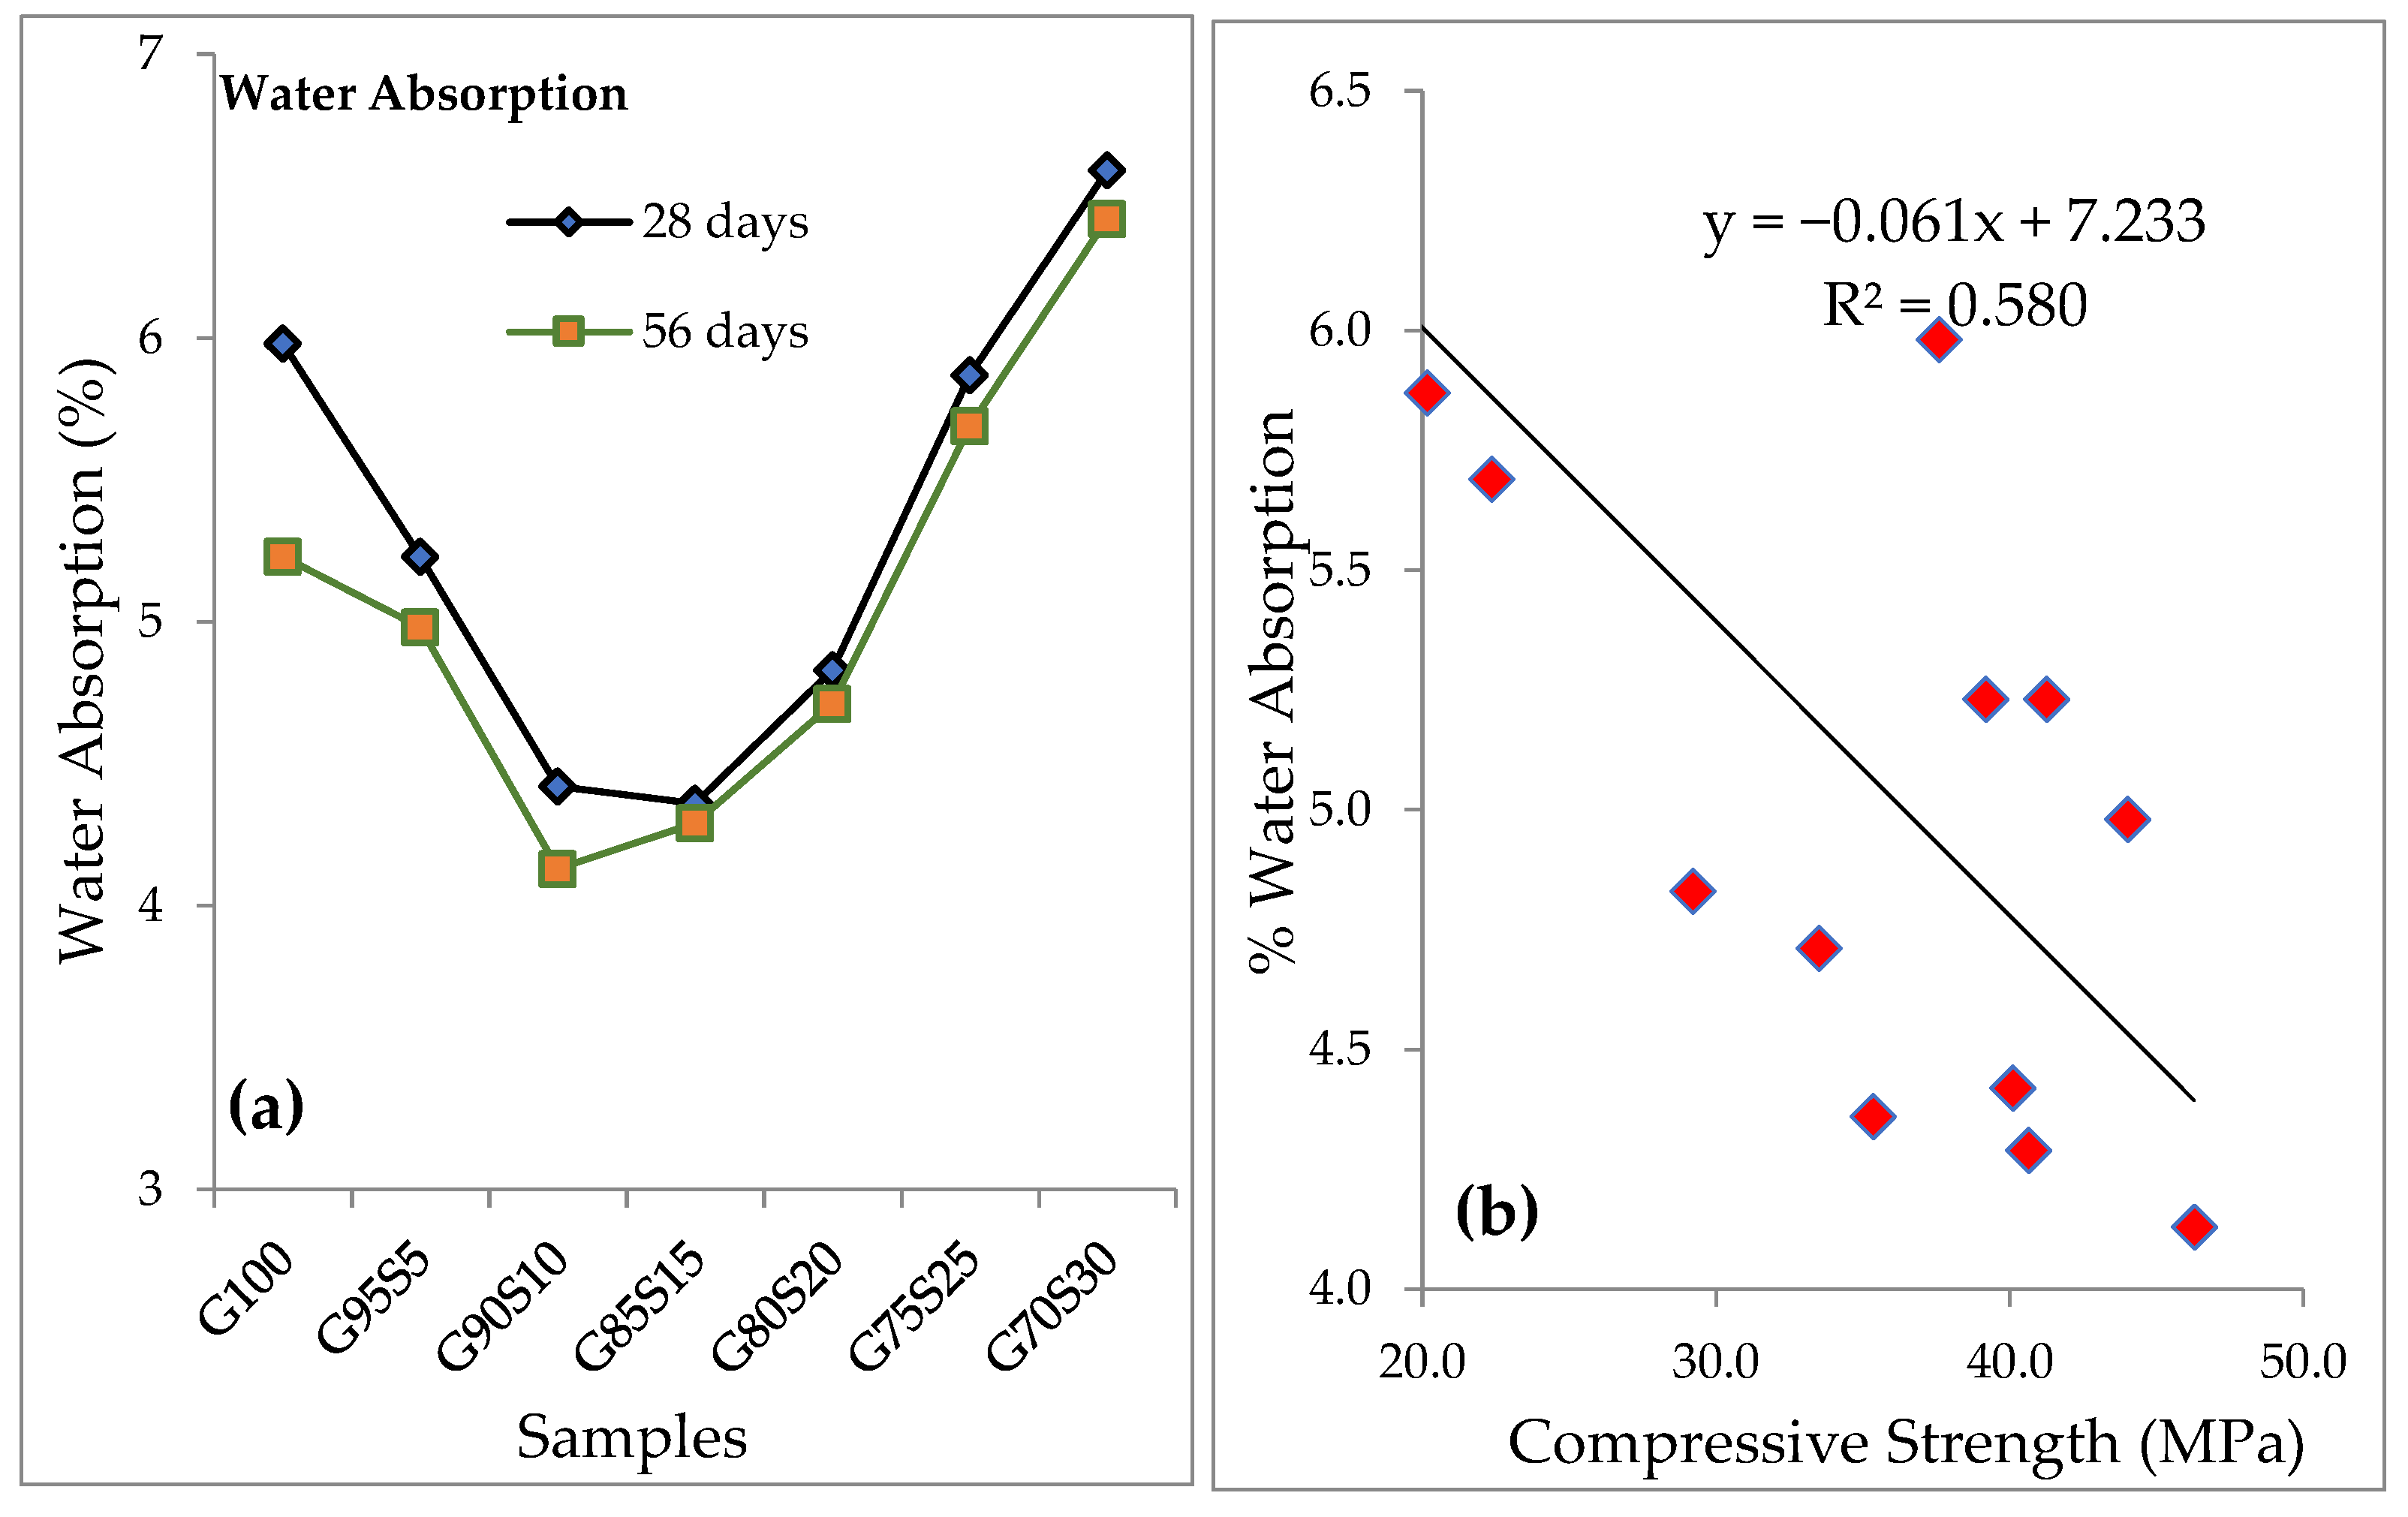
Figure 6a represents the percentage of water absorption by the developed geopolymer composite specimens. The water absorption for G100, G95S5, G90S10, G85S15, G80S20, G75S25 and G70S30 samples at 28 and 56 was obtained as 5.98%, 5.23%, 4.42%, 4.36%, 4.83%, 5.87%, 6.59%, and 5.25%, 4.98%, 4.13%, 4.29%, 4.71%, 5.69%, and 6.42%, respectively. A minimum amount of water was absorbed by G90S10 specimens and was further reduced as time elapsed. The cause for this can be ascribed to the fact that the air voids in the matrix were filled by the finer elements of silica fume, and the capillary action was also reduced.
Figure 6b shows the correlation between compressive strength and water absorptionof geopolymer concrete made with different proportions of GGBS and silica fume, acquired from the current experimental investigation. The linear equation shows the relations between compressive strength (σ) and water absorption (W) in percent, along with the coefficient of determination (R2) resulting from the following equation:
σ = −0.0613W + 7.2331
R2 = 0.5804
R2 = 0.5804
The above value of R2 (=0.580) shows an average relationship between the regression curve and the data points of the compressive strength and the water absorption values. Equation (4) shows that the lower the water absorption is, the higher is the compressive strength [31].
4. Conclusions
In the present study, the mechanical strength and durability characteristics of the developed geopolymer composites were assessed. GGBS was replaced with silica fumes at 5%, 10%, 15%, 20%, 25% and 30% proportions. Then, 12 M NaOH and silicate to hydroxide ratio of 2 was used for activating the geopolymer mix. The following conclusions can be drawn from this study:
- The mechanical strength of geopolymer composite increased with an increase in percentage silica fumeup to 10% content in geopolymer mix. The regression curve and data points showed a good correlation of compressive and split tensile strength;
- The measure of change in water absorption was found to be decreasing with an increase in silica fume content up to 10% in the mix.
- The incorporation of silica fumes up to 10% in GPC resulted in a maximum reduction in chloride ion penetration.
- A noteworthy difference was observed in mass loss and strength loss of the GPC with 100% GGBS and specimens with silica fume when they were exposed to the acidic environment. GPC with 15% silica fume (G85S15) performed better than 100% GGBS (G100).
- In the case of durability properties, the regression curve and data points showed a good correlation of compressive strength with RCPT, water absorption, and UPV values.
Author Contributions
Conceptualisation, A.G. and N.G.; investigation, A.G.; methodology, A.G. and N.G.; project administration, N.G. and K.K.S.; software, A.G.; supervision, N.G. and K.K.S.; writing—original draft preparation, A.G.; writing—review and editing, K.K.S. All authors have read and agreed to the published version of the manuscript.
Funding
This research received no external funding.
Institutional Review Board Statement
Not applicable.
Informed Consent Statement
Not applicable.
Data Availability Statement
Not applicable.
Conflicts of Interest
The authors declare no conflict of interest.
References
- Gao, T.; Shen, L.; Shen, M.; Chen, F.; Liu, L.; Gao, L. Analysis on differences of carbon dioxide emission from cement production and their major determinants. J. Clean. Prod. 2015, 103, 160–170. [Google Scholar] [CrossRef]
- Davidovits, J. Geopolymers. J. Therm. Anal. 1991, 37, 1633–1656. [Google Scholar] [CrossRef]
- Aghaeipour, A.; Madhkhan, M. Effect of ground granulated blast furnace slag (GGBFS) on RCCP durability. Constr. Build. Mater. 2017, 141, 533–541. [Google Scholar] [CrossRef]
- Lee, J.; Lee, T. Durability and Engineering Performance Evaluation of CaO Content and Ratio of Binary Blended Concrete Containing Ground Granulated Blast-Furnace Slag. Appl. Sci. 2020, 10, 2504. [Google Scholar] [CrossRef] [Green Version]
- Park, B.; Choi, Y. Evaluation of Autogenous Healing in Flexural Mortar Members by Chloride Ion Penetration Resistance. Nanomaterials 2021, 11, 1622. [Google Scholar] [CrossRef]
- Yuksel, I. Blast-furnace slag. In Waste and Supplementary Cementitious Materials in Concrete; Elsevier Ltd.: Amsterdam, The Netherlands, 2018; pp. 361–415. [Google Scholar] [CrossRef]
- Sivasundaram, V.; Malhotra, V.M. Properties of Concrete Incorporating Low Quantity of Cement and High Volumes of Ground Granulated Slag. ACI Mater. J. 1992, 89, 554–563. [Google Scholar] [CrossRef]
- Pavía, S.; Condren, E. Study of the Durability of OPC versus GGBS Concrete on Exposure to Silage Effluent. J. Mater. Civ. Eng. 2008, 20, 313–320. [Google Scholar] [CrossRef]
- O’Connell, M.; McNally, C.; Richardson, M.G. Performance of concrete incorporating GGBS in aggressive wastewater environments. Constr. Build. Mater. 2012, 27, 368–374. [Google Scholar] [CrossRef]
- Bhalla, N.; Sharma, S.; Sharma, S.; Siddique, R. Monitoring early-age setting of silica fume concrete using wave propagation techniques. Constr. Build. Mater. 2018, 162, 802–815. [Google Scholar] [CrossRef]
- Elyamany, H.E.; Elmoaty, A.E.M.A.; Diab, A.R.A. Sulphuric Acid Resistance of Slag Geopolymer Concrete Modified with Fly Ash and Silica Fume. Iran. J. Sci. Technol. Trans. Civ. Eng. 2020. [Google Scholar] [CrossRef]
- Kurtoğlu, A.E.; Alzeebaree, R.; Aljumaili, O.; Niş, A.; Gülşan, M.E.; Humur, G.; Çevik, A. Mechanical and durability properties of fly ash and slag based geopolymer concrete. Adv. Concr. Constr. 2018, 6, 345–362. [Google Scholar] [CrossRef]
- Okoye, F.N.; Prakash, S.; Singh, N.B. Durability of fly ash based geopolymer concrete in the presence of silica fume. J. Clean. Prod. 2017, 149, 1062–1067. [Google Scholar] [CrossRef]
- Esfe, M.H.; Wongwises, S.; Naderi, A.; Asadi, A.; Safaei, M.R.; Rostamian, H.; Dahari, M.; Karimipour, A. Thermal conductivity of Cu/TiO2-water/EG hybrid nanofluid: Experimental data and modeling using artificial neural network and correlation. Int. Commun. Heat Mass Transf. 2015, 66, 100–104. [Google Scholar] [CrossRef]
- Singh, P.K.; Rajput, S.K.; Kumar, S. Prediction of HAZ width and toughness of HY85 steel using artificial neural network. Adv. Mater. Process. Technol. 2020. [Google Scholar] [CrossRef]
- Aherwar, A.; Singh, A.; Patnaik, A. Prediction of effect of tungsten filled Co-30Cr-4Mo-1Ni metal matrix biomedical composite alloy on sliding wear peculiarity using Taguchi methodology and ANN. Adv. Mater. Process. Technol. 2017, 3, 665–688. [Google Scholar] [CrossRef]
- Karthikeyan, R.; Kumar, V.S.; Punitha, A.; Chavan, U.M. An Integrated ANN–GA Approach to Maximise the Material Removal Rate and Surface Roughness of Wire Cut EDM on Titanium Alloy. Adv. Mater. Process. Technol. 2020. [Google Scholar] [CrossRef]
- Shahmansouri, A.A.; Nematzadeh, M.; Behnood, A. Mechanical properties of GGBFS-based geopolymer concrete incorporating natural zeolite and silica fume with an optimum design using response surface method. J. Build. Eng. 2021, 36, 102138. [Google Scholar] [CrossRef]
- Mustakim, S.M.; Das, S.K.; Mishra, J.; Aftab, A.; Alomayri, T.S.; Assaedi, H.S.; Kaze, C.R. Improvement in Fresh, Mechanical and Microstructural Properties of Fly Ash-Blast Furnace Slag Based Geopolymer Concrete By Addition of Nano and Micro Silica. Silicon 2021, 13, 2415–2428. [Google Scholar] [CrossRef]
- BIS. IS 383: 1970 Specification for Coarse and Fine Aggregates from Natural Sources for Concrete; Indian Standard: Delhi, India, 1970; pp. 1–24. [Google Scholar]
- Venkatesan, R.P.; Pazhani, K.C. Strength and durability properties of geopolymer concrete made with Ground Granulated Blast Furnace Slag and Black Rice Husk Ash. KSCE J. Civ. Eng. 2016, 20, 2384–2391. [Google Scholar] [CrossRef]
- Blash, A.M.A.; Lakshmi, D.T.V.S.V. Properties of Geopolymer Concrete Produced by Silica Fume and Ground-Granulated Blast-Furnace Slag. Int. J. Sci. Res. 2016, 5, 319–323. [Google Scholar]
- Khedr, A.-Z.A.; Nagib, S.M. Characteristics of Silica Fume Concrete. J. Mater. Civ. Eng. 1995, 6, 357–375. [Google Scholar] [CrossRef]
- Duxson, P.; Provis, J.L.; Lukey, G.C.; Mallicoat, S.W.; Kriven, W.M.; van Deventer, J.S.J. Understanding the relationship between geopolymer composition, microstructure and mechanical properties. Colloids Surf. A Physicochem. Eng. Asp. 2005, 269, 47–58. [Google Scholar] [CrossRef]
- Bhanja, S.; Sengupta, B. Influence of silica fume on the tensile strength of concrete. Cem. Concr. Res. 2005, 35, 743–747. [Google Scholar] [CrossRef]
- Yao, W.; Jiang, S.; Fei, W.; Cai, T. Correlation between the Compressive, Tensile Strength of Old Concrete under Marine Environment and Prediction of Long-Term Strength. Adv. Mater. Sci. Eng. 2017, 2017, 8251842. [Google Scholar] [CrossRef] [Green Version]
- Vijayalakshmi, M.; Sekar, A.S.S.; Prabhu, G.G. Strength and durability properties of concrete made with granite industry waste. Constr. Build. Mater. 2013, 46, 1–7. [Google Scholar] [CrossRef]
- Demirboǧa, R.; Türkmen, I.; Karakoç, M.B. Relationship between ultrasonic velocity and compressive strength for high-volume mineral-admixtured concrete. Cem. Concr. Res. 2004, 34, 2329–2336. [Google Scholar] [CrossRef]
- Jindal, B.B.; Parveen; Singhal, D.; Goyal, A. Predicting Relationship between Mechanical Properties of Low Calcium Fly Ash-Based Geopolymer Concrete. Trans. Indian Ceram. Soc. 2017, 76, 258–265. [Google Scholar] [CrossRef]
- Rostami, M.; Behfarnia, K. The effect of silica fume on durability of alkali activated slag concrete. Constr. Build. Mater. 2017, 134, 262–268. [Google Scholar] [CrossRef]
- Zhang, S.P.; Zong, L. Evaluation of relationship between water absorption and durability of concrete materials. Adv. Mater. Sci. Eng. 2014, 2014, 650373. [Google Scholar] [CrossRef] [Green Version]
Figure 1.
Test results for (a) compressive strength (b) splitting tensile strength.
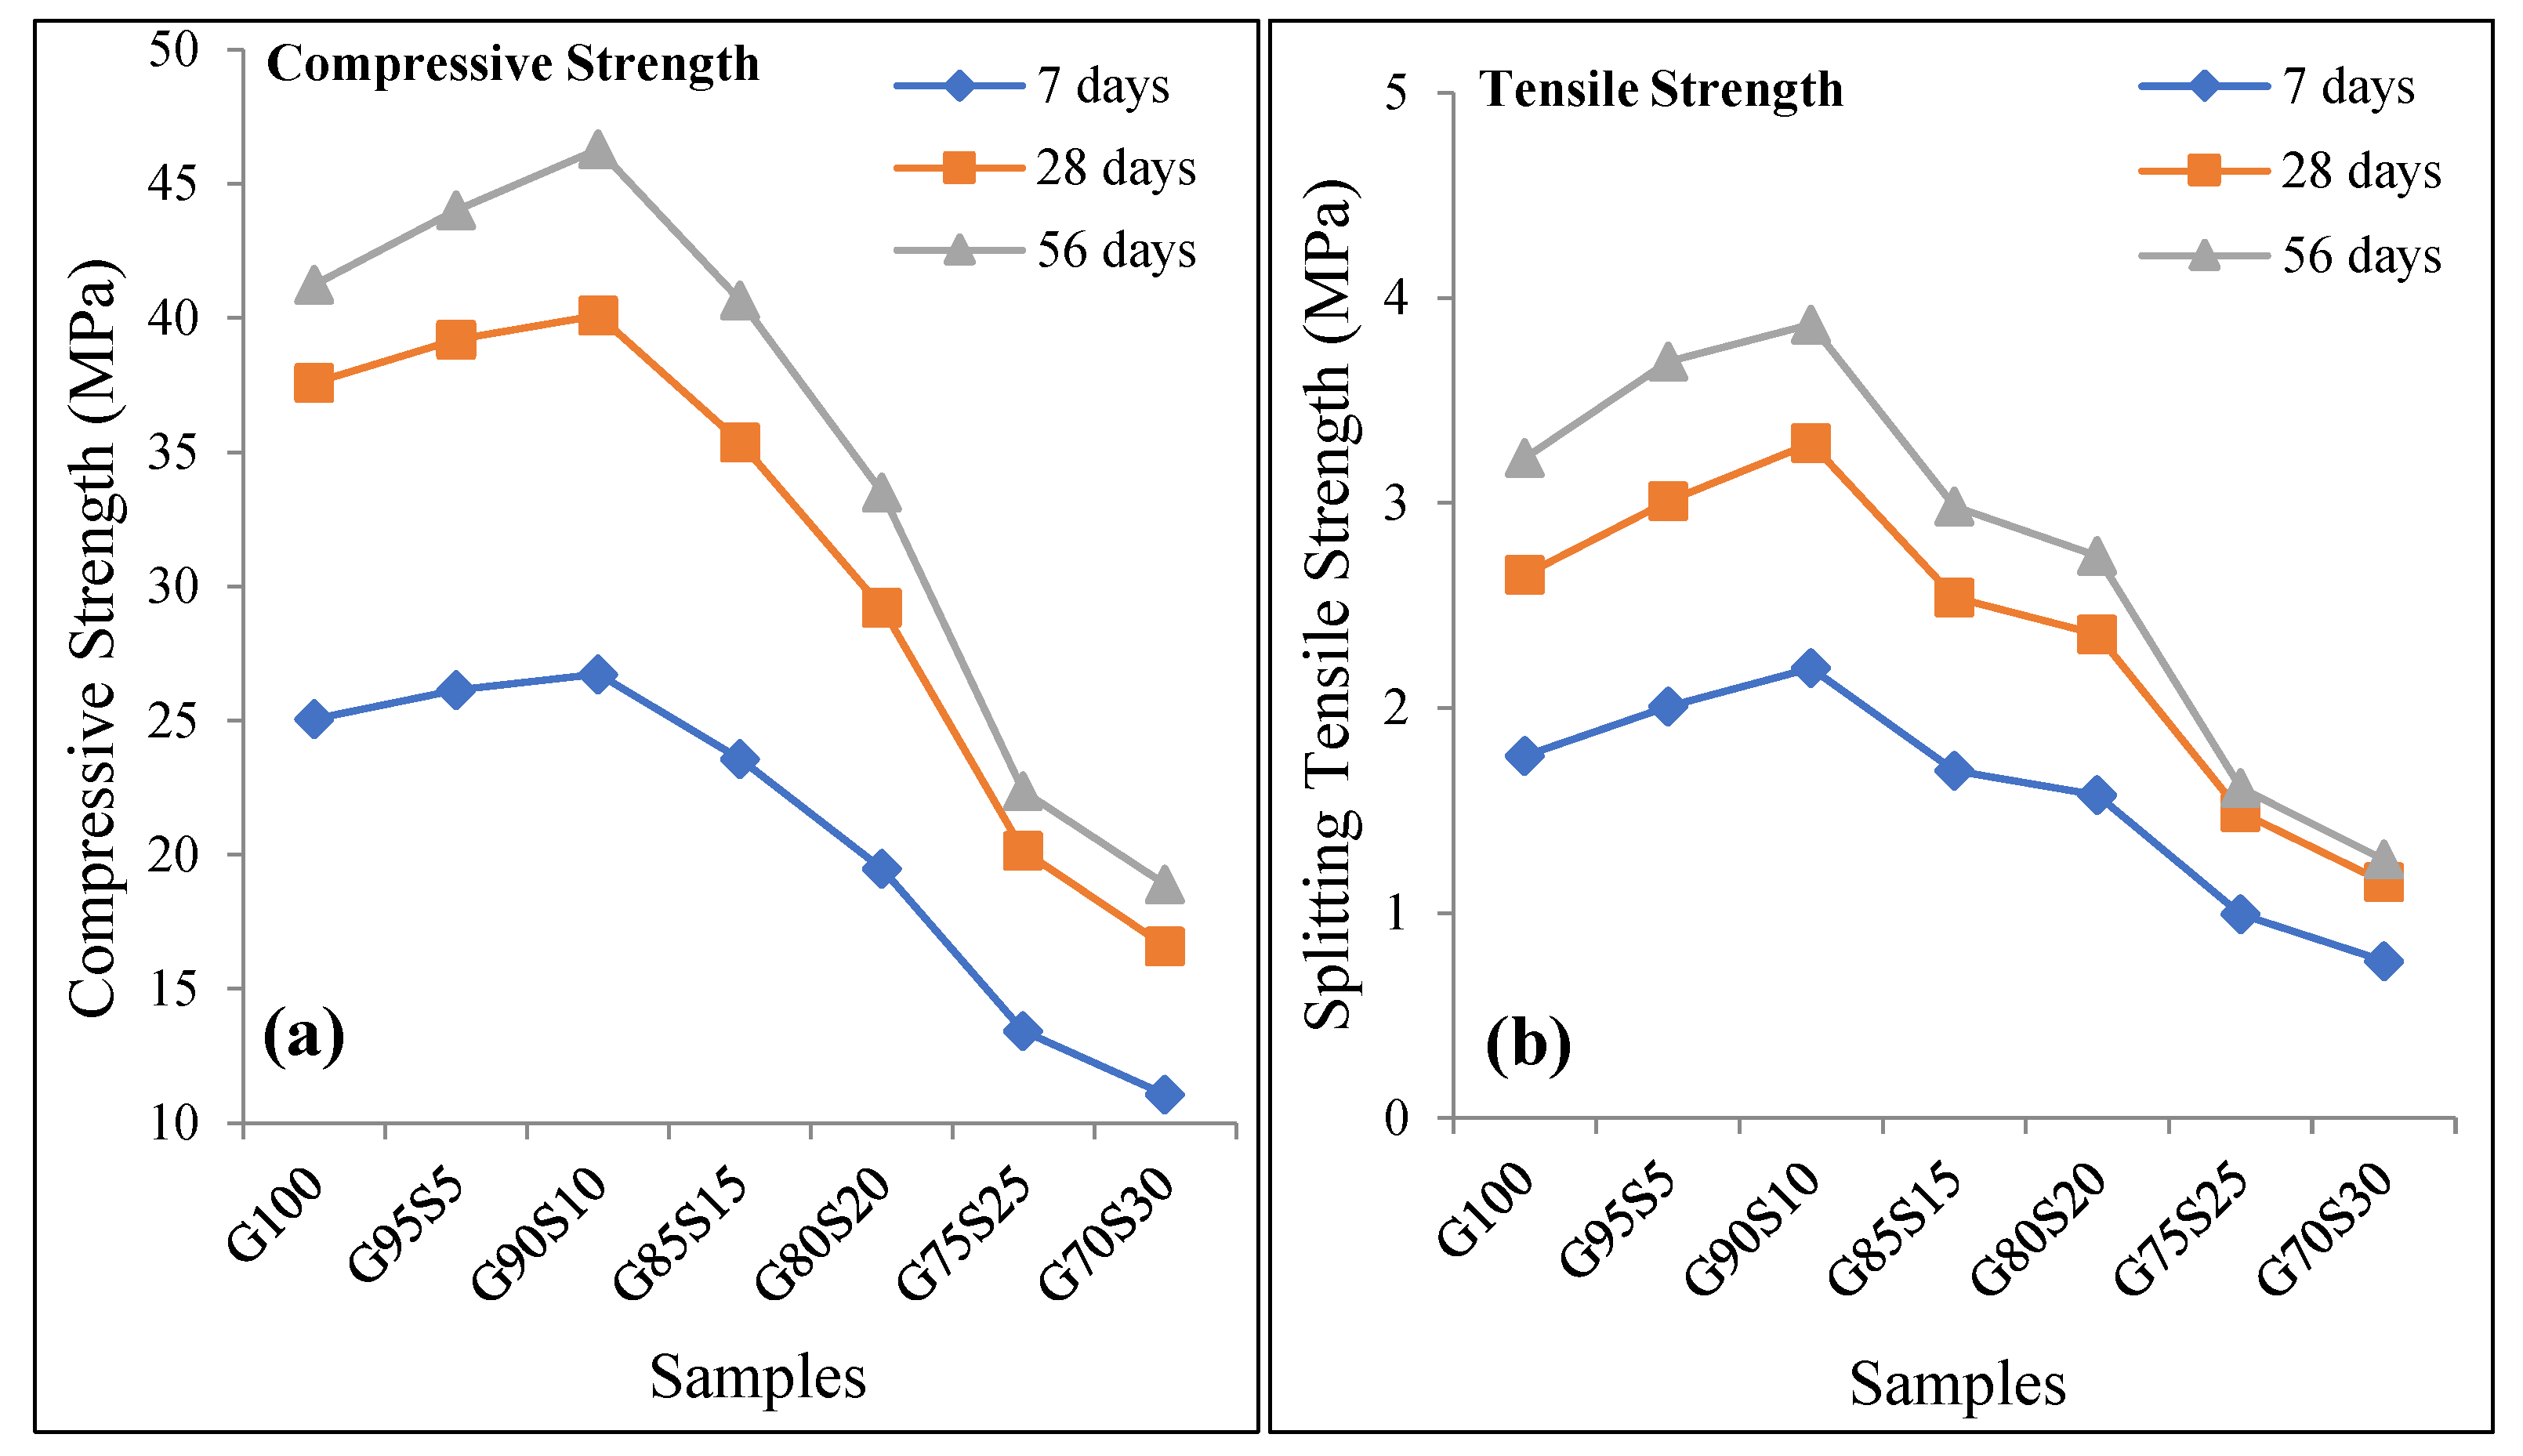
Figure 2.
Compressive strength correlations with splitting tensile strength.

Figure 3.
(a) UPV test results; (b) correlation of compressive strength with UPV values.

Figure 4.
(a) Mass loss; (b) strength change under 5% H2SO4 solution.
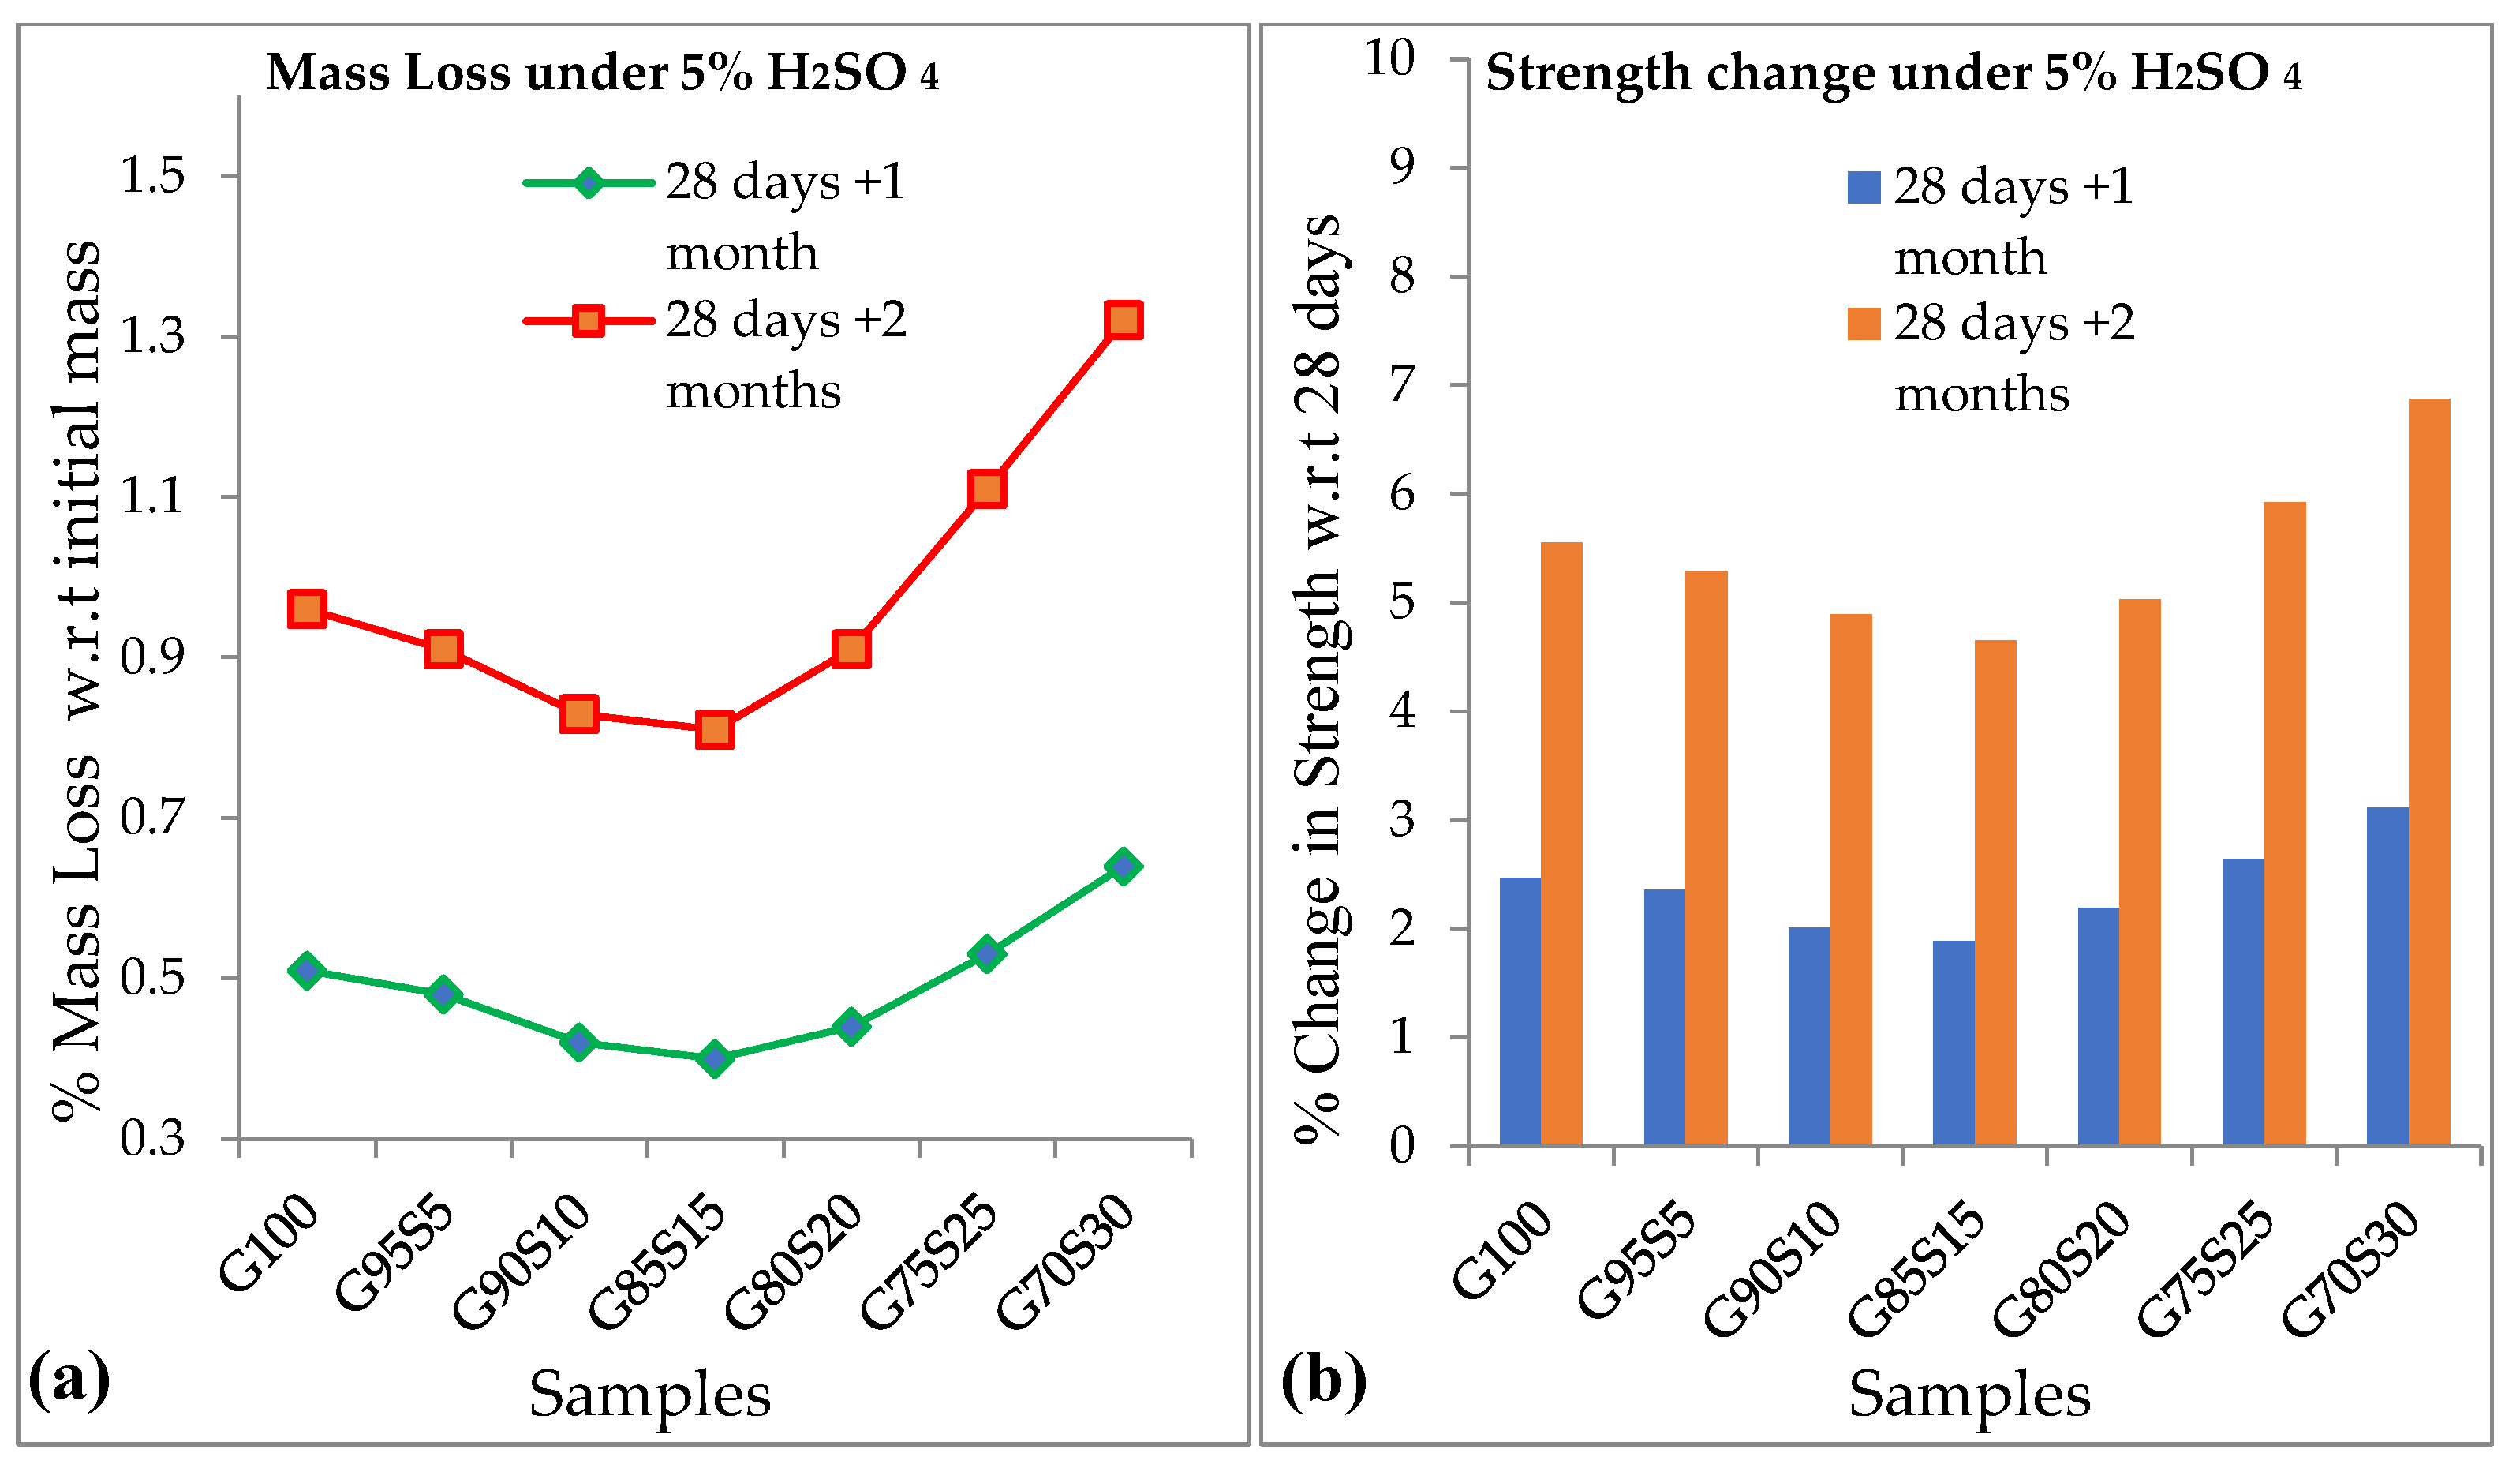
Figure 5.
(a) RCPT test results; (b) correlation of compressive strength with RCPT value.
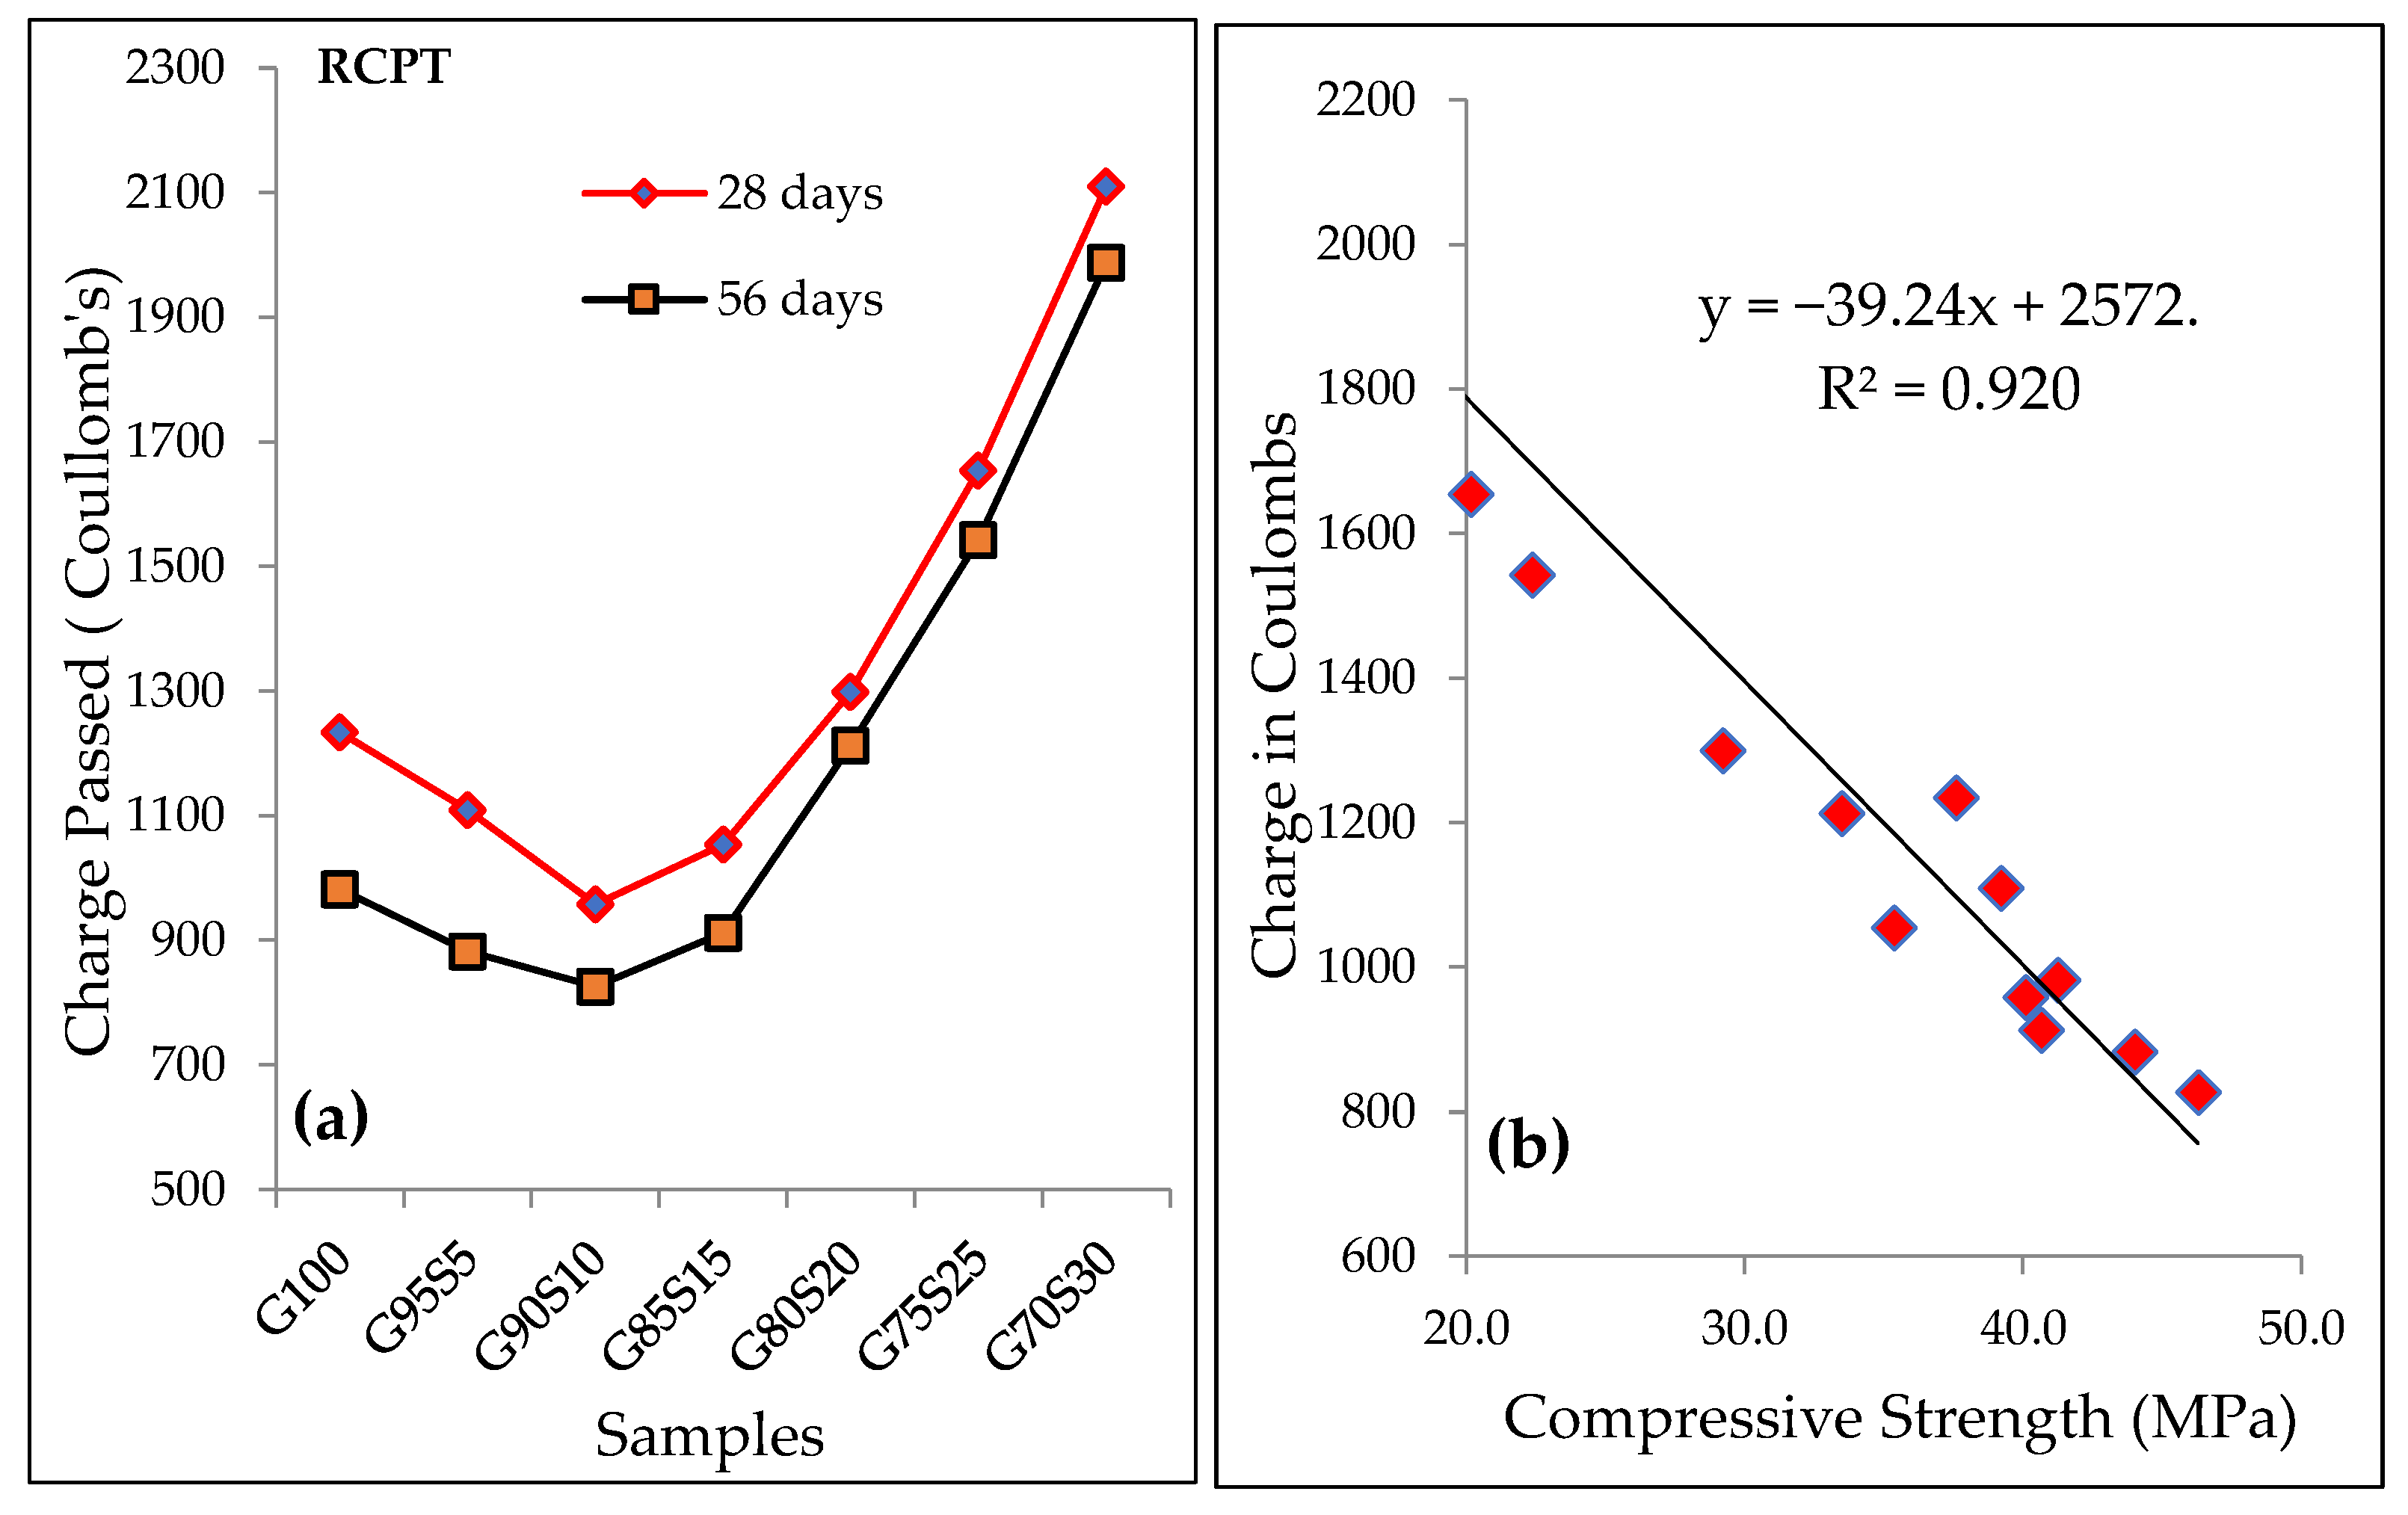
Figure 6.
(a) WA test results; (b) correlation of compressive strength with WA values.

Table 1.
Chemical composition of silica fume and GGBS.
| S.N | Item | Silica Fume (%) | GGBS (%) |
|---|---|---|---|
| 1 | Silicon dioxide (SiO2) | 90.20 | 30.34 |
| 2 | Calcium oxide (CaO) | 0.75 | 32.79 |
| 3 | Magnesium oxide (MgO) | 0.40 | 7.75 |
| 4 | Aluminium oxide (Al2O3) | 1.10 | 14.11 |
| 5 | Ferric oxide (Fe2O3) | 1.38 | 2.83 |
| 6 | Sodium oxide (Na2O) | 0.29 | - |
| 7 | Titanium oxide (TiO2) | - | - |
| 8 | LOI | 2.9 | 0.26 |
Table 2.
GPC ingredients proportioning for 1 m3 of the mix.
| Designation | Slag (kg) | Silica Fume (kg) | Fine Aggregates (kg) | Coarse Aggregates (kg) | |
|---|---|---|---|---|---|
| 4.75–10 mm | 10–20 mm | ||||
| G100 | 370.6 | 0 | 655.3 | 461.9 | 692.8 |
| G95S5 | 352.1 | 18.5 | 653.7 | 460.7 | 691.1 |
| G90S10 | 333.5 | 37.1 | 652.1 | 459.6 | 689.4 |
| G85S15 | 315.0 | 55.6 | 650.4 | 458.4 | 687.6 |
| G80S20 | 296.5 | 74.1 | 648.8 | 457.3 | 685.9 |
| G75S25 | 277.9 | 92.7 | 647.1 | 456.1 | 684.2 |
| G70S30 | 259.4 | 111.2 | 645.5 | 455.0 | 682.5 |
Table 3.
Ingredients for 12 M NaOH in 1 m3 of the mix.
| Soda Flakes (kg) | Distilled Water (kg) | Sodium Silicate (kg) | |
|---|---|---|---|
| Quantity | 23.72 | 49.41 | 98.82 |
| Extra water (kg) | 116.3 | ||
| Na2SiO3/NaOH | 2 | ||
Publisher’s Note: MDPI stays neutral with regard to jurisdictional claims in published maps and institutional affiliations. |
© 2021 by the authors. Licensee MDPI, Basel, Switzerland. This article is an open access article distributed under the terms and conditions of the Creative Commons Attribution (CC BY) license (https://creativecommons.org/licenses/by/4.0/).
Share and Cite
MDPI and ACS Style
Gupta, A.; Gupta, N.; Saxena, K.K. Mechanical and Durability Characteristics Assessment of Geopolymer Composite (GPC) at Varying Silica Fume Content. J. Compos. Sci. 2021, 5, 237. https://doi.org/10.3390/jcs5090237
AMA Style
Gupta A, Gupta N, Saxena KK. Mechanical and Durability Characteristics Assessment of Geopolymer Composite (GPC) at Varying Silica Fume Content. Journal of Composites Science. 2021; 5(9):237. https://doi.org/10.3390/jcs5090237
Chicago/Turabian StyleGupta, Ankur, Nakul Gupta, and Kuldeep Kumar Saxena. 2021. "Mechanical and Durability Characteristics Assessment of Geopolymer Composite (GPC) at Varying Silica Fume Content" Journal of Composites Science 5, no. 9: 237. https://doi.org/10.3390/jcs5090237