Thermal and Flammability Characteristics of Blended Jatropha Bio-Epoxy as Matrix in Carbon Fiber–Reinforced Polymer

 ,
, 
 ,
,
Abstract
:1. Introduction
2. Materials and Methods
2.1. Fabrication and Materials of the Composite Specimen
2.2. Jatropha Bio-Epoxy Derived from Crude Jatropha Oil
2.3. FT-IR/ATR Test
2.4. Thermal Test
2.4.1. Thermal Gravimetric Analysis (TGA)
2.4.2. Differential Scanning Calorimetry (DSC)
2.4.3. Dynamic Mechanical Analysis (DMA)
2.5. Flammability Test
3. Results and Discussion
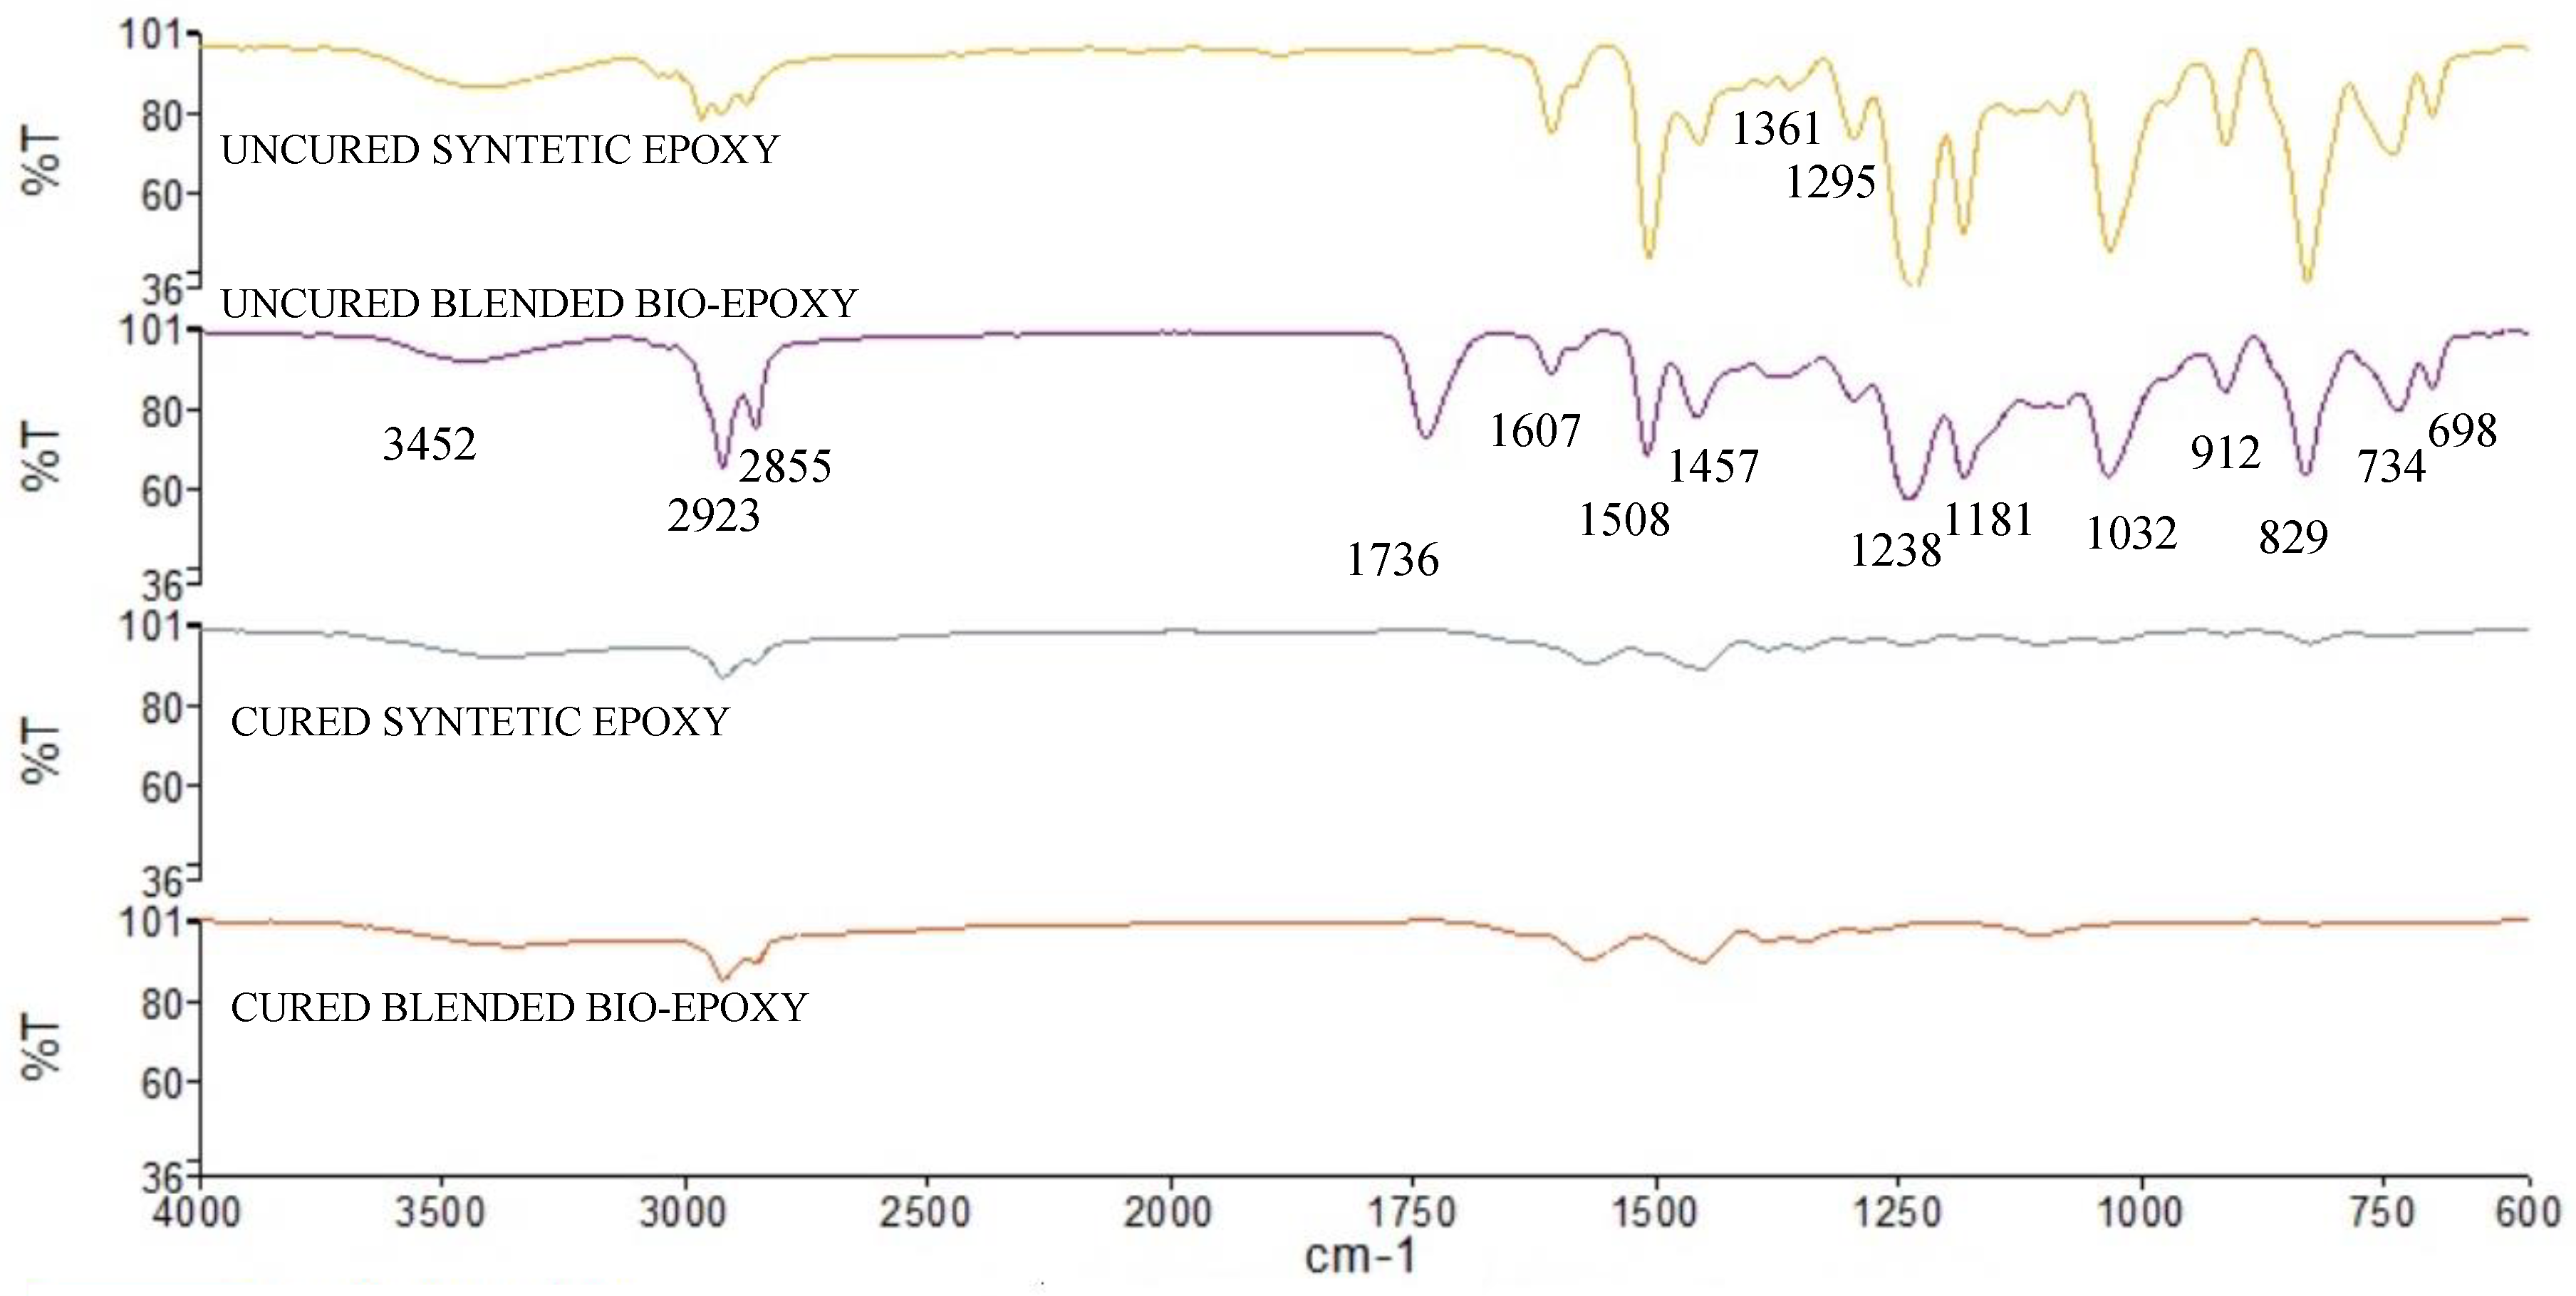
3.1. FT-IR Spectrum
3.2. Thermal Testing Result
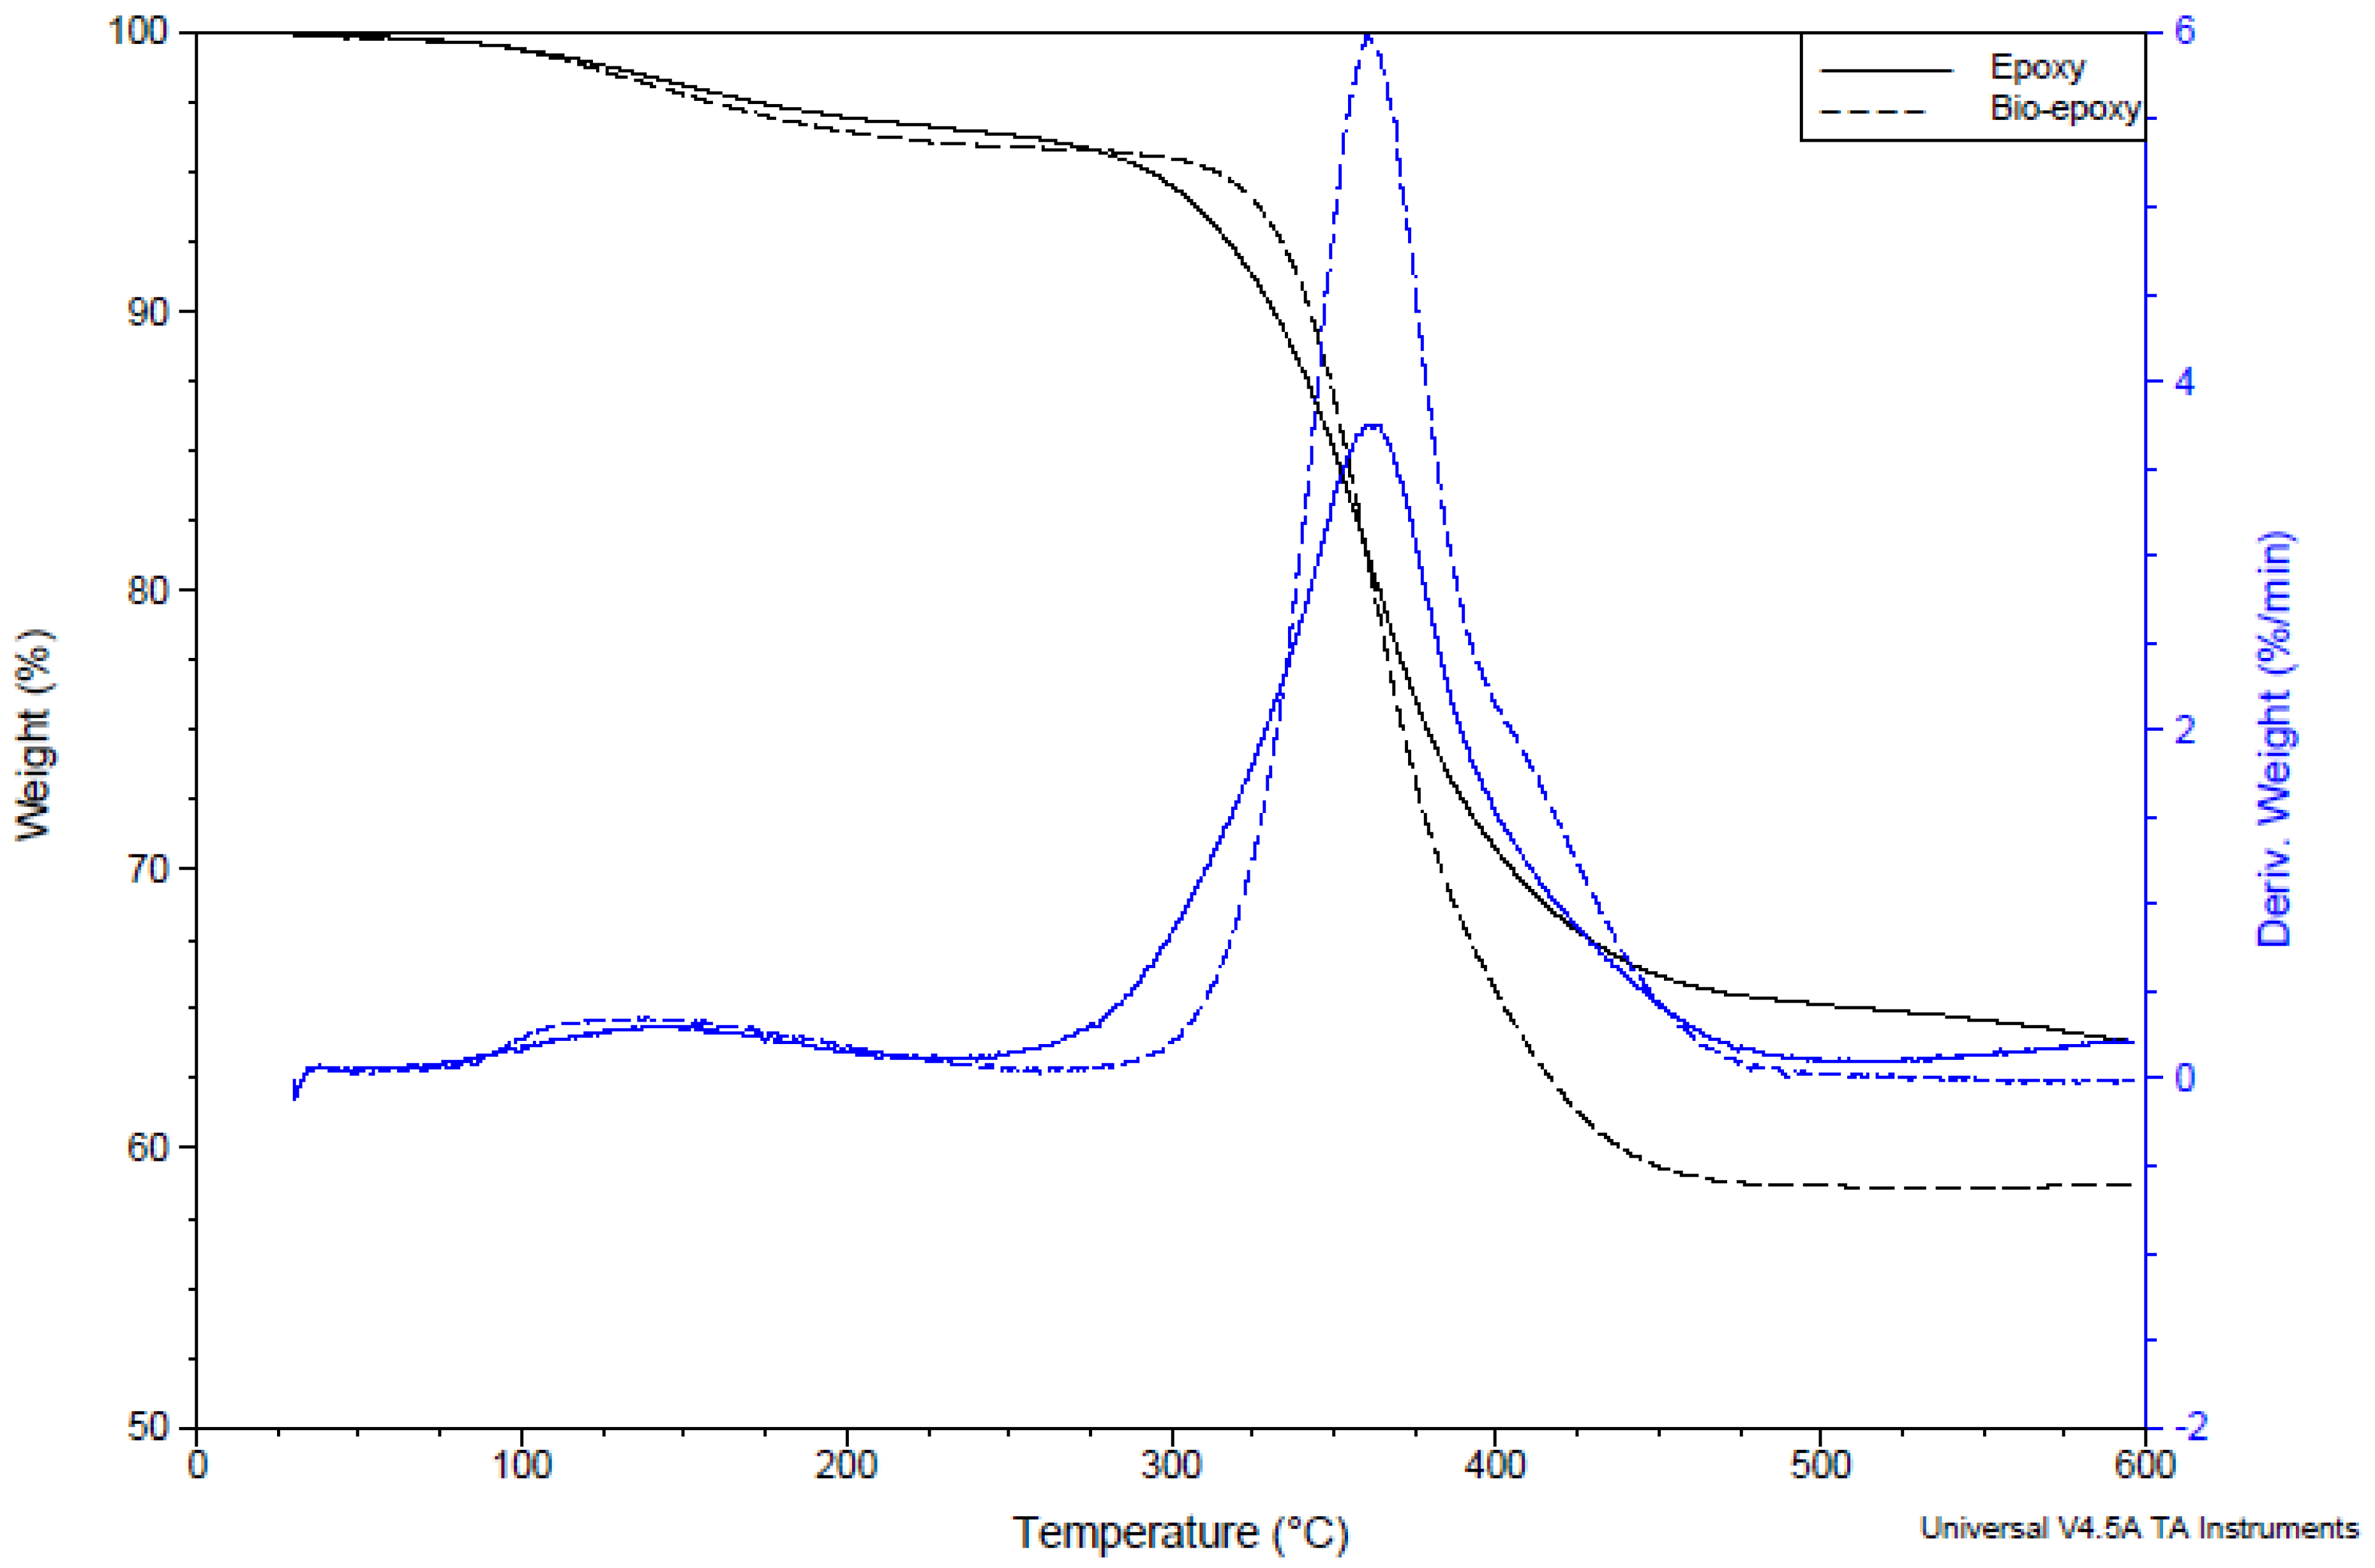
3.2.1. Thermal Stability by TGA
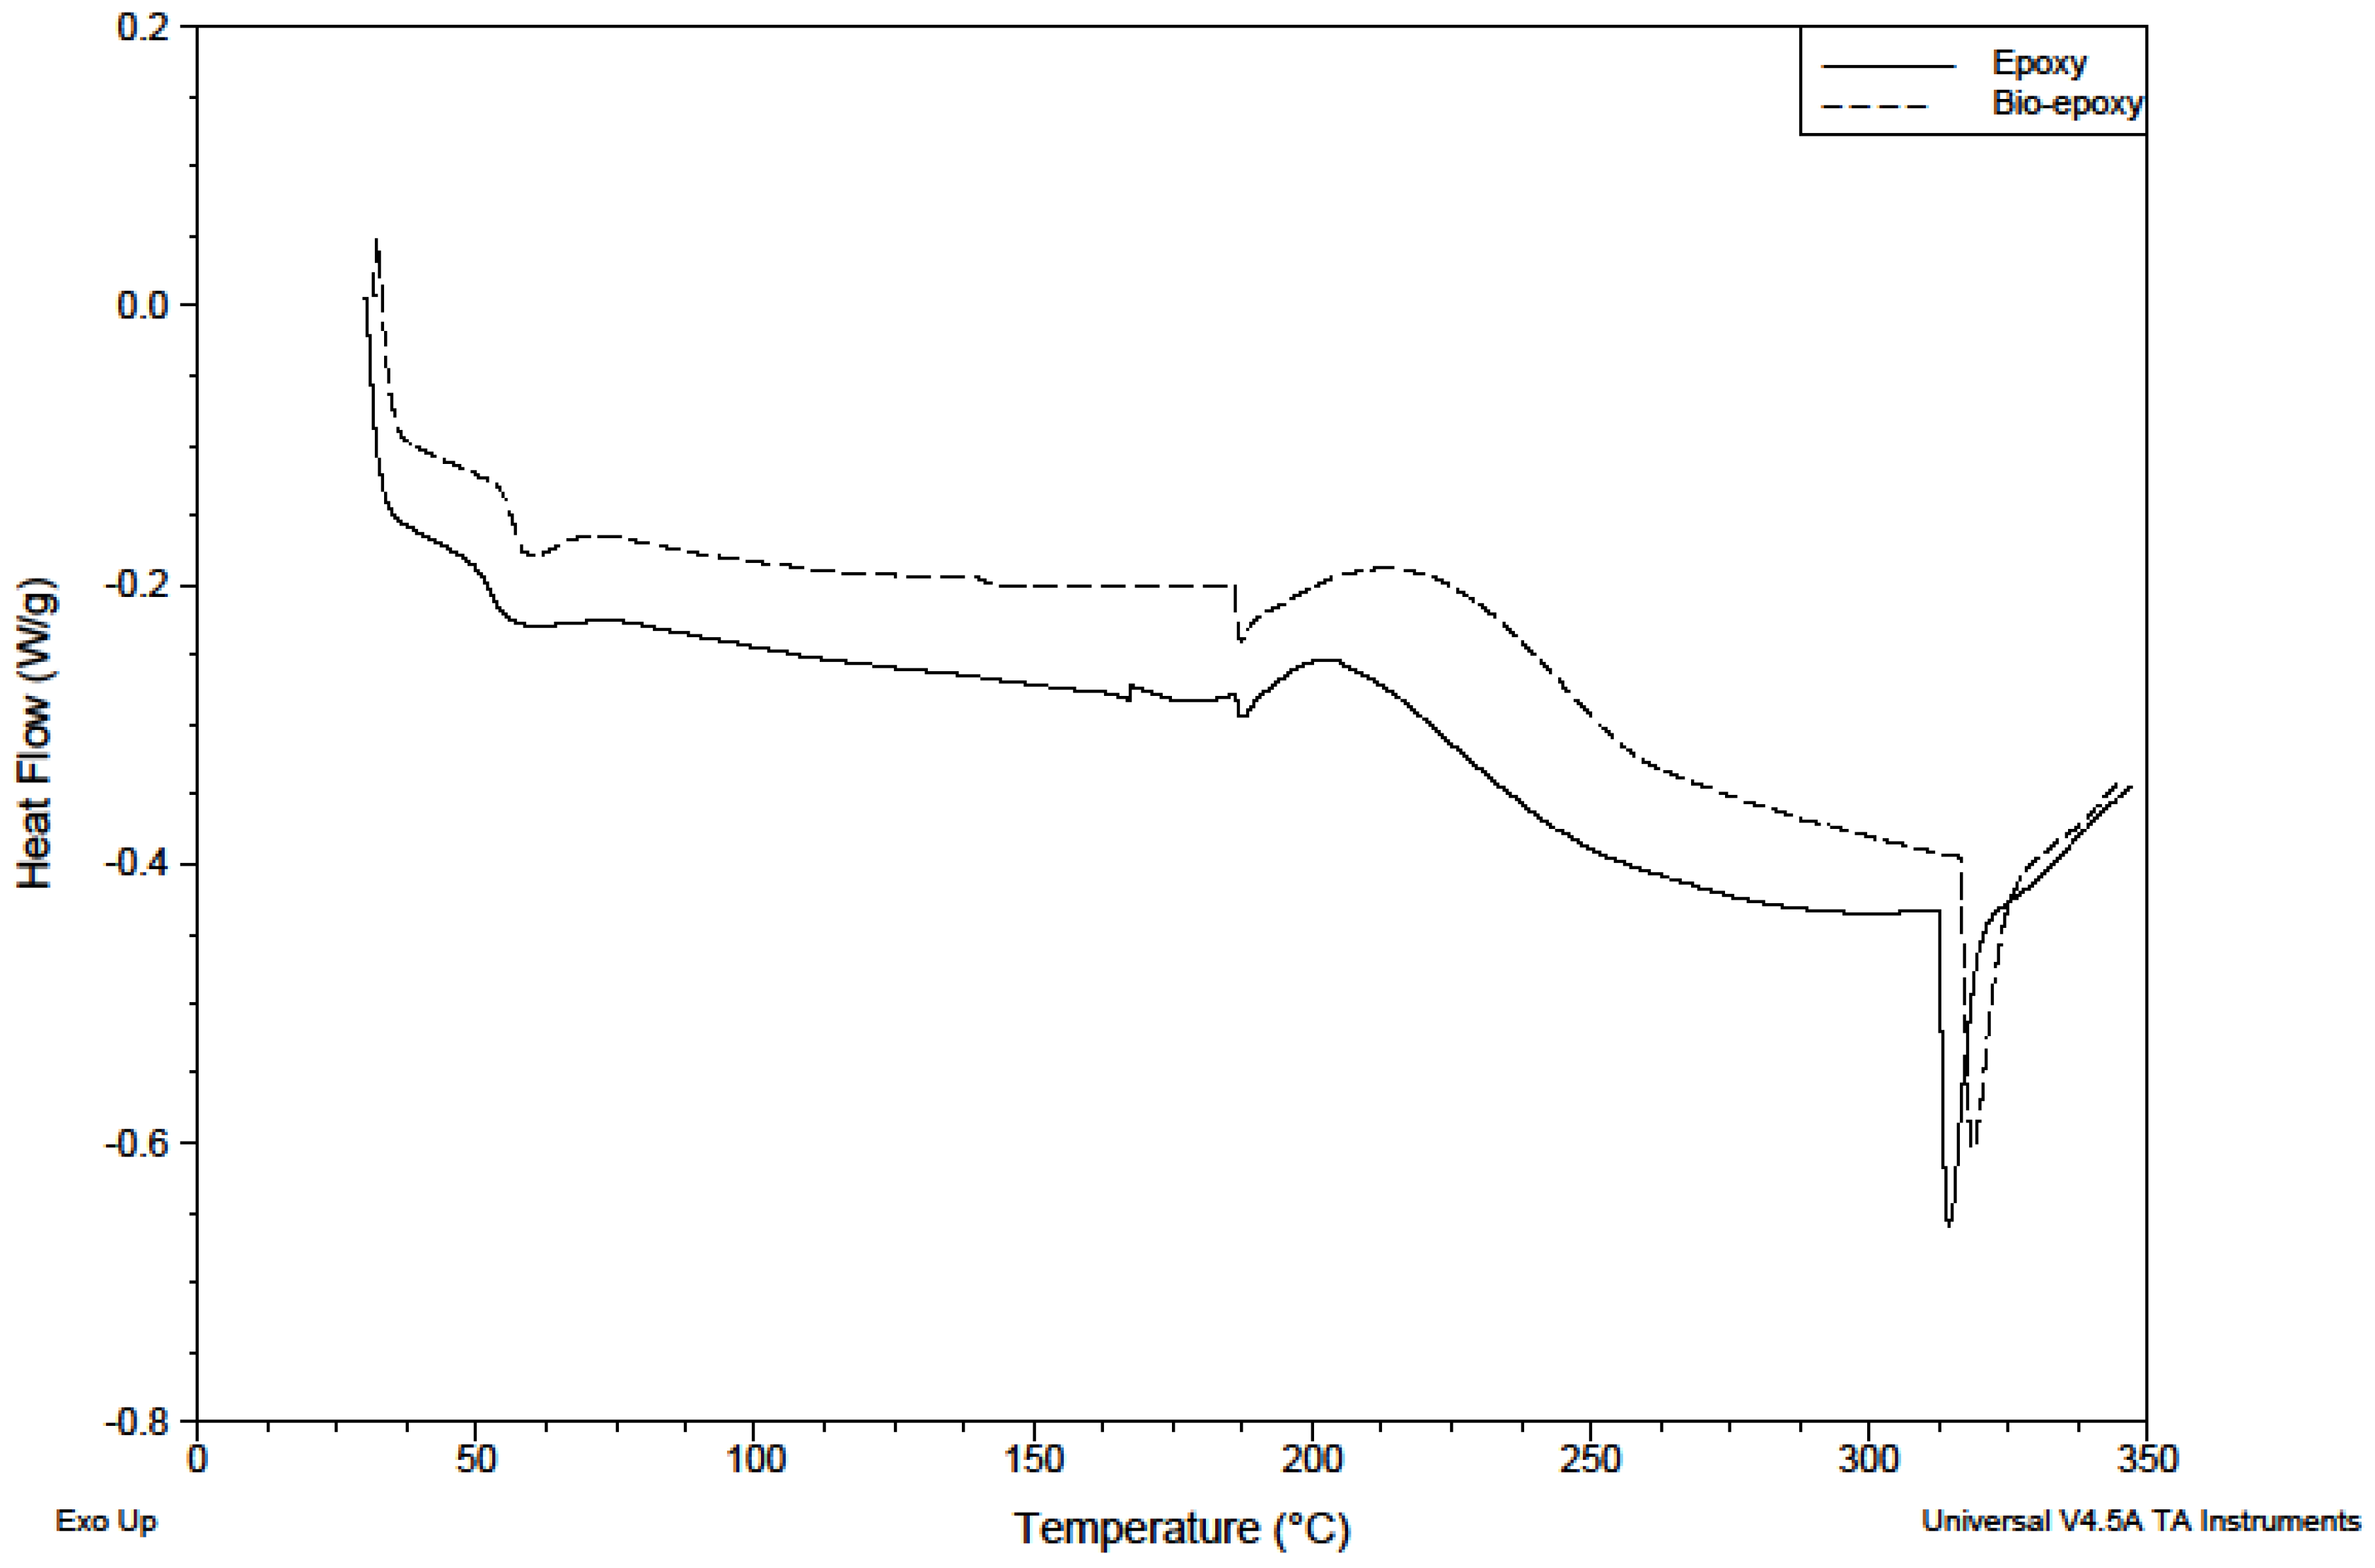
3.2.2. Temperature Transition by DSC
3.3. Dynamic Mechanical Analysis Results
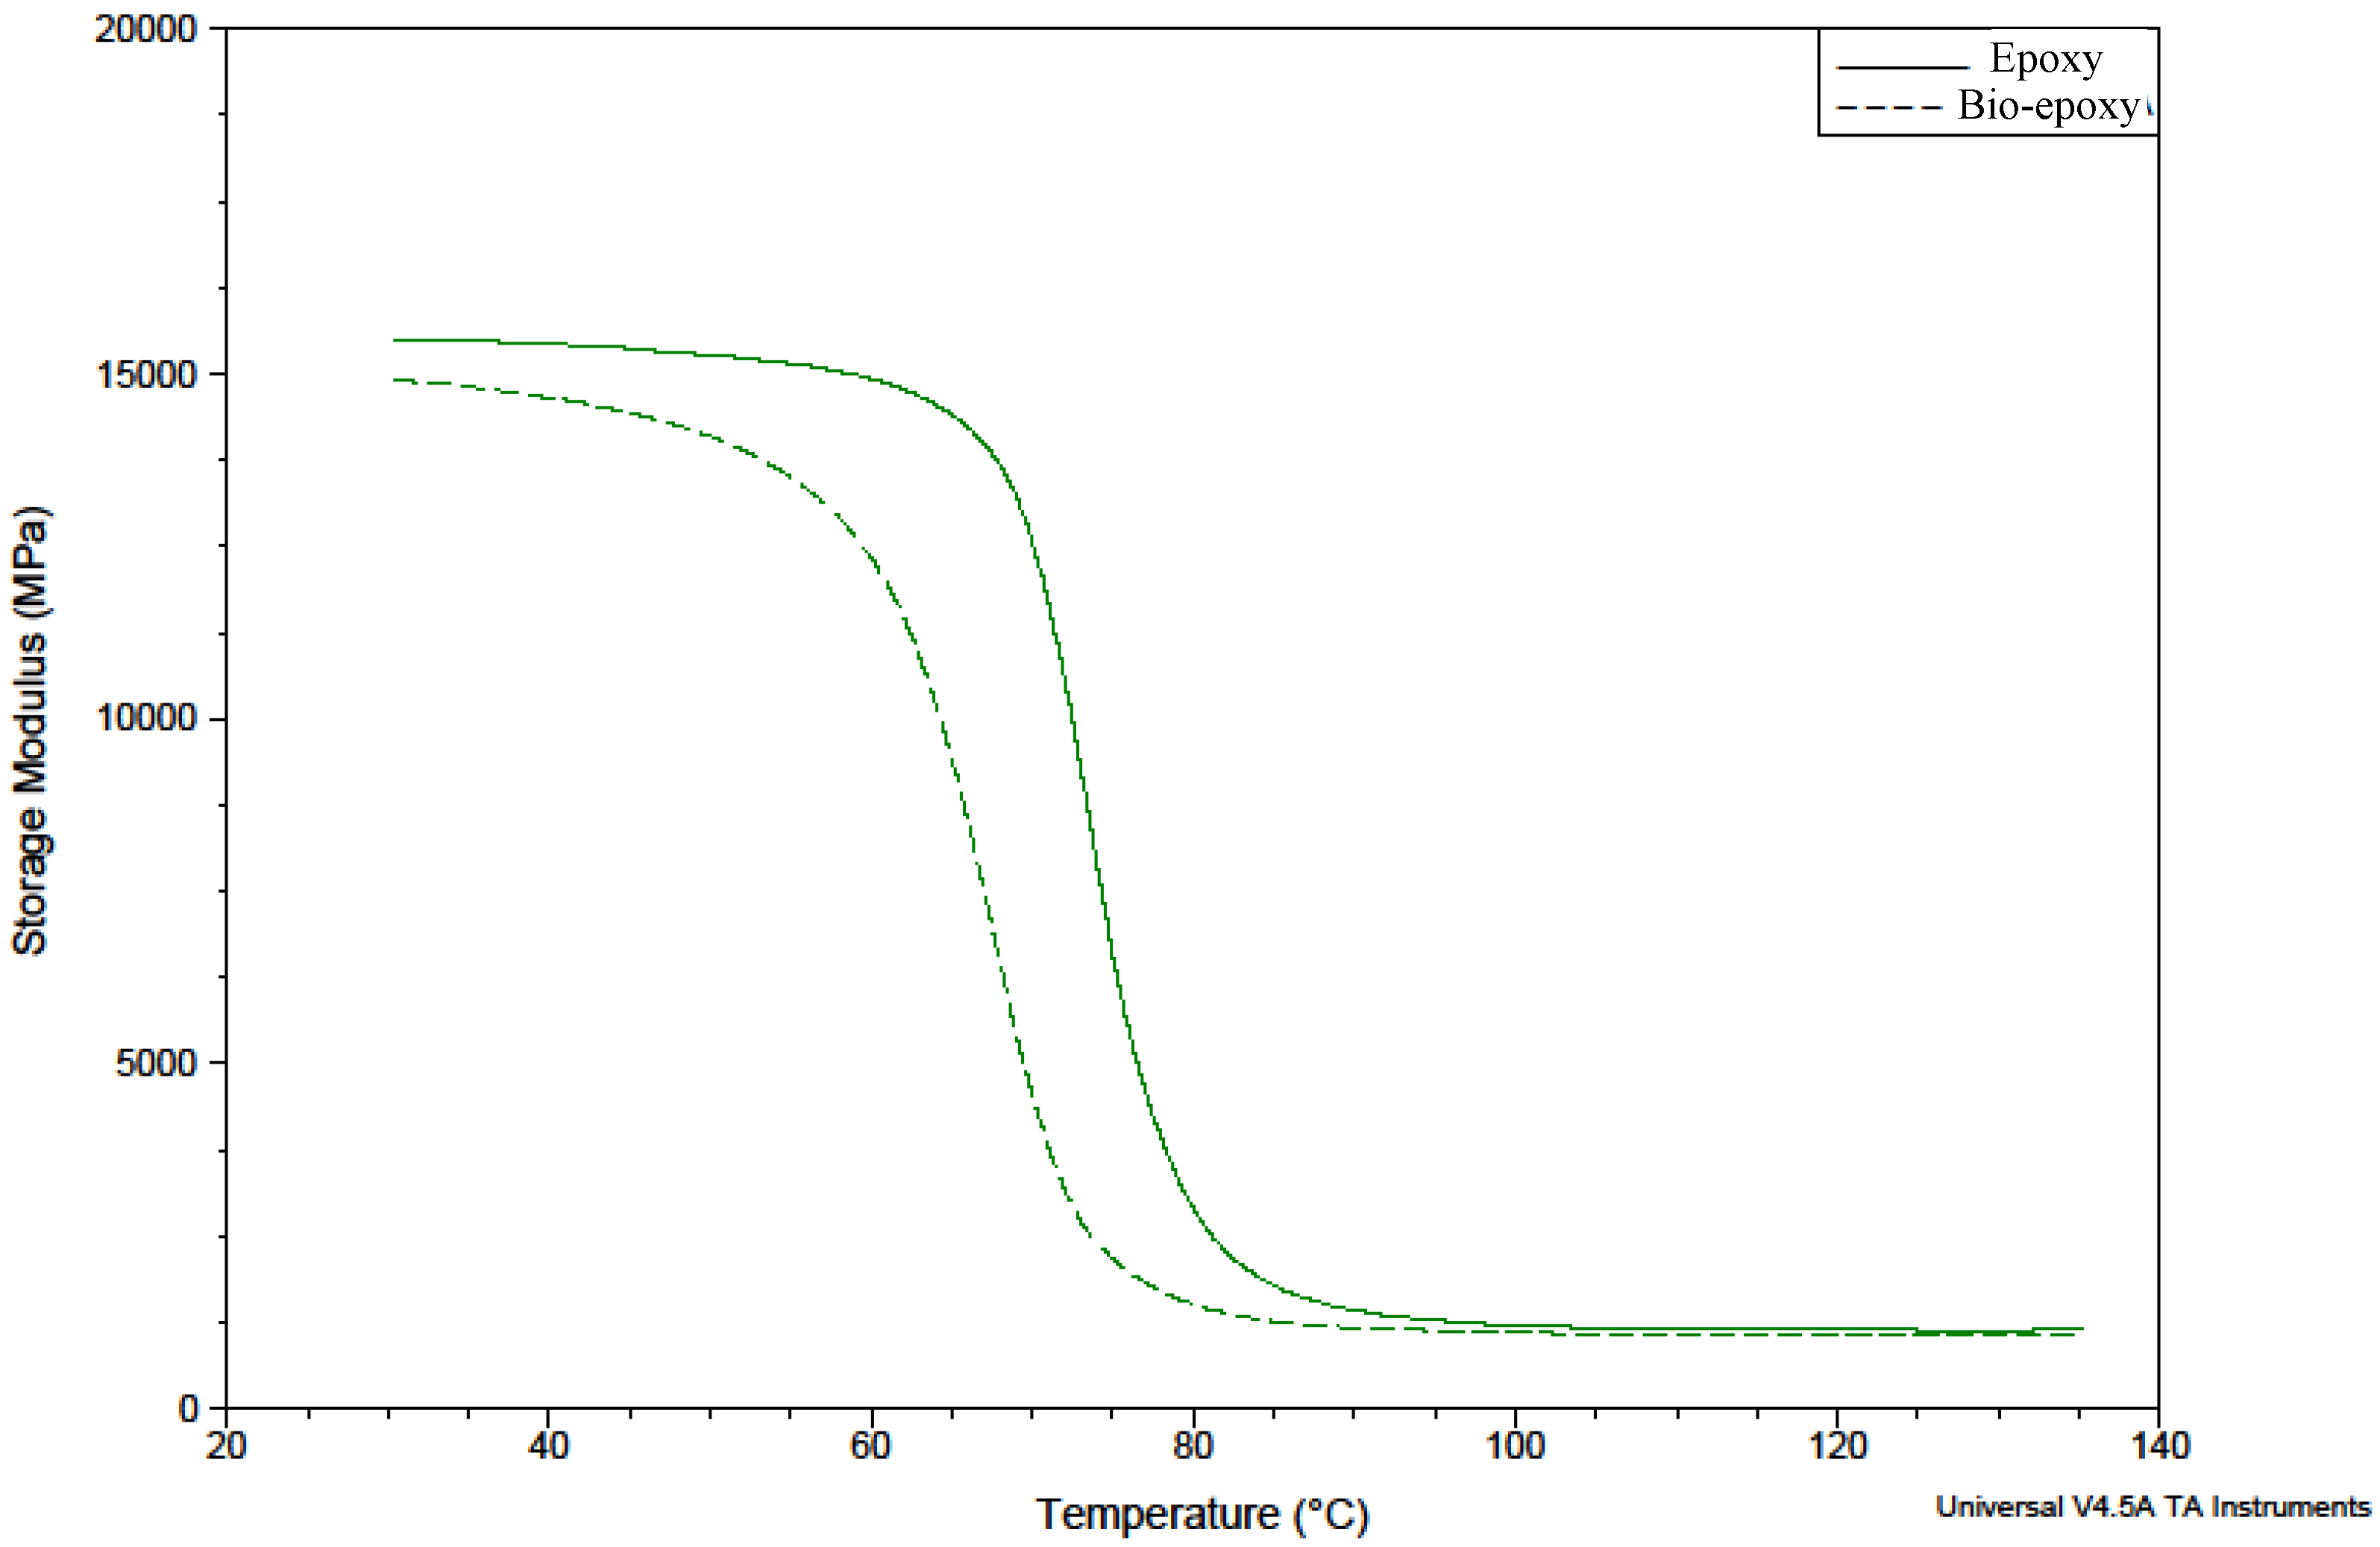
3.3.1. Storage Modulus
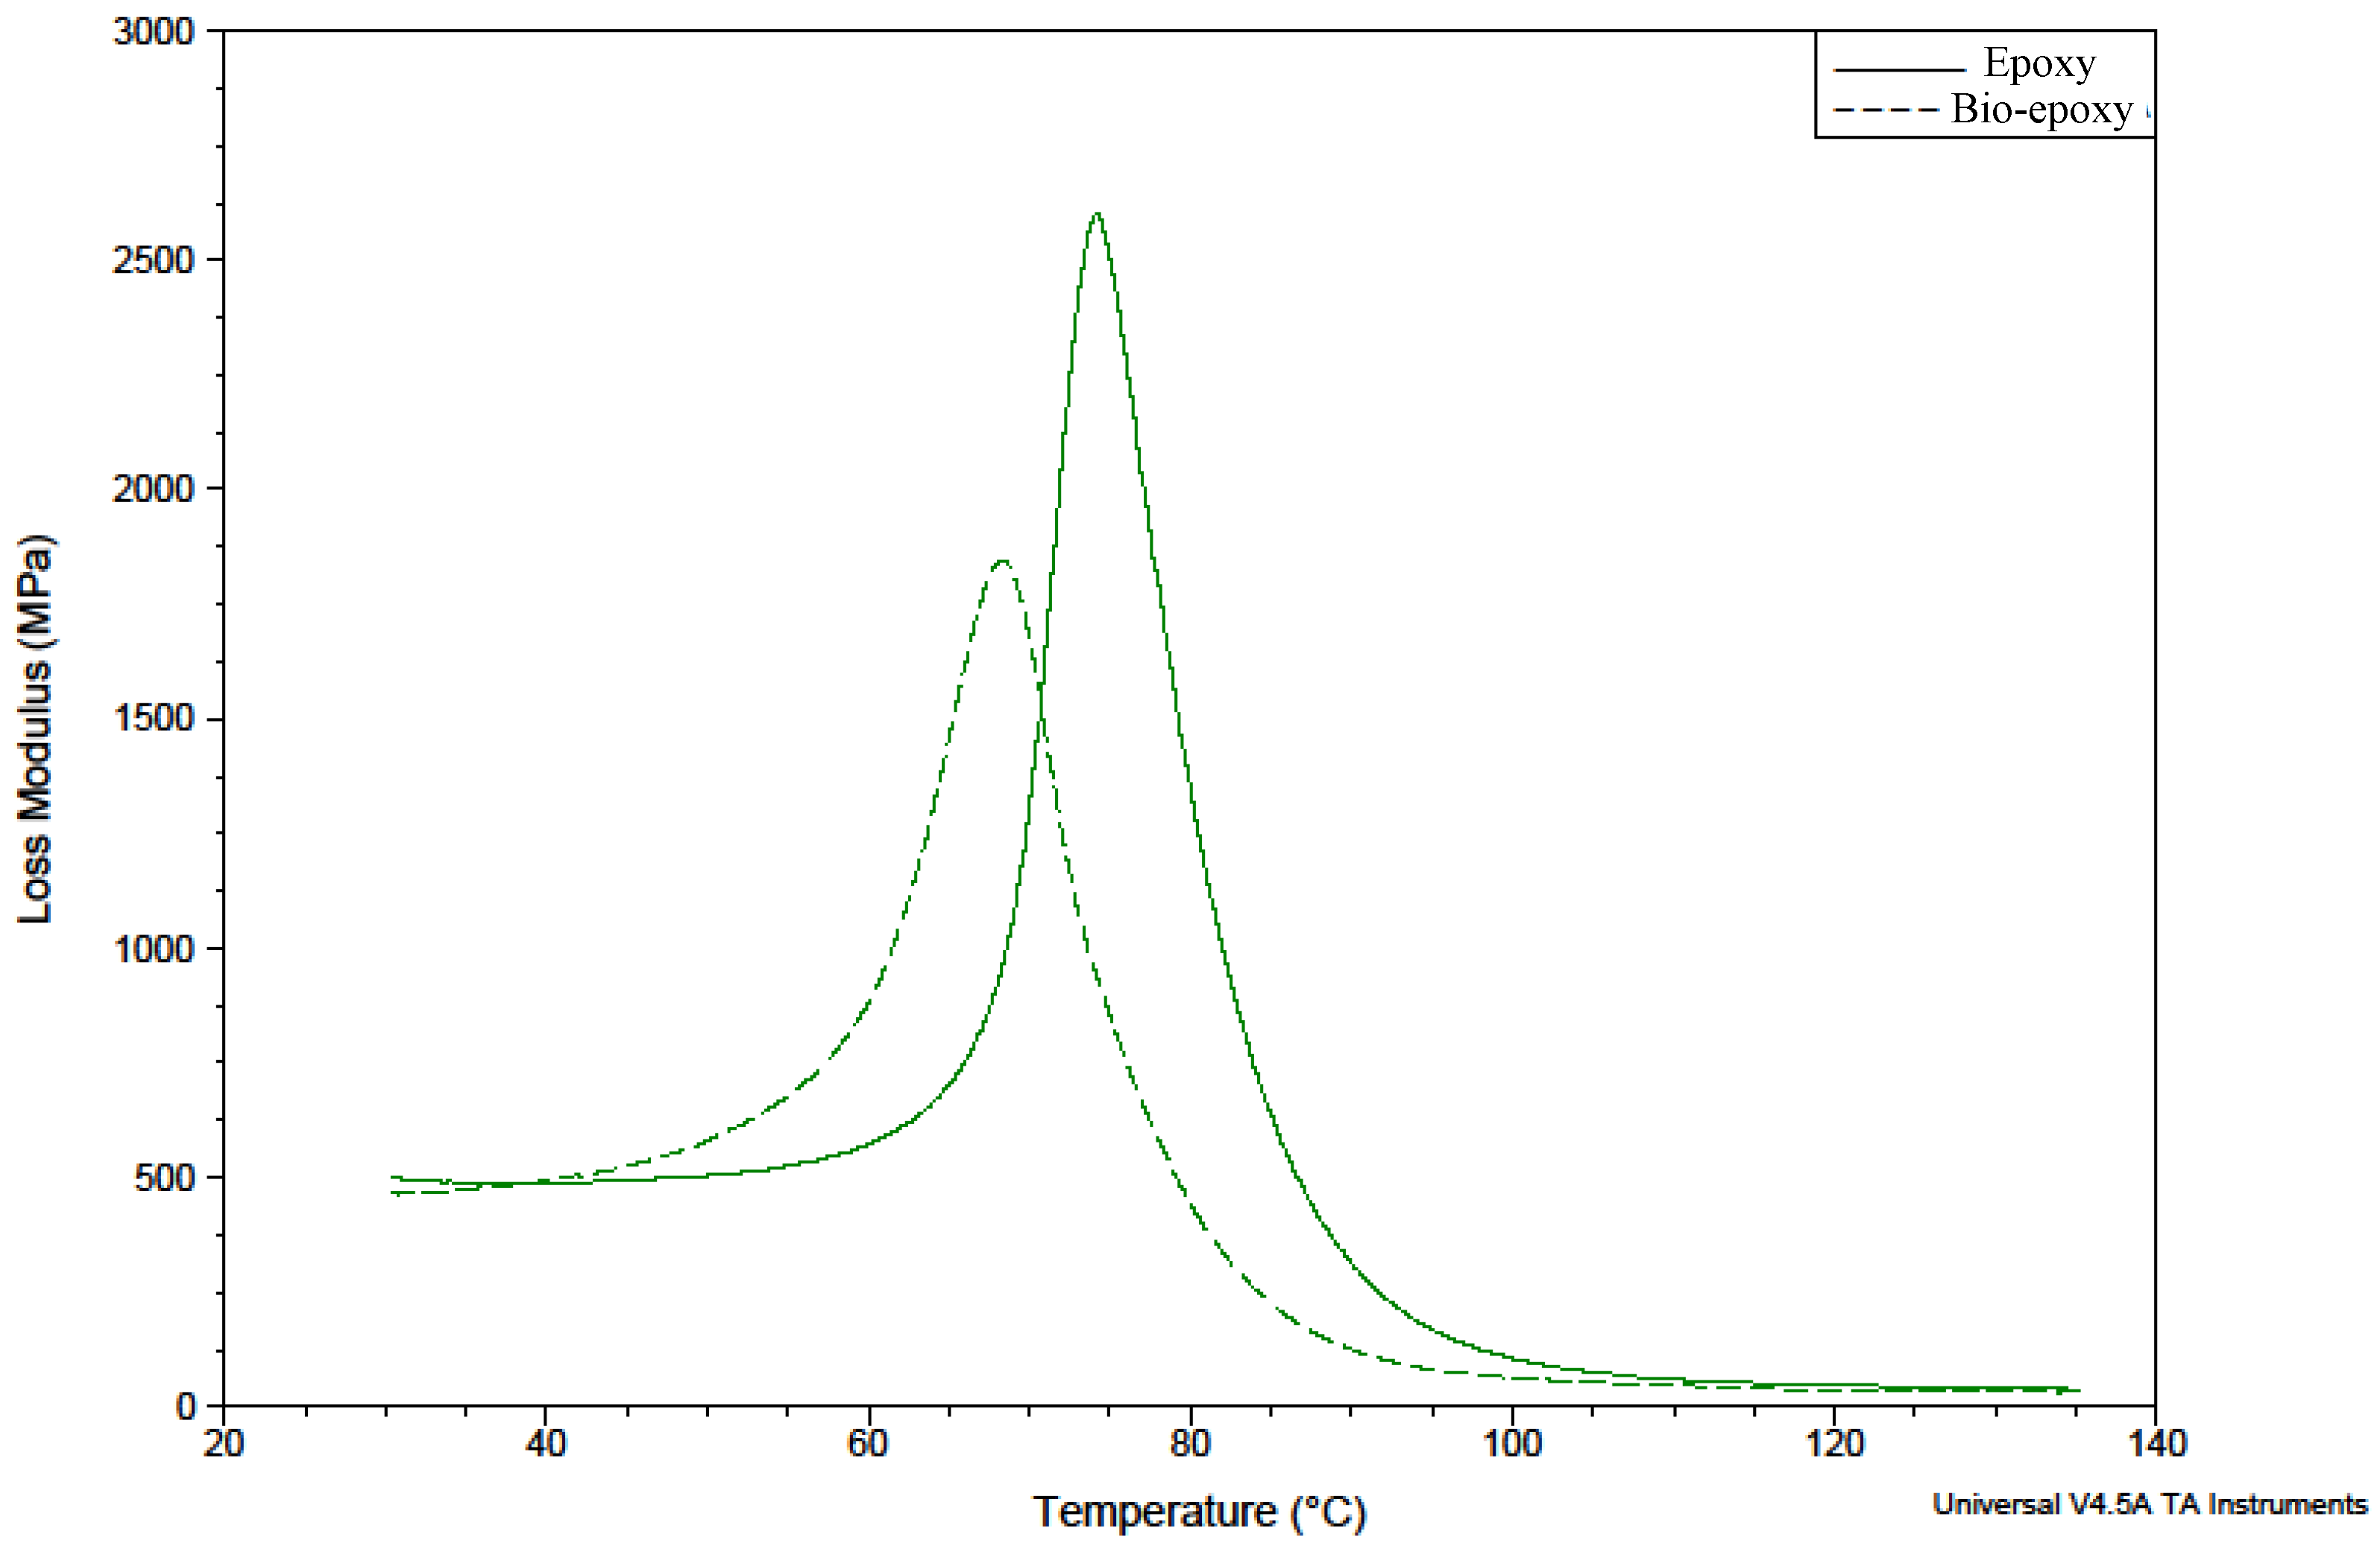
3.3.2. Loss Modulus
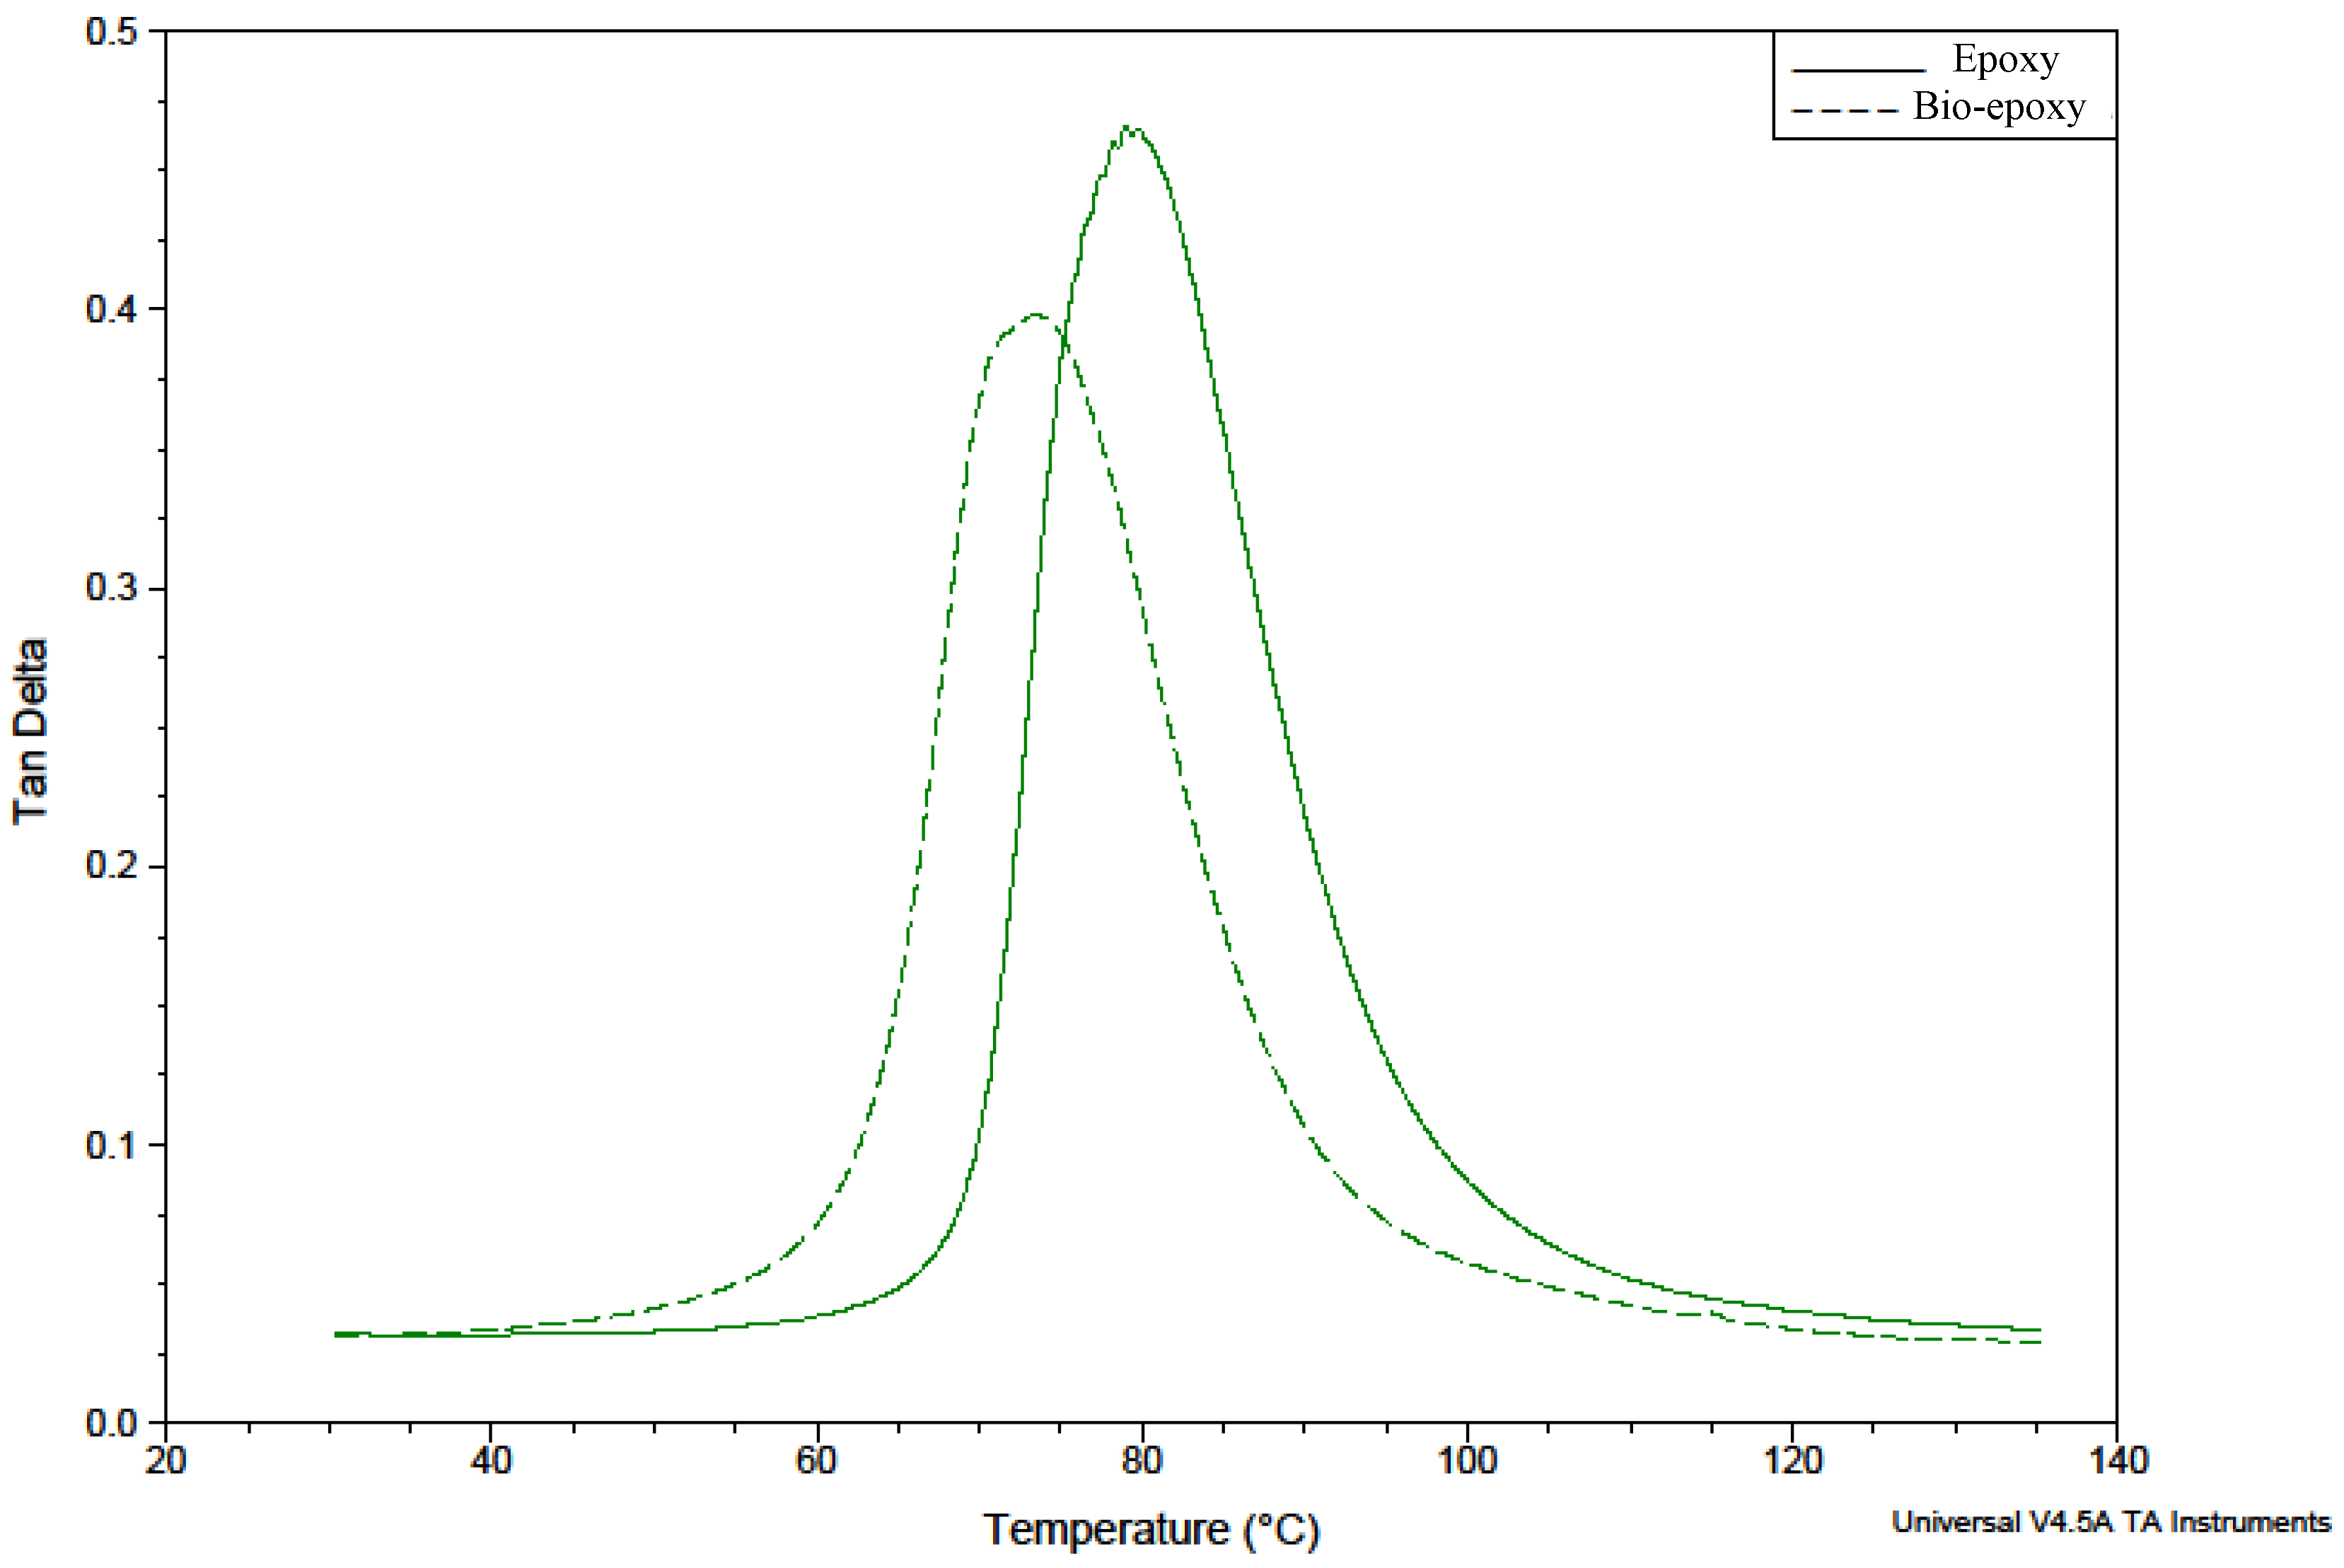
3.3.3. Tan Delta δ
3.4. Flammability Result
4. Conclusions
- Chemical bonding of cured blended jatropha bio-epoxy and synthetic epoxy are almost identical.
- The blended jatropha bio-epoxy composite structure has better thermal stability and thermal degradation in the range 288–350 °C.
- Amongst the methods for finding the glass transition temperature, Tg, of this blended jatropha bio-epoxy composite structure, the highest Tg temperature was obtained by the tan delta curve, which is 75 °C. All the curves from DMA, TGA, and DSC analyses indicate that the jatropha bio-epoxy blended well into the matrix as only one Tg occurs for each curve.
- During temperature increase, the blended jatropha bio-epoxy composite structure started to lose its stiffness and damping ability earlier than the composite structure with the fully synthetic epoxy.
- In terms of flammability, the self-extinguishing capability was established at 66.7 s after propagation of a small flame.
- Some interesting comparison characteristics between them are tabulated in Table 7.
Author Contributions
Funding
Acknowledgments
Conflicts of Interest
References
- Caillol, S.; David, G.; Boutevin, B.; Pascault, J.; de Lyon, U. Biobased Thermosetting Epoxy: Present and Future. Chem. Rev. 2014, 114, 1082–1115. [Google Scholar] [CrossRef]
- Paramarta, A.; Webster, D.C. Bio-based high performance epoxy-anhydride thermosets for structural composites: The effect of composition variables. React. Funct. Polym. 2016, 105, 140–149. [Google Scholar] [CrossRef]
- Hafiezal, M.R.M.; Abdan, K.; Azaman, M.D.; Abidin, Z.Z.; Hanafee, Z.M. Initial Study of New Bio-based Epoxy in Carbon Fiber Reinforced Composite Panel Manufactured by Vacuum Assisted Resin Transfer Moulding. AIP Conf. Proc. 2017, 1885. [Google Scholar] [CrossRef]
- Hafiezal, M.R.M.; Abdan, K.; Abidin, Z.Z.; Azaman, M.D.; Hanafee, Z.M. Physical Characterization of Carbon Fiber Reinforced Composite with Blended Epoxidized Jatropha Oil (EJO). IOP Conf. Ser. Mater. Sci. Eng. 2018, 368. [Google Scholar] [CrossRef]
- Min, M.; Yaakob, Z.; Kamarudin, S.; Chuah, L. Synthesis and characterization of Jatropha (Jatropha curcas L) oil-based polyurethane wood adhesive. Ind. Crop. Prod. 2014, 60, 177–185. [Google Scholar]
- Sammaiah, A.; Padmaja, K.V.; Badari, R.; Prasad, N. Synthesis of Epoxy Jatropha Oil and its Evaluation for Lubricant Properties. J. Eleo Sci. 2014, 643, 637–643. [Google Scholar] [CrossRef]
- Ng, E.N.S. Characteristics and Composition of Jatropha curcas Oils, Variety Congo-Brazzaville. Res. J. Appl. Sci. Eng. Technol. 2009, 1, 154–159. [Google Scholar]
- Kumar, M.N.S.; Yaakob, Z.; Mohan, N.; Babu, S.P.K. Mechanical and Abrasive Wear Studies on Biobased Jatropha Oil Cake Incorporated Glass—Epoxy Composites. J. Am. Oil Chem. Soc. 2010, 87, 929–936. [Google Scholar] [CrossRef]
- Niedermann, P.; Szebényi, G.; Toldy, A. Characterization of high glass transition temperature sugar-based epoxy resin composites with jute and carbon fibre reinforcement. Compos. Sci. Technol. 2015, 117, 62–68. [Google Scholar] [CrossRef]
- Liu, K.; Madbouly, S.A.; Kessler, M.R. Biorenewable thermosetting copolymer based on soybean oil and eugenol. Eur. Polym. J. 2015, 69, 16–28. [Google Scholar] [CrossRef]
- Gogoi, P.; Boruah, M.; Sharma, S.; Dolui, S.K. Blends of epoxidized alkyd resins based on jatropha oil and the epoxidized oil cured with aqueous citric acid solution: A green technology approach. ACS Sustain. Chem. Eng. 2015, 3, 261–268. [Google Scholar] [CrossRef]
- Gogoi, P.; Boruah, M.; Bora, C.; Dolui, S.K. Jatropha curcas oil based alkyd/epoxy resin/expanded graphite (EG) reinforced bio-composite: Evaluation of the thermal, mechanical and flame retardancy properties. Prog. Org. Coat. 2014, 77, 87–93. [Google Scholar] [CrossRef]
- Szolnoki, B.; Bocz, K.; Marosi, G.; Toldy, A. Flame Retardancy of Sorbitol Based Bioepoxy via Combined Solid and Gas Phase Action. Polymers 2016, 8, 322. [Google Scholar] [CrossRef]
- Ezzah, F. Production Characterization and Kinetic Modelling of Malaysia Jatropha Oil Based Bio-Epoxy Resins. Master’s Thesis, University Putra Malaysia, Seri Kembangan, Malaysia, 2016. [Google Scholar]
- Abdullah, B.M.; Salih, N.; Salimon, J. Optimization of the chemoenzymatic mono-epoxidation of linoleic acid using D-optimal design. J. Saudi Chem. Soc. 2014, 18, 276–287. [Google Scholar] [CrossRef] [Green Version]
- Taylor, P.; Ikhuoria, E.U.; Obuleke, R.O.; Okieimen, F.E. Studies on the Kinetics of Epoxidation of the Methyl Esters of Parkia Biglobosa Seed Oil. J. Macromol. Sci. Part A Pure Appl. Chem. 2007, 37–41. [Google Scholar] [CrossRef]
- Hazmi, A.S.A.; Aung, M.M.; Abdullah, L.C.; Salleh, M.Z.; Mahmood, M.H. Producing Jatropha oil-based polyol via epoxidatioin and ring opening. Ind. Crops. Prod. 2013, 50, 563–567. [Google Scholar] [CrossRef]
- Ishak, A.A.; Salimon, J. Synthesis of Rubber Seed Oil and Trimethylolpropane Based Biolubricant Base Stocks. Malays. J. Anal. Sci. 2013, 17, 414–421. [Google Scholar]
- Kadam, A.; Pawar, M.; Yemul, O.; Thamke, V.; Kodam, K. Biodegradable biobased epoxy resin from karanja oil. Polymer 2015, 72, 82–92. [Google Scholar] [CrossRef]
- Manthey, N.W.; Cardona, F.; Aravinthan, T. Cure Kinetic Study of Epoxidized Hemp Oil Cured with a Multiple Catalytic System. J. Appl. Polym. Sci. 2011, 125, 511–517. [Google Scholar] [CrossRef]
- Chauhan, P.S. Epoxidation in karanja oil for biolubricant applications. Int. J. Pharm. Biol. Sci. Arch. 2013, 1, 61–70. [Google Scholar]
- Tomas, V.; Petrovic, Z.S. Optimization of the Chemoenzymatic Epoxidation of Soybean Oil. J. Am. Oil Chem. Soc. 2006, 83, 247–252. [Google Scholar]
- Mincheva, R.; Delangre, A.; Raquez, J.-M.; Narayan, R.; Dubois, P. Biobased Polyesters with Composition-Dependent Thermomechanical Properties: Synthesis and Characterization of Poly(butylene succinate-co-butylene azelate). Biomacromolecules 2013, 14, 890–899. [Google Scholar] [CrossRef]
- Boll, D.J.; Bascom, W.D.; Motiee, B. Moisture Absorption by Structural Epoxy-Matrix Carbon-fiber Composites. Compos. Sci. Technol. 1985, 24, 253–273. [Google Scholar] [CrossRef]
- Gibbins, M.N.; Hoffman, D.J. Environmental Exposure Effects on Composite Materials for Commercial Aircraft. NASA Contract. Rep. 1982, 69–76. [Google Scholar]
- Xingxing, W.; Min, L.; Qing, W.; Yizhou, G.; Yanxia, L.; Shaokai, W.; Zuoguang, Z. Influence of Surface State on Moisture Sensitivity of Carbon Fiber and Its Composite Interfacial Properties. J. Wuhan Univ. Technol. Sci. Ed. 2016, 757–764. [Google Scholar] [CrossRef]
- Zafar, A.; Bertocco, F.; Rauhe, J.C. Investigation of the long term effects of moisture on carbon fibre and epoxy matrix composites. Compos. Sci. Technol. 2012, 72, 656–666. [Google Scholar] [CrossRef]
- Kuo, P.; de Assis, L.; Sheen, Y.; Sain, M. Thermal degradation of extractive-based bio-epoxy monomer and network: Kinetics and mechanism. J. Anal. Appl. Pyrolysis. 2016, 117, 199–213. [Google Scholar] [CrossRef]
- Lehrle, R.S.; Williams, R.J.; Birmingham, B. Thermal Degradation of Bacterial Poly(hydroxybutyric acid): Mechanisms from the Dependence of Pyrolysis Yields on Sample Thickness. Macromolecules 1994, 27, 3782–3789. [Google Scholar] [CrossRef]
- Bibiao, J.; Jianjun, H.; Wenyun, W.; Luxia, J.; Xinxian, C. Synthesis and properties of novel polybismaleimide oligomers. Eur. Polym. J. 2001, 37, 463–470. [Google Scholar] [CrossRef]
- Chiu, Y.; Chou, I.; Tseng, W.; Ma, C.M. Preparation and thermal properties of diglycidylether sulfone epoxy. Polym. Degrad. Stab. 2008, 93, 668–676. [Google Scholar] [CrossRef]
- Plastic Heat Resistance Index and Classification. Available online: http://Www.Sztengye-Vacuumforming.Com/News/Plastic-Heat-Resistance-Index-and-Classificati-4452617.Html (n.d.) 1–4 http://www.sztengye-vacuumforming.com/news/plastic-heat-resistance-index-and-classificati-4452617.html (accessed on 1 June 2018).
- Paluvai, N.R.; Mohanty, S.; Nayak, S.K. Synthesis and Modifications of Epoxy Resins and Their Composites: A Review. Polym. Plast. Technol. Eng. 2014, 53, 1723–1758. [Google Scholar] [CrossRef]
- Pan, X.; Sengupta, P.; Webster, D.C. High Biobased Content Epoxy À Anhydride Thermosets from Epoxidized Sucrose Esters of Fatty Acids. Biomacromolecules 2011, 12, 2416–2428. [Google Scholar] [CrossRef] [PubMed]
- Campanella, A.; Zhan, M.; Watt, P.; Grous, A.T.; Shen, C.; Wool, R.P. Triglyceride-based thermosetting resins with different reactive diluents and fiber reinforced composite applications. Compos. Part A 2015, 72, 192–199. [Google Scholar] [CrossRef]


| Physical Property | Crude Jatropha Oil (CJO) | Jatropha Bio-Epoxy | Synthetic Epoxy |
|---|---|---|---|
| Appearance | Liquid (clear yellow color) | Liquid (yellow color) | Liquid (clear color) |
| Density (g/cm3) | 0.89 | 1.30 | 1.10 |
| Dynamic Viscosity at 25 °C (cP)/(Pa·s) | 46.80 | 546.00 | 650.00 |
| Kinematic Viscosity (mm2/s) | 52.41 | 588.00 | - |
| Epoxy Equivalent Weight (EEW) (gr/eq) | 263.16 | 328.95 | - |
| Epoxy Value (eq/100 gm) | 0.38 | 0.30 | - |
| Resin | Band of Spectrum (cm−1) | Functional Group |
|---|---|---|
| Synthetic Epoxy | 3500 | O–H stretching |
| 3057 | Stretching C–H of oxirane ring | |
| 2965–2873 | Stretching C-H of CH2 and CH aromatic and aliphatic | |
| 1608 | Stretching C=C of aromatic ring | |
| 1509 | Stretching C–C of aromatic | |
| 1036 | Stretching C–O–C of ethers | |
| 915 | Stretching C–O of oxirane group | |
| 831 | Stretching C–O–C of oxirane group | |
| 772 | Rocking CH2 | |
| Amines | 3500–3300 | N–H |
| 1650–1500 | N–H deformation | |
| Jatropha bio-epoxy | 2926–2855 | C–H snowboarding vibration (aliphatic carbon) |
| 1742 | C=O stretching frequency of ester | |
| 1462 | C–H bending frequency of unsaturated alkene | |
| 1165 | C–O stretching frequency of ester | |
| 822 | C–O–C oxirane ring | |
| 724 | C–H group vibration (aliphatic) |
| Specimens | Tonset (°C) | Td5 (°C) | Td30 (°C) | Heat-Resistant Index (Ts) | Char Temp (°C) | Residual Weight (%) |
|---|---|---|---|---|---|---|
| Epoxy | 112 | 300 | 405 | 210 | 512 | 64 |
| 18 wt.% Bio-epoxy | 112 | 320 | 380 | 193 | 500 | 59 |
| Specimens | Tg Onset (°C) | Td5 Decomposition (°C) |
|---|---|---|
| Epoxy | 60 | 310 |
| 18 wt.% Bio-epoxy | 62 | 312 |
| Specimens | Tg SM from the Storage Modulus Onset Drop (°C) | Tg LM from the Loss Modulus Maximum Peak (°C) | Tg TD from the Tan Delta Maximum Peak (°C) |
|---|---|---|---|
| Epoxy | 73 | 75 | 80 |
| 18 wt.% Bio-epoxy | 68 | 70 | 75 |
| Composite Structure | Thickness (mm) | Average Time to Self-Extinguished (s) | Burning Rate in HB | Dripping Occurred |
|---|---|---|---|---|
| 0 wt.% bio-epoxy | 2.24 | 29.3 | Yes | No |
| 18 wt.% bio-epoxy | 2.42 | 66.7 | Yes | No |
| Composite with Fully Synthetic Epoxy | Composite with 18 wt.% Blended Jatropha Bio-Epoxy | |
|---|---|---|
| Heat-resistant Index Ts (°C) | 210.0 | 193.0 |
| Glass Transition Tg (°C) | ||
| Maximum temperature | 80.0 | 75.0 |
| Minimum temperature | 73.0 | 68.0 |
| Time to self-extinguished (s) | 29.3 | 66.7 |
© 2019 by the authors. Licensee MDPI, Basel, Switzerland. This article is an open access article distributed under the terms and conditions of the Creative Commons Attribution (CC BY) license (http://creativecommons.org/licenses/by/4.0/).
Share and Cite
Hafiezal, M.R.M.; Khalina, A.; Zurina, Z.A.; Azaman, M.D.M.; Hanafee, Z.M. Thermal and Flammability Characteristics of Blended Jatropha Bio-Epoxy as Matrix in Carbon Fiber–Reinforced Polymer. J. Compos. Sci. 2019, 3, 6. https://doi.org/10.3390/jcs3010006
Hafiezal MRM, Khalina A, Zurina ZA, Azaman MDM, Hanafee ZM. Thermal and Flammability Characteristics of Blended Jatropha Bio-Epoxy as Matrix in Carbon Fiber–Reinforced Polymer. Journal of Composites Science. 2019; 3(1):6. https://doi.org/10.3390/jcs3010006
Chicago/Turabian StyleHafiezal, Mohd Radzi Mohd, Abdan Khalina, Zainal Abidin Zurina, Md Deros Mohd Azaman, and Zin Mohd Hanafee. 2019. "Thermal and Flammability Characteristics of Blended Jatropha Bio-Epoxy as Matrix in Carbon Fiber–Reinforced Polymer" Journal of Composites Science 3, no. 1: 6. https://doi.org/10.3390/jcs3010006