Article

Particle Size Effect on Powder Packing Properties and Molten Pool Dimensions in Laser Powder Bed Fusion Simulation

Additive Manufacturing Group, Research Center for Structural Materials, National Institute for Materials Science, Tsukuba 305-0047, Japan
*
Author to whom correspondence should be addressed.
J. Manuf. Mater. Process. 2024, 8(2), 71; https://doi.org/10.3390/jmmp8020071
Submission received: 8 March 2024 / Revised: 28 March 2024 / Accepted: 30 March 2024 / Published: 1 April 2024

Abstract

:
Various defects are produced during the laser powder bed fusion (L-PBF) process, which can affect the quality of the fabricated part. Previous studies have revealed that the defects formed are correlated with molten pool dimensions. Powder particles are thinly spread on a substrate during the L-PBF process; hence, powder packing properties should influence the molten pool dimensions. This study evaluated the influence of particle size on powder packing properties and molten pool dimensions obtained through numerical simulations. Using particles with different average diameters ( D a v ) of 24, 28, 32, 36, and 40 μ m, a series of discrete-element method (DEM) simulations were performed. The packing fraction obtained from DEM simulations became high as D a v became small. Several particles piled up for small D a v , whereas particles spread with almost one-particle diameter thickness for large D a v . Moreover, the packing structure was inhomogeneous and sparse for large D a v . As a result of multiphysics computational fluid dynamics (CFD) simulations incorporating particles’ positions as initial solid metal volume, the molten pool width obtained was hardly dependent on the D a v and was roughly equivalent to the laser spot size used in the simulations. In contrast, the molten pool depth decreased as D a v decreased. Even if the powder bed thickness is the same, small particles can form a complex packing structure by piling up, resulting in a large specific surface area. This can lead to a complex laser reflection compared to the large particles coated with almost one-particle thickness. The complex reflection absorbs the heat generated by laser irradiation inside the powder bed formed on the substrate. As a result, the depth of the molten pool formed below the substrate is reduced for small particles.

1. Introduction

Laser powder bed fusion (L-PBF) is a type of 3D additive manufacturing technology that produces parts with complex geometries. This study focuses on L-PBF for Ni-based alloys, which are commonly used in various industries such as aerospace and energy due to their high corrosion resistance and strength at high temperatures. An example of L-PBF for Ni-based alloys is its use in turbine blades for aircraft engines, which were traditionally manufactured by casting using a mould. One advantage of L-PBF is that it does not require a mould. Furthermore, the L-PBF process is characterised by a significantly higher solidification rate compared to conventional manufacturing processes. This results in a distinctive microstructure, as noted by Schneider et al. [1]. Peters et al. reported that parts manufactured using Ni-based alloy powder with L-PBF had higher yield strength and ultimate tensile strength compared to those manufactured by casting and solution annealing. However, the elongation at break was reduced [2]. Kuo et al. reported that the microstructure formed by electron beam PBF is unique and has excellent strength properties. However, it has lower creep ductility at high temperatures compared to parts produced by the forging process [3]. This may be due to the influence of oxides and nitrides formed from the powder particle surface, known as a prior particle boundary (PPB) [4]. As such, advantages and disadvantages exist for parts manufactured with L-PBF. To overcome the disadvantages, it is desirable to understand the melting behaviour in a narrow zone of a few hundred metres, as well as the rapid solidification behaviour in L-PBF. With this consideration, evaluations of molten pool formation in Ni-based alloys have been carried out [5]. The molten pool is a volume of metal that has been melted by moving laser irradiation.
Moreover, previous studies have reported that defects produced during the L-PBF fabrication process are strongly correlated with the shape and size of the molten pool [6,7,8,9,10]. Previous studies have reported that different types of defects, such as keyhole pores [11,12,13], lack of fusion [6,7], and balling [14,15,16,17,18,19], can occur depending on the laser conditions, namely laser power and scanning speed. It is extremely important to be able to predict the occurrence of defects for high-quality manufacturing. After laser scanning experiments under certain laser conditions, the scanned tracks are cut and polished, and their cross-sectional images are obtained through scanning electron microscopy (SEM). This allows for the identification of the size and shape of the molten pool. However, it is very time-consuming to carry out the above experimental and observational processes under many different laser conditions. Considering the time-consuming nature of the measurement, Guirguis et al. investigated the prediction of the molten pool dimensions by combining in situ image measurements of the Ni-based alloy of Inconel 718 using machine learning [20].
In view of the situation described above, simulation studies of L-PBF have increased in the last decade. For example, heat transfer analysis, which considers changes in physical properties associated with the phase change between solid and liquid metals [6,9,21]; elasto-plastic simulation for evaluating residual stresses [9,22,23]; and multiphysics analysis which involves fluid dynamics, heat transfer considering solid–liquid–gas phase change, and laser ray tracing using multiphysics computational fluid dynamics (CFD) simulation [24,25,26,27,28,29,30,31,32,33]. The use of multiphysics CFD simulation has shown promise in predicting defect formation. Previous studies have successfully reproduced keyhole pore formation [27] and the formation of lack-of-fusion defects [30]. Multiphysics CFD was employed in this study.
In the L-PBF process, metal powder particles are spread thinly on a substrate. This means that powder bed properties, such as the packing fraction and packing homogeneity, can affect molten pool formation. For instance, previous studies have conducted pioneering work using multiphysics CFD simulations, reporting that powder bed thickness influences molten pool behaviour [34,35,36]. In addition, Fouda et al. evaluated the effect of particle size distribution, one of the most important powder characteristics, on powder bed properties using discrete-element method (DEM) simulation [37]. Cook et al. evaluated the influence of powder particle shape on powder bed properties and molten pool dimensions using DEM and CFD simulations [35]. However, except for the study by Cook et al. [35], previous studies primarily focused on laser condition, substrate temperature [28], laser beam shape [38], and the material used. There is still a lack of literature examining the impact of powder characteristics on powder bed properties and molten pool formation.
This study evaluates the effect of particle size on powder properties and molten pool formation using multiphysics CFD simulation. Section 2 explains the powder spreading DEM simulation model, which simulates the movement of a real L-PBF machine. Additionally, a summary of multiphysics CFD simulation is provided in Section 2. Section 3 presents the results of the DEM and multiphysics CFD simulations and discusses the effect of particle size on powder packing properties and molten pool dimensions. The conclusion of this study and future tasks are described in Section 4.

2. Materials and Methods

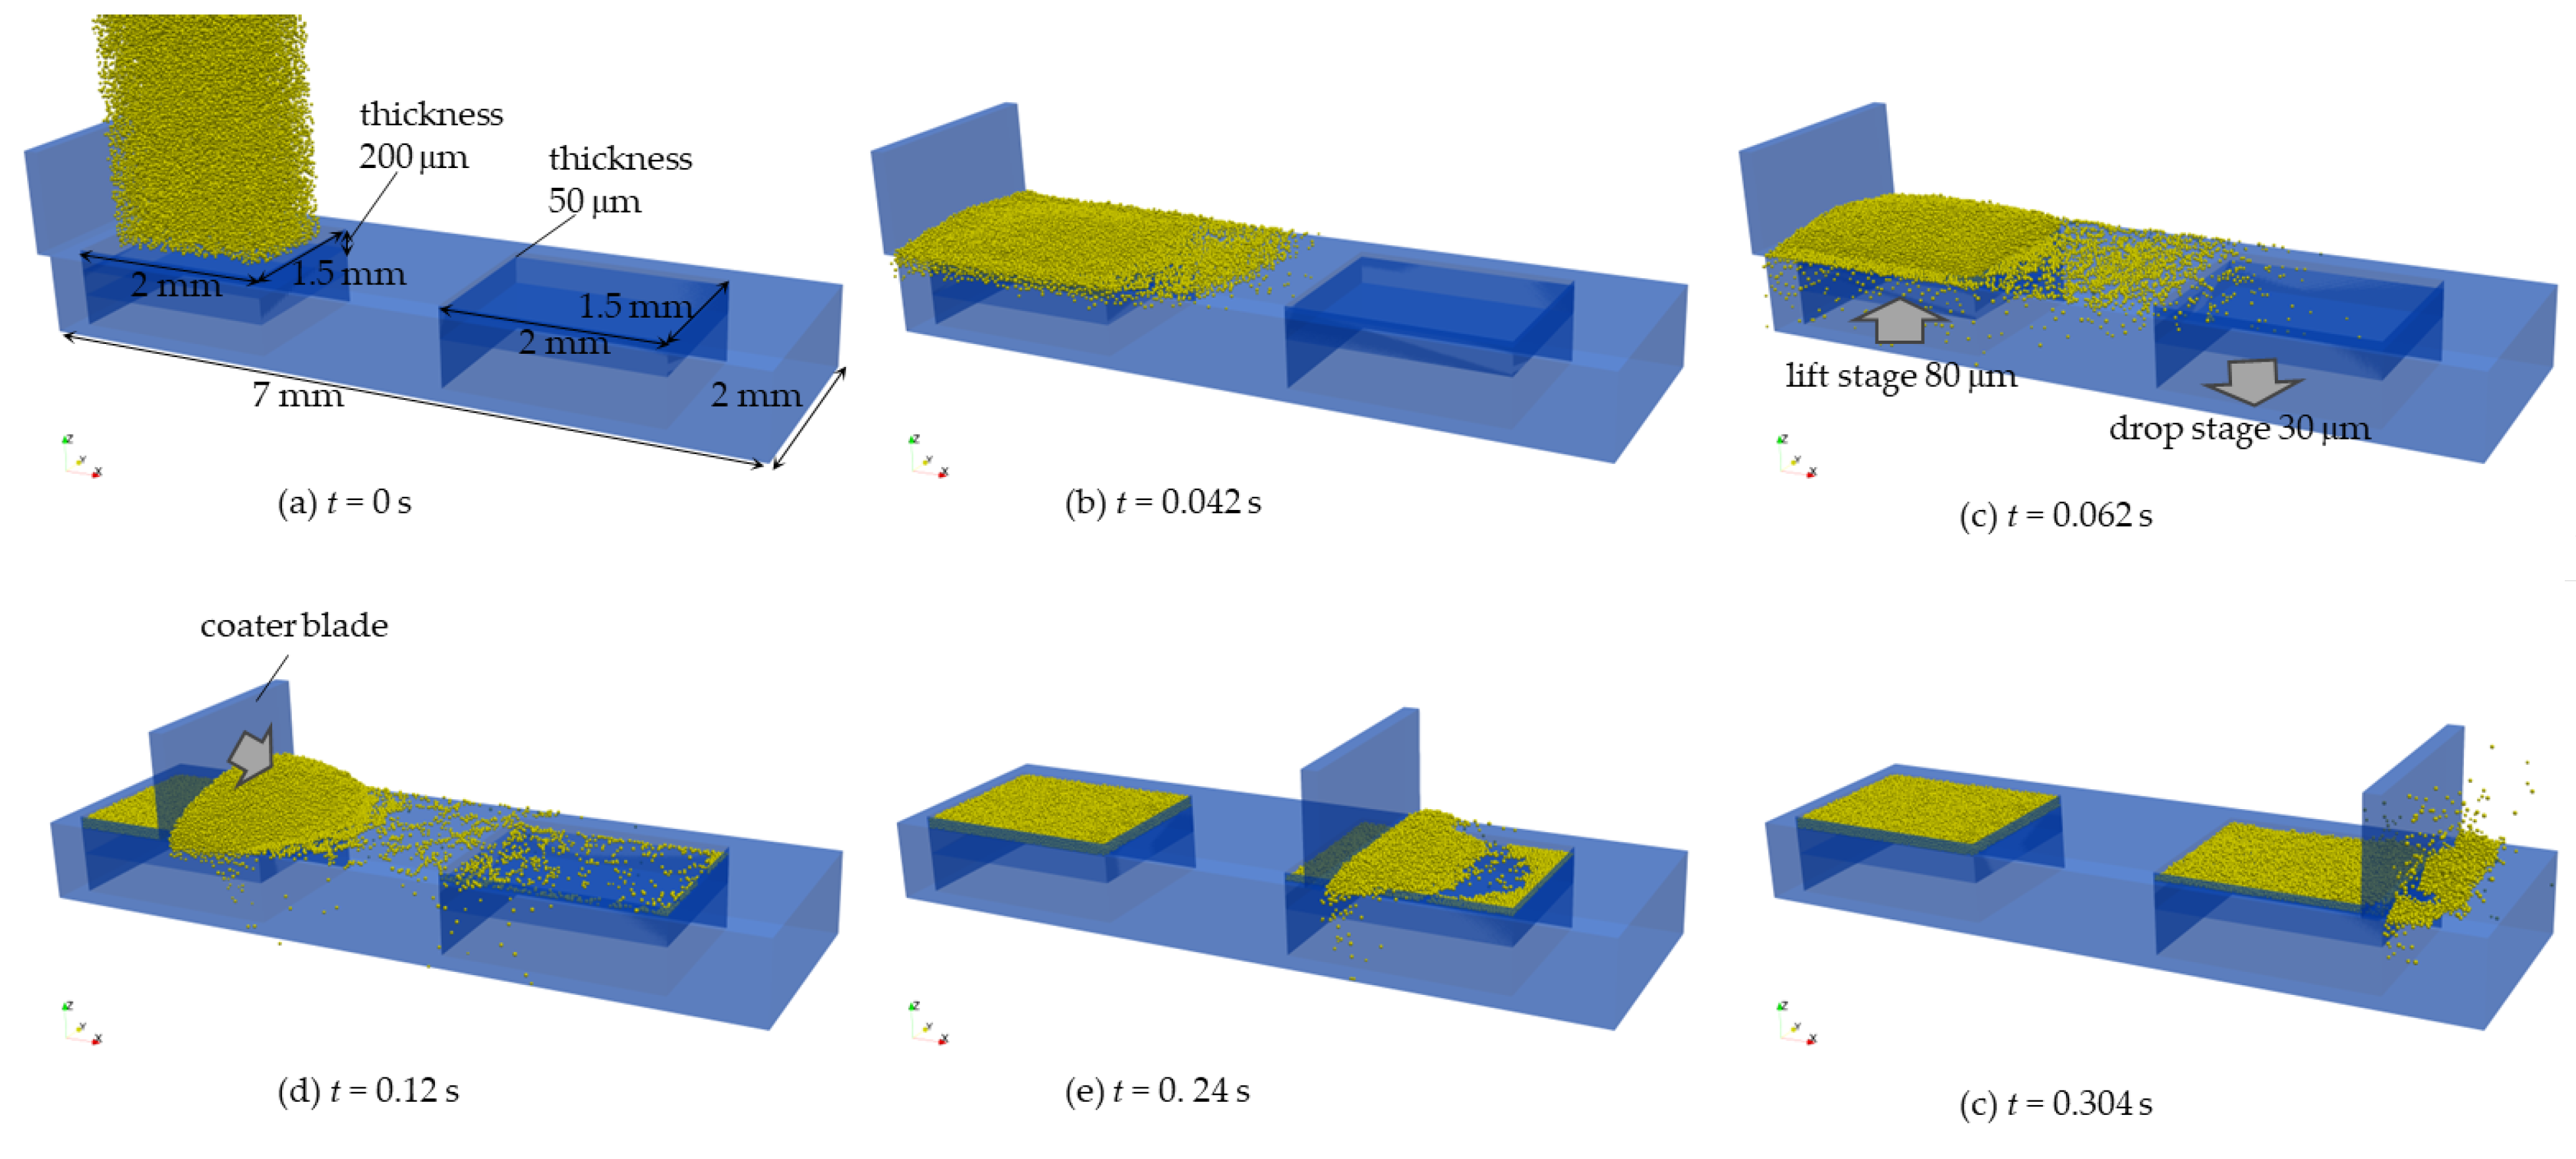
2.1. Powder Spreading Analysis

Powder spreading is modelled using the discrete-element method (DEM) [39], which is a simulation method for the dynamics of frictional rigid particles. The general-purpose DEM software LIGGGHTS (version 3.8.0) was used in this study.
A Ni-based alloy, Hastelloy X, was used in this study. The chemical compositions of both the bare plate and the Hastelloy X powder are listed in Table 1. The particle size distribution of the Ni-based alloy (Hastelloy X) powder used in this study is shown in Figure 1. The average particle diameter of Hastelloy X powder was 28.9 μ m [10,40]. To investigate the effect of particle size within a range similar to that of the Hastelloy X powder used in this study, five different particle size distributions based on Gaussian distributions were used. The average particle diameters ( D a v ) of the five distributions were 24, 28, 32, 36 and 40 μ m, respectively. The Gaussian distribution is expressed as follows:
f ( D ) = 1 2 π σ 2 exp ( D D a v ) 2 2 σ 2 ,
where D and σ are the particle diameter and standard deviation, respectively. σ = 4 for the five distributions with different D a v . In Figure 1, the solid lines represent the Gaussian distributions with different D a v . Each distribution curve was partitioned into ten equal sections, and the ten diameters (centres of the partitions) and their frequencies were used in the DEM simulations.
The particle contact model used was the Hertz contact model, and its model parameters are given in Table 2. The value of the spring constant used was extremely small compared to the Young’s modulus of real metallic materials. As the DEM is a rigid body simulation, particles do not deform. The spring constant determines the repulsive force due to particle–particle or particle–wall overlap. Two concerns arise when using a small spring constant: (1) large repulsive forces acting on the particles may cause them to explode, and (2) the particles may slip through other particles or walls, depending on the time increment used in the DEM. If Young’s modulus is assumed for the spring constant, even a small overlap can cause the particles to explode, requiring a significantly small time increment. In this study, a series of preliminary simulations was performed with different time increments using a small spring constant. As a result, a time increment of 2 × 10 8 s was determined, at which particles do not slip through and explosions do not occur.
Conventional L-PBF systems often have a powder storage region and a powder bed formation region. The powder bed formation process in these systems is as follows: The powder storage stage is lifted while the powder bed formation region stage is lowered. The lifting or lowering distance is usually on the order of tens of μ m. Then, a coating blade placed at the corner of the powder storage region is moved horizontally to spread and fill the powder into the powder formation region. Figure 2 shows snapshots captured during the powder spreading DEM simulation using a particle size distribution of D a v = 32 μ m, where D a v is the average particle diameter. The entire DEM model has a width of 7 mm (x direction) and a depth of 2 mm (y direction). The powder storage and powder bed formation regions both have a width of 2 mm and a depth of 1.5 mm. The initial thicknesses of these regions were 200 μ m and 50 μ m, respectively. First, 50,000 particles were generated in the upper rectangular area above the powder storage region and allowed to settle under gravity. Second, the powder storage stage was lifted by 80 μ m at a speed of 25 mm/s, followed by a 30 μ m drop in the powder bed formation stage. As a result, the thickness of the powder bed formation region became 80 μ m. Then, a rectangular coater blade moved along the x-direction at a speed of 25 mm/s to form the powder bed.
The boundary conditions for the six side faces were set to the f boundary style implemented in LIGGGHTS. The f boundary style essentially acts as a fixed smoothed wall boundary, but particles are lost if their positions are outside the domain. To consider the initial configuration of the particles, five simulations with different initial particle configurations were performed. A supercomputer system at the National Institute for Materials Science, Japan, was used for the powder spreading simulation. The typical computation time was about 40 h for 17,200,000 time-step calculations using 2 nodes (96 cores in total).
After the powder spreading simulation, the packing fraction ( ρ ) was calculated using the following equation:
ρ = V p a l l V P V R ,
where V P V R and V p a l l are the volume of the powder bed formation region (2 mm width, 1.5 mm depth, and 0.08 mm thickness) and the total volume of particles filled in the powder bed formation region.

2.2. Overview of Multiphysics CFD Simulation

The multiphysics CFD solver used in this study is based on a general-purpose partial differential equation solver OpenFOAM-8, with partial customisation by TERRABYTE Co., Ltd., Tokyo, Japan, to model laser welding and L-PBF processes. The solver can evaluate the dynamics of two-phase (gas and metal) multiphase flow with interface tracking using the volume-of-fluid (VOF) method, as well as heat transfer between gas, liquid, and solid phases with phase change, and ray tracing of laser beams. It is important to note that the solid phase is modelled using a liquid of extremely high-viscosity fluid. OpenFOAM is non-commercial software; hence, the solver can run freely on any Linux-based computer system, including supercomputers. This gives it an advantage over commonly used commercial software such as FLOW-3D, ANSYS, and COMSOL. In this study, the laser reflection model and its model parameters were varied for experimental validation, which are detailed in this section. Full details of the solver were summarised in our previous study [40].
A laser ray-tracing method [41] was implemented in the solver used. The laser beam is represented by a bundle of laser beams. The refraction of each beam is tracked in the ray-tracing process. When the laser beam reaches the metal surface, thermal energy is applied to the metal surface in inverse proportion to the laser’s reflectivity. The beam repeats the mirror reflections until the applied energy becomes extremely small or the laser beam does not reach the metal surface. The applied thermal energy is strongly influenced by laser reflectivity. In previous studies, various reflectivity models have been explored, including the Fresnel reflection model [32,33,40], temperature-dependent reflection model [31], and constant value [25,42].
The Fresnel reflection model is expressed as follows:
τ = 1 2 1 + 1 ϵ cos θ 2 1 + 1 + ϵ cos θ 2 + ϵ 2 2 ϵ cos θ + 2 cos 2 θ ϵ 2 + 2 ϵ cos θ + 2 cos 2 θ ,
where θ and ϵ are the laser incident angle and an arbitrary constant, respectively. As shown in Equation (3), the laser reflectivity depends on the laser incident angle. The conventionally used ϵ value is between 0.2 and 0.25.
The temperature-dependent reflectivity model, often referred to as the Hagan–Ruben model, is based on temperature-dependent electrical resistivity ( ρ e )
τ = 1 π C 0 ϵ 0 λ ρ e ,
where C 0 = 3 × 10 8 m/s, ϵ 0 = 8.854 × 10 12 F/m, and λ = 1.06 × 10 6 m represent the light speed in vacuum, vacuum permittivity, and laser wavelength, respectively. The temperature and ρ e relation used in this study are available on the website of HAYNES International (https://www.haynesintl.com/en/datasheet/hastelloy-x-alloy/#physical-properties, accessed on 6 March 2024). The temperature– ρ e relation is for temperatures ≥1367.15 K; hence, ρ e at 1367.15 K is adopted when the temperature is greater than 1367.15 K.
A constant temperature of 298.15 K was applied to the upper x-y plane, while the other five planes had an adiabatic condition for the thermal boundary conditions. An atmospheric pressure (101,325 Pa) was assumed for the top x-y plane, and a zero-gradient condition was applied to the other five planes for the pressure boundary conditions. The pressureInletOutletVelocity boundary condition for the flow velocity boundary conditions, implemented in OpenFOAM, was adopted for the upper x-y plane. The pressureInletOutletVelocity condition assumes a zero-gradient condition when the flow is outward, and when the flow is inward, the velocity is obtained from the flow with the specified inlet direction. The zero-gradient condition was applied to the other five sides.
Table 3 shows the material properties of Hastelloy X used in the multiphysics CFD simulation. Many of the properties are based on the CALPHAD calculation software JMatPro (www.sentesoftware.co.uk/jmatpro, accessed 28 February 2024)). It should be noted that the temperature-dependent surface tension value of Hastelloy X could not be found in the literature; therefore, the value of Inconel 718 [43], which is the same Ni-based alloy, was used in this study.
The time increment of the simulations was automatically determined so as not to exceed a Courant number of 1. The explicit Euler time integration scheme and the linear interpolation scheme were used for the Laplacian and gradient discretisations. The second-order linear upwind and total variation diminishing (TVD) schemes were employed for the divergent discretisation. The Gauss–Seidel method was used to calculate the flow and temperature fields. The residual for the convergence criteria of velocity and temperature was 1.0 × 10 6 . The incomplete Cholesky preconditioned conjugate gradient method was used for the pressure calculation. Considering the balance between calculation accuracy and efficiency, the residual for the iteration was 1.0 × 10 7 to ensure the stability of the calculation.

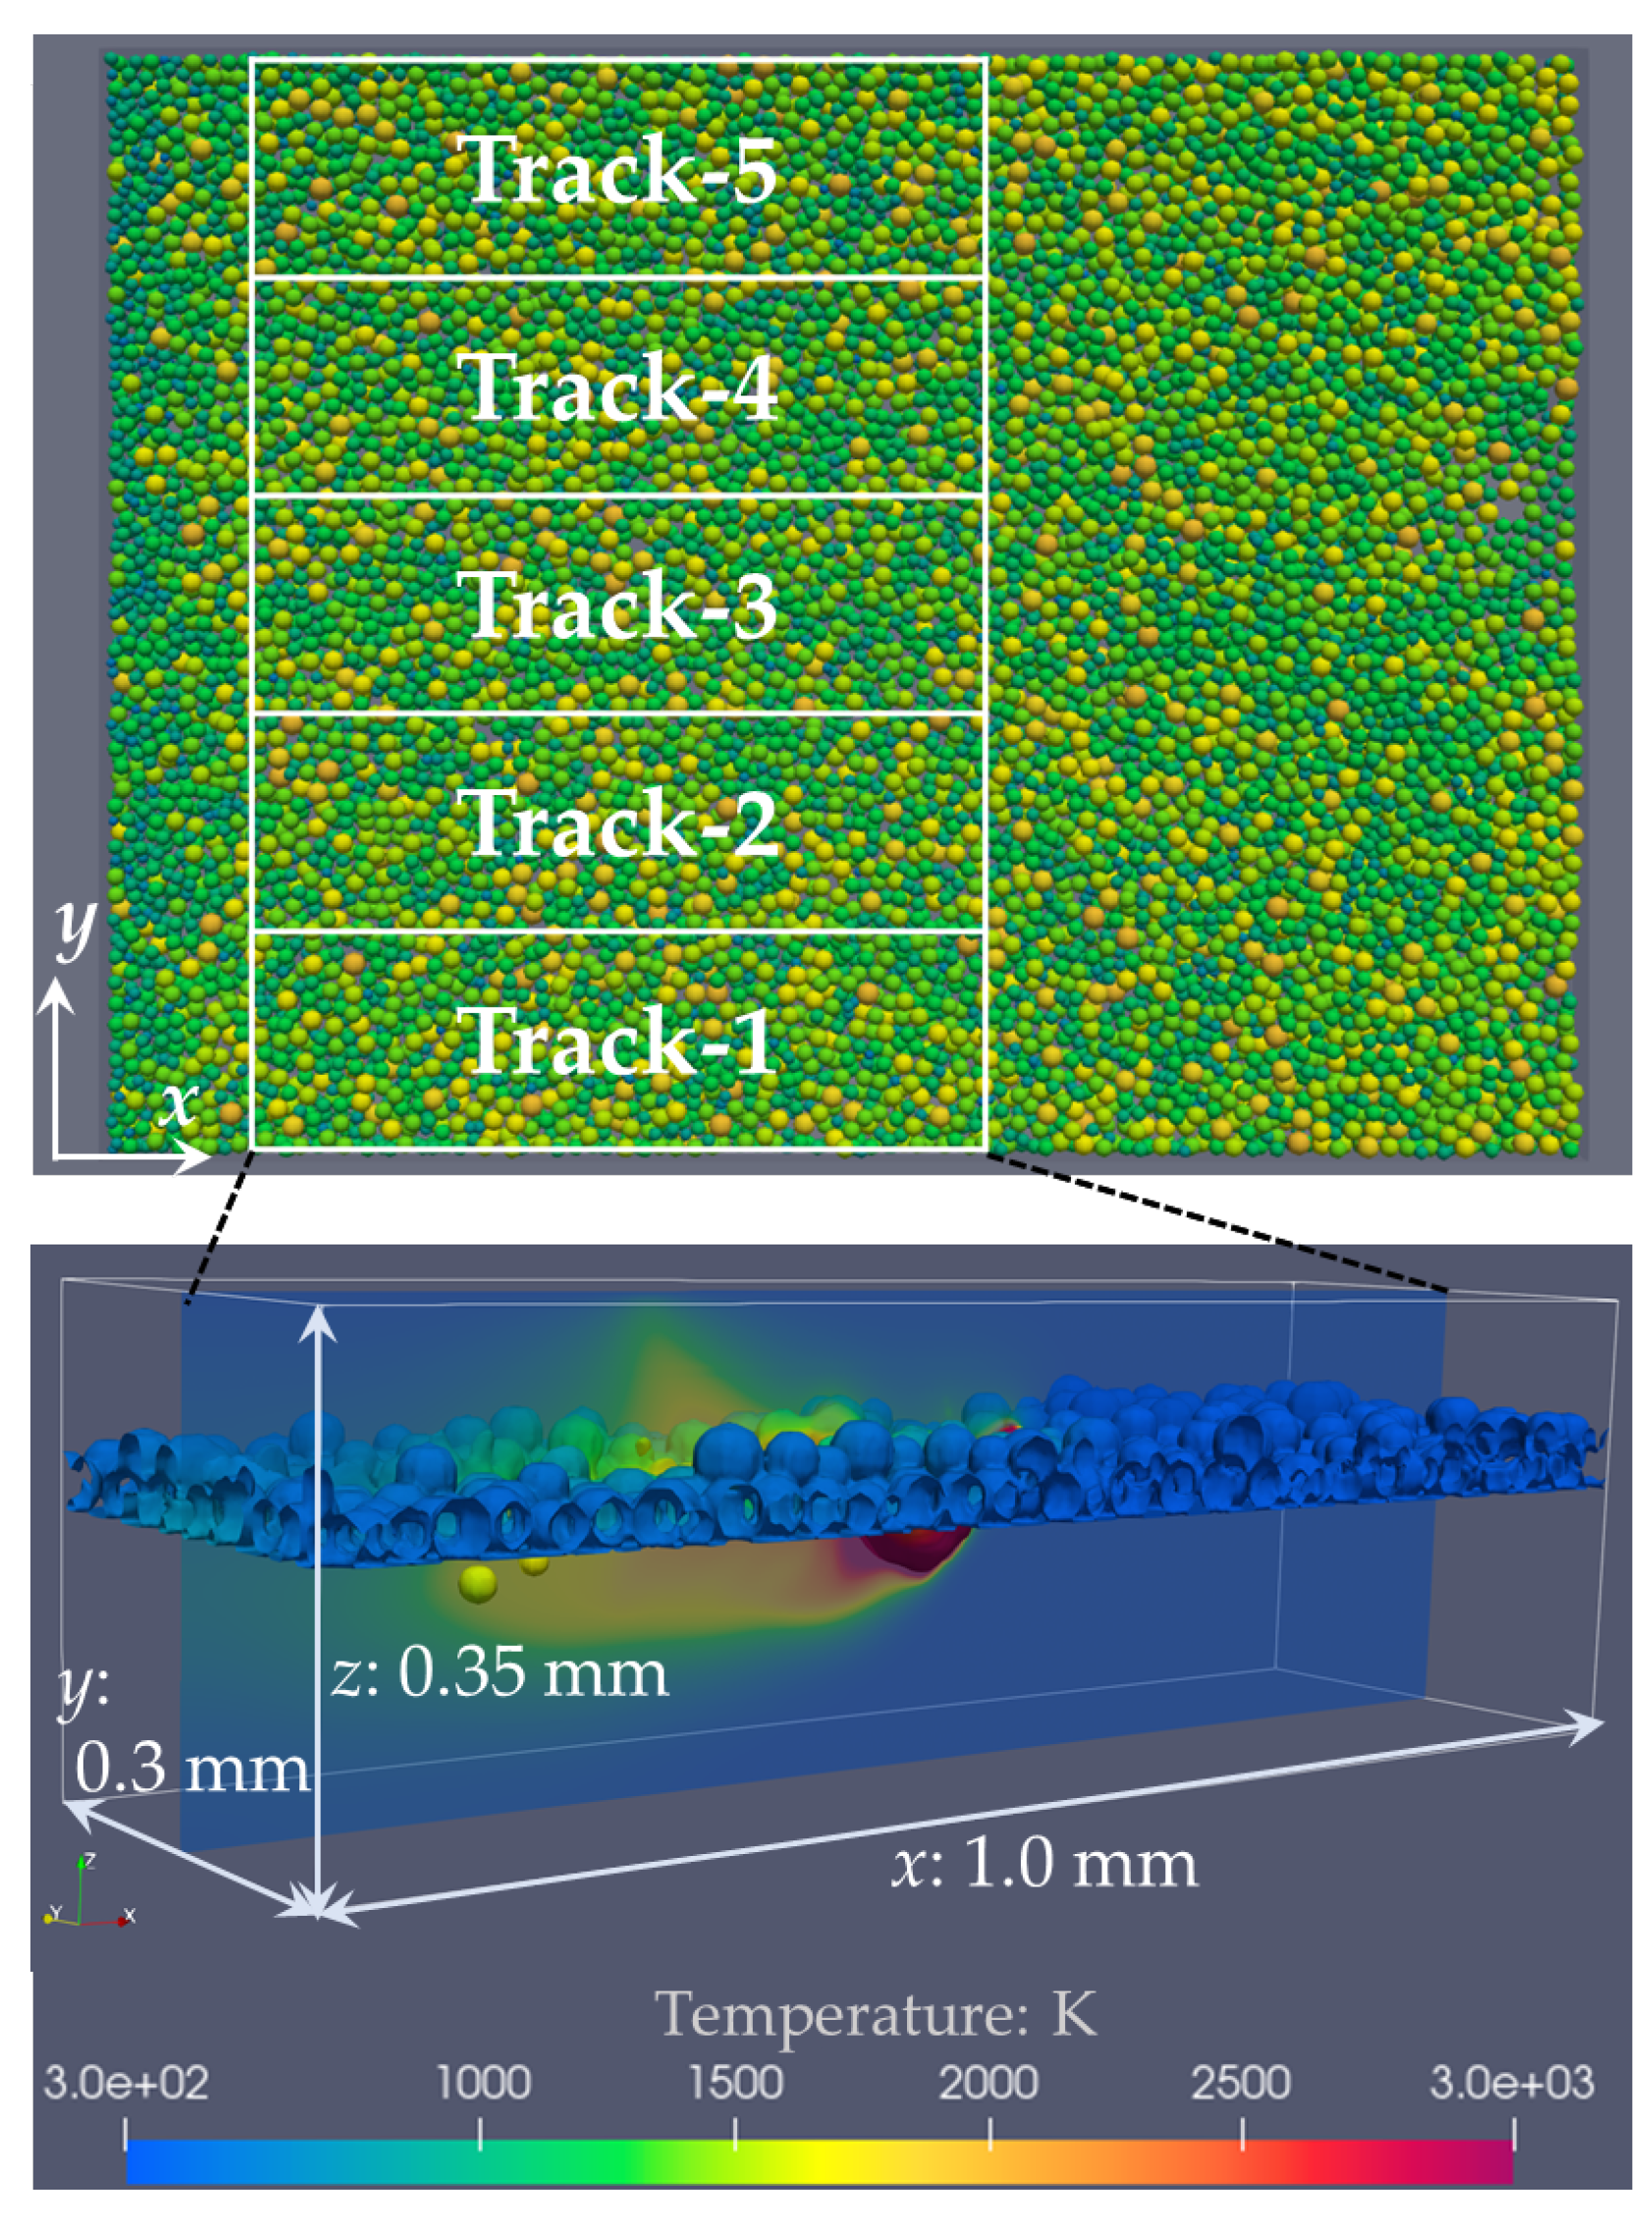
2.3. Single-Track Laser Scanning Simulations

The DEM result with a packing fraction closest to the average packing fraction of the five simulations was selected from the five DEM simulation results with different initial particle configurations. Figure 3 shows a top view (x-y plane) of the final particle configuration obtained from the powder spreading simulation for D a v = 24 μ m. Considering the effect of the particle configuration on the results of the multiphysics CFD simulation, a section of the powder bed was partitioned into five regions, as shown in Figure 3. Each partitioned region had a width of 1.0 mm and a depth of 0.3 mm. The five L-PBF simulations were performed using each of the five partitioned regions. As shown in Figure 3, the simulation model had a width of 1.0 mm, a depth of 0.3 mm, and a thickness of 0.35 mm. A hexagonal mesh with a grid size of 5 μ m was used. For high computational accuracy, the grid size was changed to 2.5 μ m for the powder bed region and the upper part of the substrate with a thickness of 120 μ m (200 μ m thickness in total). A VOF (F) value of 1 was set for the powder bed and substrate regions as the initial condition. The initial temperature of the whole simulation model was set to a typical room temperature of 298.15 K.
The initial laser positions were at x = 0.05 mm, y = 0.15 mm, and z = 0.35 mm. The direction of the laser beam was downwards along the z direction. The laser power and the scanning speed were set to 300 W and 1000 mm/s, respectively, to evaluate the effect of particle size on the molten pool dimensions. For experimental validation, the laser power varied at 180, 300, and 500 W. The laser spot size was 80 μ m. The laser moved 0.9 mm along the x direction from the initial position. A typical computation time was about 30 h on a 96-core parallel computer using the same supercomputer system described in Section 2.1.
Figure 4 shows a typical cross-section obtained from the multiphysics CFD simulation. The figure represents the y-z plane at the centre of the laser displacement (x = 0.5 mm). The white lines in the figure represent the isolines of the solidus and liquidus temperatures, respectively. The molten pool width was determined as the distance along the y direction between the maximum and minimum positions of the isoline of the liquidus temperature at the top of the substrate (z = 0.17 mm). The molten pool depth was determined as the distance along the z direction from the top of the substrate to the minimum position of the isoline of liquidus temperature.

2.4. Single-Track Laser Scanning Experiments

A series of single-track experiments were performed to validate the multiphysics CFD simulation. In this experimental validation, the molten pool dimensions obtained from the single-track experiments were quantitatively compared with those obtained from the multiphysics CFD simulations using different laser reflectivity models. Since the powder packing properties can affect the molten pool dimensions, experiments without the powder bed, i.e., laser scanning on a bare plate, were also performed.
The procedure for the single-track experiments is briefly summarised below. Hastelloy X bare plates were used in this study, and the L-PBF system used was the SLM280HL (SLM Solutions, Lübeck, Germany). The laser scanning speed was set to 900 mm/s. The laser power was varied at 180, 300, and 500 W.
The bead line created by the laser scanning was cut at the centre of the bead line. The molten pool dimensions were measured from a cross-sectional image. Resin was embedded in the cross-sectional surface, and the specimen was then polished. A colloidal silica solution was added during the final polishing step. The polished cross-section was washed with water and dried sufficiently. The cross-section was examined by scanning electron microscopy (SEM) to measure the molten pool dimensions. An example cross-sectional image for a laser power of 300 W and a scanning speed of 900 mm/s is shown in Figure 5.

3. Results and Discussion

3.1. Preliminary Analysis: Experimental Validation

A series of simulations for the bare plate was carried out for a quantitative comparison with the experiments. The control parameters for the experimental validation are the laser reflectivity models and their model parameters. Table 4 lists the reflectivity models and their model parameters used in this preliminary analysis.
Figure 6a,b show the effects of laser reflectivity on the molten pool width and depth, respectively.
The molten pool widths obtained from the simulations did not agree with those obtained from the single-track experiments. The difference in the molten pool width between the simulation and the experiment was significant, even though the reflectivity was small (0.2). However, the slope of the molten pool width with increasing laser power was consistent with that of the experiments. Previous studies have reported the observation of a vapour plume during laser scanning of the bare plate [45,46], L-PBF [47,48], and laser welding [49]. The vapour plume consists of high-temperature evaporated metal smoke. Previous studies have reported that the temperature of the vapour plume has reached several thousand K [49]. The vapour plume was continuously generated during the laser movement, indicating that additional heating due to the vapour plume can increase the width of the molten pool formed earlier by laser irradiation. The molten pool width obtained from the simulations was small compared to that obtained from the experiments because the effect of the vapour plume was not considered in the multiphysics CFD simulation in this study. Modelling the plume generation in the multiphysics CFD simulation will be an important task in our future studies.
As shown in Figure 6a, the molten pool depth varied significantly with laser reflectivity. The molten pool depth of the Fresnel and Hagan–Ruben models corresponded to that of a constant reflectivity of 0.6 and did not agree with that of the experiments. For a constant reflectivity of 0.4, the molten pool depth obtained from the simulation was in good agreement with that obtained from the experiments. Ren et al. evaluated the time evolution of the reflectivity (absorptivity) using multiphysics CFD simulation [31]. They reported that the laser reflectivity varied depending on the laser condition, and the laser reflectivity of the Fresnel model was greater than that of the Hagan–Ruben model. Trapp et al. reported that the reflectivity varied between 0.2 and 0.7 for 316L stainless steel from the experimental measurements using a micro-calorimetry apparatus [50]. They performed experiments by varying the laser power at scanning speeds of 500 and 1500 mm/s. For the laser power range comparable to this study (between 180 and 500 W), the estimated laser reflectivity was about 0.23 for 500 mm/s and between 0.45 and 0.55 for 1500 mm/s [50]. The simulations with a constant reflectivity of 0.4 at 900 mm/s reproduced the experimental molten pool width, which is consistent with the trend in the experimental measurements of Trapp et al. It should be noted that the measured reflectivity was for the molten metal, i.e., the reflectivity when the temperature was greater than the solidus temperature. According to Xie et al. [51], the laser reflectivity at room temperature is greater than that at the melting temperature level for some pure metals and alloys. If the constant reflectivity of 0.4 is used at any temperature, the laser reflectivity for a temperature greater than room temperature may be underestimated.
From the above discussion, a constant reflectivity of 0.4 was used because the experimentally measured molten pool depth and the experimental trend for the molten pool width with increasing laser power can be reproduced through multiphysics CFD simulation.

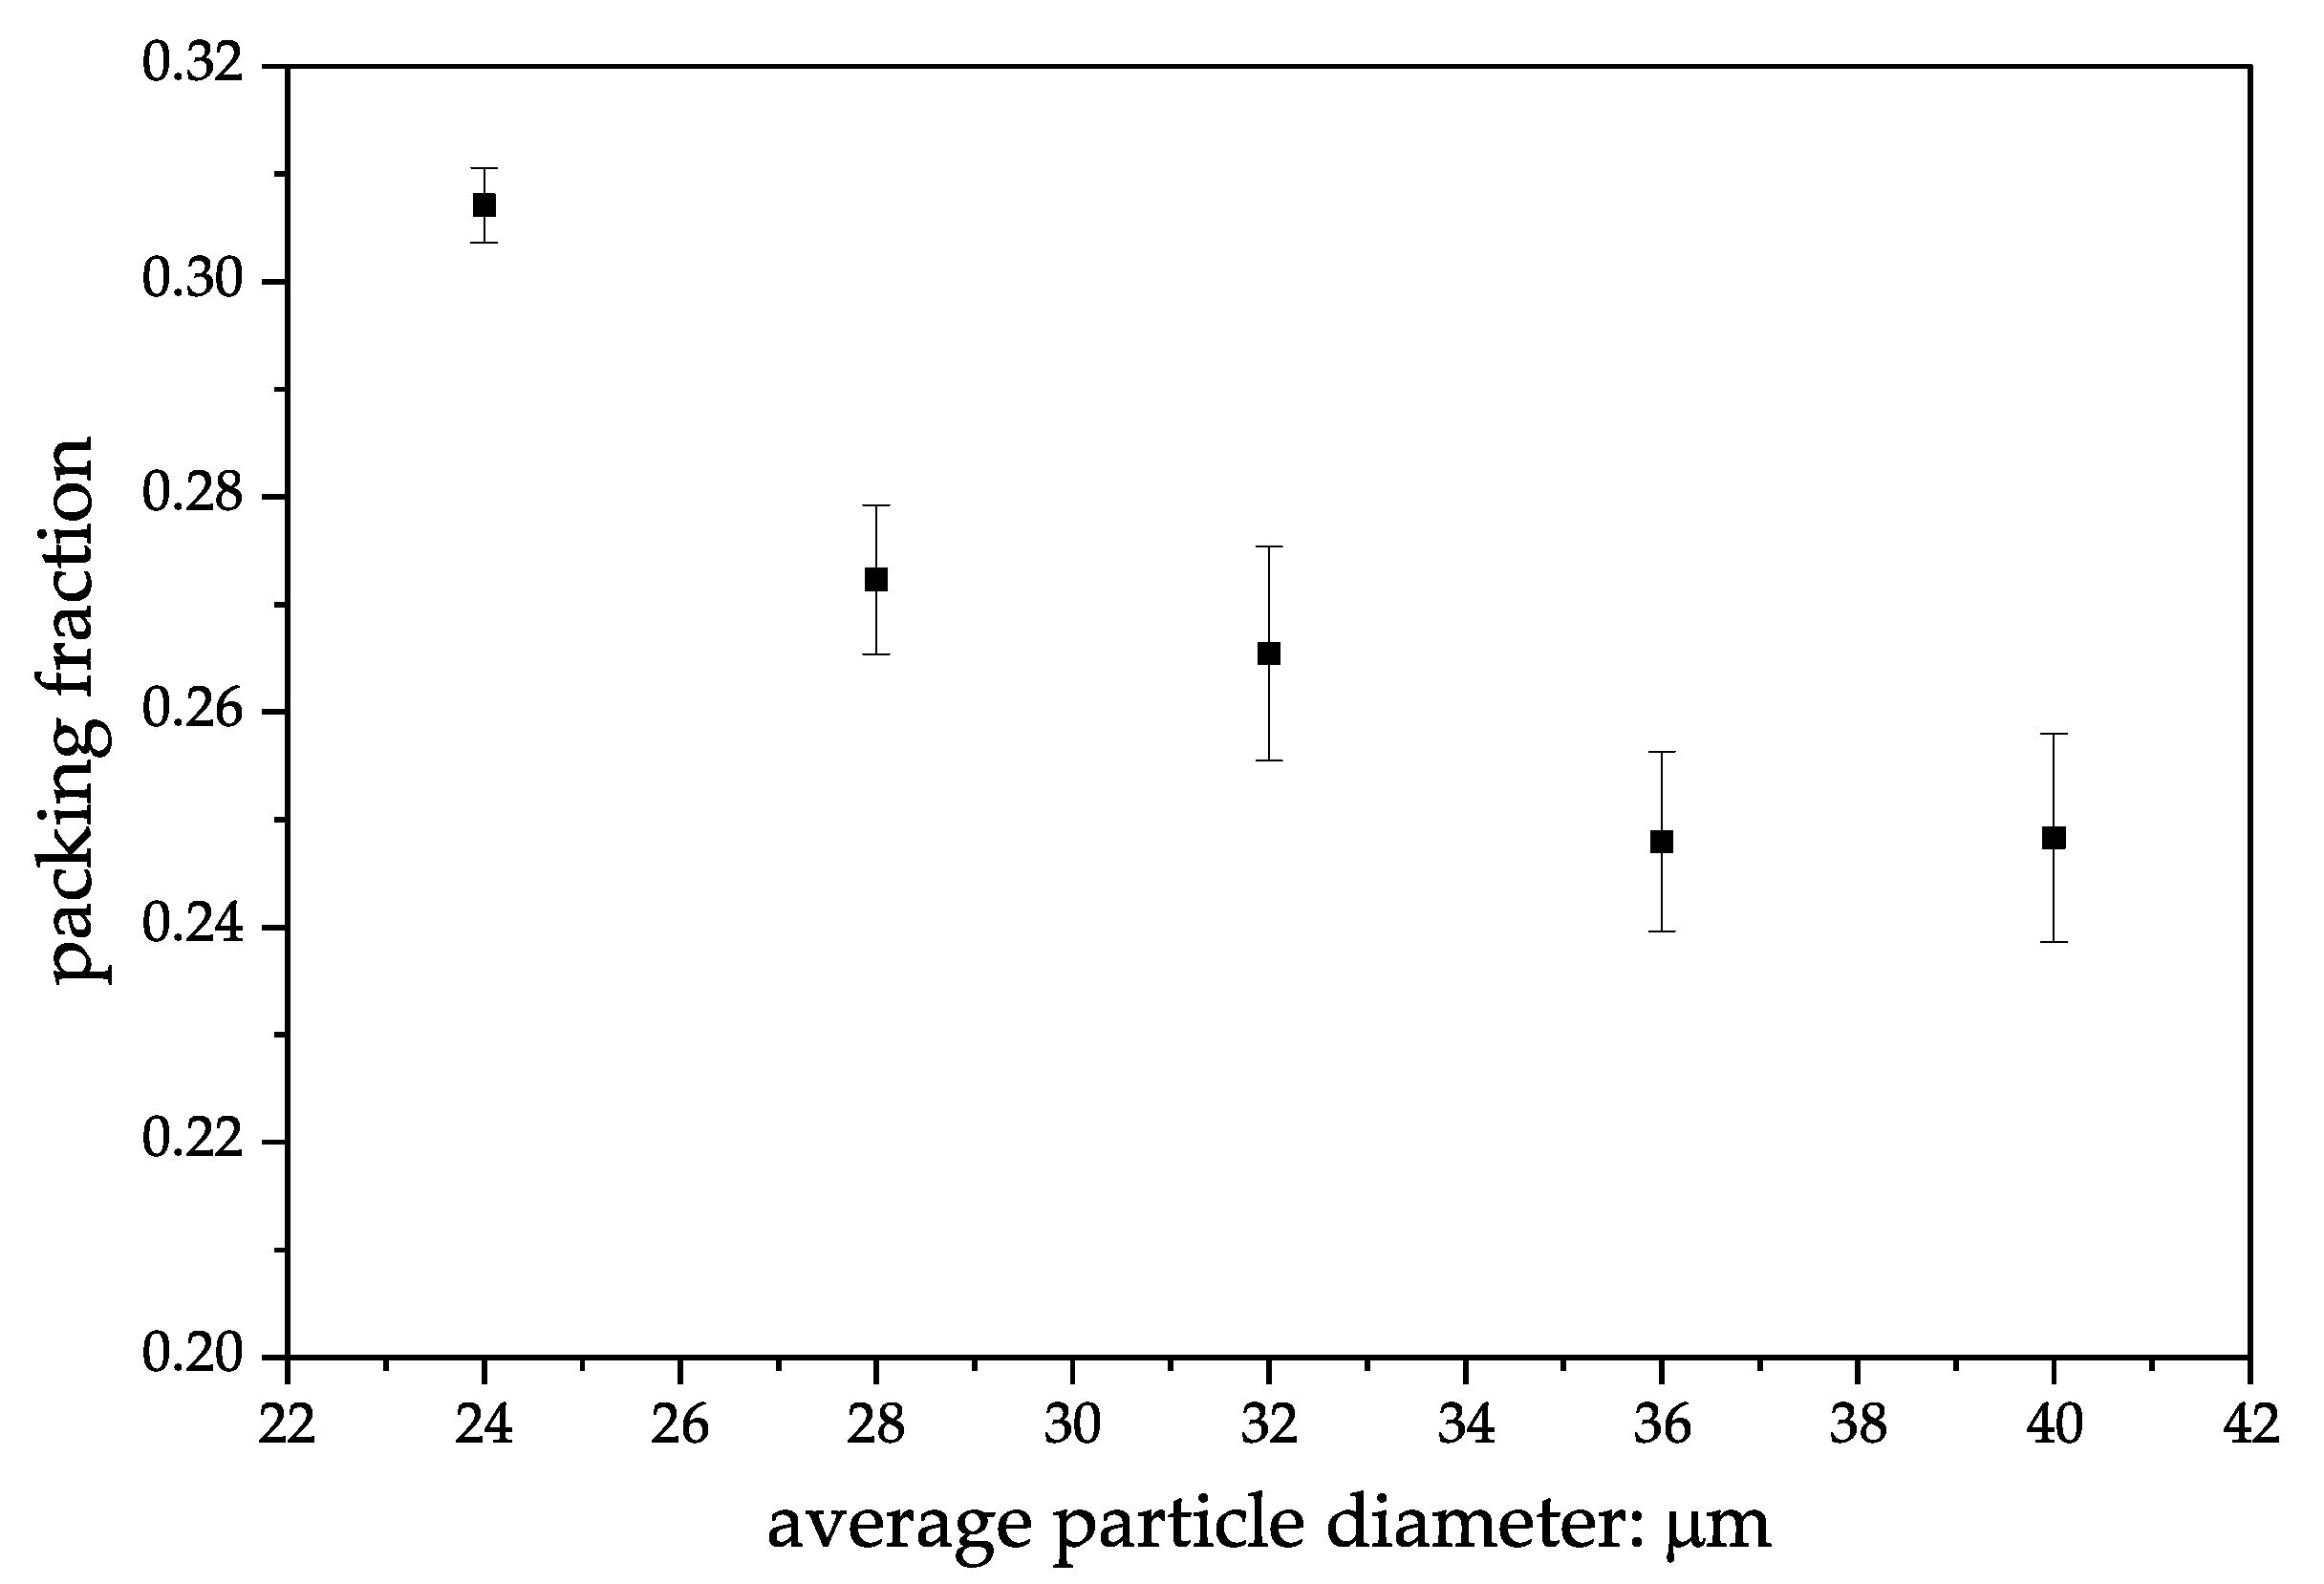
3.2. Packing Fraction of Powder Bed

Figure 7 shows the relationship between the packing fraction and average particle diameter. The points and error bars represent the averages and standard deviations for the five simulations. The packing fractions decreased as the particle diameter increased. In addition, the standard deviation also decreased as the particle size decreased. This was likely related to the ratio of the powder bed thickness to the particle diameter. For D a v = 40 μ m, two particles could be positioned within the thickness of the powder bed formation region. However, the two particles were rarely aligned along the z direction because they were dynamically pushed out due to the dynamic movement of the coater blade. Figure 8 shows side views (x-z plane) obtained from the powder spreading simulations with different D a v . The side view represents the range between 0.2 and 1.2 mm along the x direction, which was the model width used in the multiphysics CFD simulation. The thickness of the powder bed was almost identical to the diameter of a single particle when a D a v of 36 or 40 μ m was used. The number of particles increased as D a v decreased. For D a v = 24 μ m, three or four particles piled up along the z direction. In these cases, the driving force (dynamic confining stress) due to the movement of the coater pushed the particles down. The particles could move freely to fill the pore spaces of the powder bed. As a result, smaller particles could be packed more densely compared to larger particles.
Figure 9 shows top views obtained from the powder spreading simulations with different D a v . A sparse packing structure was observed at a D a v of 36 or 40 μ m. To the best of the authors’ knowledge, in practical applications of L-PBF systems, the thickness of the powder bed region is often set to a length slightly larger than the D a v . This indicates that the powder bed formed in the real L-PBF process will have sparse and inhomogeneous packing. Such packing inhomogeneity may lead to scanning track irregularity, which can cause defect formation. It should be noted that a sparse packing structure has been observed in powder spreading model experiments in previous studies, for example, in [52].

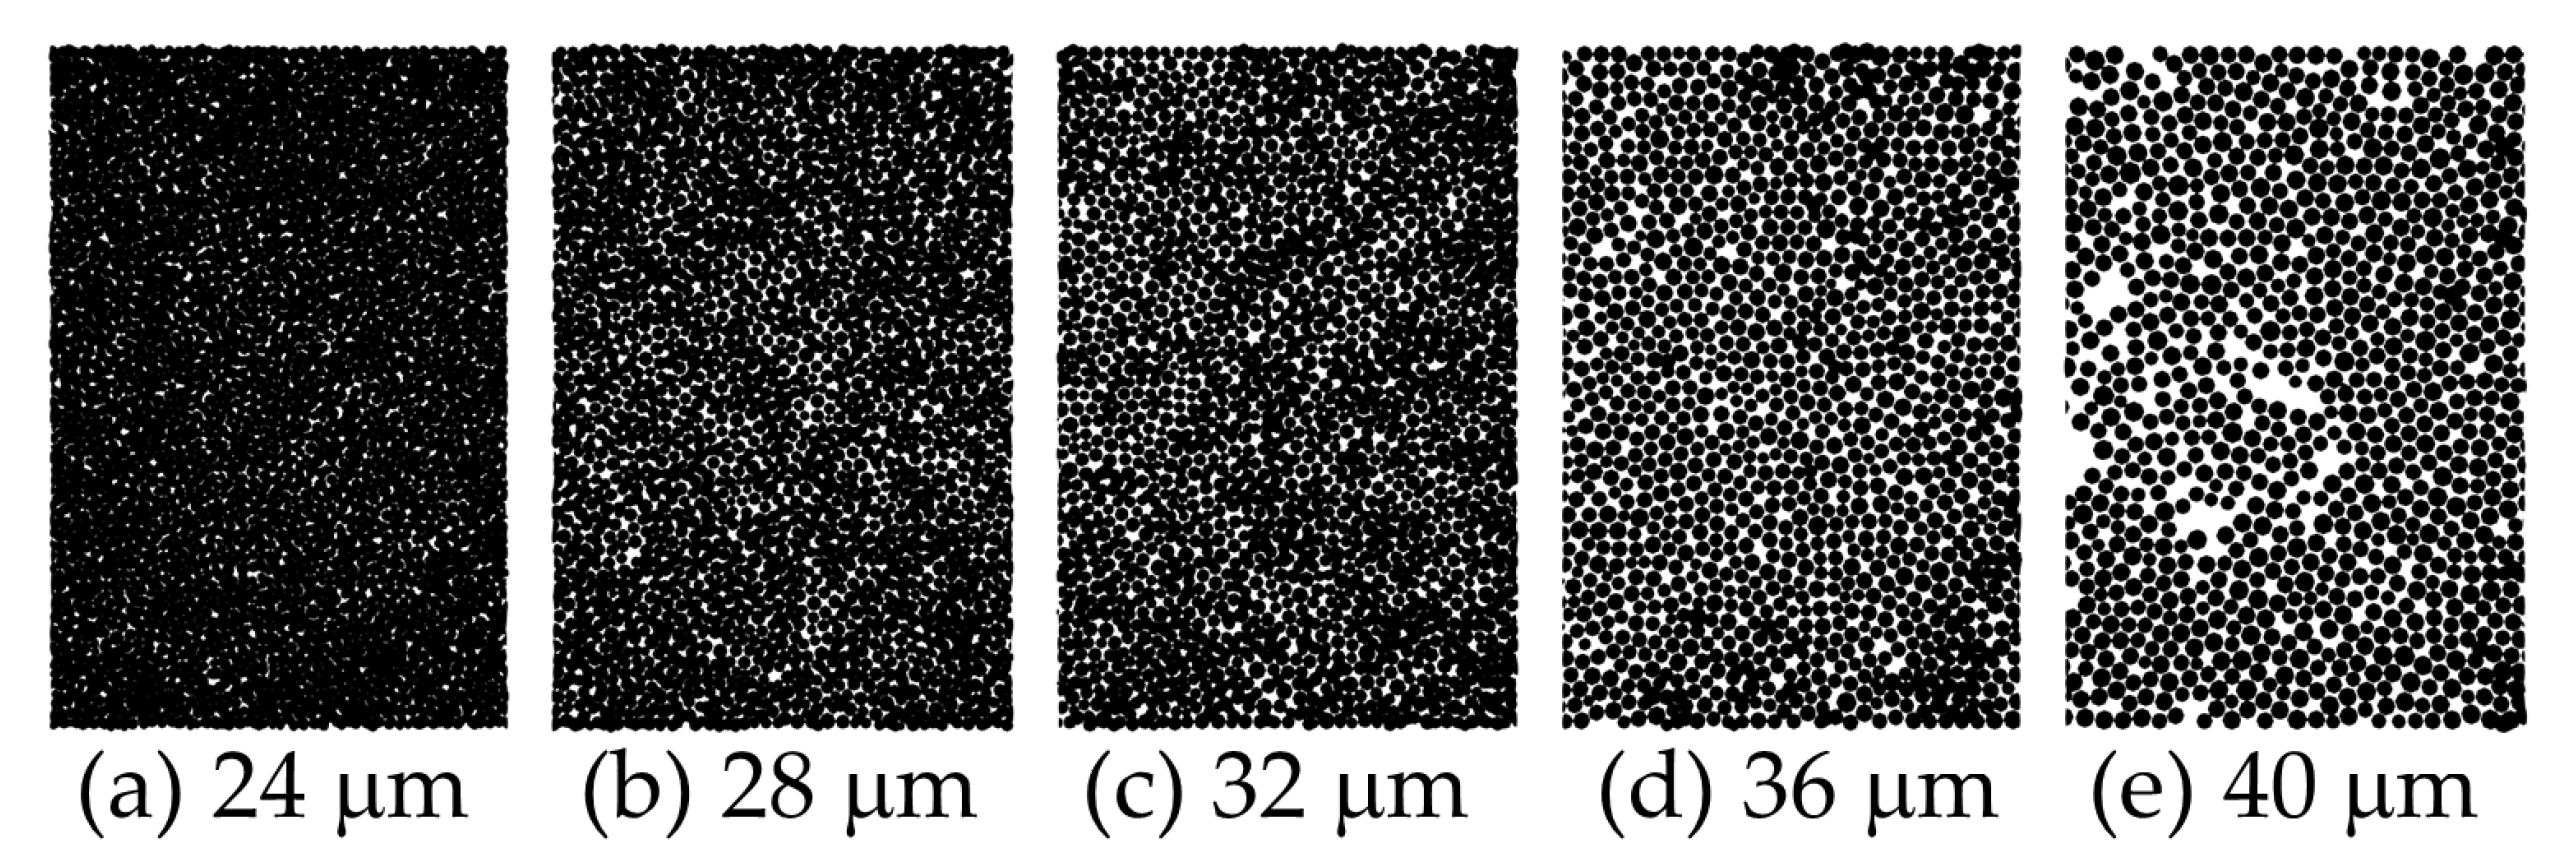
3.3. Packing Homogeneity

Figure 10 shows a top view obtained from the powder spreading simulation with a D a v of 24 μ m. To evaluate the packing homogeneity, the model domain was divided into ten subdomains along the x direction. The average diameter and number of particles were then measured for each subdomain. Figure 11a,b show the average particle diameter and the number of particles in each subdomain, respectively. As shown in Figure 11a, the average particle diameter in subdomain-1 was slightly smaller than that in the other subdomains. Except for subdomain-1, the average diameters for the subdomains were almost equivalent.
According to previous studies [53,54,55,56,57], size segregation has been observed in the moderate flow regime in granular flow down an inclined plane. The moderate flow regime is a flow state at a given angle of inclination, where the granular material flows at an almost constant velocity without acceleration. In the moderate flow regime, large particles accumulate at the top, whereas small particles accumulate at the bottom. Moderate flow could occur in the powder spreading simulation because the coater blade was moving at a constant speed. The powder tended to form a repose angle during particle spreading by the moving coater blade. In this state, large particles tended to accumulate on the inclined surface of the repose angle, whereas small particles tended to accumulate near the bottom surface. The particles near the bottom surface first fell to the edge of the powder bed formation region. This was likely the reason why the average diameter in subdomain-1 was smaller than that in the other subdomains.
Figure 11b shows the number of particles in the ten subdomains. The number of particles was almost constant between 0 and 1.2 mm along the x direction; thereafter, it increased depending on the subdomain position along the x direction. This was likely due to the way the powder spreading simulation was performed. In the gravitational packing process, excess particles that did not fill the powder storage region flowed into the powder bed formation region before the coater movement, as shown in Figure 2c,d. Particles were deposited on top of this excess particle layer. As a result, the number of particles increased for x 1.2 mm compared to x 1.0 mm.
For an outlet edge of the powder bed formation region (1.8 mm x 2.0 mm), the number of particles suddenly dropped due to the boundary effect. When the coater blade approached the outlet edge, the particles between the coater blade and the wall edge of the powder bed formation region were scattered by strong repulsive force due to the large overlap between the particle and the wall. The scattered particles displaced some of the particles in the region of 1.8 mm x 2.0 mm. As a result, the number of particles near the outlet edge decreased.

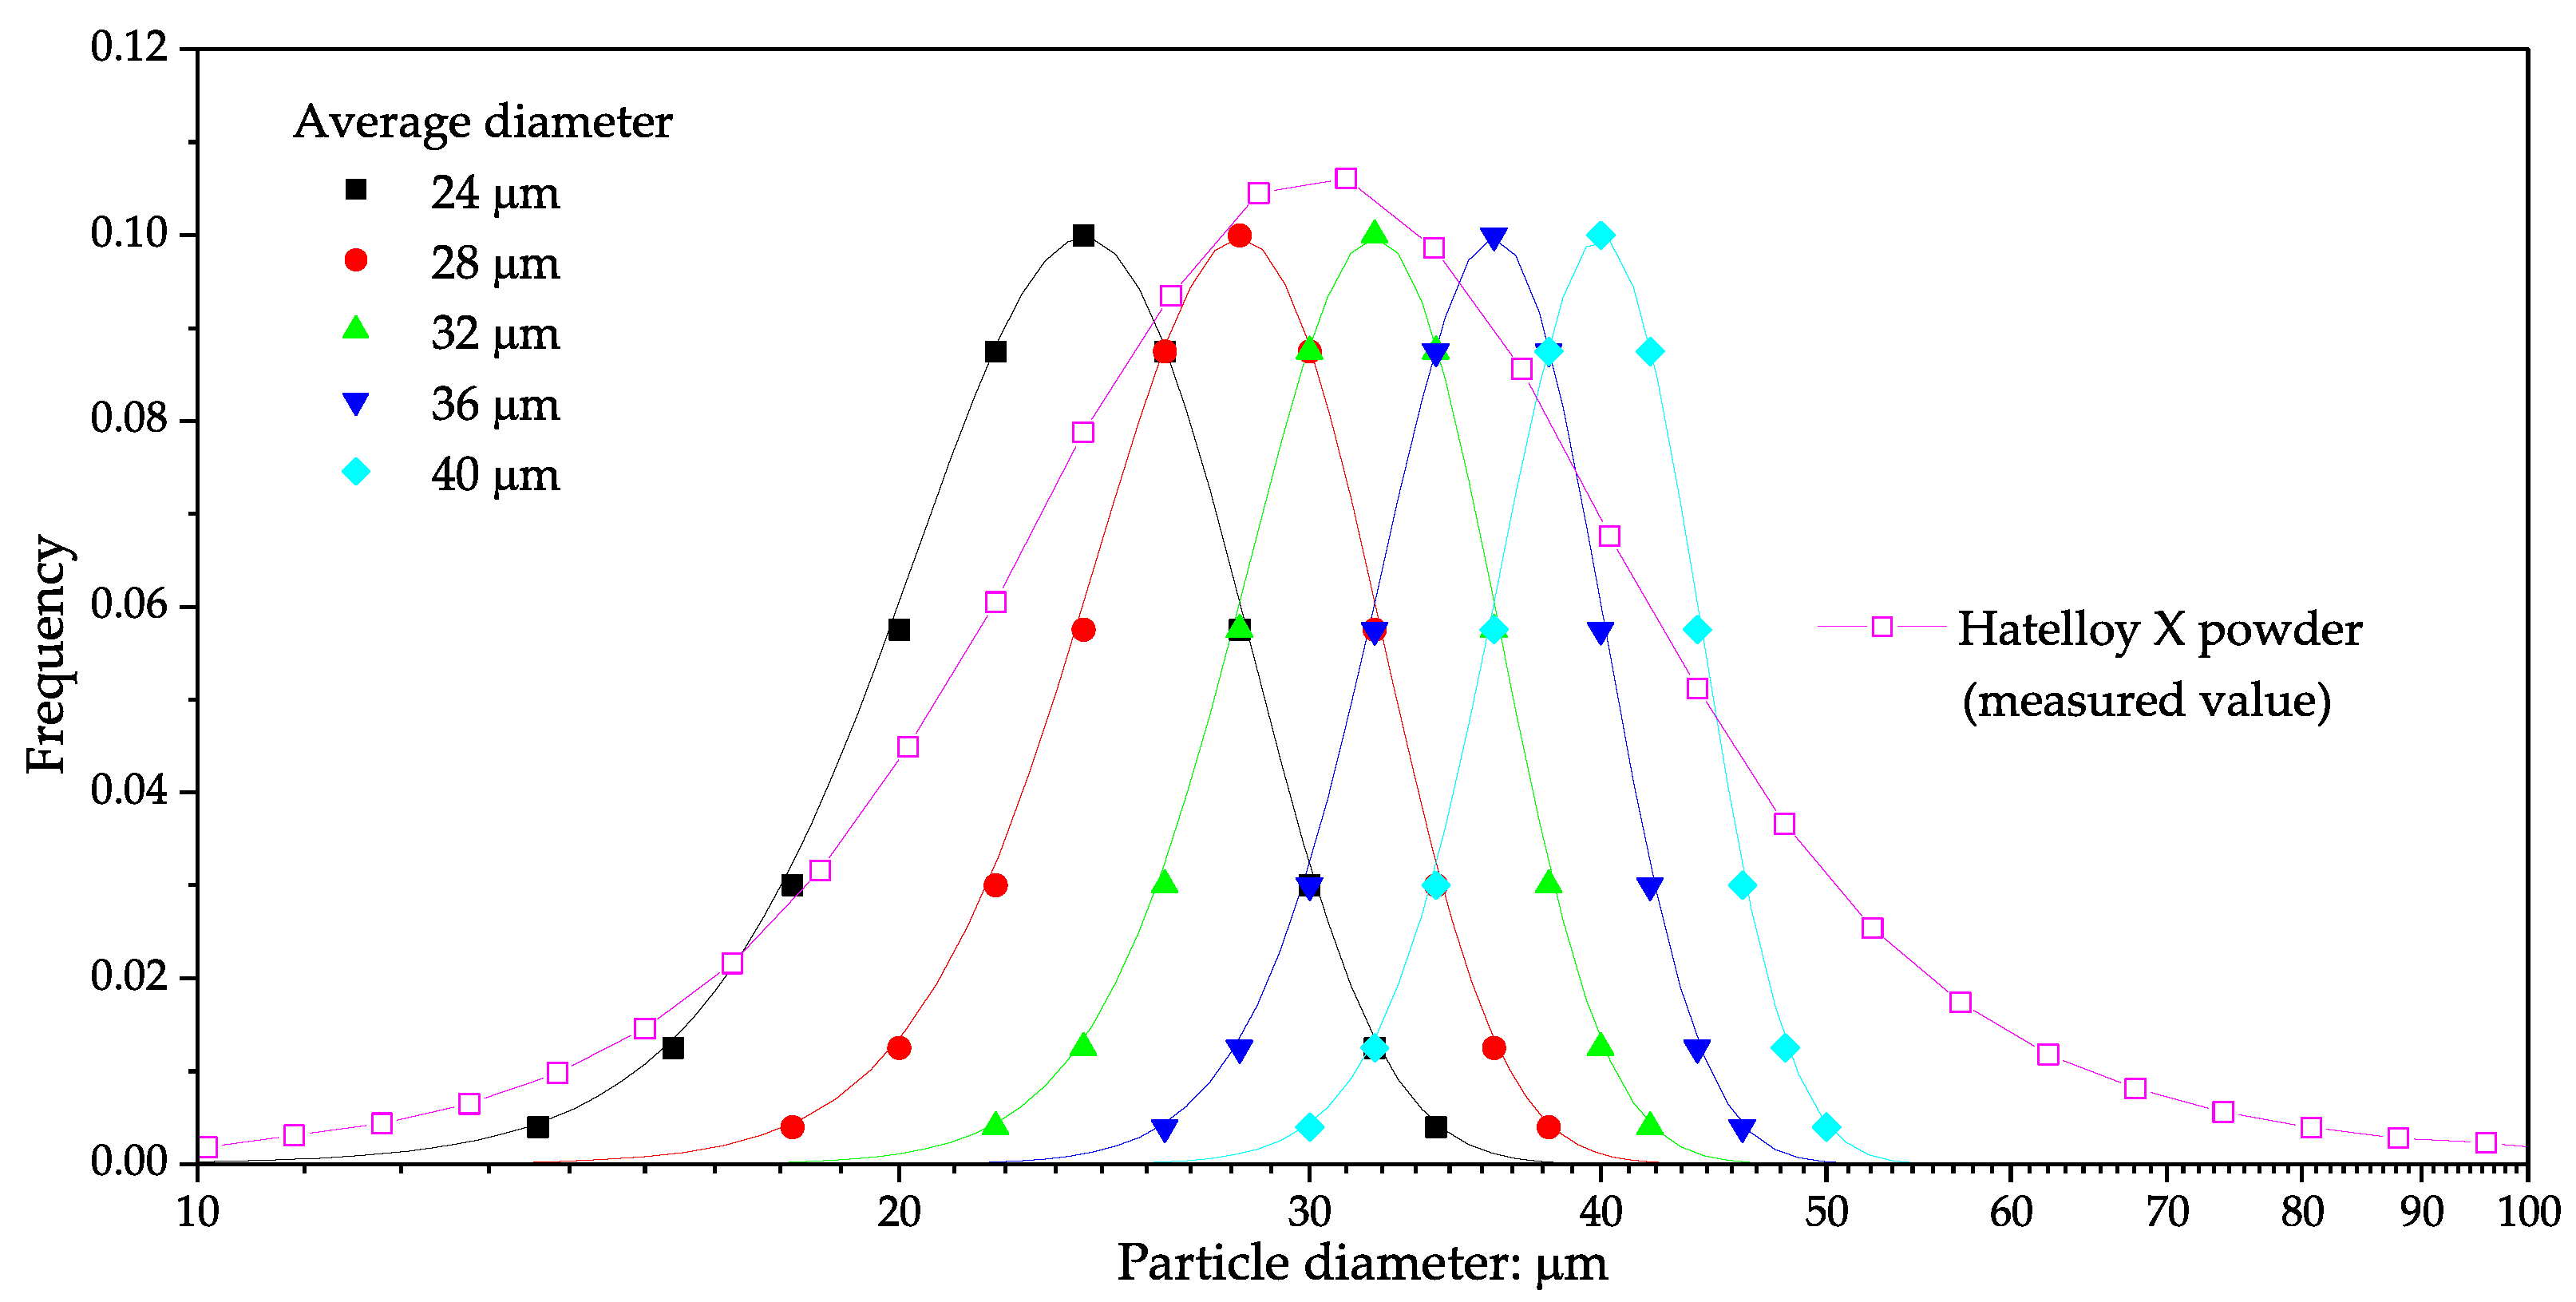
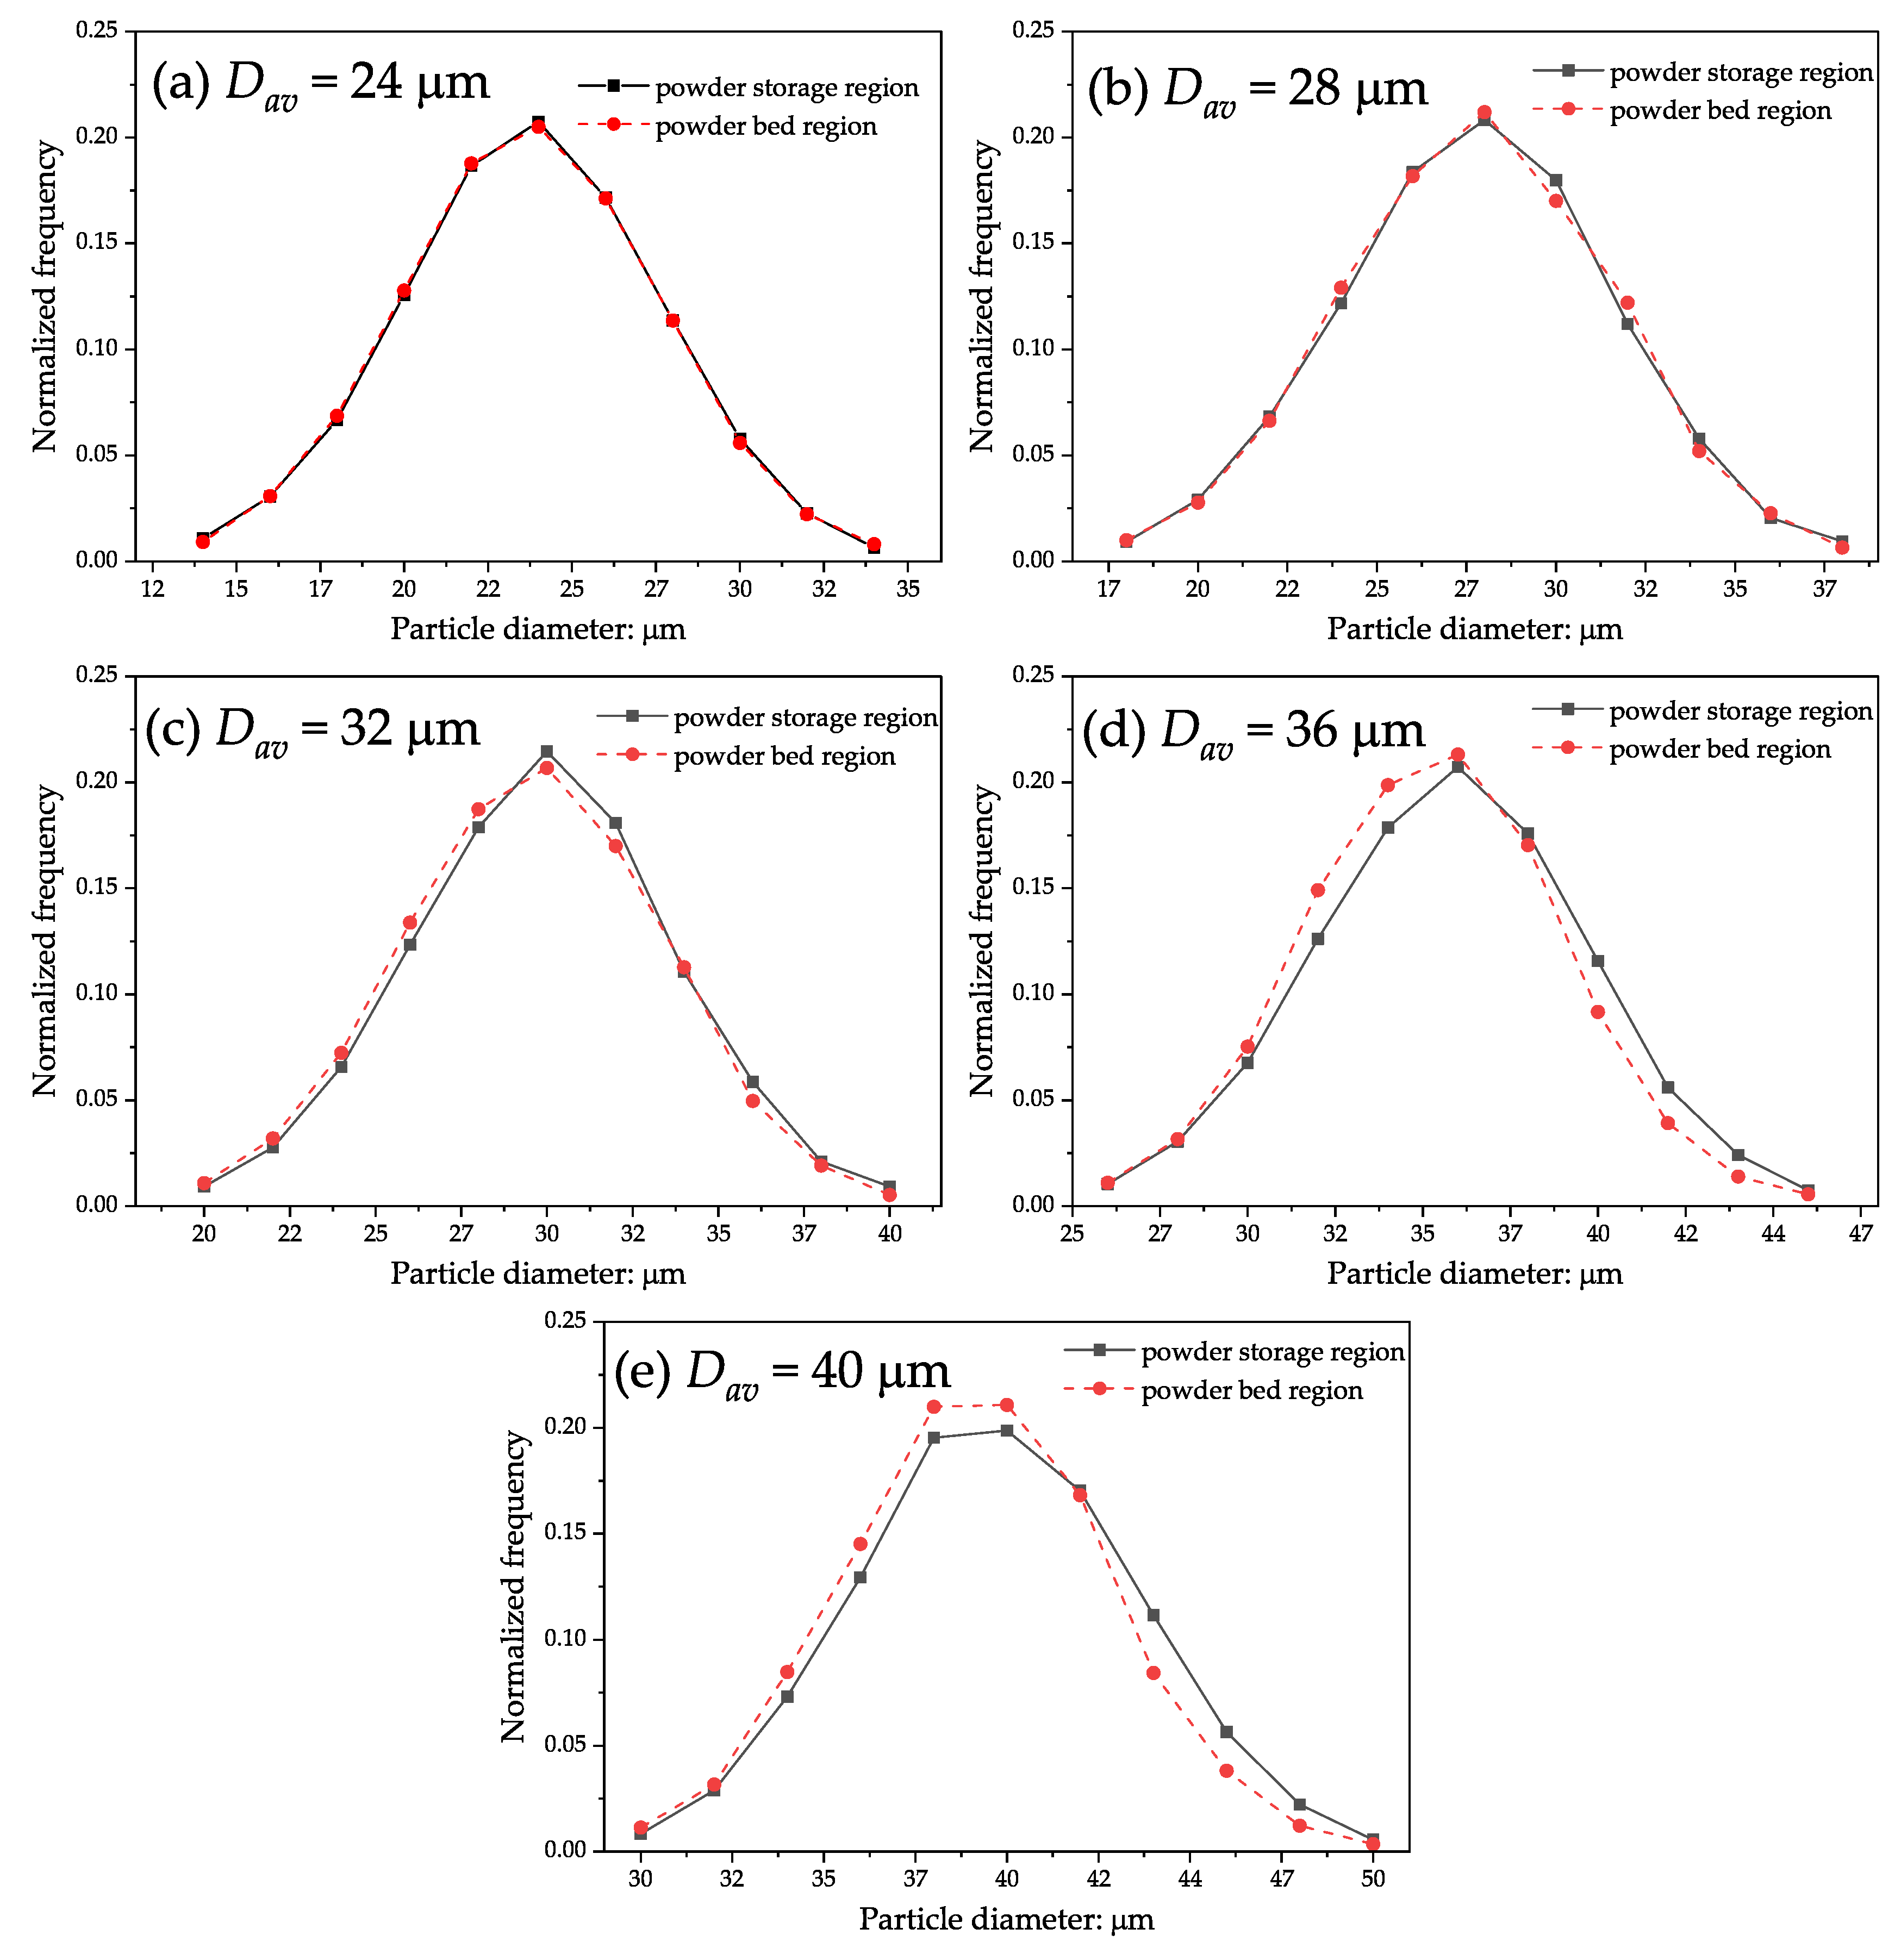
3.4. Equivalency of Particle Size Distribution

Figure 12 compares the particle size distribution at the powder storage region with that at the powder bed formation region. The solid lines and solid points represent the particle size distributions at the powder storage region, whereas the dashed lines and white points represent those at the powder bed formation region. When D a v was less than 28 μ m, the two particle size distributions were almost the same, but they differed when D a v 32 μ m. In particular, relatively large particles were reduced when D a v 36 μ m. When D a v was small compared to the thickness of the powder bed formation region, particles of any diameter could be uniformly filled; hence, the particle size distributions at the powder storage and powder bed formation regions were similar. In contrast, relatively large particles when D a v = 36 or 40 μ m exceeded the thickness of the powder bed formation region. A recent study using DEM simulation confirmed that the reduction of large particles in the powder bed resulted in a decrease in the average particle diameter compared to the original average particle diameter [37]. In addition, due to size segregation, small particles accumulate near the bottom surface and are filled into the powder bed formation region. The moving coater blade sweeps away large particles from the top of the powder bed. As a result, large particles should be removed from the powder bed.
As described above, an average particle diameter slightly larger than the thickness of the powder bed is used in some conventionally used L-PBF systems. For example, a thickness of 30 or 50 μ m for the powder bed formation region was set for powders with an average particle diameter of 29 μ m in [10,40]. In the present study, the ratio between the average diameter (even up to 40 μ m) and the powder bed formation region thickness was smaller compared to our previous studies. This implies that the particle size distribution of the formed powder bed may be different from the original size distribution encountered in real fabrication processes using an L-PBF system. This problem will be addressed in our future work.
When discharging large particles through the coater movement, linear depressions may occur along the coater movement direction because large particles may scrape off small particles. As described in Section 3.5, the average particle diameter correlates with the molten pool depth. If the powder bed thickness varies spatially, the molten pool depth will not be spatially uniform. The laser processing parameters are selected assuming a representative powder bed thickness. However, unexpected pores and lack of fusion can occur due to the spatial variation in the powder bed thickness, caused by packing inhomogeneity. Therefore, it is crucial to generate a homogeneous powder bed in the L-PBF process.

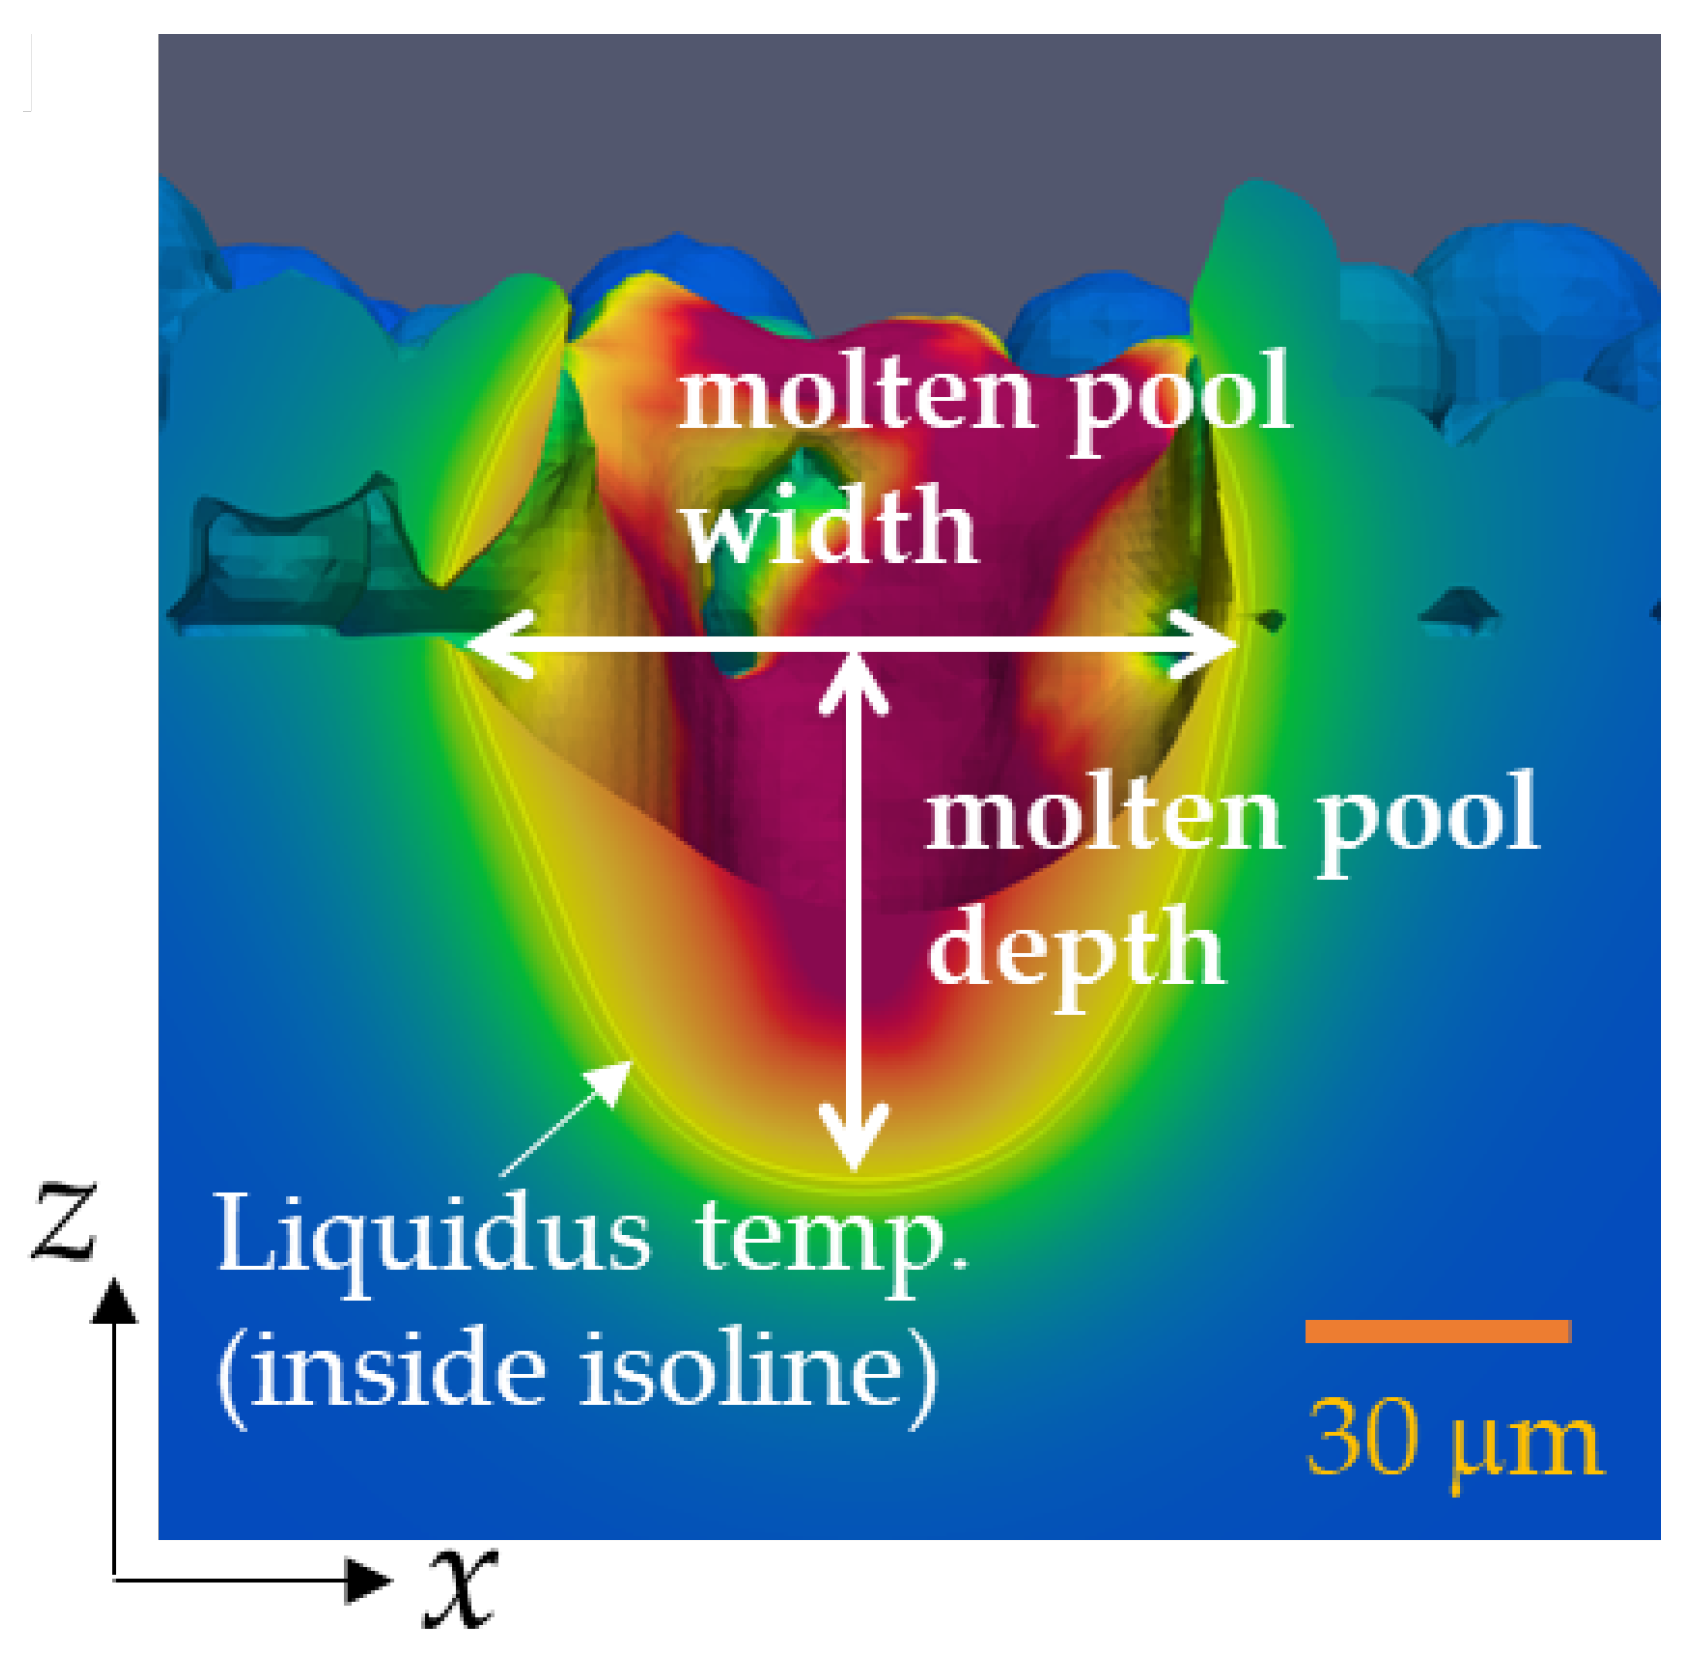
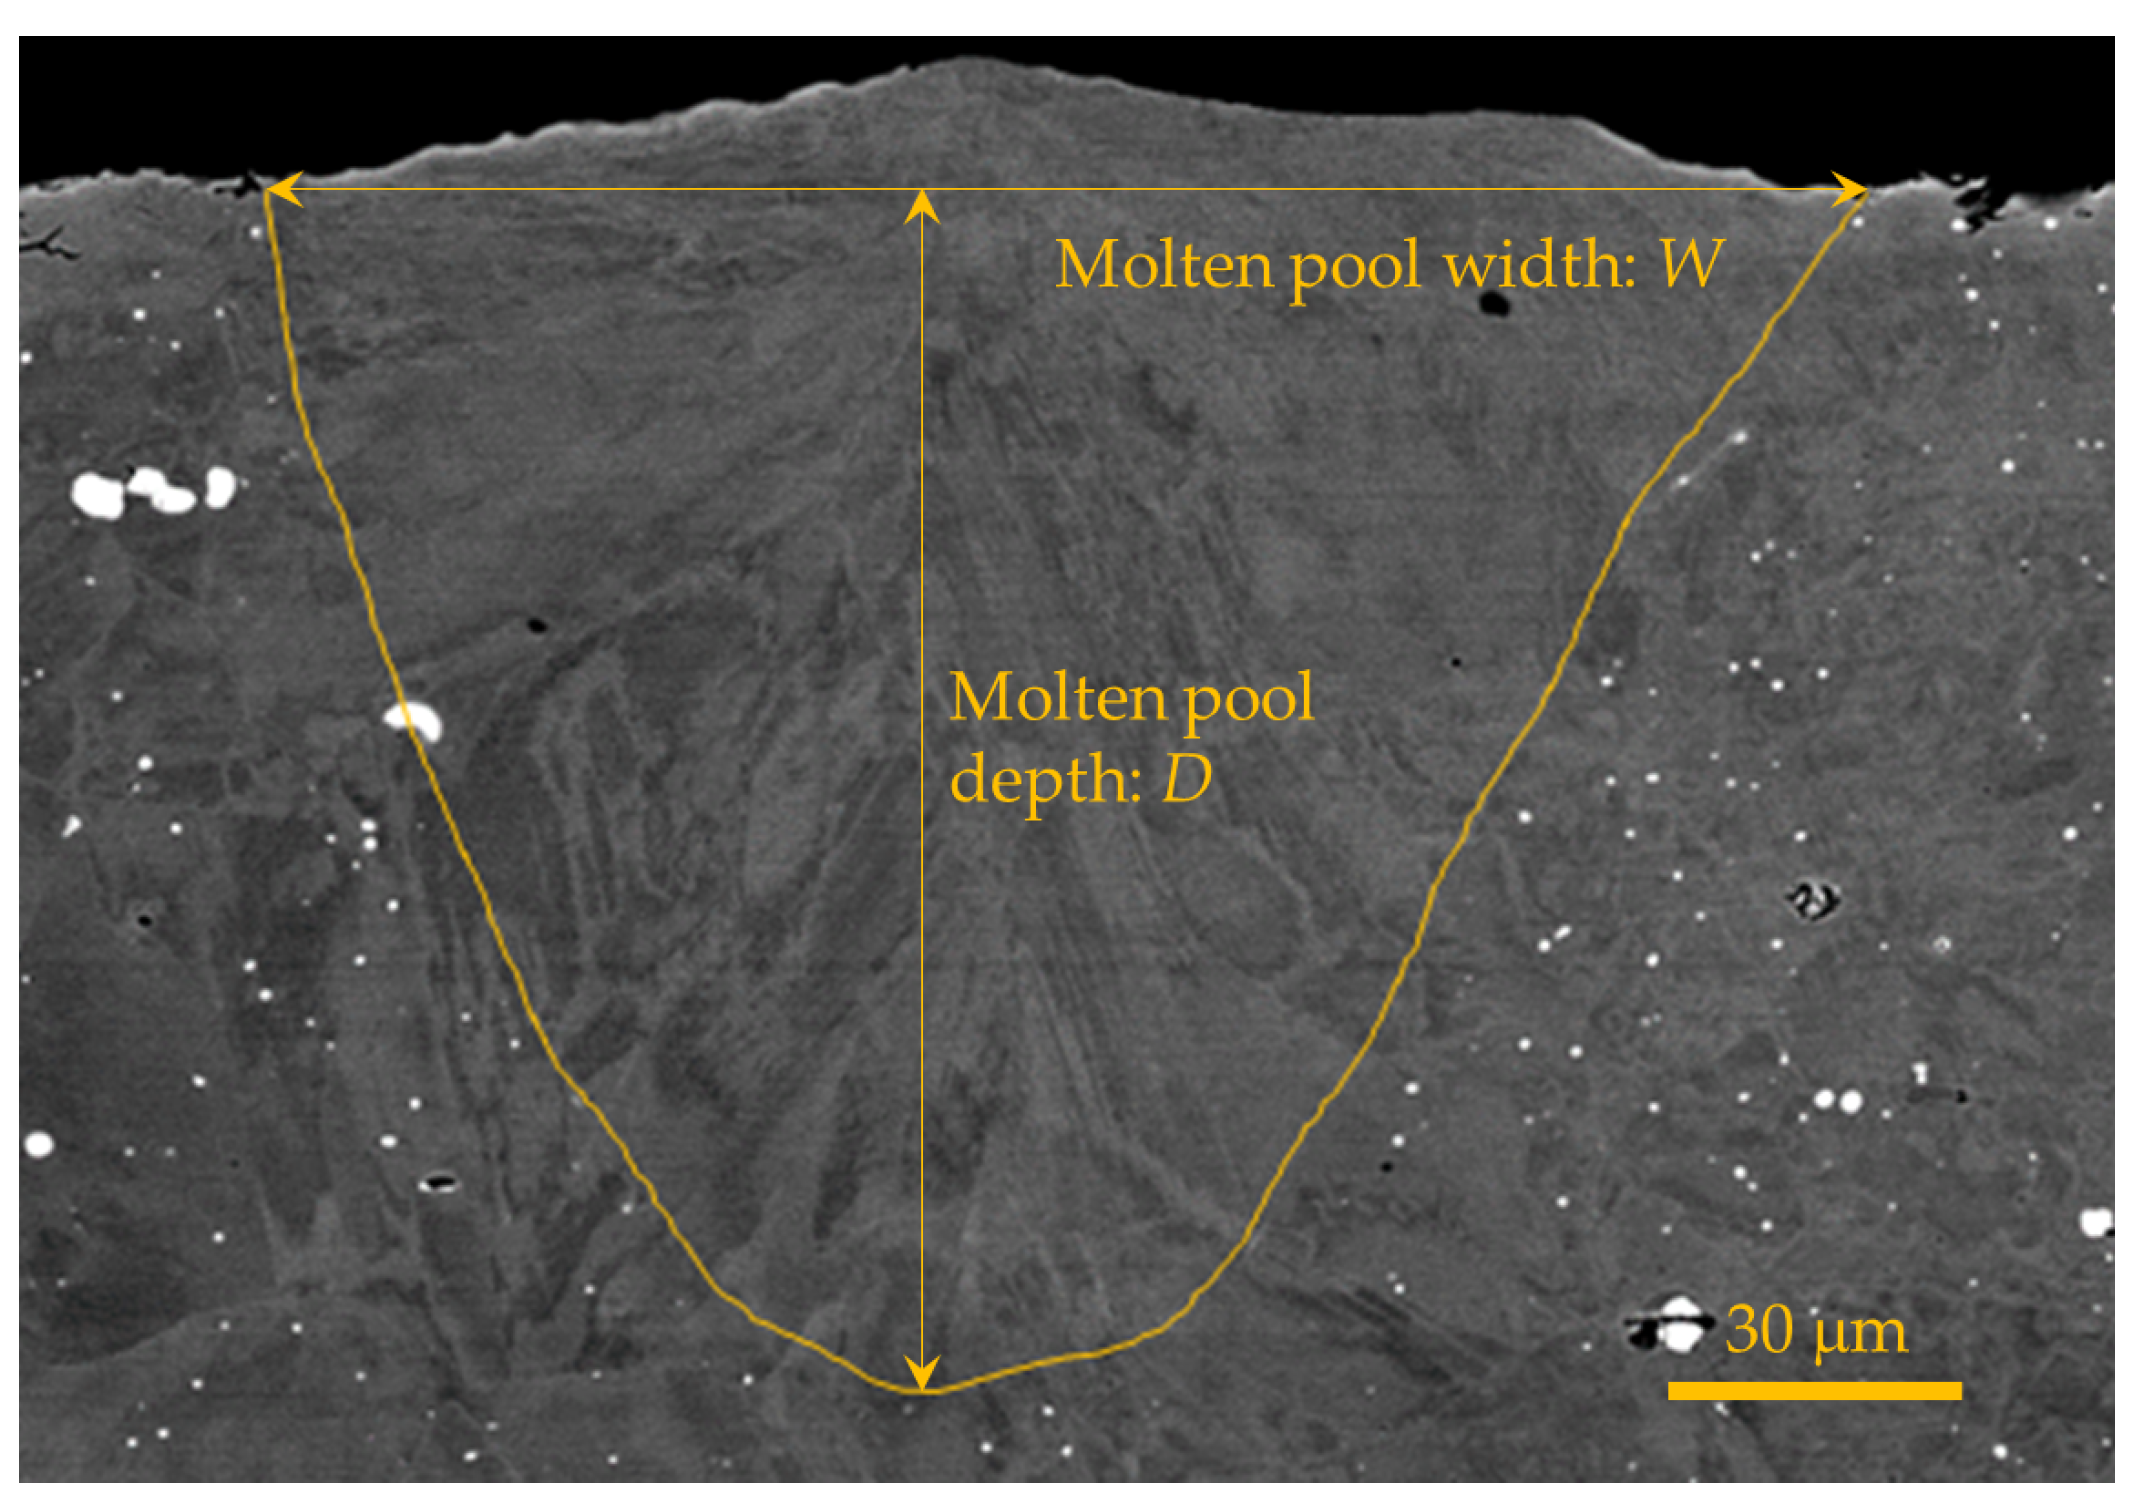
3.5. Molten Pool Dimensions

Figure 13 shows the relationship between the mean particle diameter and molten pool dimensions. The figure shows the averages and standard deviations (error bars) for simulations conducted using the five different tracks shown in Figure 3. The molten pool width was slightly dependent on D a v ; however, this was roughly equivalent to the laser spot size of 80 μ m. In contrast, we found that the molten pool depth correlated with D a v . This was likely due to differences in the powder bed thickness and surface area. As shown in Figure 8, the thickness of the powder bed increased as D a v decreased. In addition, the large particles spread inhomogeneously in the powder bed formation region with a thickness equivalent to one particle. Multiple particles piled up in the z direction, resulting in the powder bed forming a porous structure that allowed for multiple reflections of the laser beams. With each reflection, the heat from the laser irradiation was absorbed into the powder bed, reducing the amount of heat reaching the substrate. However, when using large particles, the powder bed had almost a single-particle thickness, allowing the laser beams to directly reach the substrate. This was likely the reason why small particles exhibited a smaller molten pool depth compared to large particles.
The effect of particle size on the powder packing density and molten pool depth was clearly confirmed, even though the particle size distribution was varied in extremely small increments of 4 μ m. This suggests the importance of powder bed properties in the melting and solidification phenomena in the L-PBF process. While this study focused on the average particle diameter, some previous studies using DEM simulation have suggested that powder particle shape, as well as the shape and travelling speed of the coater blade, can also affect powder bed properties [35,37,52,58,59,60].

4. Conclusions

The aim of this study was to evaluate the effect of powder particle size (average particle diameter) on powder packing properties and molten pool dimensions using DEM and multiphysics CFD simulations. We modelled the movement of a conventionally used real L-PBF system through DEM simulation and conducted a series of powder spreading DEM simulations with different average particle diameters of 24, 28, 32, 36, and 40 μ m. Multiphysics CFD simulations of single-track laser scanning were performed, incorporating the final particle positions and radii obtained from the powder spreading DEM simulations. As a result, the following conclusions were obtained:
  • The packing fraction increased as the average particle diameter decreased.
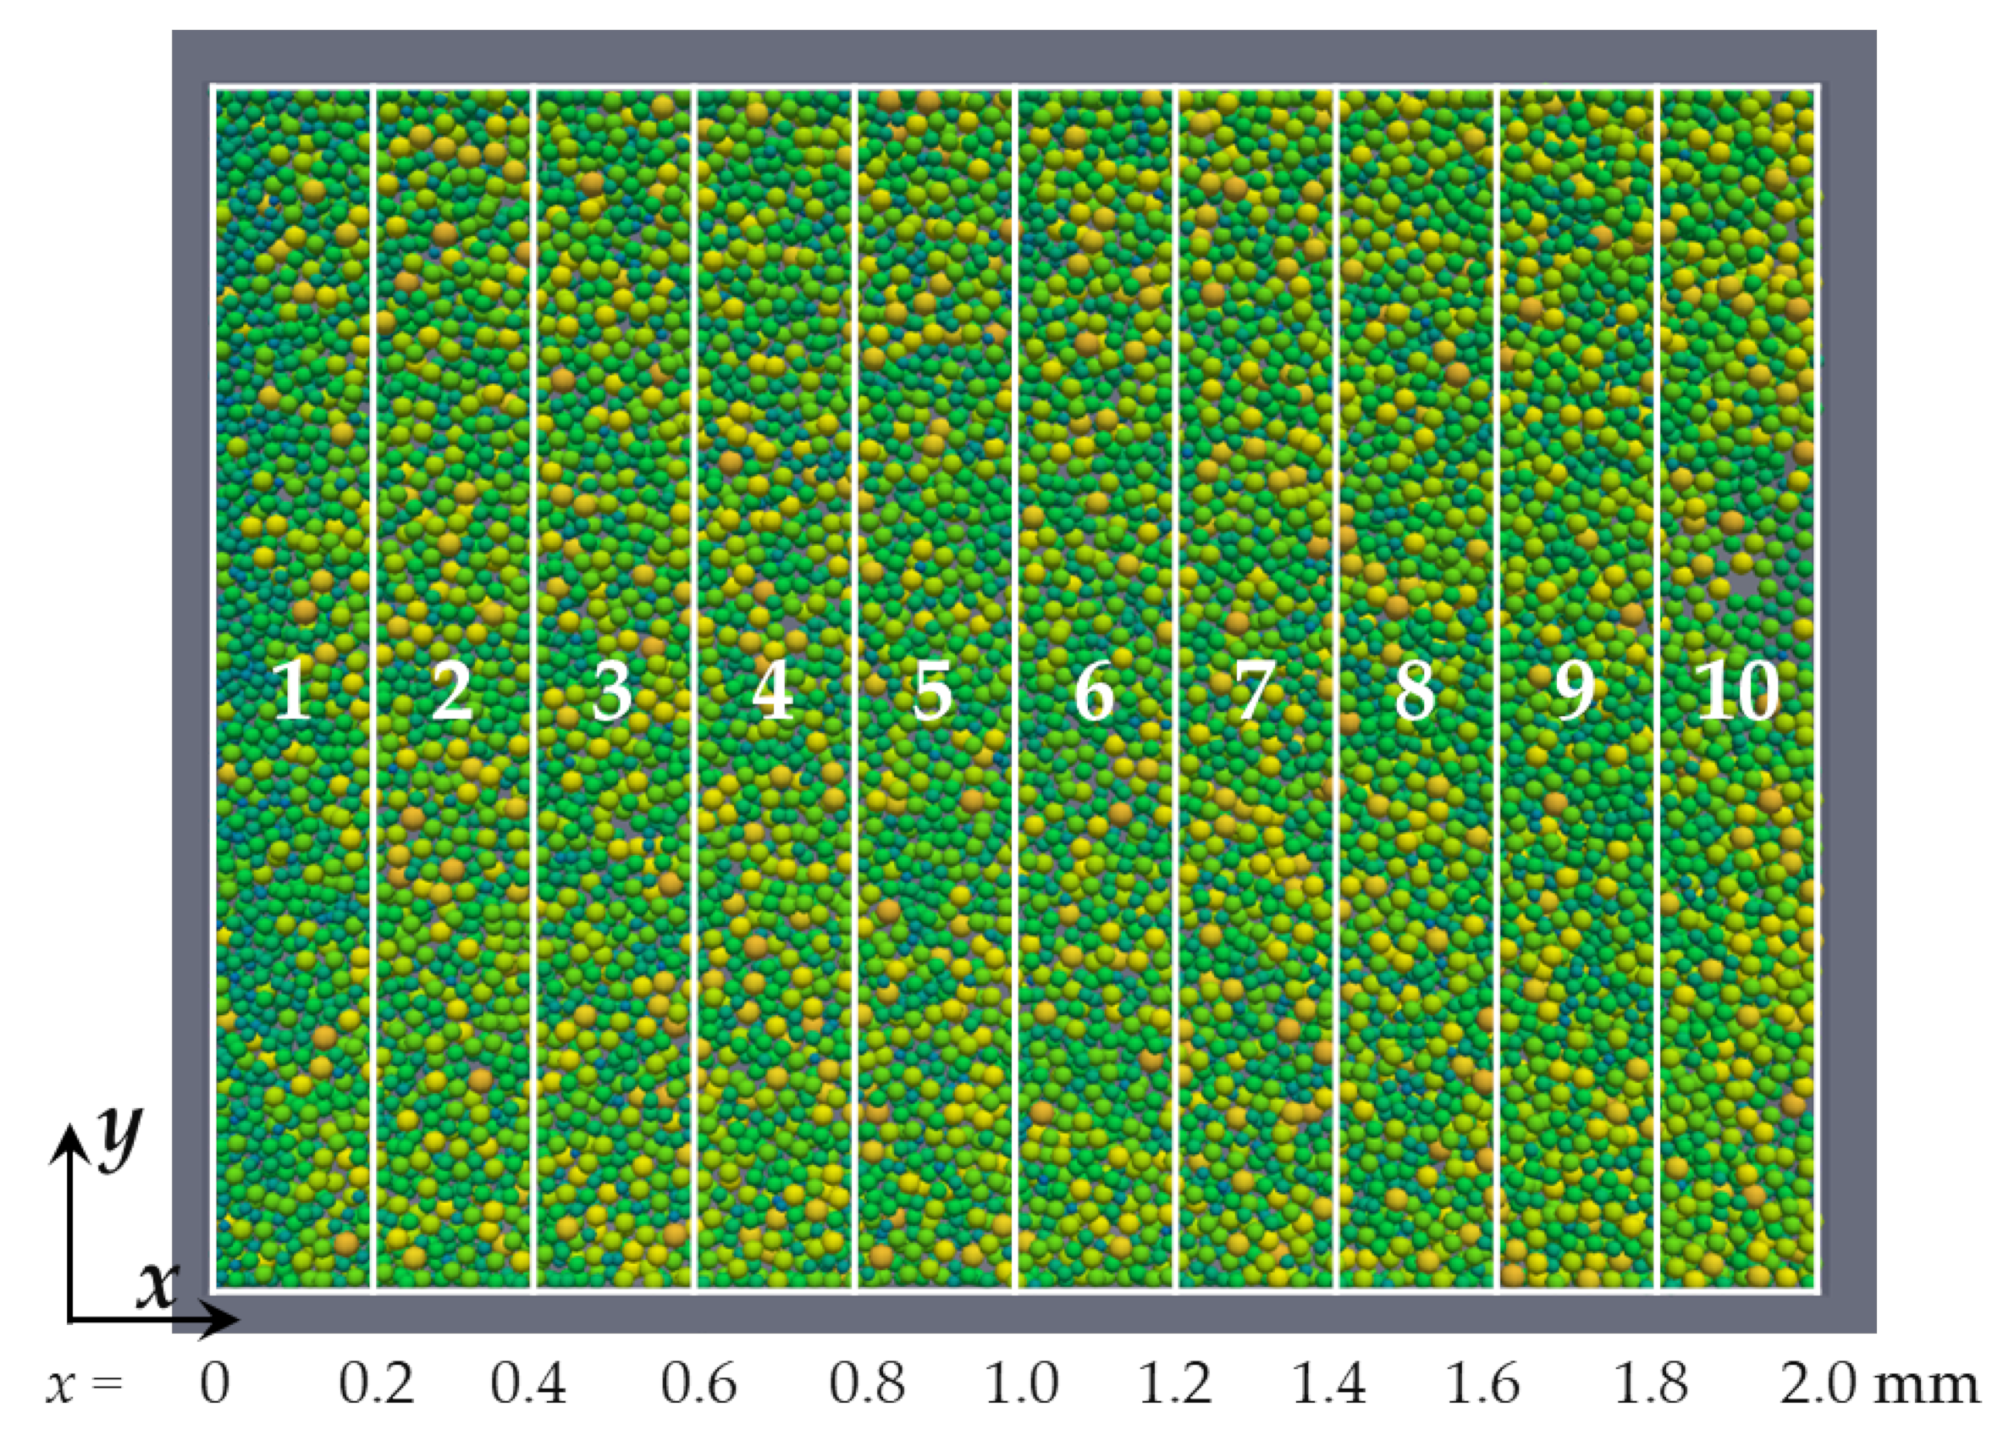
  • Smaller particles tended to accumulate at the inlet edge of the powder bed formation region.
  • As excess particles penetrated prior to powder spreading by the movement of the coater, the number of filled particles between the centre and the outlet edge of the powder bed formation region increased.
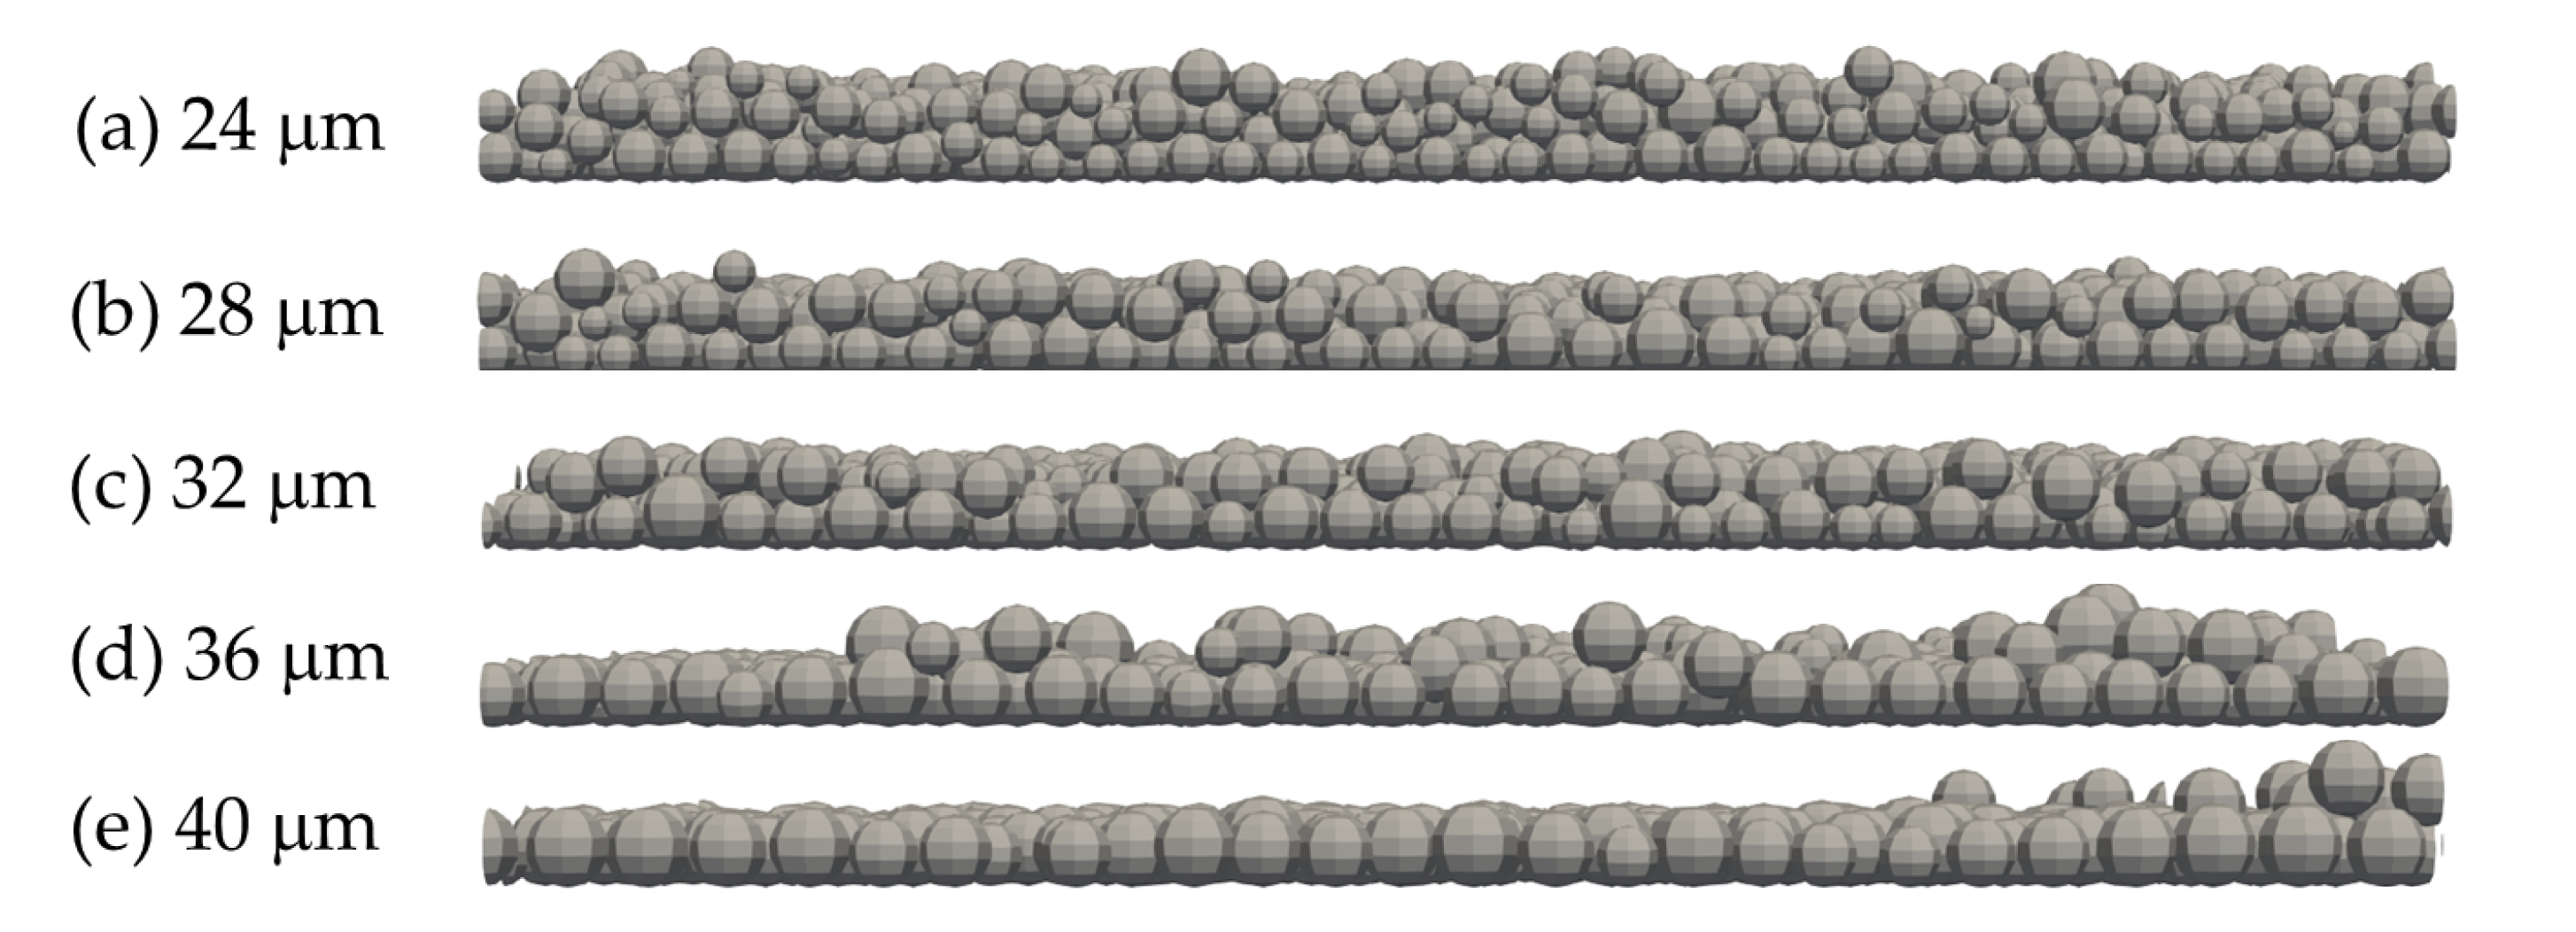
  • The powder bed thickness increased as the average particle diameter decreased.
  • Multiple particles piled up in the z direction when the average particle diameter was small, whereas the particles spread inhomogeneously with a thickness of one particle for large average diameters.
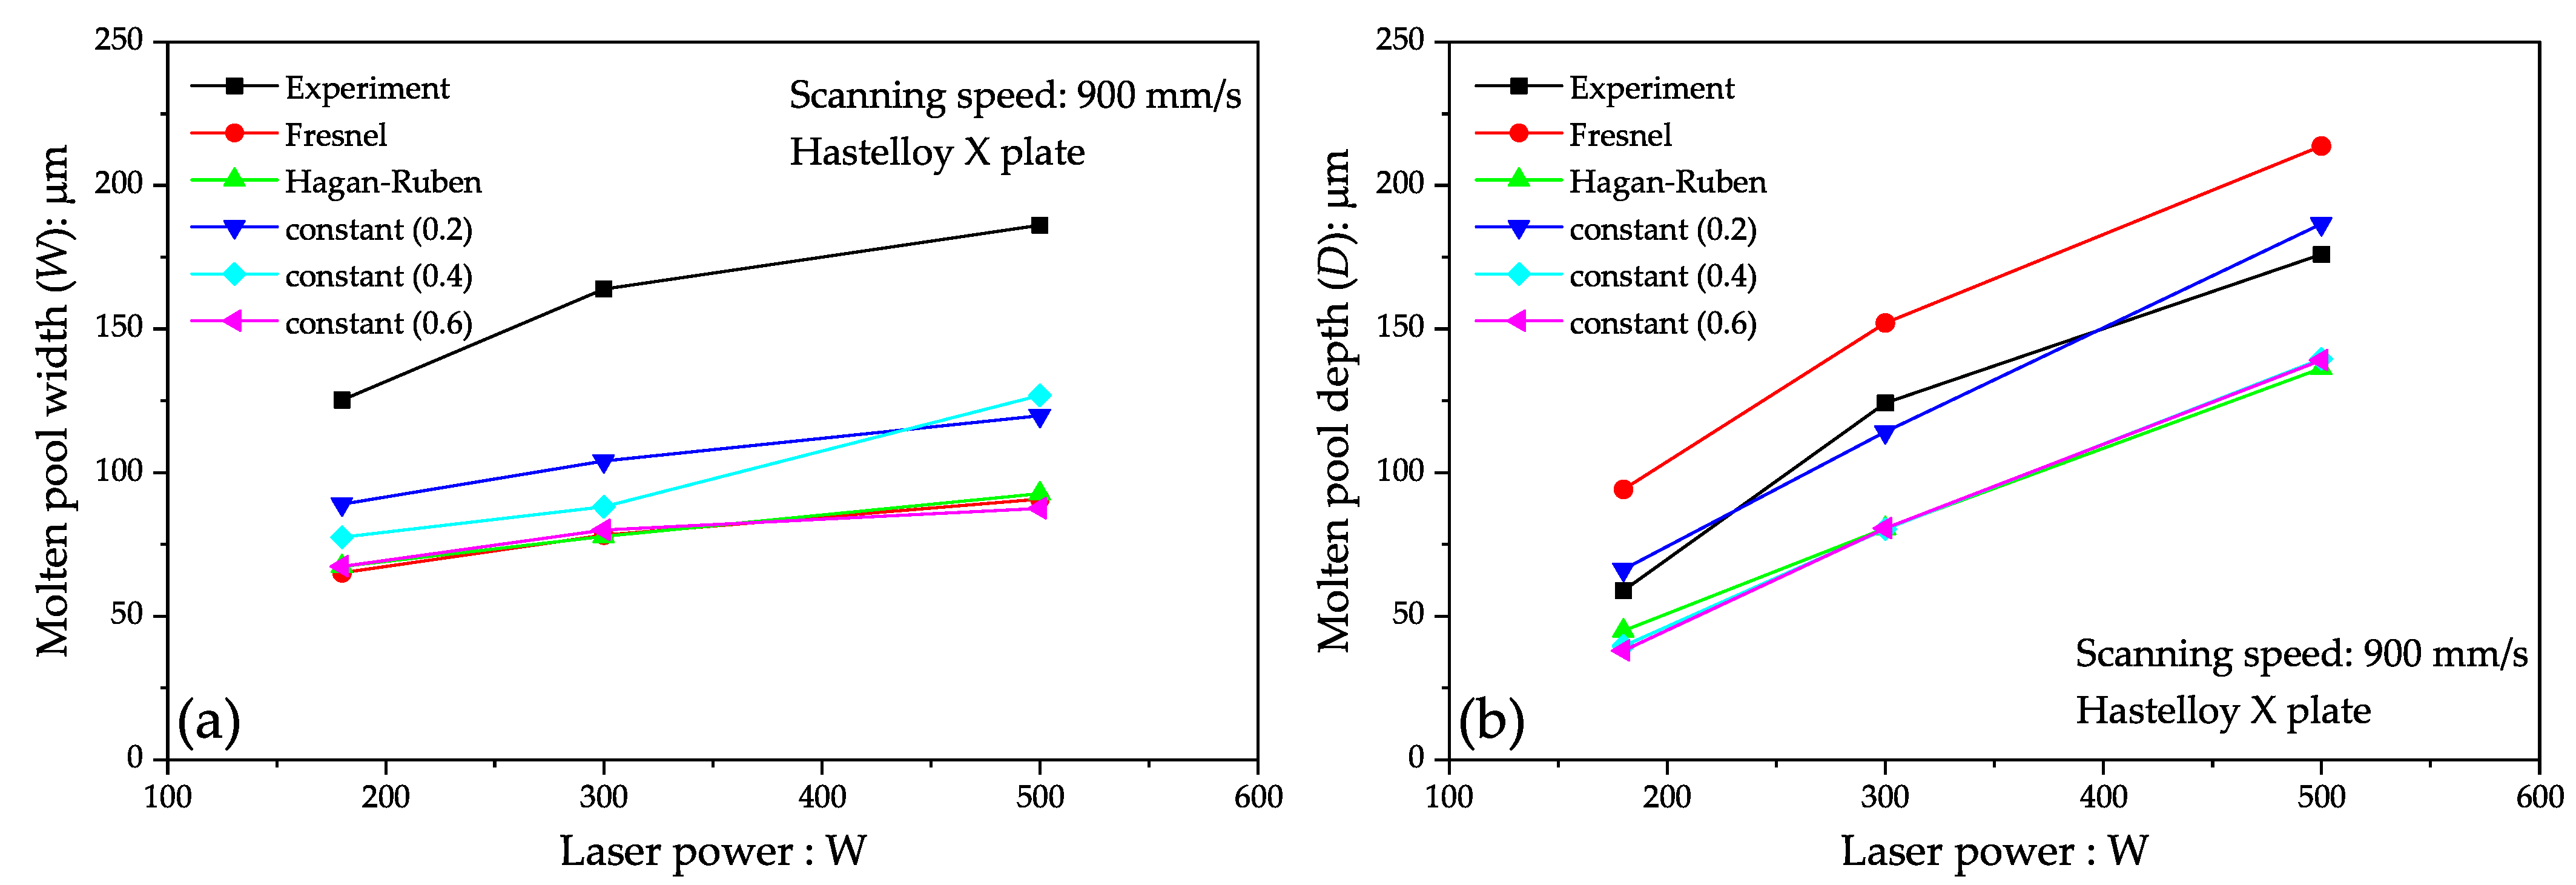
  • The molten pool width was hardly dependent on the average particle diameter and was approximately equal to the laser spot diameter used in the simulation.
  • The molten pool depth increased with decreasing average particle diameter. It was suggested that the region of the powder bed with a smaller average particle diameter absorbed greater thermal energy due to the greater specific surface area resulting from the large powder bed thickness and the accumulation of multiple particles.
In the DEM simulations in this study, the average particle diameter influenced not only the powder bed thickness but also the packing fraction. The packing fraction can affect the specific surface area, which implies that the effect of the packing fraction is also implicitly included. To evaluate the effect of the packing fraction, the powder spreading simulation needs to be improved to form a powder bed with a constant thickness but different packing fractions. This is a task for our future research.
This study focused on particle size distribution as a factor influencing the powder packing properties. Other factors can influence the packing properties, including the powder particle shape, as well as the shape and travelling speed of the coater blade. To further improve the quality of parts manufactured using the L-PBF process, it is important to systematically evaluate the effect of these influencing factors on the powder packing properties and molten pool formation behaviour.

Author Contributions

Conceptualisation, J.K.; methodology, M.K. and J.K.; software, M.K. and J.K.; validation, J.K., M.K., S.N. and M.W.; formal analysis, J.K., M.K., S.N. and M.W.; investigation, J.K., M.K., S.N. and M.W.; resources, M.K. and M.W.; data curation, J.K.; writing—original draft preparation, J.K.; writing—review and editing, J.K., M.K., S.N. and M.W.; visualisation, J.K.; supervision, M.W.; project administration, M.W.; funding acquisition, M.W. All authors have read and agreed to the published version of the manuscript.

Funding

This work was supported by the Innovative Science and Technology Initiative for Security under grant number JPJ004596, implemented by the Acquisition, Technology, and Logistics Agency (ATLA).

Institutional Review Board Statement

Not applicable.

Informed Consent Statement

Not applicable.

Data Availability Statement

Data are contained within the article.

Acknowledgments

The authors would like to thank M. Tsujii for the technical assistance with the single-track experiments.

Conflicts of Interest

The authors declare no conflicts of interest. The funders had no role in the design of the study; in the collection, analyses, or interpretation of data; in the writing of the manuscript; or in the decision to publish the results.

References

  1. Schneider, J.; Farris, L.; Nolze, G.; Reinsch, S.; Cios, G.; Tokarski, T.; Thompson, S. Microstructure Evolution in Inconel 718 Produced by Powder Bed Fusion Additive Manufacturing. J. Manuf. Mater. Process. 2022, 6, 20. [Google Scholar] [CrossRef]
  2. Peters, M.; Brodie, E.G.; Thomas, S.; Djumas, L.; Brameld, M.; Salasi, M.; Quadir, Z.; Iannuzzi, M.; Wang, J.; Sercombe, T.; et al. On the importance of nano-oxide control in laser powder bed fusion manufactured Ni-based alloys to enhance fracture properties. Materialia 2023, 32, 101958. [Google Scholar] [CrossRef]
  3. Kuo, Y.L.; Kamigaichi, A.; Kakehi, K. Characterization of Ni-Based Superalloy Built by Selective Laser Melting and Electron Beam Melting. Metall. Mater. Trans. A Phys. Metall. Mater. Sci. 2018, 49, 3831–3837. [Google Scholar] [CrossRef]
  4. Sato, N.; Nakano, S.; Nagahari, T.; Nagoya, T.; Kakehi, K. Microstructure of Nickel-Based Superalloy Fabricated by Selective Laser Melting in Vacuum. J. Jpn. Soc. Powder Powder Metall. 2020, 67, 121–124. [Google Scholar] [CrossRef]
  5. Wang, J.; Zhu, R.; Liu, Y.; Zhang, L. Understanding melt pool characteristics in laser powder bed fusion: An overview of single- and multi-track melt pools for process optimization. Adv. Powder Mater. 2023, 2, 100137. [Google Scholar] [CrossRef]
  6. Seede, R.; Shoukr, D.; Zhang, B.; Whitt, A.; Gibbons, S.; Flater, P.; Elwany, A.; Arroyave, R.; Karaman, I. An ultra-high strength martensitic steel fabricated using selective laser melting additive manufacturing: Densification, microstructure, and mechanical properties. Acta Mater. 2020, 186, 199–214. [Google Scholar] [CrossRef]
  7. Letenneur, M.; Kreitcberg, A.; Brailovski, V. Optimization of Laser Powder Bed Fusion Processing Using a Combination of Melt Pool Modeling and Design of Experiment Approaches: Density Control. J. Manuf. Mater. Process. 2019, 3, 21. [Google Scholar] [CrossRef]
  8. DebRoy, T.; Wei, H.L.; Zuback, J.S.; Mukherjee, T.; Elmer, J.W.; Milewski, J.O.; Beese, A.M.; Wilson-Heid, A.; De, A.; Zhang, W. Additive manufacturing of metallic components—Process, structure and properties. Prog. Mater. Sci. 2018, 92, 112–224. [Google Scholar] [CrossRef]
  9. Kitano, H.; Kusano, M.; Tsujii, M.; Yumoto, A.; Watanabe, M. Process Parameter Optimization Framework for the Selective Laser Melting of Hastelloy X Alloy Considering Defects and Solidification Crack Occurrence. Crystals 2021, 11, 578. [Google Scholar] [CrossRef]
  10. Katagiri, J.; Kusano, M.; Minamoto, S.; Kitano, H.; Daimaru, K.; Tsujii, M.; Watanabe, M. Melt Pool Shape Evaluation by Single-Track Experiments and Finite-Element Thermal Analysis: Balling and Lack of Fusion Criteria for Generating Process Window of Inconel738LC. Materials 2023, 16, 1729. [Google Scholar] [CrossRef]
  11. Zhao, C.; Parab, N.D.; Li, X.; Fezzaa, K.; Tan, W.; Rollett, A.D.; Sun, T. Critical instability at moving keyhole tip generates porosity in laser melting. Science 2020, 370, 1080–1086. [Google Scholar] [CrossRef]
  12. Cunningham, R.; Zhao, C.; Parab, N.; Kantzos, C.; Pauza, J.; Fezzaa, K.; Sun, T.; Rollett, A.D. Keyhole threshold and morphology in laser melting revealed by ultrahigh-speed x-ray imaging. Science 2019, 363, 849–852. [Google Scholar] [CrossRef] [PubMed]
  13. Huang, Y.; Fleming, T.G.; Clark, S.J.; Marussi, S.; Fezzaa, K.; Thiyagalingam, J.; Leung, C.L.A.; Lee, P.D. Keyhole fluctuation and pore formation mechanisms during laser powder bed fusion additive manufacturing. Nat. Commun. 2022, 13, 1170. [Google Scholar] [CrossRef] [PubMed]
  14. Morgan, R.; Sutcliffe, C.J.; O’Neill, W. Experimental investigation of nanosecond pulsed Nd:YAG laser re-melted pre-placed powder beds. Rapid Prototyp. J. 2001, 7, 159. [Google Scholar] [CrossRef]
  15. Tolochko, N.K.; Mozzharov, S.E.; Yadroitsev, I.A.; Laoui, T.; Froyen, L.; Titov, V.I.; Ignatiev, M.B. Balling processes during selective laser treatment of powders. Rapid Prototyp. J. 2004, 10, 78–87. [Google Scholar] [CrossRef]
  16. Yadroitsev, I.; Bertrand, P.; Smurov, I. Parametric analysis of the selective laser melting process. Appl. Surf. Sci. 2007, 253, 8064–8069. [Google Scholar] [CrossRef]
  17. Yadroitsev, I.; Yadroitsava, I.; Bertrand, P.; Smurov, I. Factor analysis of selective laser melting process parameters and geometrical characteristics of synthesized single tracks. Rapid Prototyp. J. 2012, 18, 201–208. [Google Scholar] [CrossRef]
  18. Kruth, J.P.; Froyen, L.; Vaerenbergh, J.V.; Mercelis, P.; Rombouts, M.; Lauwers, B. Selective laser melting of iron-based powder. J. Mater. Process. Technol. 2004, 149, 616–622. [Google Scholar] [CrossRef]
  19. Gusarov, A.V.; Yadroitsev, I.; Bertrand, P.; Smurov, I. Heat transfer modelling and stability analysis of selective laser melting. Appl. Surf. Sci. 2007, 254, 975–979. [Google Scholar] [CrossRef]
  20. Guirguis, D.; Tucker, C.; Beuth, J. Accelerating process development for 3D printing of new metal alloys. Nat. Commun. 2024, 15, 582. [Google Scholar] [CrossRef] [PubMed]
  21. Kusano, M.; Watanabe, M. Heat Source Model Development for Thermal Analysis of Laser Powder Bed Fusion Using Bayesian Optimization and Machine Learning. Integr. Mater. Manuf. Innov. 2024, 13, 288–304. [Google Scholar] [CrossRef]
  22. Cheng, B.; Shrestha, S.; Chou, K. Stress and deformation evaluations of scanning strategy effect in selective laser melting. Addit. Manuf. 2016, 12, 240–251. [Google Scholar] [CrossRef]
  23. Carraturo, M.; Lane, B.; Yeung, H.; Kollmannsberger, S.; Reali, A.; Auricchio, F. Numerical Evaluation of Advanced Laser Control Strategies Influence on Residual Stresses for Laser Powder Bed Fusion Systems. Integr. Mater. Manuf. Innov. 2020, 9, 435–445. [Google Scholar] [CrossRef]
  24. Ninpetch, P.; Kowitwarangkul, P.; Mahathanabodee, S.; Chalermkarnnon, P.; Rattanadecho, P. Computational investigation of thermal behavior and molten metal flow with moving laser heat source for selective laser melting process. Case Stud. Therm. Eng. 2021, 24, 100860. [Google Scholar] [CrossRef]
  25. Alphonso, W.; Baier, M.; Carmignato, S.; Hattel, J.; Bayat, M. On the possibility of doing reduced order, thermo-fluid modelling of laser powder bed fusion (L-PBF)–Assessment of the importance of recoil pressure and surface tension. J. Manuf. Process. 2023, 94, 564–577. [Google Scholar] [CrossRef]
  26. Flint, T.F.; Robson, J.D.; Parivendhan, G.; Cardiff, P. laserbeamFoam: Laser ray-tracing and thermally induced state transition simulation toolkit. SoftwareX 2023, 21, 101299. [Google Scholar] [CrossRef]
  27. Wang, L.; Zhang, Y.; Chia, H.Y.; Yan, W. Mechanism of keyhole pore formation in metal additive manufacturing. NPJ Comput. Mater. 2022, 8, 22. [Google Scholar] [CrossRef]
  28. Wang, W.; Lin, W.; Yang, R.; Wu, Y.; Li, J.; Zhang, Z.; Zhai, Z. Mesoscopic evolution of molten pool during selective laser melting of superalloy Inconel 738 at elevating preheating temperature. Mater. Des. 2022, 213, 110355. [Google Scholar] [CrossRef]
  29. Li, E.L.; Wang, L.; Yu, A.B.; Zhou, Z.Y. A three-phase model for simulation of heat transfer and melt pool behaviour in laser powder bed fusion process. Powder Technol. 2021, 381, 298–312. [Google Scholar] [CrossRef]
  30. Bayat, M.; Mohanty, S.; Hattel, J.H. Multiphysics modelling of lack-of-fusion voids formation and evolution in IN718 made by multi-track/multi-layer L-PBF. Int. J. Heat Mass Transf. 2019, 139, 95–114. [Google Scholar] [CrossRef]
  31. Ren, Z.; Zhang, D.Z.; Fu, G.; Jiang, J.; Zhao, M. High-fidelity modelling of selective laser melting copper alloy: Laser reflection behavior and thermal-fluid dynamics. Mater. Des. 2021, 207, 109857. [Google Scholar] [CrossRef]
  32. Le, T.N.; Chou, K. Surface Formation of Sloping Features in Laser Powder–Bed Fusion by Multi-Track Multi-Layer Simulations. Metals 2023, 13, 976. [Google Scholar] [CrossRef]
  33. Fotovvati, B.; Chou, K. Multi-layer thermo-fluid modeling of powder bed fusion (PBF) process. J. Manuf. Process. 2022, 83, 203–211. [Google Scholar] [CrossRef]
  34. Ninpetch, P.; Chalermkarnnon, P.; Kowitwarangkul, P. Multiphysics Simulation of Thermal-Fluid Behavior in Laser Powder Bed Fusion of H13 Steel: Influence of Layer Thickness and Energy Input. Met. Mater. Int. 2023, 29, 536–551. [Google Scholar] [CrossRef]
  35. Cook, P.S.; Phua, A.; Davies, C.H.; Delaney, G.W. Modelling the influences of powder layer depth and particle morphology on powder bed fusion using a coupled DEM-CFD approach. Powder Technol. 2023, 429, 118927. [Google Scholar] [CrossRef]
  36. Bogdanova, M.; Chernyshikhin, S.; Zakirov, A.; Zotov, B.; Fedorenko, L.; Belousov, S.; Perepelkina, A.; Korneev, B.; Lyange, M.; Pelevin, I.; et al. Mesoscale Simulation of Laser Powder Bed Fusion with an Increased Layer Thickness for AlSi10Mg Alloy. J. Manuf. Mater. Process. 2024, 8, 7. [Google Scholar] [CrossRef]
  37. Fouda, Y.M.; Bayly, A.E. A DEM study of powder spreading in additive layer manufacturing. Granul. Matter 2020, 22, 10. [Google Scholar] [CrossRef]
  38. Yuan, W.; Chen, H.; Li, S.; Heng, Y.; Yin, S.; Wei, Q. Understanding of adopting flat-top laser in laser powder bed fusion processed Inconel 718 alloy: Simulation of single-track scanning and experiment. J. Mater. Res. Technol. 2022, 16, 1388–1401. [Google Scholar] [CrossRef]
  39. Cundall, P.A.; Strack, O.D.L. A discrete element model for granular assemblies. Géotechnique 1979, 29, 47–65. [Google Scholar] [CrossRef]
  40. Katagiri, J.; Kusano, M.; Nomoto, S.; Watanabe, M. Influence of recoil pressure, mushy zone flow resistance and reflectivity on melt pool shape in laser powder bed fusion simulation. Case Stud. Therm. Eng. 2023, 50, 103477. [Google Scholar] [CrossRef]
  41. Cho, J.H.; Na, S.J. Implementation of real-time multiple reflection and Fresnel absorption of laser beam in keyhole. J. Phys. D Appl. Phys. 2006, 39, 5372–5378. [Google Scholar] [CrossRef]
  42. Fuchs, S.L.; Praegla, P.M.; Cyron, C.J.; Wall, W.A.; Meier, C. A versatile SPH modeling framework for coupled microfluid-powder dynamics in additive manufacturing: Binder jetting, material jetting, directed energy deposition and powder bed fusion. Eng. Comput. 2022, 38, 4853–4877. [Google Scholar] [CrossRef]
  43. Queva, A.; Guillemot, G.; Moriconi, C.; Metton, C.; Bellet, M. Numerical study of the impact of vaporisation on melt pool dynamics in Laser Powder Bed Fusion—Application to IN718 and Ti–6Al–4V. Addit. Manuf. 2020, 35, 101249. [Google Scholar] [CrossRef]
  44. Afrin, N.; Ji, P.; Chen, J.K.; Zhang, Y. Effects of Beam Size and Pulse Duration on the Laser Drilling Process; American Society of Mechanical Engineers: New York, NY, USA, 2016. [Google Scholar] [CrossRef]
  45. Zheng, H.; Wang, Y.; Xie, Y.; Yang, S.; Hou, R.; Ge, Y.; Lang, L.; Gong, S.; Li, H. Observation of vapor plume behavior and process stability at single-track and multi-track levels in laser powder bed fusion regime. Metals 2021, 11, 937. [Google Scholar] [CrossRef]
  46. Wang, R.; Garcia, D.; Kamath, R.R.; Dou, C.; Ma, X.; Shen, B.; Choo, H.; Fezzaa, K.; Yu, H.Z.; Kong, Z. In situ melt pool measurements for laser powder bed fusion using multi sensing and correlation analysis. Sci. Rep. 2022, 12, 13716. [Google Scholar] [CrossRef] [PubMed]
  47. Zheng, H.; Li, H.; Lang, L.; Gong, S.; Ge, Y. Effects of scan speed on vapor plume behavior and spatter generation in laser powder bed fusion additive manufacturing. J. Manuf. Process. 2018, 36, 60–67. [Google Scholar] [CrossRef]
  48. Bitharas, I.; Parab, N.; Zhao, C.; Sun, T.; Rollett, A.D.; Moore, A.J. The interplay between vapour, liquid, and solid phases in laser powder bed fusion. Nat. Commun. 2022, 13, 2959. [Google Scholar] [CrossRef] [PubMed]
  49. Cai, Y.; Heng, H.; Li, F.; Wang, M. The influences of welding parameters on the metal vapor plume in fiber laser welding based on 3D reconstruction. Opt. Laser Technol. 2018, 107, 1–7. [Google Scholar] [CrossRef]
  50. Trapp, J.; Rubenchik, A.M.; Guss, G.; Matthews, M.J. In situ absorptivity measurements of metallic powders during laser powder-bed fusion additive manufacturing. Appl. Mater. Today 2017, 9, 341–349. [Google Scholar] [CrossRef]
  51. Xie, J.; Kar, A.; Rothenflue, J.A.; Latham, W.P. Temperature-dependent absorptivity and cutting capability of CO2, Nd:YAG and chemical oxygen–iodine lasers. J. Laser Appl. 1997, 9, 77–85. [Google Scholar] [CrossRef]
  52. Okugawa, M.; Isono, Y.; Koizumi, Y.; Nakano, T. Raking Process for Powder Bed Fusion of Ti6Al4V Alloy Powder Analyzed by Discrete Element Method+1. Mater. Trans. 2023, 64, 37–43. [Google Scholar] [CrossRef]
  53. Savage, S.B.; Lun, C.K.K. Particle size segregation in inclined chute flow of dry cohesionless granular solids. J. Fluid Mech. 1988, 189, 311–335. [Google Scholar] [CrossRef]
  54. Khakhar, D.V.; McCarthy, J.J.; Ottino, J.M. Mixing and segregation of granular materials in chute flows. Chaos Interdiscip. J. Nonlinear Sci. 1999, 9, 594–610. [Google Scholar] [CrossRef] [PubMed]
  55. Gray, J.M.N.T.; Chugunov, V.A. Particle-size segregation and diffusive remixing in shallow granular avalanches. J. Fluid Mech. 2006, 569, 365–398. [Google Scholar] [CrossRef]
  56. Wiederseiner, S.; Andreini, N.; Épely Chauvin, G.; Moser, G.; Monnereau, M.; Gray, J.M.N.T.; Ancey, C. Experimental investigation into segregating granular flows down chutes. Phys. Fluids 2011, 23, 013301. [Google Scholar] [CrossRef]
  57. Neveu, A.; Larcher, M.; Delannay, R.; Jenkins, J.T.; Valance, A. Particle segregation in inclined high-speed granular flows. J. Fluid Mech. 2022, 935, A41. [Google Scholar] [CrossRef]
  58. Phua, A.; Cook, P.S.; Davies, C.H.; Delaney, G.W. Powder spreading over realistic laser melted surfaces in metal additive manufacturing. Addit. Manuf. Lett. 2022, 3, 100039. [Google Scholar] [CrossRef]
  59. Kikuchi, K.; Tanifuji, Y.; Zhou, W.; Nomura, N.; Kawasaki, A. Experimental Characterization and Computational Simulation of Powder Bed for Powder Bed Fusion Additive Manufacturing. Mater. Trans. 2022, 63, 931–938. [Google Scholar] [CrossRef]
  60. Haeri, S. Optimisation of blade type spreaders for powder bed preparation in Additive Manufacturing using DEM simulations. Powder Technol. 2017, 321, 94–104. [Google Scholar] [CrossRef]
Figure 1. The five particle size distributions used in this study.
Jmmp 08 00071 g001
Figure 2. Snapshots captured during powder spreading DEM simulation using particles with an average diameter of 32 μ m.
Jmmp 08 00071 g002
Figure 3. Top view of the powder bed formed obtained from the powder spreading simulation for an average particle diameter of 24 μ m and dimensions of the multiphysics CFD model.
Jmmp 08 00071 g003
Figure 4. An example image of the determination of the molten pool.
Jmmp 08 00071 g004
Figure 5. An example cross-sectional image obtained from the single-track laser scanning experiments for a laser power of 300 W and a scanning speed of 900 mm/s.
Jmmp 08 00071 g005
Figure 6. Effect of laser reflectivity on the molten pool width (a) and depth (b).
Jmmp 08 00071 g006
Figure 7. Relationship between average particle size and packing fraction. Points and error bars represent the averages and standard deviations for the five simulations with different initial particle configurations.
Jmmp 08 00071 g007
Figure 8. Side views obtained from the powder spreading simulations with different average particle diameters.
Jmmp 08 00071 g008
Figure 9. Top views obtained from the powder spreading simulations with different average particle diameters.
Jmmp 08 00071 g009
Figure 10. Top view of a 24 μ m average particle diameter and ten subdomains along the x direction.
Jmmp 08 00071 g010
Figure 11. Average particle diameters (a) and number of particles (b) in each subdomain shown in Figure 10.
Jmmp 08 00071 g011
Figure 12. The particle size distributions at the powder storage region and powder bed formation region for D a v = 24 μ m (a), 28 μ m (b), 32 μ m (c), 36 μ m (d), and 40 μ m (e).
Jmmp 08 00071 g012
Figure 13. Relationship between the average particle diameter and molten pool dimensions, including the molten pool width (W) and depth (D). The points and error bars represent the averages and standard deviations for simulations conducted using the five different tracks shown in Figure 3.
Jmmp 08 00071 g013
Table 1. Chemical composition of Hastelloy X.
NiCrFeMoCoWCAlBMnNOPSSiTi
PowderNi-bal.22.118.19.01.60.70.060.05<0.0020.00.0080.0013<0.0050.003<0.10.09
Bare plateR48.2221.5618.388.861.010.590.080.190.0050.48--0.008<0.0020.460.02
Table 2. DEM parameters used in this study.
ModelParameter [Unit]
Density8220 [kg/m3]
Spring constant 5 × 10 6 [N/m]
Poisson’s ratio0.3
Restitution coefficient0.4
Particle–particle friction coefficient0.3
Particle–wall friction coefficient0.3
Time increment 2 × 10 8 [s]
Table 3. Material properties of Hastelloy X used.
ParameterValue [Unit]
Solid density8220 [kg/m3]
Liquid density8220 [kg/m3]
Density of gas1.780 [kg/m3]
Solidus temperature1533.15 [K]
Liquidus temperature1628.15 [K]
Evaporation temperature3100 [K] [44]
Thermal conductivity29.0 [W/(m·K)]
Latent heat of fusion27,600 [J/kg]
Latent heat of evaporation645,700 [J/kg] [44]
Specific heat capacity of metal677 [J/kg·K]
Specific heat capacity of gas523 [J/kg·K]
Surface tension coefficient ( σ ) 1.1 × 10 4 T + 2.067 [N/m] [43]
Liquid viscosity ( μ )0.005 [Pa·s]
Gas viscosity 1.0 × 10 5 [Pa·s]
Mushy zone constant105 [kg/(m3s)]
Table 4. The reflectivity models and parameter values used.
ModelModel Parameter Value
Fresnel ϵ = 0.25
Hagan–Ruben-
Constant0.2
Constant0.4
Constant0.6
Disclaimer/Publisher’s Note: The statements, opinions and data contained in all publications are solely those of the individual author(s) and contributor(s) and not of MDPI and/or the editor(s). MDPI and/or the editor(s) disclaim responsibility for any injury to people or property resulting from any ideas, methods, instructions or products referred to in the content.

