Article

Analytical Model of Quantitative Texture Prediction Considering Heat Transfer Based on Single-Phase Material in Laser Powder Bed Fusion

1
George W. Woodruff School of Mechanical Engineering, Georgia Institute of Technology, 801 Ferst Drive, Atlanta, GA 30332, USA
2
Department of Wood Science and Engineering, Oregon State University, 1500 SW Jefferson Way, Corvallis, OR 97331, USA
3
Yale School of Business and Management, Yale University, 165 Whitney Ave, New Haven, CT 06511, USA
4
School of Materials Science and Engineering, Georgia Institute of Technology, 771 Ferst Drive NW, Atlanta, GA 30332, USA
*
Authors to whom correspondence should be addressed.
J. Manuf. Mater. Process. 2024, 8(2), 70; https://doi.org/10.3390/jmmp8020070
Submission received: 7 March 2024 / Revised: 23 March 2024 / Accepted: 25 March 2024 / Published: 30 March 2024
(This article belongs to the Special Issue High-Performance Metal Additive Manufacturing)

Abstract

:
Laser powder bed fusion (LPBF) is widely used in metal additive manufacturing to create geometrically complex parts, where heat transfer and its affected temperature distribution significantly influence the parts’ materials’ microstructure and the resulting materials’ properties. Among all the microstructure representations, crystallographic orientations play a paramount role in determining the mechanical properties of materials. This paper first developed a physics-based analytical model to predict the 3D temperature distribution in PBF considering heat transfer boundary conditions; heat input using point-moving heat source solutions; and heat loss due to heat conduction, convection, and radiation. The superposition principle obtained temperature distributions based on linear heat sources and linear heat loss solutions. Then, the temperature distribution was used to analytically obtain the texture grown on a substrate with random grain orientations considering columnar-to-equiaxed transition (CET). Thus, the link between process parameters and texture was established through CET models and physical rules. Ti-6Al-4V was selected to demonstrate the capability of the analytical model in a single-phase situation. By applying advanced thermal models, the accuracy of the texture prediction was evaluated based on a comparison of experimental data from the literature and past analytical model results. Hence, this work not only provides a method of the fast analytical simulation of texture prediction in the single-phase mode for metallic materials but also paves the road for subsequent studies on microstructure-affected or texture-affected materials’ properties for both academic research and industrial applications. The prediction of single-phase material texture has never been achieved before, and the scalability has been expanded.

1. Introduction

Laser powder bed fusion (LPBF) is among the broadly used metal additive manufacturing technologies in which the powder materials are selectively melted and fused by a moving laser beam, and the final products are fabricated in a layer-by-layer style [1]. Many numerical and analytical models can predict the mechanical behavior of the material system investigated on the basis of their materials’ microstructure. However, these models are very time-consuming, especially in the case of additive manufacturing. The microstructure is anisotropic with huge grains (on the scale of 100 microns). Therefore, a sufficient microstructure size can be measured in mm, where the current finite element models cannot deal with these large amounts of data. Thus, an analytical-based simulation approach will be a more proper method to conduct microstructure-evolution-related investigations. Texture is essential across many disciplines, including materials, mechanics, geology, computer engineering, etc. In materials and mechanics areas, texture refers to the distribution of the crystallographic orientations of materials, and these orientations play an essential role in specifying their properties. In LPBF, the relationship between the microstructure and material properties of the manufactured parts is usually a vital topic in the research field. Deriving the microstructure and the following materials’ properties based on the processing parameters remains difficult for scientists for many reasons, such as high computational cost, time consumption, defect influence, lack of accuracy, difficulty in real-time monitoring, etc. Among them, compared to FEM and experimental approaches, analytical simulation is a convenient way to simulate texture evolution. Still, the accuracy is often insufficient due to factors such as lack of consideration of heat transfer, complex geometry parts, etc., though having a fast speed.
For the texture evolution prediction in LPBF-AM, Hunt’s [2] columnar-to-equiaxed (CET) transition model is helpful in obtaining the processing-microstructure map. Beuth et al. [3] converted the solidification map to G-R (thermal gradient–solidification rate) space. H.L. Wei and colleagues [4] conducted a study on the evolution of grain orientation during the additive manufacturing of an aluminum alloy, taking inspiration from welding. However, their work did not provide a generalized framework that takes into account the thermal process for different materials, nor did it provide insights for future research. J. Liu et al. [5] utilized these to develop a relatively fast analytical model to predict the texture of Ti-6Al-4V after solidification in LPBF. Still, the accuracy was not guaranteed due to the lack of an excellent thermal model, which led them to reach some wrong conclusions. Mostafa [6] once developed a similar analytical texture model combining Ning’s work on a thermal model considering both heat input and heat loss. Still, he had some difficulties calculating the texture in the exact molten pool. It is a single BCC phase model, which leads to a relatively large deviation from the experimental results. His work also did not demonstrate enough expandability and scalability. Thus, it is crucial to work out a more accurate analytical texture model in order to pave the road for further investigation of the evolution of materials’ properties in the LPBF additive manufacturing process. S. Wei et al. [7] and D. Zhang et al. [8] have both proposed experimentally verified methods to optimize material components and achieve superior material properties by refining texture stimulated by thermal gradient. By utilizing the analytical approach presented in this study, it is possible to simulate the evolution of microstructure much more quickly. This can lead to the future discovery of more promising materials produced using additive manufacturing techniques.
This research uses computational methodology to generate a single BCC beta phase texture based on thermal history to represent the liquidus materials of Ti-6Al-4V during melting. Ning’s thermal model, Hunt’s CET model, and some empirical parameters from the literature are used in this work. The exact molten pool geometry is calculated, and expandability and scalability are considered so that further research work can follow. According to the results, the model in this work performs well and achieves a higher accuracy in predicting the single-phase texture of materials in LPBF.

2. Methodology

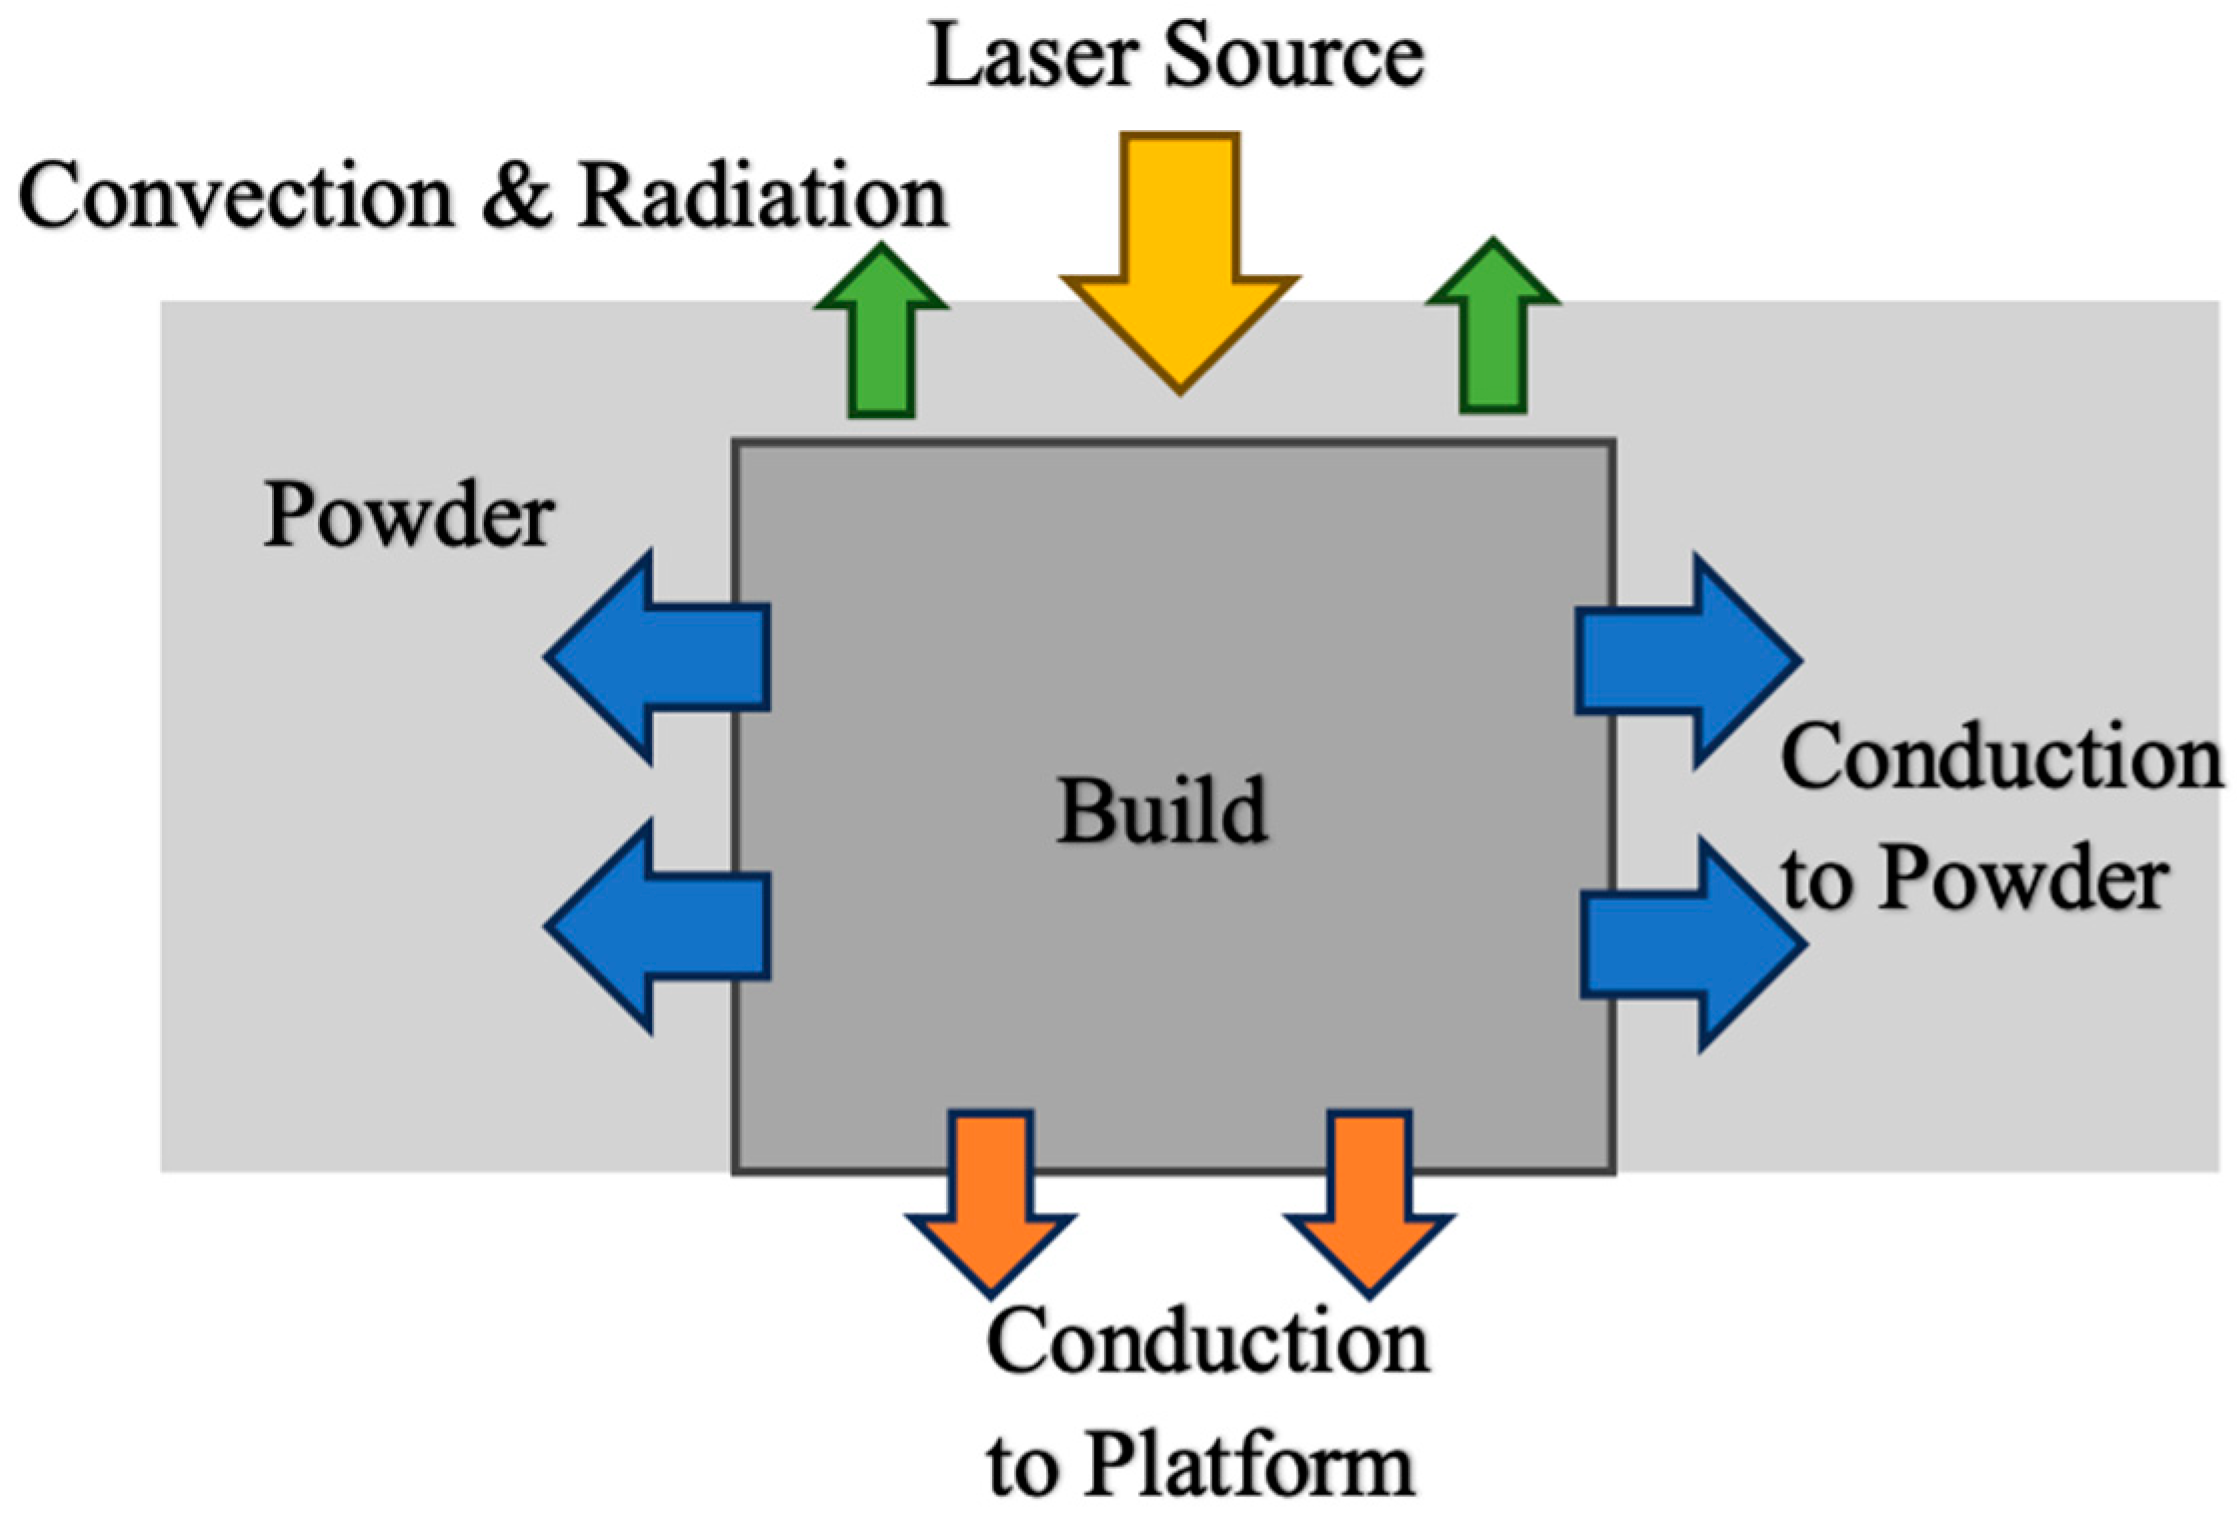
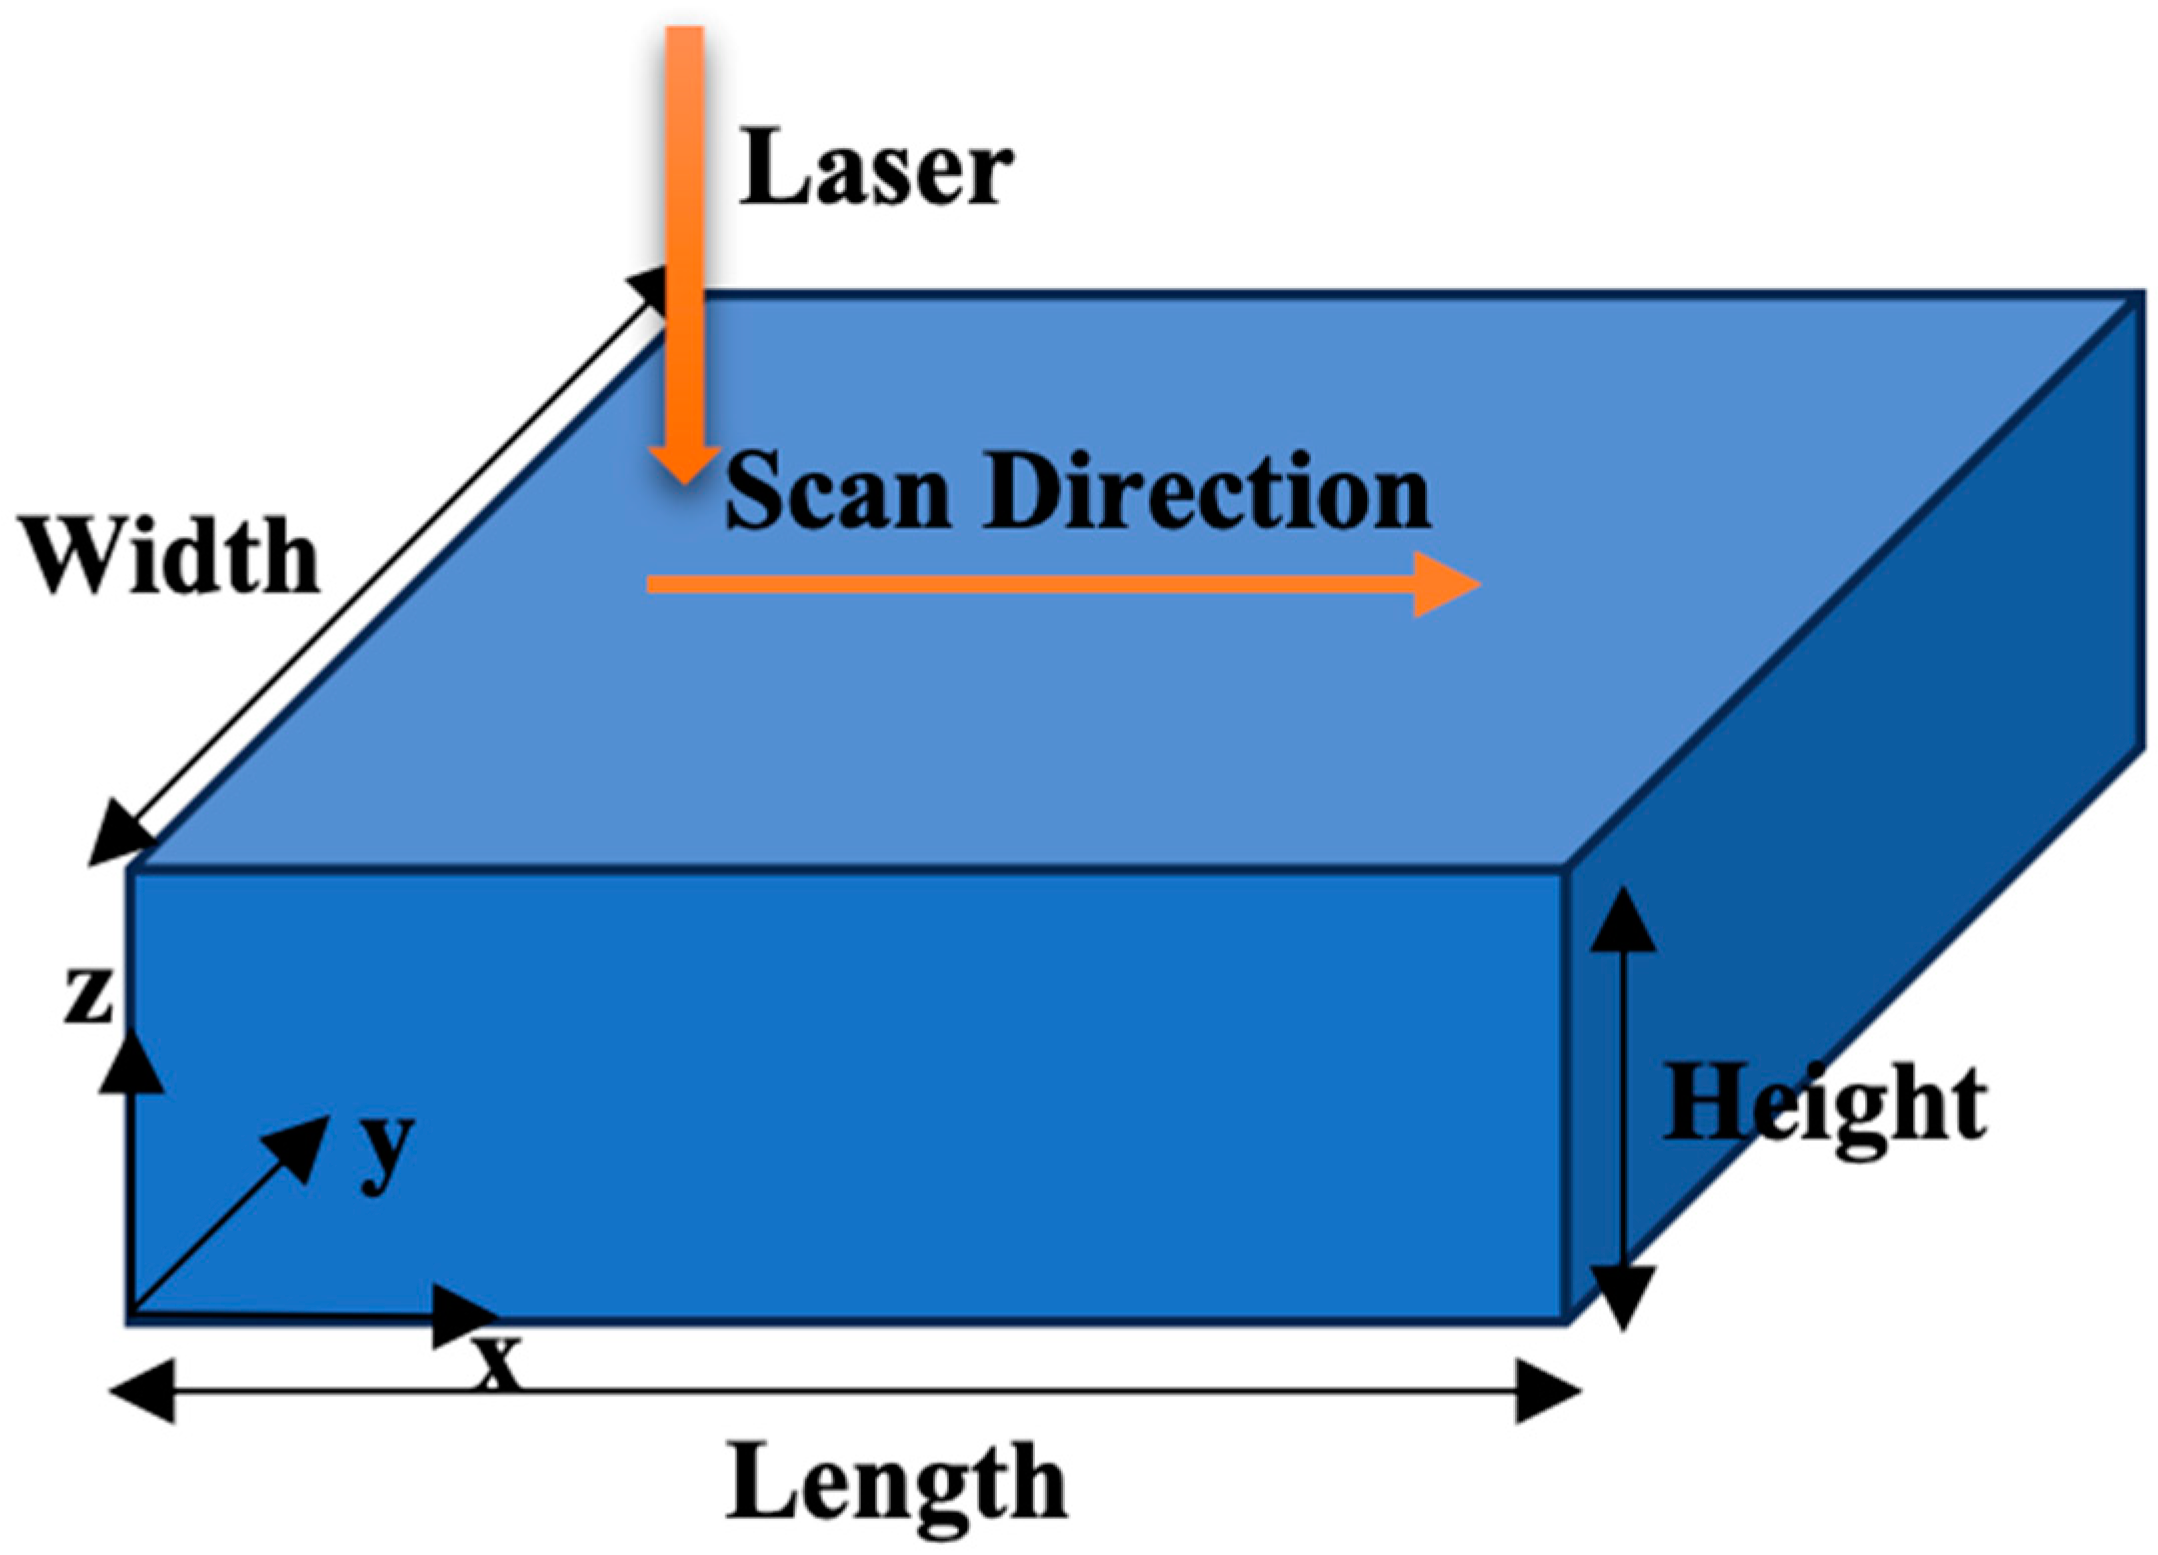
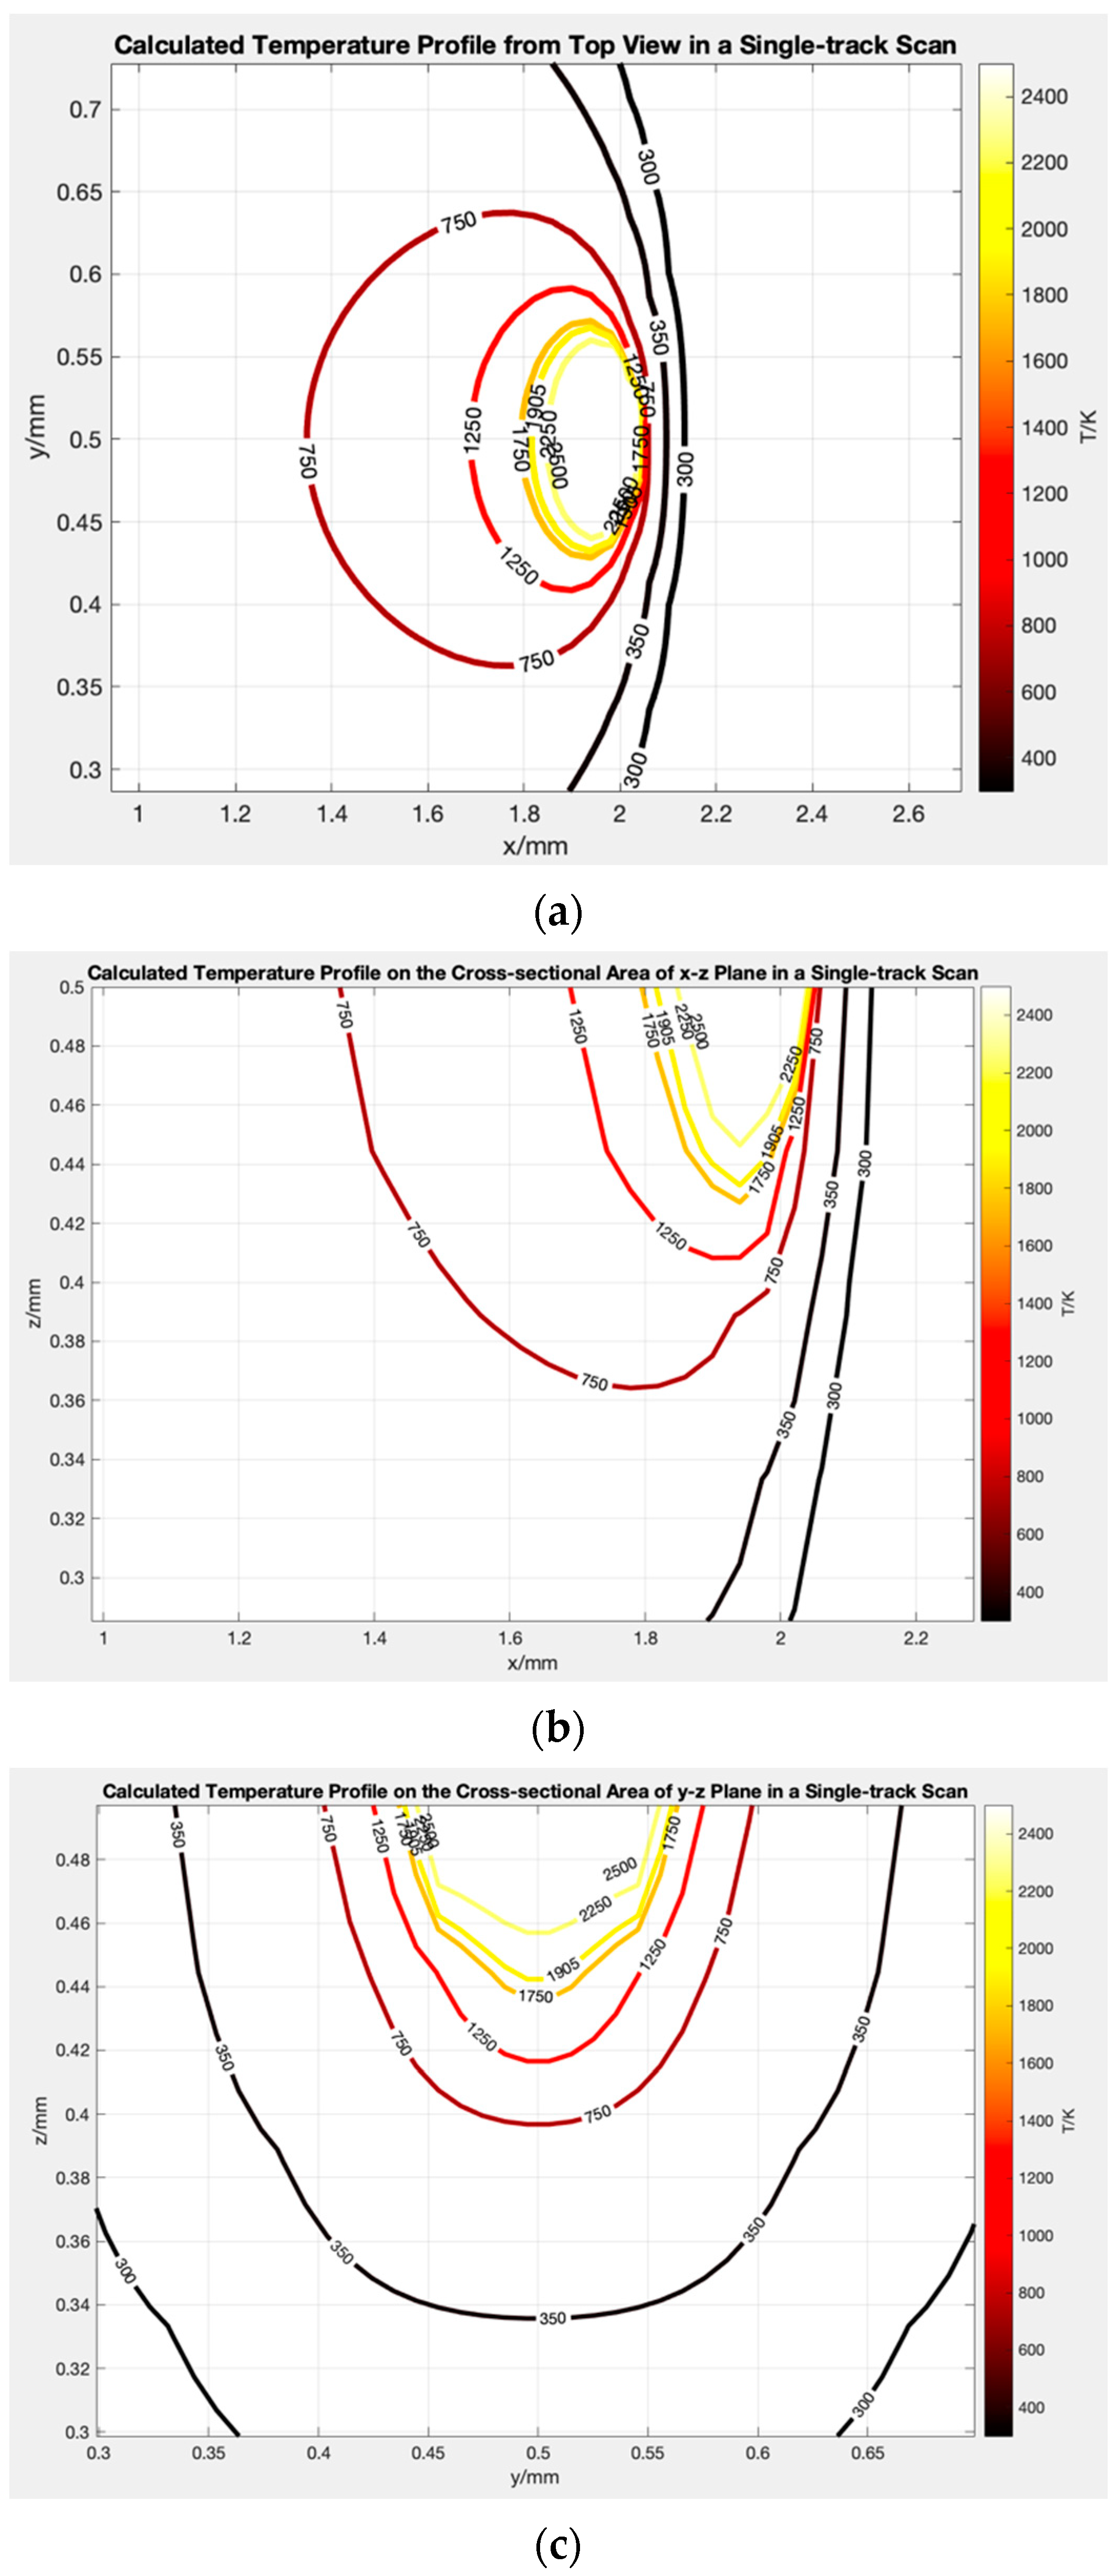
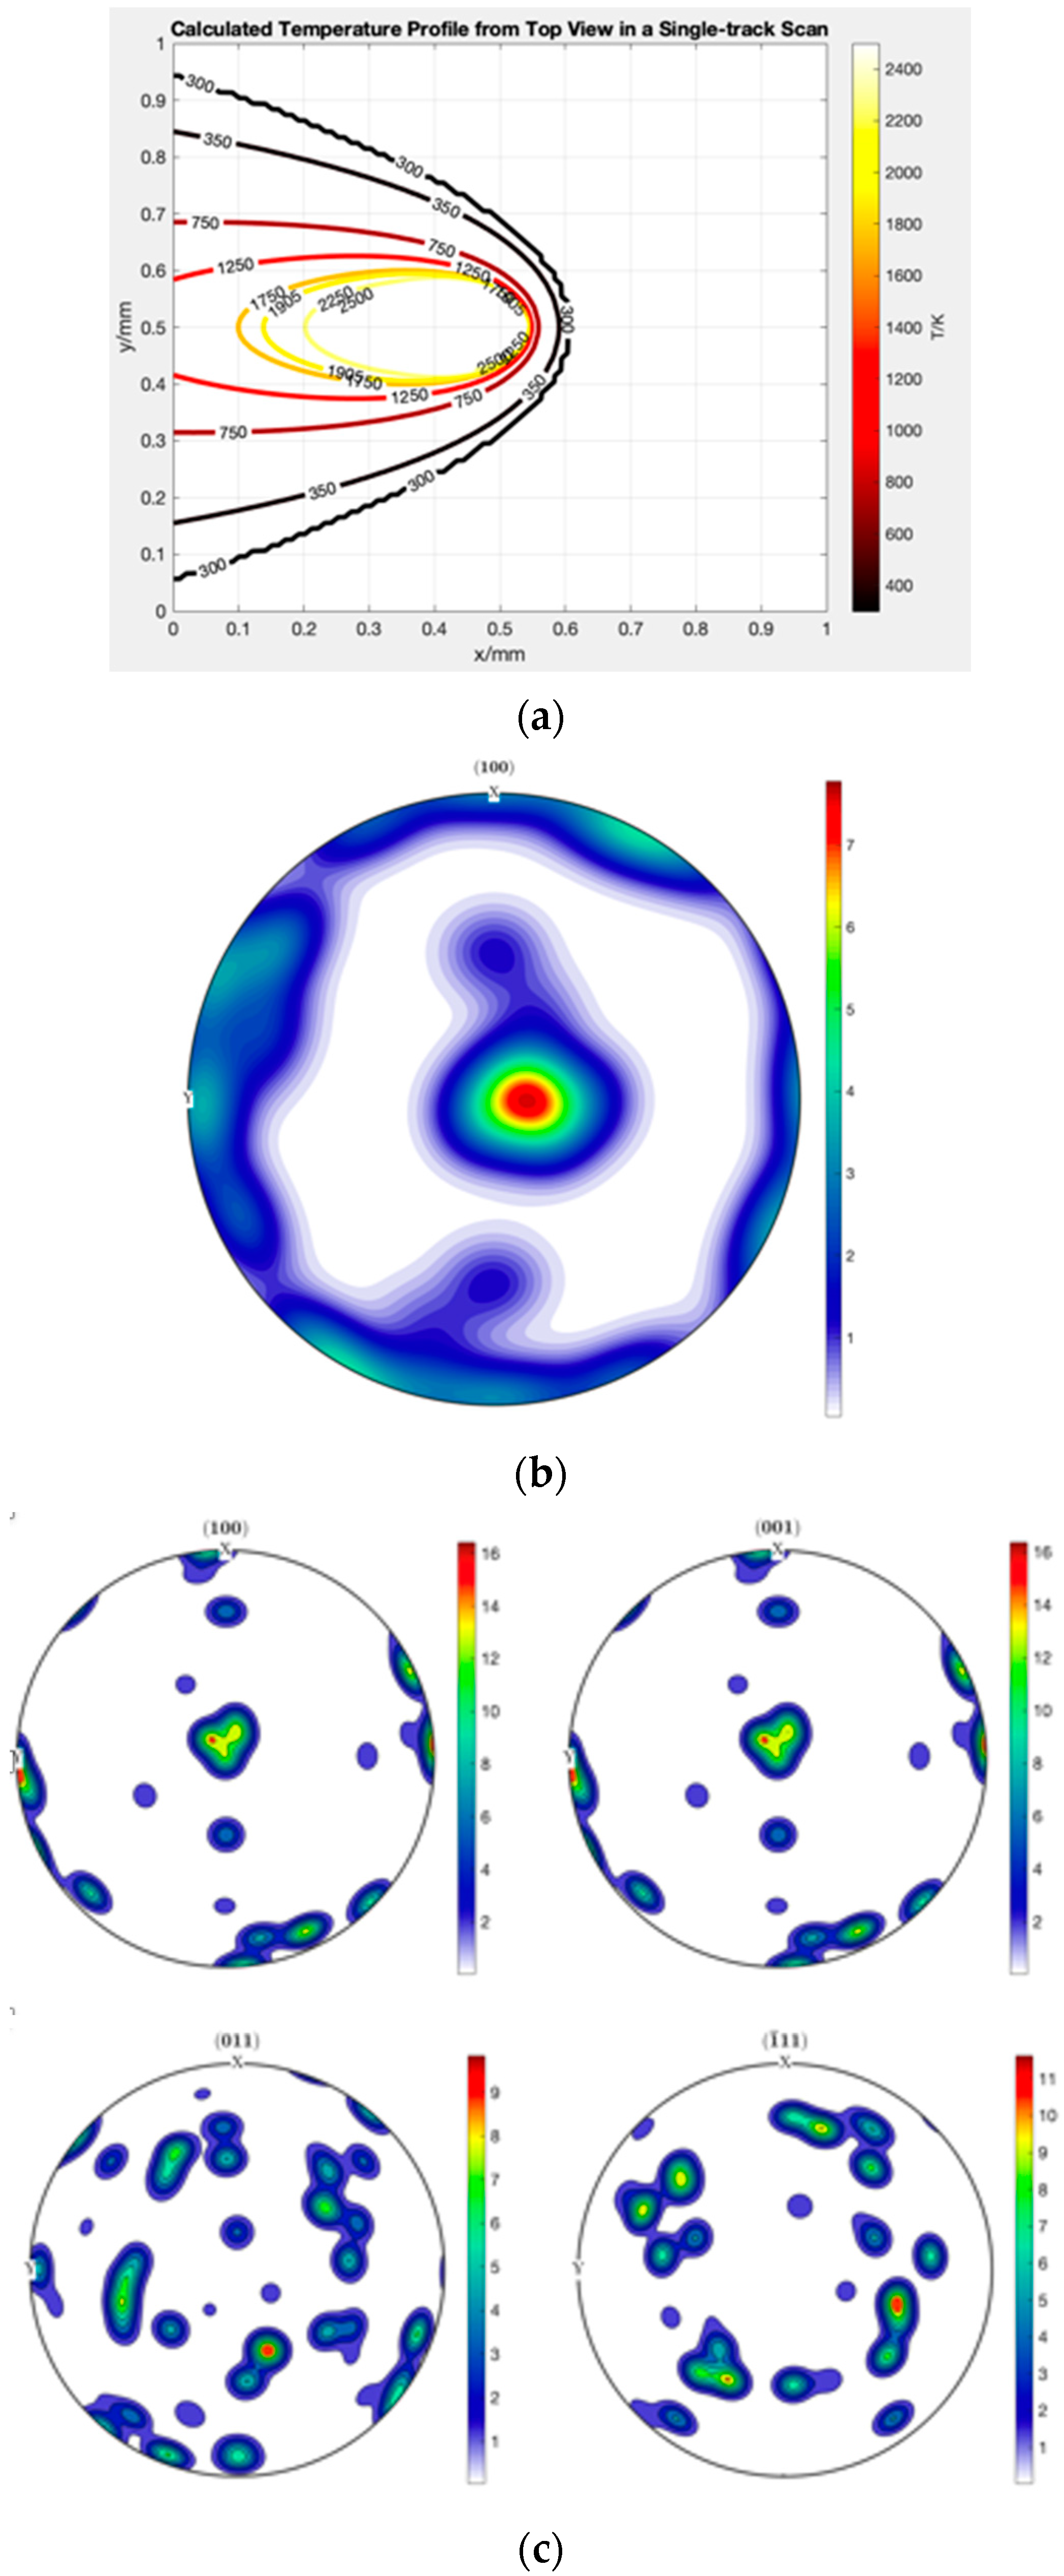
2.1. Thermal Distribution Model and Molten Pool Geometry

This work first utilizes a physics-based analytical model developed by Ning et al. [9] to predict the 3D temperature profile in PBF. In this model, they considered the heat transfer boundary loss caused by heat conduction, heat convection, and heat radiation, which affects the melt pool geometry and thermal gradient. Other scientists have yet to consider this in an analytical modeling context. In actual engineering scenes, heat losses by conduction, convection, and radiation can never be ignored, and thus, this model, with the completed consideration of heat losses, will surpass the previously proposed models.
Figure 1 illustrates heat transfer boundary conditions in a two-dimensional schematical drawing. The boundary faces are discretized into multiple heat sinks with the same area to calculate heat loss. They use a point-moving heat source solution initially developed by Carslaw and Jaeger [10] with the assumption of a three-dimensional semi-infinite body:
T x , y , z = P η 4 π K R exp V R + x 2 κ + T 0
where P is the laser power;  η  is the laser absorption coefficient;  R = ( x x 0 ) 2 + ( x x 0 ) 2 + ( x x 0 ) 2  is the distance from the heat source ( x 0 y 0 z 0 ); V is the laser scanning velocity;  κ  is thermal diffusivity, and it is expressed as  κ = K ρ c ; K is thermal conductivity;  ρ  is density; and c is heat capacity.
As for the heat loss, heat conduction, heat convection, and heat radiation are solved using the following equations, respectively:
Q c o n d = A k p Δ T / R
Q c o n v = A h T T 0
Q r a d = A ε σ ( T 4 T 0 4 )
where  k p  is the thermal conductivity of the powder; h is the heat convection coefficient, ε is emissivity; σ is the Stefan–Boltzmann constant; A is the area of each heat sink on the melt pool surface; and T is temperature that can be estimated using the point-moving heat source solution. The combination of heat input and heat losses results in the 3D temperature distribution expression:
T x , y , z = 1 4 π k R P η exp V R + x 2 κ A h T T 0 + ε σ T 4 T 0 4 + k p T T 0 R + T 0
Figure 2 displays a schematic sketch of the build part that is used to investigate the thermal distribution of PBF and for the purpose of verifying the model. In this research, just the single-track scan strategy is discussed.
Then, with the temperature distribution calculated by the thermal model, the molten pool geometry can be obtained by comparing it to the material melting temperature.

2.2. Single-Phase Texture Model

This study generated a single BCC beta phase texture to represent the liquidus materials of Ti-6Al-4V during melting. Three Euler angles, which define the three rotations needed to transform the lab reference frame to the crystallographic lattice frame for each individual grain in the material, represented the crystallographic orientation. Among various conventions, the Bunge convention was selected to illustrate Euler angles, as Figure 3 shows.
With the temperature distribution profile, the thermal gradient within the molten pool can be calculated by  G = T . The solidification rate for defining grain growth, which is related to the beam velocity and the melt pool shape, is obtained by
R = V c o s θ
where V is the scanning speed and  θ  is the angle between the direction of scanning and the growth direction.
In Hunt’s model, the columnar-to-equiaxed transition is expressed by the  G n / R  ratio. If this ratio is more significant than a specific value  , the solidification is entirely columnar, and dendrite arms will grow from the liquid–solid interface. Kobryn and Semiatin [12] calibrated a solidification map in the G-R space for Ti-6Al-4V experimentally, which was used here. Since the substrate texture plays a vital role in the solidification process and affects the final orientations of materials, its orientations should be considered in detail.
Compared to the single crystal base, which could provide only one identical orientation of seed crystal, the polycrystal base is much closer to industrial reality, so the polycrystal powder substrate with random multiple orientations was employed in this study.
When the solidification area was determined to grow columnar grains, they would grow epitaxially from the seed crystal, and the growing direction of the final dendrite of a specific location point would be determined by maximizing  c o s φ = ( m · G ) / G , where m is the specific crystallographic orientation vector of the seed crystal that gives the maximum  c o s φ  and G is thermal gradient vector at the location. This is based on the fundamental rule of minimizing the energy of the system to be most stabilized. Figure 4 demonstrates the polycrystal base, which provides seed crystals of different orientations with the thermal gradient and melt pool shown.
In addition, if the solidification area was determined to grow equiaxed grains, the texture orientations would grow along the orientation based on the random substrate texture at its location.
While the laser moves in one track behind the melt pool, the liquid solidifies. The solidification process occurs from the bottom to the top. After the first layer scanning is completed, the second layer is built on top of it. Thus, the first layer serves as the new seed crystals for the second layer’s grain growth, which continues layer by layer.
For the step-by-step texture-related calculation algorithm in MATLAB coding, the process is briefly described as follows:
Input constants, process conditions, and materials properties: The temperature model illustrated in the last section generates temperature distributions based on the process and material settings. Then, it comes to the texture model:
  • Input the basic settings of sections  N g r a i n N l a y e r N t r a c k , and  N s e e d , which are the number of sections, grains, layers, tracks set, and columnar/equiaxed transition coefficient nn, with kk taken from the literature [13,14] for the columnar-to-equiaxed transition calculation.
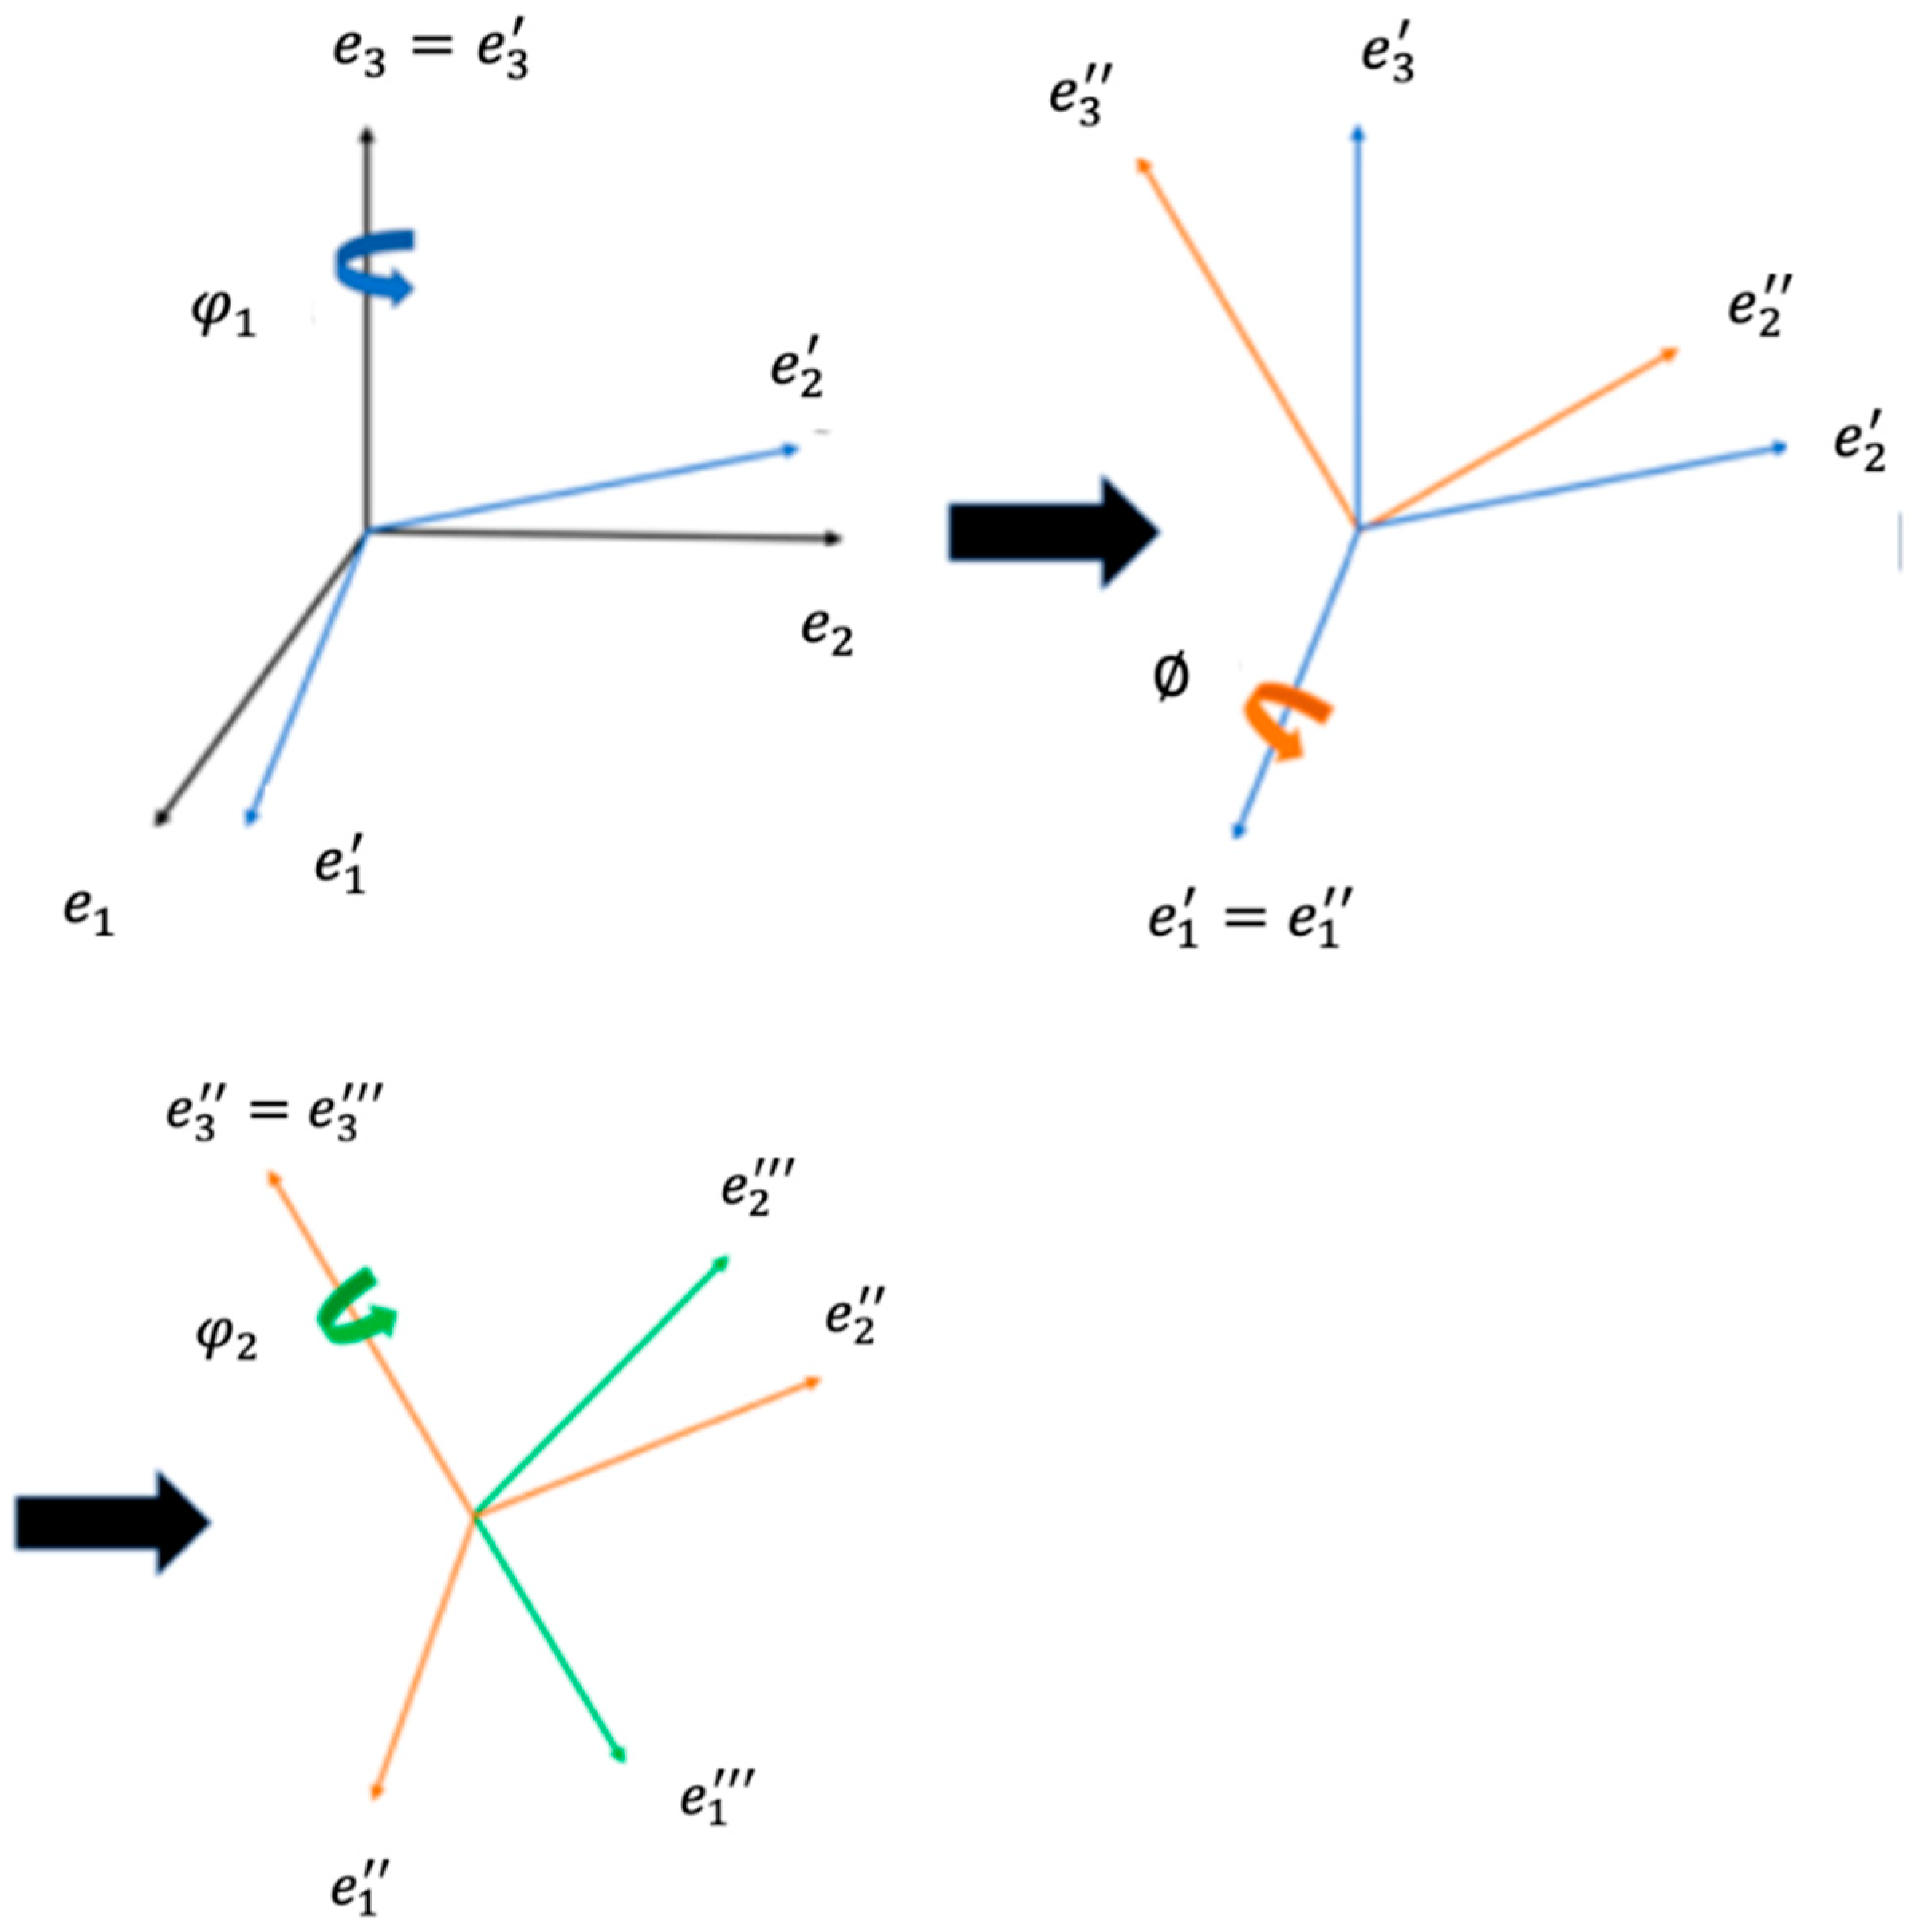
  • Generate/import the random texture of the substrate: randomly generate three Euler angles in the range of [0, 360], [0, 180], and [0, 360] for the  N s e e d , where one can also read files of saved texture (three Euler angles) information.
  • Calculate the accurate melt pool border and record the border: x, y, and z locations.
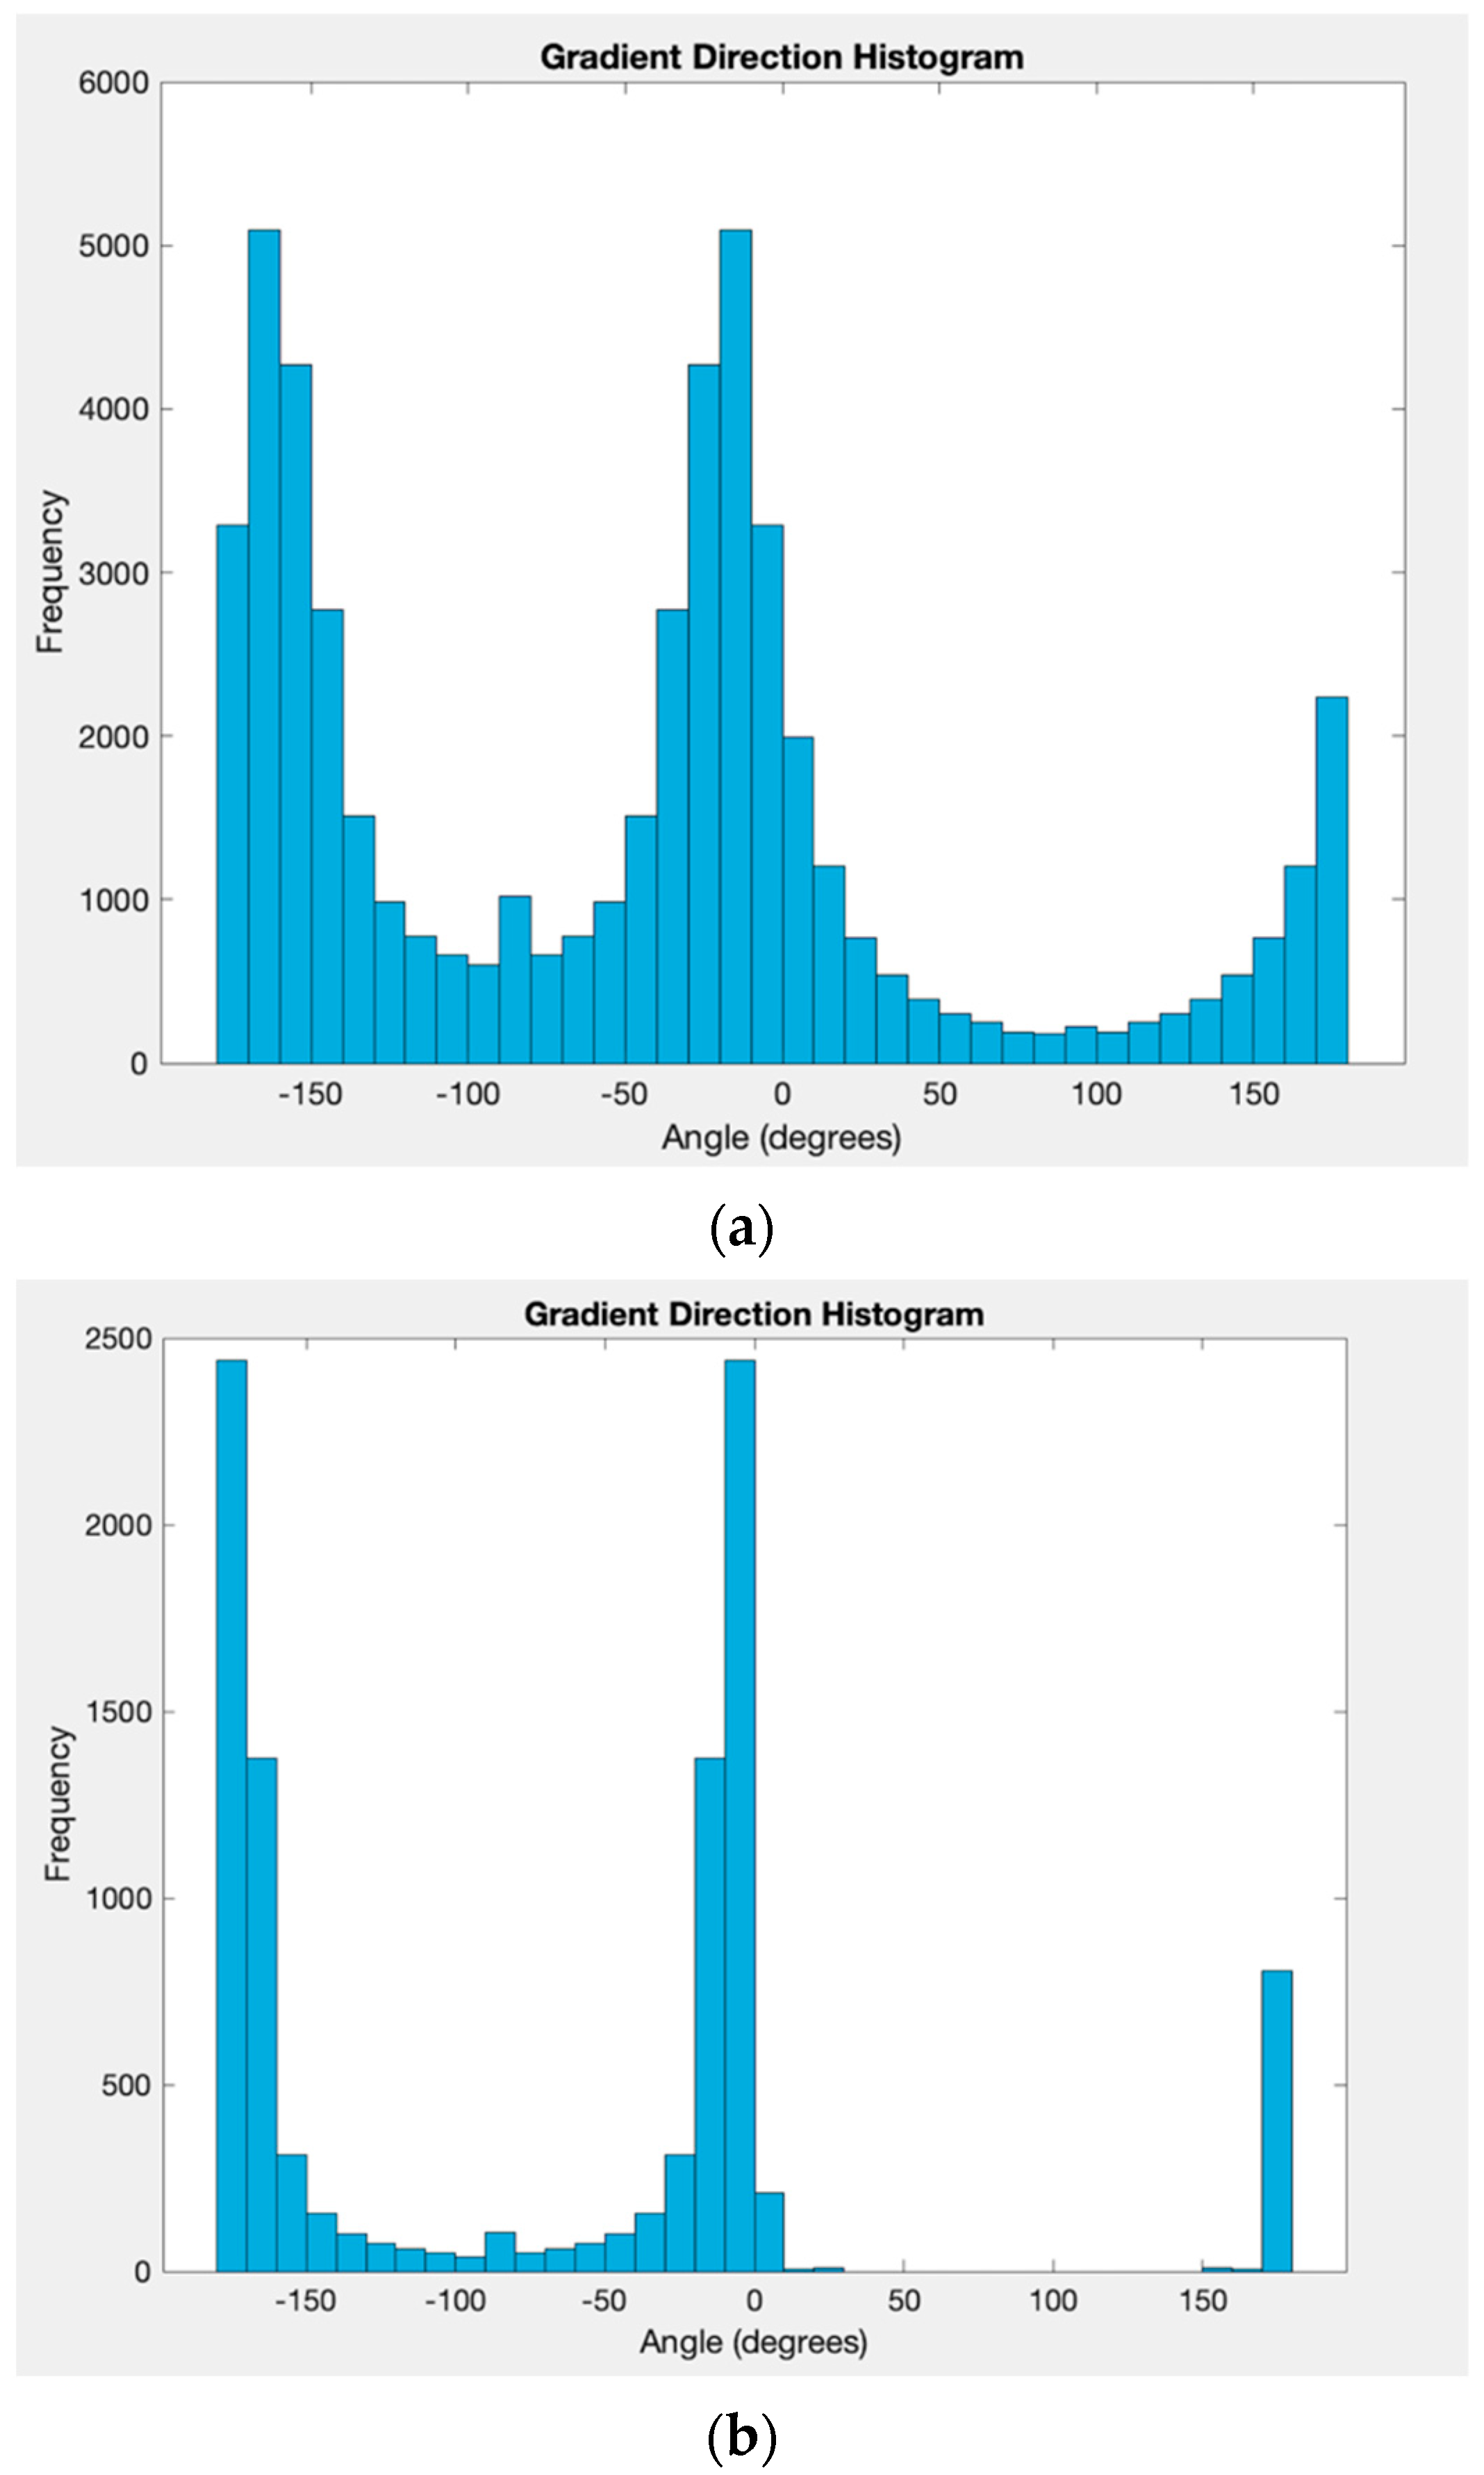
  • Calculate the slope values of the melt pool border with a smoothing method of averaging the slope values of several nearby pixels.
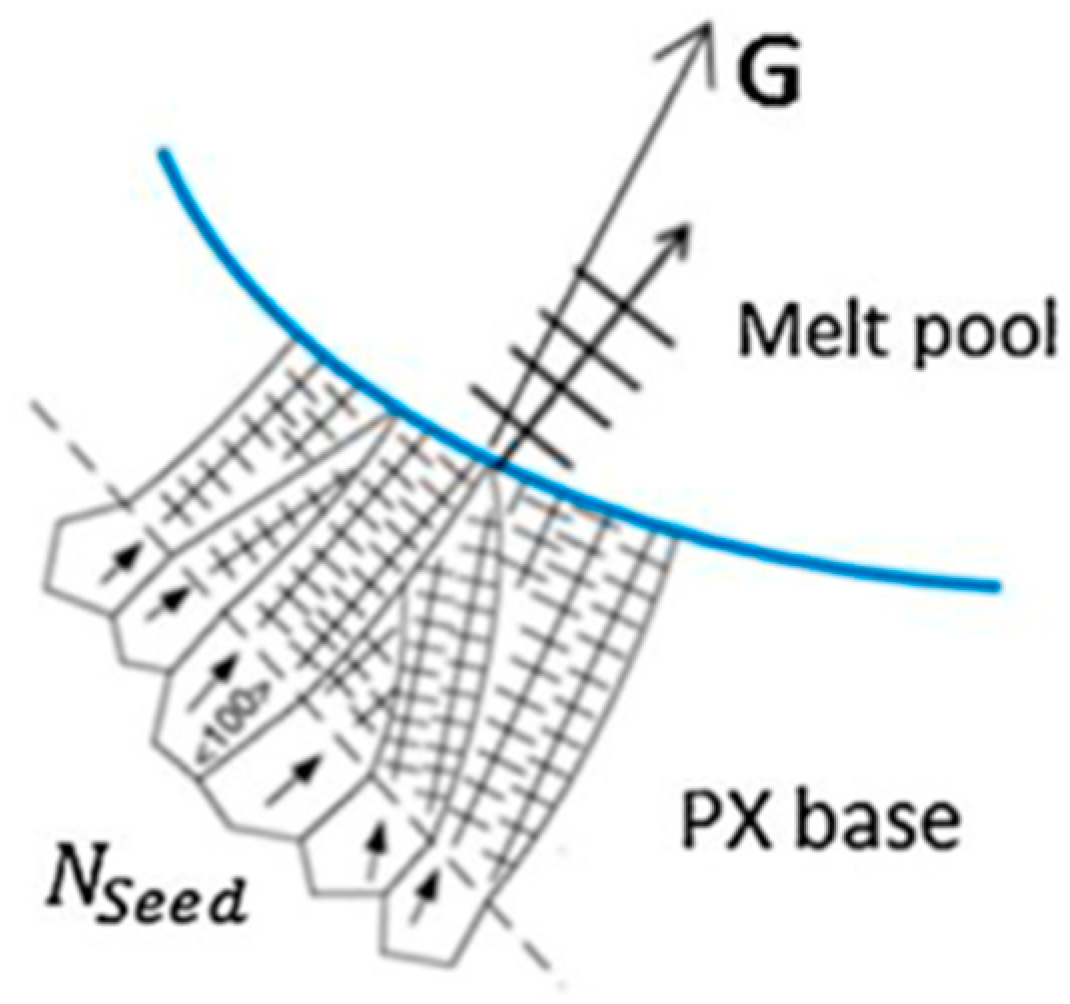
  • Calculate the angle  θ  between the direction of the moving laser source and the growing direction of the solidifying material utilizing the geometric relationship by the smoothing method as well.
  • Then, determine the solidification rate using  R = V c o s θ .
  • The thermal gradient is obtained using temperature distributions and calculating the average thermal gradient in the z-direction.
  • For the texture/Euler angles calculation part, the focus is merely on the molten pool area. Due to the columnar-to-equiaxed transition conditions of  G n / R  ratio with relevant existing transition parameters, the equiaxed and columnar grain areas are determined. If it is an equiaxed grain area, assign it with random Euler angles, and if it is a columnar grain area, select the seed crystal direction with the maximum  c o s φ = ( m · G ) / G . Notice here that the border values and internal points values are calculated separately in the selection structure to avoid bugs and cover all of the points in the molten pool accurately.
  • Store generated texture data in both EBSD data format (8 variables: 3 Euler angles, X-axis location, Y-axis location, layer, section, and phase (there is only the  β  phase here)) and XRD data format (4 variables: 3 Euler angles and weight).
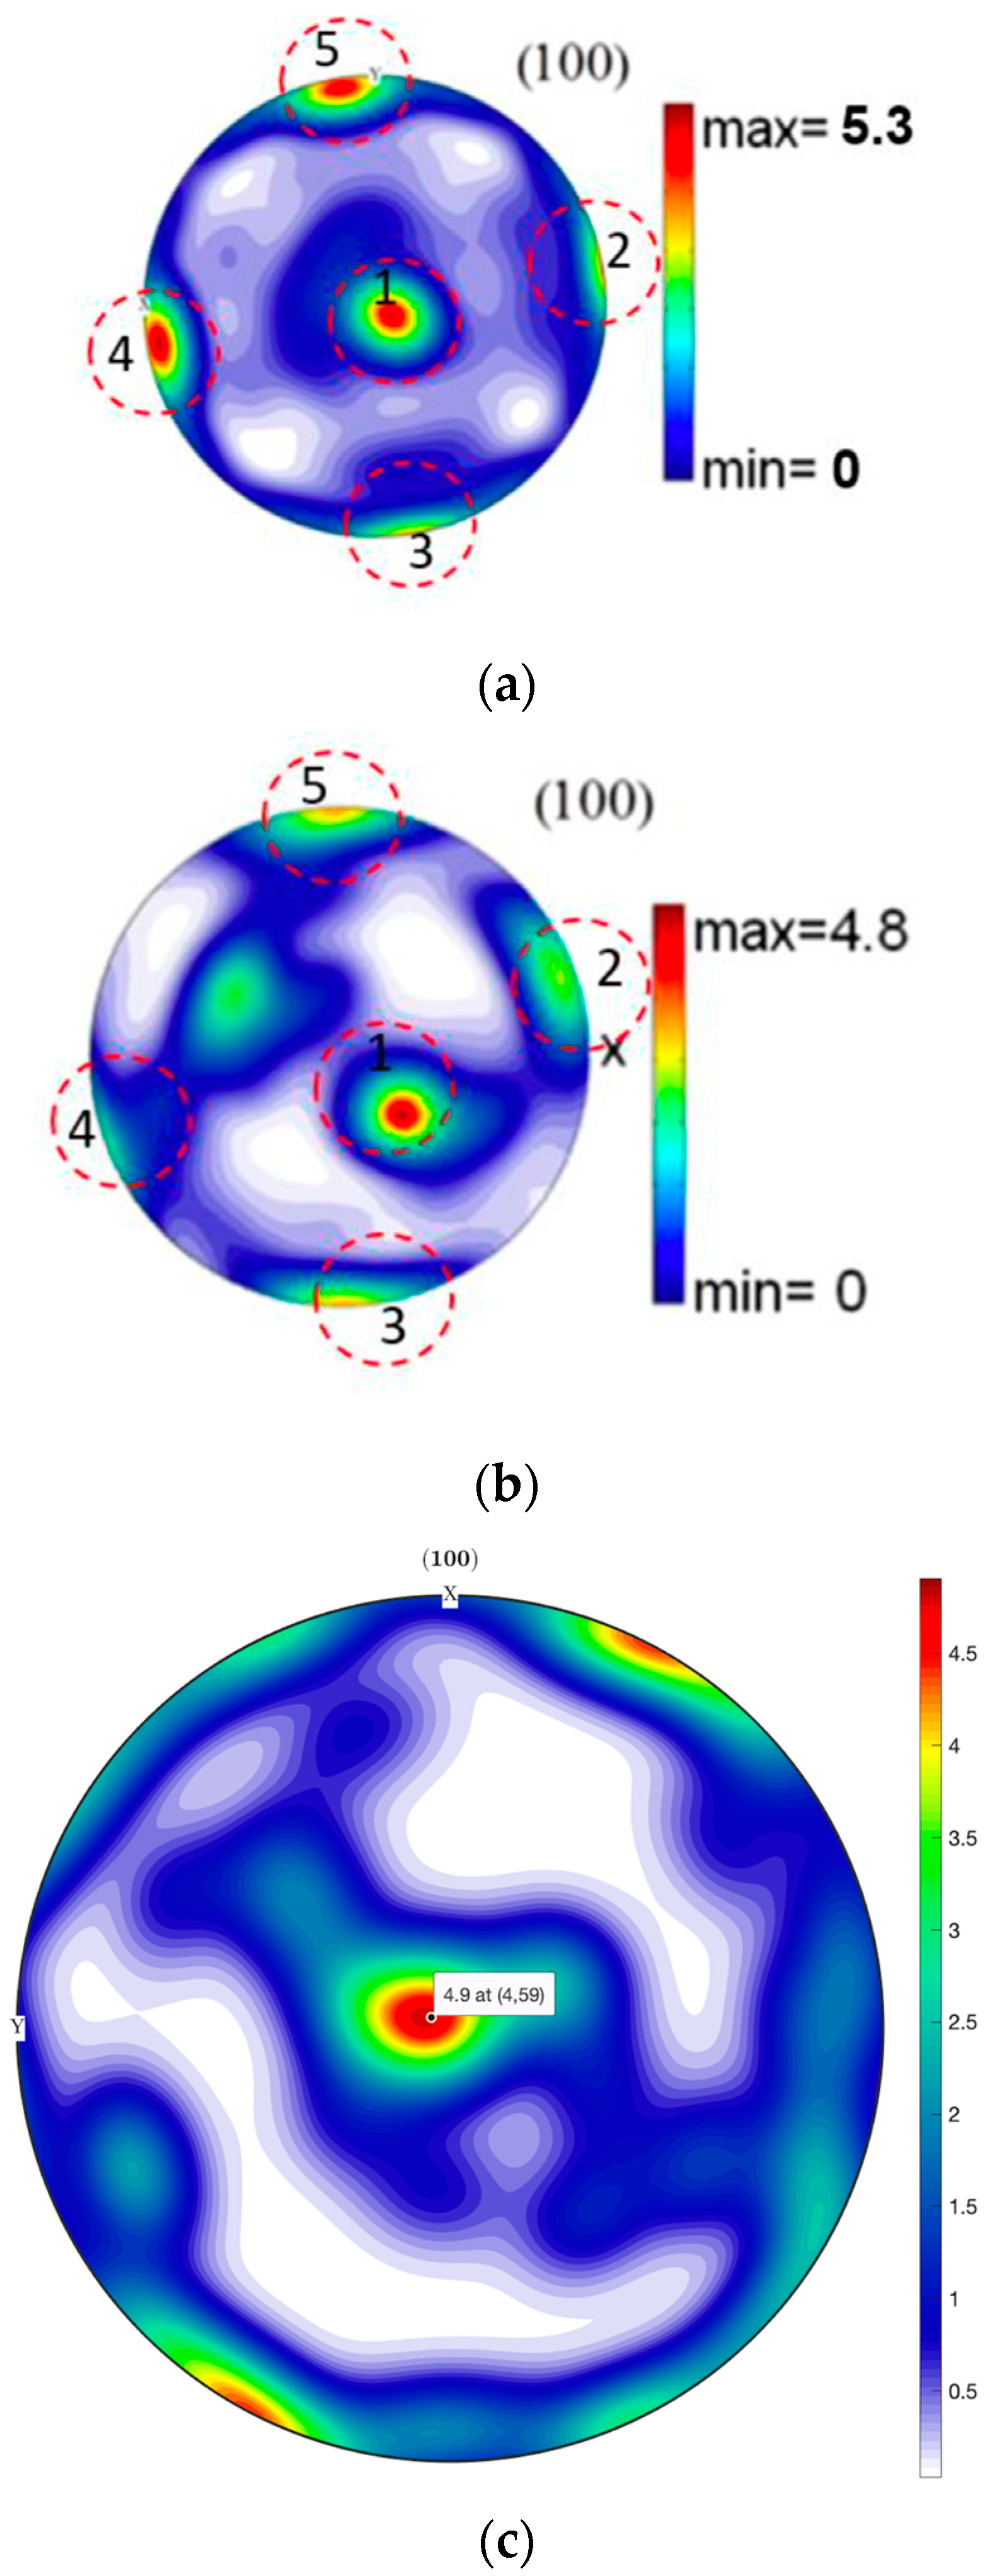
  • Plot pole figures: write the data to CSV files, define file paths, input crystal symmetry, specimen symmetry, etc. Then, use the MTEX toolbox as well as relevant figure plot codes to plot the pole figures.

3. Results and Discussion

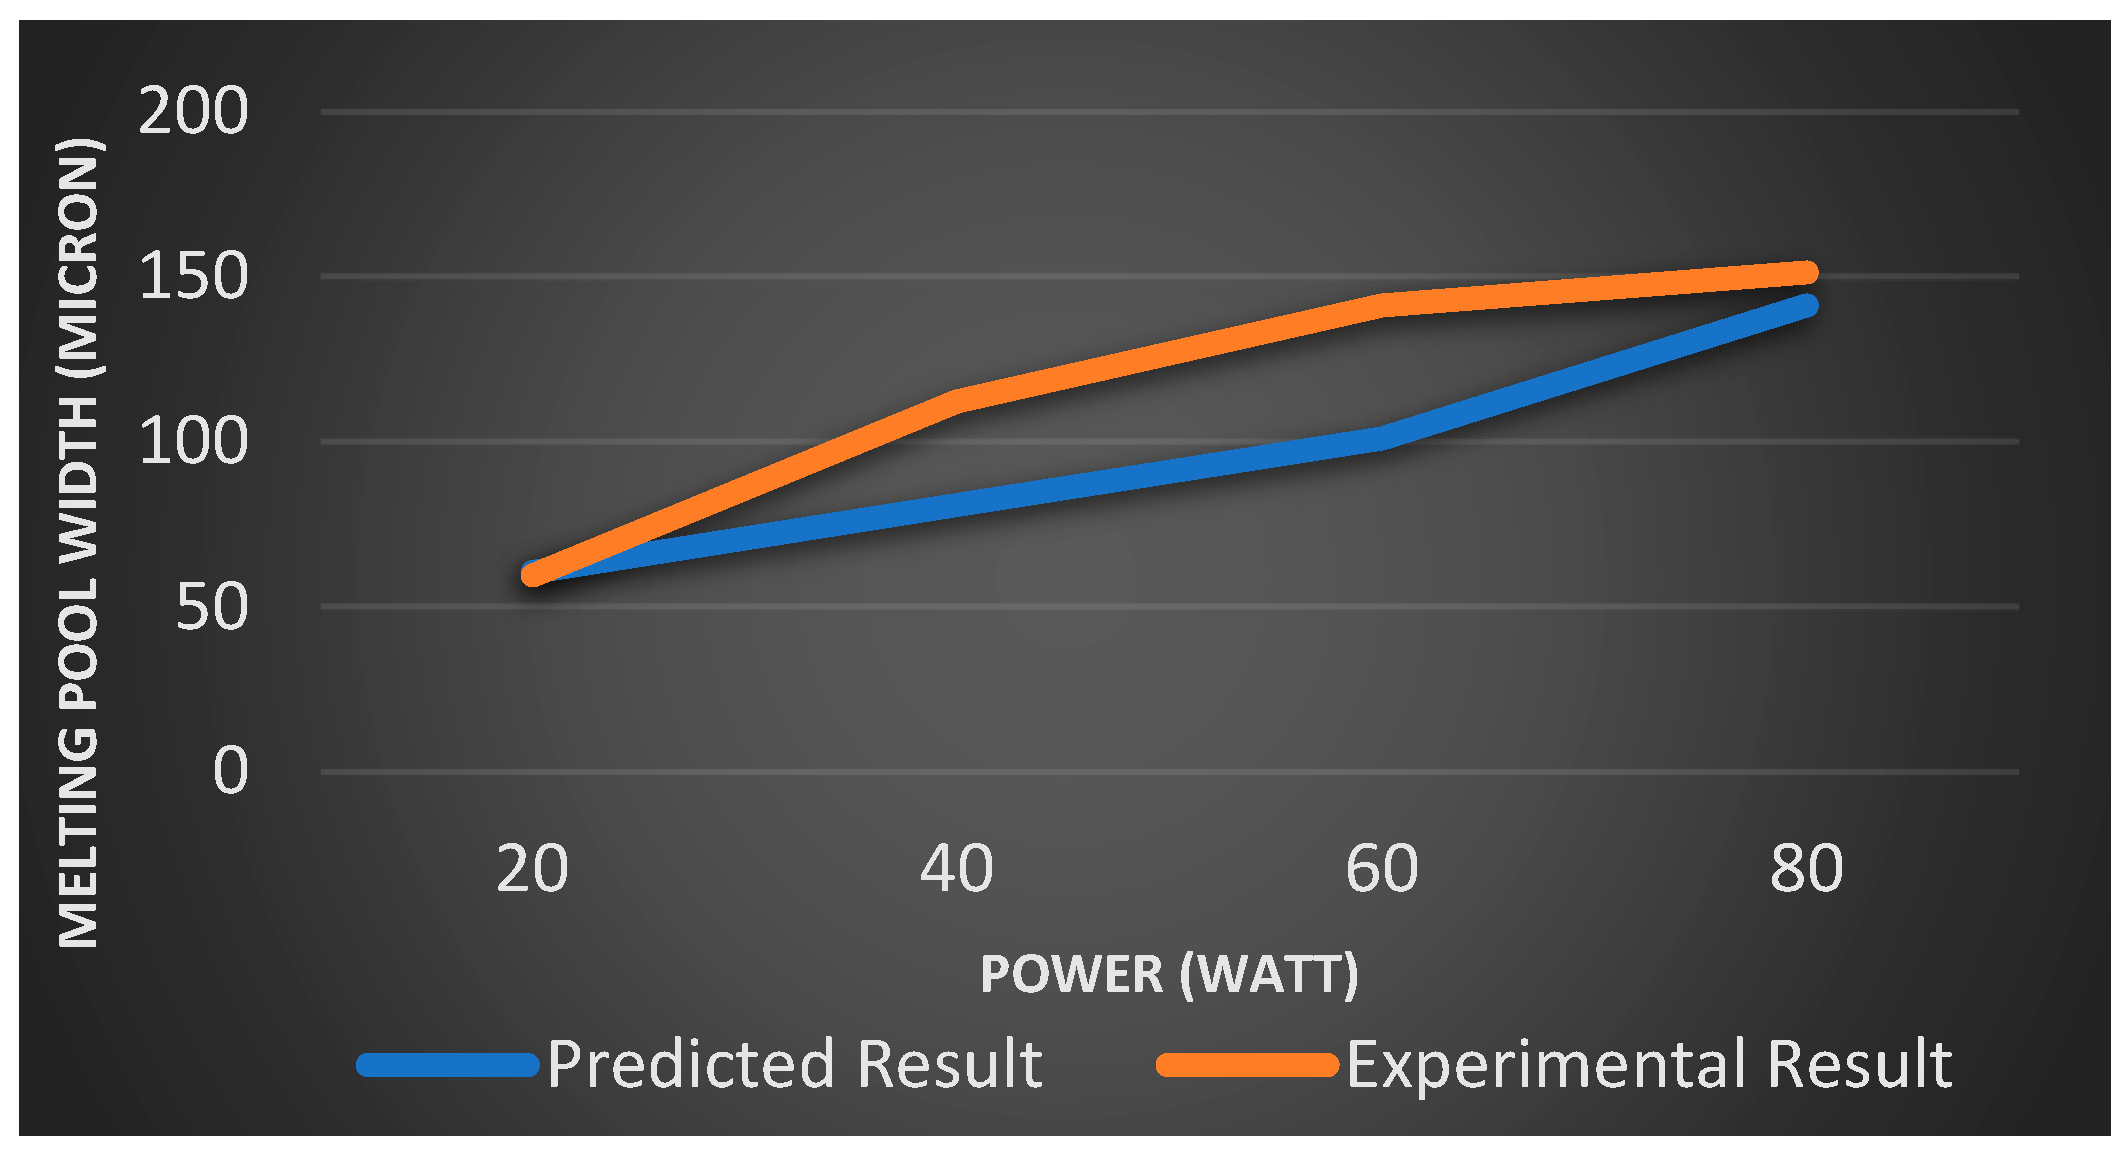
3.1. Thermal Distribution Model and Molten Pool Geometry

The heating process of LPBF was simulated by the proposed analytical model. The cooling effects due to heat loss at product boundaries were considered in the thermal simulation. The powder and substrate materials used in this study were Ti-6Al-4V. Table 1 shows the physical and thermal properties of these materials as well as the coefficient of laser power absorption [13,14,15]. Many process parameters in LPBF can affect the real laser power absorptivity, such as power, speed, size of laser beam, properties of powder material, etc. The absorptivity used in the thermal simulation was adopted from [16]. The distribution of temperature in the build was predicted through the thermal simulation.
To show the ability and accuracy of the proposed thermal model, a series of thermal simulations were conducted and validated against experimental measurements. The build part in these simulations is a rectangular cuboid with dimensions of 4 mm × 1 mm × 0.5 mm. The main process parameters used in these simulations are shown in Table 2. The heat sinks on each surface are all set at a value of 9. All heat sinks should add up to the boundary heat loss. Figure 5 shows examples of the calculated temperature profiles. By comparing the obtained temperature profiles with the melting point of Ti-6Al-4V, the size and shape of molten pools were then estimated. The predicted molten pool dimensions from these simulations were compared with the experimentally measured molten pool size, as shown in Figure 6. It can be observed that the predictions agree well with the experimental data, which demonstrates the reliability of the thermal model used in this work. The minor deviation should be induced by the assumption of a constant coefficient of laser absorption and the use of solid material properties. It should be noted that the experimental data of molten pool size were measured by Fu et al. in [17] through an optical microscope.

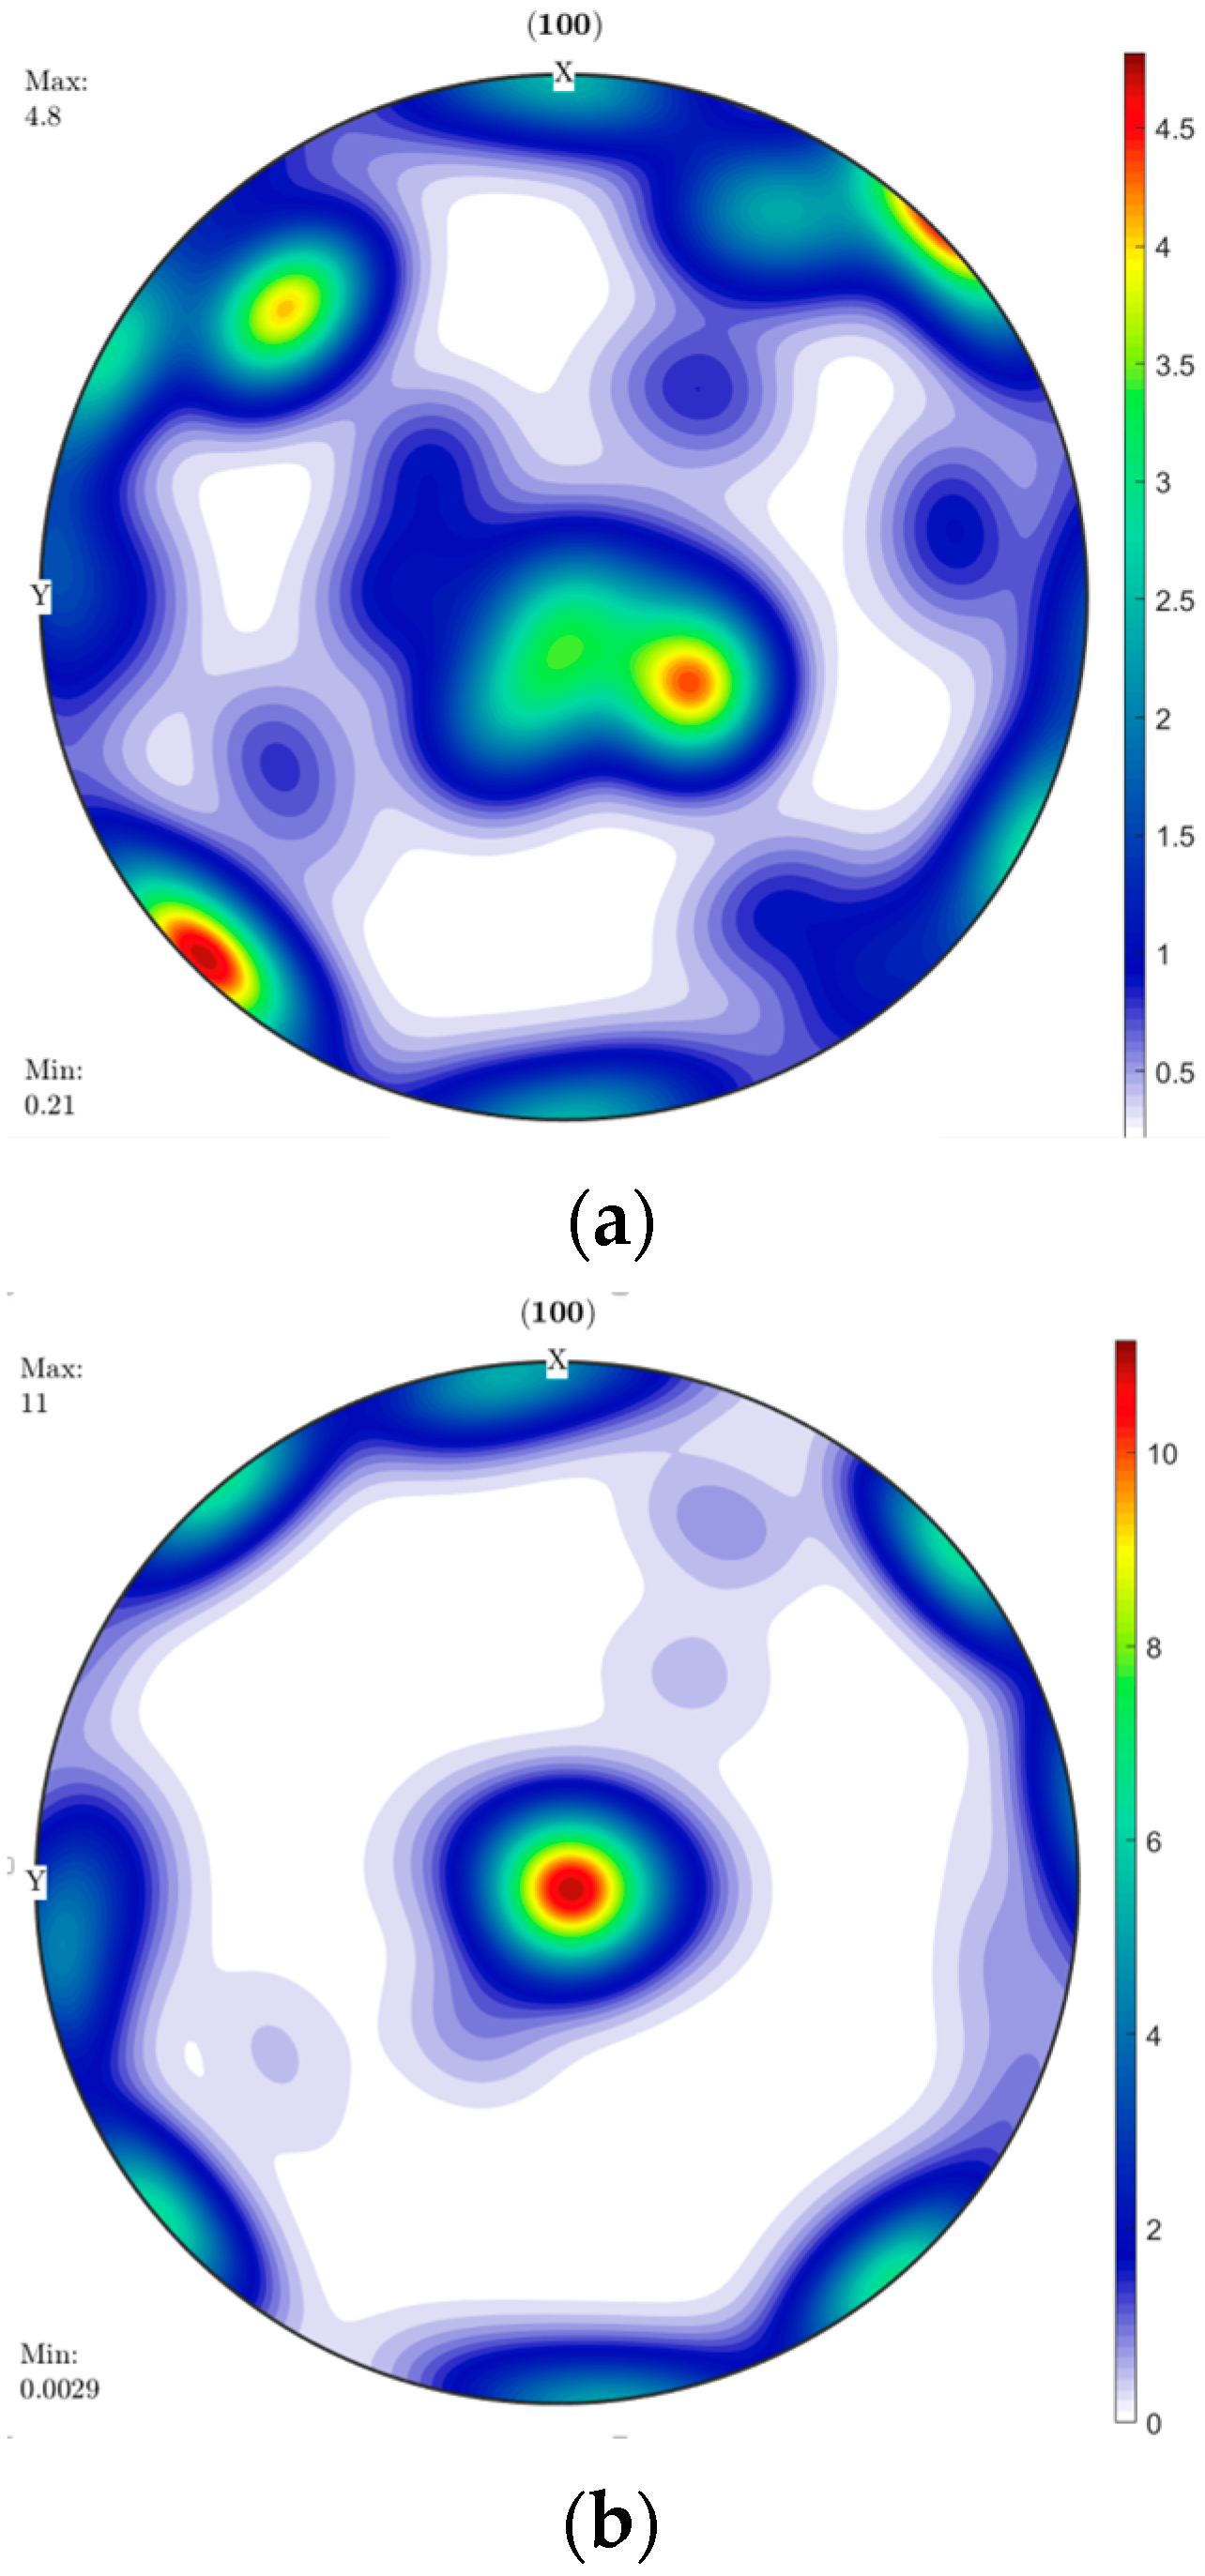
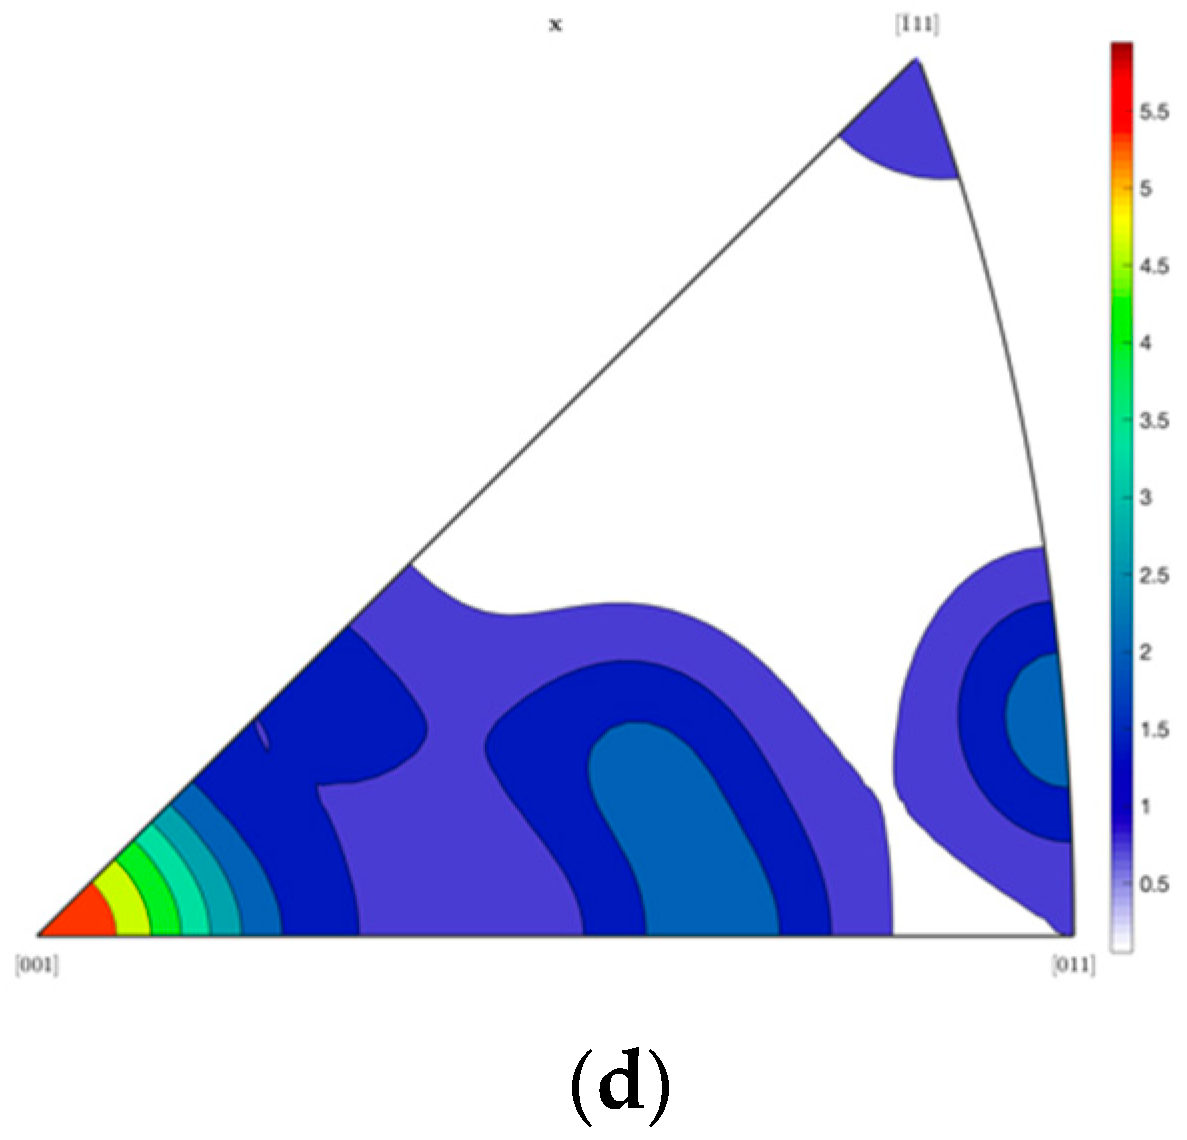
3.2. Single-Phase Texture Model

To verify the texture model, the processing parameters and build setting parameters are adopted from Mahdavi’s work [6]:  P = 157  W and  V = 225  mm/s; the build settings for the texture generation of Ti-6Al-4V in LPBF are listed in Table 3.
Figure 7a is the simulated texture of the  β  phase by Mahdavi et al., Figure 7b is the experimental result under the same conditions, and Figure 7c is the simulated texture by the work. As shown in Figure 7, the beta phase exture results have a similar pattern. The texture intensity in the current simulation is 4.9, while the past simulation is 5.3, much closer to the experimental result of 4.8. As for the texture pattern, all of the three (100) patterns have a high-intensity peak a little off of the <100> direction, which illustrates that most grains are oriented along the <100> direction. The comparison shows that the updated simulation result matches the experimental result with more accuracy than the peak locations and is better than the previous simulation. The differences between them should be because the current method accurately considers the whole molten area without including any meaningless zones’ texture outside. At the same time, the past simulation and experimental result took all of the location points into account when calculating the texture intensity. Thus, it makes this method more accurate. In addition, the experiment contains both the  β  phase and  α  phase after the liquid phase solidifies, so this might be the reason for the slight difference between the simulation outcome presented in this research and the experimental result. In addition, the implementation of a step-by-step algorithm including a thermal model without any missing heat loss due to conduction, convection, or radiation should also be a reason for the more accurate modeling.

3.3. Discussion about the Influence of Laser Power and Scanning Velocity on Texture

J. Liu et al. [5] state that the variation of the processing parameters of power and the scanning velocity only affects the magnitude but not the direction, and since only the thermal gradient direction affects the selection of seed crystals, the power and scanning velocity will not have an influence on texture. However, the power and the scanning velocity do have an effect on the texture. The most crucial problem that they should have addressed was the temperature distribution since they just used Rosenthal’s solution without fully considering the heat loss, including heat conduction, convection, and radiation at the build boundaries, which are all associated with temperature according to their equations. Hence, the processing parameters do affect the thermal gradients both in their magnitudes and their directions and in the further calculation of texture. To provide more evidence to assist this statement, some running results with different processing parameters based on the considerate thermal model and texture model are shown below in Figure 8 and Figure 9. Figure 8a is the simulated texture of (a) 300 W, 0.1 m/s, and (b) 700 W, 1 m/s. As can be seen in the figures, there is a large difference between them. In Figure 8a, the <100> intensity peak is not even the maximum value, and there are two other intensity spots around the sphere. In Figure 8b, the only intensity peak appears in the sphere’s center with the maximum value nearly without any other spots on the surroundings. These show the differences in texture with different processing parameters, and the processing parameters can affect the texture. From another perspective, after the thermal gradients in the X, Y, and Z directions are received, the angle between them can be calculated and shown in the histogram format. Figure 9 indeed shows the simulated thermal gradients calculated in the X and Y directions, which clearly demonstrates the different distributions of thermal gradient angles in these two situations. This also provides evidence opposing their conclusion and supports the point that processing parameters such as laser power and scanning velocity will definitely affect the thermal gradient and the following texture; in other words, this work can also be considered an advancement, developing their previous single-phase texture model since they stated their flaw in heat transfer considerations, causing deviations in experimental data.

3.4. Scalability of the Part Size of the Thermal Model and Texture Model

In addition to the accuracy performance, this work has also examined scalability and expandability in almost all aspects that can be thought of (besides the processing parameters and materials properties)—part size, pole figures of different faces, multi-phase textures, substrate with various textures, multi-tracks, multi-layers, separate hatching space, etc. In the previous sections, the part size (length, width, and height) was set as 4 mm, 1 mm, and 0.5 mm. In fact, in the modes of this work, they can be substituted for various sizes, and at this time, the part size is changed to 1 mm, 1 mm, and 0.1 mm, keeping other material properties and processing parameters unchanged. The related characterizations are demonstrated below in Figure 10, including temperature distribution, pole figures, and inverse pole figures of different faces. Thus, in future studies based on this work, it is possible to discuss other performances under conditions of varying part sizes, scanning strategies, processing parameters, material properties, texture in different views, etc. As one of the challenges in relevant industries, the parts manufactured by LPBF are usually small, and it can become challenging when it comes to the scale of several meters. Therefore, with this beneficial feature of scalability, the approach proposed would also be of great assistance when the additively manufactured parts scale to larger sizes.

3.5. Discussion about Randomly Generated Texture

Due to the steps dealing with the randomly generated texture of substrates in the texture model and the generated equiaxed grain texture, this work creatively moved the generation of relevant random variables outside of the main algorithm in the analytical model. It saved the arbitrary texture data files for repeated usage compared to the previous work. In this way, by controlling variables, researchers can investigate the effect of other factors, including material properties or relationships, such as that between grain size and texture with stable equiaxed and substrate texture, even if they are “randomly” assigned. The factor of the variations in the initial texture of the substrate and the generated equiaxed grain texture causing the inaccuracy of simulated results is entirely excluded; thus, the result and conclusions become more convincing in this work.

4. Conclusions

In this work, a quantitative analytical approach linking the microstructure and process parameters is developed. The thermal model in LPBF metal additive manufacturing is updated with heat loss, including heat conduction, heat convection, and heat radiation, which brings the temperature distribution much closer to reality. The molten pool geometry calculated based on the thermal model is used to verify this model. Then, the received temperature distribution serves as the input to the single-phase texture model. In the following texture model, the single-phase materials’ (Ti-6Al-4V) texture orientations represented by three Euler angles and the single-phase texture intensity are predicted and verified by comparing with past simulated work and experimental results. Better agreement is shown by using models in this work to perform the simulation as opposed to Mahdavi’s analytical model [6] and J. Liu et al.’s [5] result. The thermal model utilizes the point heat source model developed by Carslaw et al. as heat input and heat loss sources as a combination. According to Hunt’s model, the single-phase texture model is an analytical semi-empirical model with columnar-to-equiaxed transition conditions and past empirical parameter data of specific materials and physical rules, such as minimizing system energy. Compared to methods such as FEM and experimental approaches, this analytical model demonstrates the advantages of time–cost-effectiveness with high accuracy. Its predictability and higher accuracy have been verified. Moreover, this model is scalable and expandable, which has been discussed in Section 3.
By providing accurate thermal distribution and texture orientations in a time-efficient analytical approach with excellent expandability and scalability, this work paves a solid foundation for further research on multi-phase texture model building with a more authentic simulation of reality, which is beneficial to academic study and industrial applications. In addition, with this accurate single-phase texture model, texture-affected material properties could be investigated in further research.

Author Contributions

Conceptualization, W.H. and S.Y.L.; methodology, W.H. and S.Y.L.; software, W.H.; validation, W.H.; formal analysis, W.H.; investigation, W.H.; resources, W.H. and S.Y.L.; data curation, W.H.; writing—original draft, W.H.; writing—review and editing, W.H., S.Y.L., W.W., J.N. and H.G.; visualization, W.H.; supervision, S.Y.L. and H.G.; project administration, W.H., S.Y.L. and H.G.; funding acquisition, S.Y.L. and H.G. All authors have read and agreed to the published version of the manuscript.

Funding

The authors acknowledge the funding support of this work by Boeing Company.

Data Availability Statement

Data are contained within the article.

Conflicts of Interest

The authors declare that this study received funding from Boeing company. The funder was not involved in the study design, collection, analysis, interpretation of data; the writing of this article; or the decision to submit it for publication.

References

  1. DebRoy, T.; Wei, H.; Zuback, J.; Mukherjee, T.; Elmer, J.; Milewski, J.; Beese, A.M.; Wilson-Heid, A.d.; De, A.; Zhang, W. Additive manufacturing of metallic components–process, structure and properties. Prog. Mater. Sci. 2018, 92, 112–224. [Google Scholar] [CrossRef]
  2. Hunt, J.D. Steady state columnar and equiaxed growth of dendrites and eutectic. Mater. Sci. Eng. 1984, 65, 75–83. [Google Scholar] [CrossRef]
  3. Gockel, J.; Beuth, J.; Taminger, K. Integrated control of solidification microstructure and melt pool dimensions in electron beam wire feed additive manufacturing of Ti-6Al-4 V. Addit. Manuf. 2014, 1–4, 119–126. [Google Scholar] [CrossRef]
  4. Wei, H.L.; Elmer, J.W.; DebRoy, T. Origin of grain orientation during solidification of an aluminum alloy. Acta Mater. 2016, 115, 123–131. [Google Scholar] [CrossRef]
  5. Liu, J.; To, A.C. Quantitative texture prediction of epitaxial columnar grains in additive manufacturing using selective laser melting. Addit. Manuf. 2017, 16, 58–64. [Google Scholar] [CrossRef]
  6. Mahdavi, M. Materials-Affected Manufacturing: Simulation of the Crystallographic Texture, Microstructure, and Inelastic Properties of Additively Manufactured Polycrystalline Materials. Ph.D. Thesis, Georgia Institute of Technology, Atlanta, GA, USA, 2021. [Google Scholar]
  7. Wei, S.; Lau, K.B.; Lee, J.J.; Wei, F.; Teh, W.H.; Zhang, B.; Tan, C.C.; Wang, P.; Ramamurty, U. Selective laser melting of Fe–Al alloys with simultaneous gradients in composition and microstructure. Mater. Sci. Eng. A 2021, 821, 141608. [Google Scholar] [CrossRef]
  8. Zhang, D.; Qiu, D.; Gibson, M.A.; Zheng, Y.; Fraser, H.L.; StJohn, D.H.; Easton, M.A. Additive manufacturing of ultrafine-grained high-strength titanium alloys. Nature 2019, 576, 91–95. [Google Scholar] [CrossRef] [PubMed]
  9. Ning, J.; Mirkoohi, E.; Dong, Y.; Sievers, D.E.; Garmestani, H.; Liang, S.Y. Analytical modeling of 3D temperature distribution in selective laser melting of Ti-6Al-4V considering part boundary conditions. J. Manuf. Process. 2019, 44, 319–326. [Google Scholar] [CrossRef]
  10. Carslaw, H.; Jaeger, J. Conduction of Heat in Solids; Oxford Science Publication: Oxford, UK, 1900; Chapter 10. [Google Scholar]
  11. Bunge, H.-J. Texture Analysis in Materials Science: Mathematical Methods; Elsevier: Amsterdam, The Netherlands, 2013. [Google Scholar]
  12. Kobryn, P.A.; Semiatin, S.L. Microstructure and texture evolution during solidification processing of Ti–6Al–4 V. J. Mater. Process. Technol. 2003, 135, 330–339. [Google Scholar] [CrossRef]
  13. Yang, Y.; Knol, M.; Van Keulen, F.; Ayas, C. A semi-analytical thermal modelling approach for selective laser melting. Addit. Manuf. 2018, 21, 284–297. [Google Scholar] [CrossRef]
  14. Welsch, G.; Boyer, R.; Collings, E. Materials Properties Handbook: Titanium Alloys; ASM International: Tokyo, Japan, 1994. [Google Scholar]
  15. Yadroitsev, I.; Yadroitsava, I. Evaluation of residual stress in stainless steel 316L and Ti6Al4V samples produced by selective laser melting. Virtual Phys. Prototyp. 2015, 10, 67–76. [Google Scholar] [CrossRef]
  16. Gusarov, A.V.; Yadroitsev, I.; Bertrand, P.; Smurov, I. Model of radiation and heat transfer in laser-powder interaction zone at selective laser melting. J Heat Transf. 2009, 131, 072101. [Google Scholar] [CrossRef]
  17. Fu, C.H.; Guo, Y.B. Three-dimensional temperature gradient mechanism in selective laser melting of Ti-6AI-4V. J. Manuf. Sci. Eng. 2014, 136, 061004. [Google Scholar] [CrossRef]
  18. Simonelli, M.; Tse, Y.Y.; Tuck, C. Effect of the build orientation on the mechanical properties and fracture modes of SLM Ti–6Al–4V. Mater. Sci. Eng. A 2014, 616, 1–11. [Google Scholar] [CrossRef]
Figure 1. Heat transfer mechanisms in the part and powder bed during the laser heating process. Laser power input (yellow arrow) will lead to the temperature increase and melting of powder material. The heat loss will be induced by (1) thermal conduction (blue arrows and orange arrows) from the part to the surrounding powder bed and the bottom substrate and (2) thermal convection and radiation (green arrows) from the heated build surface to the atmosphere of the machine chamber [9].
Jmmp 08 00070 g001
Figure 2. Schematic representation of build part and single scan.
Jmmp 08 00070 g002
Figure 3. Bunge–Euler angle convention [11].
Jmmp 08 00070 g003
Figure 4. Columnar grain growth on polycrystal base (PX means polycrystal base;  N s e e d  implies the number of possible seed crystals) [5].
Jmmp 08 00070 g004
Figure 5. Predicted 3D temperature profile near laser location with test 4. (a) Temperature profile from top view, (b) temperature profile on the cross-sectional area of x-z plane, and (c) temperature profile on the cross-sectional area of y-z plane.
Jmmp 08 00070 g005
Figure 6. Molten pool dimensions under various process conditions. The laser scanning velocity is 0.2 m/s. Laser power varies from 20 W to 80 W. Molten pool width. Orange and blue colors represent experimental and predicted measurements, respectively.
Jmmp 08 00070 g006
Figure 7. Simulated beta phase texture of LPBF Ti-6Al-4V. (a) Previous simulated result [6], (b) experimental result [18], and (c) simulated result in this work.
Jmmp 08 00070 g007
Figure 8. Simulated beta phase texture of LPBF Ti-6Al-4V. (a) P = 300 W, V = 0.1 m/s; (b) P = 700 W, V = 1 m/s.
Jmmp 08 00070 g008
Figure 9. Simulated thermal gradient direction angle histogram between X and Y directions of SLM Ti-6Al-4V. (a) P = 300 W, V = 0.1 m/s; (b) P = 700 W, V = 1 m/s.
Jmmp 08 00070 g009
Figure 10. Simulation of LPBF Ti-6Al-4V single-track scanning at P = 157 W and V = 0.225 m/s with the part size of 1 mm, 1 mm, and 0.1 mm: (a) temperature distribution from the top view in a single-track scan; (b) pole figure of (100); (c) pole figure of (100), (001), (011), and (−111); (d) inverse pole figure of (−111).
Jmmp 08 00070 g010aJmmp 08 00070 g010b
Table 1. Materials properties [13,14,15].
Properties of MaterialValueUnit
Density ( ρ )4428kg/ m 3
Bulk Thermal Conductivity ( k t )5–35W/m-K
Melting Temperature ( T m )1655  
Absorption ( η )0.8181
Heat Capacity (C)500–800J/kg-K
Powder Thermal Conductivity ( k p )0.21W/m-K
Heat Convection Coefficient (h)24W/ m 2 -K
Radiation Emissivity ( ε )0.91
Room Temperature ( T 0 )20  
Stefan–Boltzmann Constant ( σ )   5.67 × 10 8 W/ m 2 -K
Columnar/equiaxed Transition Coefficient (nn)3.21
Columnar/equiaxed Transition Coefficient (kk)   10 25 1
Table 2. Various process conditions for SLM of Ti-6Al-4V [17].
TestLaser Power (W)Scan Velocity V (m/s)
1200.2
2400.2
3600.2
4800.2
Table 3. Build setting for texture generation of Ti-6Al-4V in LPBF.
Build ParametersValue
Number of Layers10
Number of Seeds100
Number of Sections1000
Number of Grains20
Number of Track1
Disclaimer/Publisher’s Note: The statements, opinions and data contained in all publications are solely those of the individual author(s) and contributor(s) and not of MDPI and/or the editor(s). MDPI and/or the editor(s) disclaim responsibility for any injury to people or property resulting from any ideas, methods, instructions or products referred to in the content.

