Article

Effect of Process Variables on Interface Friction Characteristics in Strip Drawing of AA 5182 Alloy and Its Formability in Warm Deep Drawing †

by
Archit Shrivastava
* and
Ravi Kumar Digavalli
*
Department of Mechanical Engineering, Indian Institute of Technology Delhi, New Delhi 110016, India
*
Authors to whom correspondence should be addressed.
This paper is an extended version of our paper “Archit Shrivastava, D. Ravi Kumar. Effect of process variables on interface friction characteristics in strip drawing of AA5182 alloy in warm forming temperature range”. In Proceedings of the 20th International Conference on Sheet Metal (SHEMET 2023), Erlangen-Nürnberg, Germany, 2–5 April 2023.
J. Manuf. Mater. Process. 2023, 7(5), 175; https://doi.org/10.3390/jmmp7050175
Submission received: 4 September 2023 / Revised: 22 September 2023 / Accepted: 26 September 2023 / Published: 29 September 2023

Abstract

:
Warm forming is widely used to enhance the formability of aluminum alloy sheets. In warm deep drawing, the process variables significantly affect frictional characteristics at the tool–blank interface. It has been a conventional approach to use a constant value of friction coefficients in the finite element (FE) simulations. However, this can occasionally result in suboptimal accuracy of the predictions. In the present work, strip drawing tests were carried out on AA5182 aluminum alloy sheets to investigate the effect of important process variables, namely, temperature, contact pressure, and drawing speed, on the friction coefficient in the warm forming temperature range (100–250 °C) under lubricated condition. The results obtained from the strip drawing tests were used for defining the friction conditions in the simulation of warm deep drawing of cylindrical cups incorporating the variation of the friction coefficient with contact pressure and speed at different temperatures. The Barlat89 yield criterion was used to define the effect of anisotropy in the material. The Voce hardening law and Cowper–Symonds model were used to incorporate the effect of strain hardening and strain rate, respectively, in the simulation. Drawability and peak force were compared with the predictions when a constant friction coefficient was assumed. Warm deep drawing experiments were conducted to validate the predicted drawability and load–displacement curves. It is clearly observed that the accuracy of prediction of the limiting drawing ratio and peak load through simulations is improved by incorporating the effect of pressure and speed on friction coefficient as it captures the local variations of friction during warm deep drawing precisely, rather than assuming a constant average friction coefficient at all the tool–blank contact areas.

1. Introduction

Aluminum alloys have proven to be an ideal choice for lightweighting in the automotive industry due to their higher strength-to-weight ratio than steels and good mechanical properties [1]. Complex sheet metal parts are required for automotive applications [2], and these are manufactured by processes such as deep drawing, stretch forming and bending [3]. Deep drawing is one of the most important sheet metal-forming processes, and it involves radial drawing of a blank into the die cavity with a punch. Deep drawing is primarily used to create parts with large depth, such as fuel tanks, oil sumps, gas cylinders, automotive panels etc. As the blank material in the flange region slides over the dies during deep drawing, friction between the blank and the tools affects drawability, uniformity of strain distribution, and drawing load [4]. However, the aluminum alloys have limited formability at ambient temperature. This can be increased by forming at elevated temperatures [5]. Jang et al. [6] studied the tensile deformation behavior of AA5182 aluminum alloy in the warm working temperature range of 150–350 °C and found that the drawability increased in warm deep drawing. Satish et al. [7] also observed a significant effect of temperature and punch speed on formability of this alloy in the temperature range of 200–300 °C.
However, the frictional characteristics in deep drawing are very critical in warm forming because temperature, sliding speed, lubrication, and binder force affect the interface friction in the flange and die corner regions. The friction and galling in forming processes are known to be affected by various parameters in the sliding contact region, including contact pressure [8,9], sliding velocity, temperature, tool geometry, pre-straining [10], the sliding surfaces of the contact pair [11], and lubricant [12,13]. The adhesion of aluminum alloys to tool surfaces is enhanced during warm forming. This causes increased friction, degrades the surface quality of the formed part, and damages the tool. As a result, lubrication and application of coatings has been a standard practice to reduce metal adhesion, tool wear, and friction [14]. Januszkiewicz et al. [15] studied the friction and wear behavior of AA5182 aluminum alloy ring rubbing against an SAE (AISI) 52100-type bearing steel ball at various temperatures (up to 300 °C) and different applied forces (4 N and 24 N) in a ball-on-ring friction tester. The authors noticed a transfer layer growing on the tool surface and severe scratches on AA5182 at a critical temperature of 230 °C. The findings demonstrated that temperature significantly impacts adhesion and wear.
In the field of sheet metal forming, numerical simulation has become essential for predicting the necessary parameters to successfully form a component. This greatly reduces the time and effort required during the trial phase [16]. The literature contains numerous instances of research findings examining the accuracy of these simulations, encompassing analyses of material modeling, boundary conditions, tribological factors, and damage models [17]. Material modeling has received significant attention from researchers over the past two decades [18,19], while relatively little work has been documented regarding the tribological aspects of the deep drawing process. Conventionally, the assumption of a constant friction coefficient based on Coulomb’s law is the prevailing practice in simulations. However, an improved version of Coulomb’s law considers variations in the friction coefficient based on contact pressure and sliding velocity. Alaitz Zabala [20] illustrated the intricate nature of tribological systems and their impact on forming simulations, highlighting the necessity of incorporating the influence of process variables on the friction coefficient. Utilizing advanced friction models [21,22], it is possible to predict real-time friction coefficient values in simulations rather than assuming a uniform friction coefficient for all the elements of a blank. These models calculate friction coefficients for predefined process parameters that include local contact pressure, relative sliding velocity, plastic strain in the sheet material, and interface temperature.
The parameters used in friction testing must be similar to the actual forming process parameters for reliable estimation of the friction coefficient. The contact condition in strip drawing tests is similar to that encountered in the flange region during deep drawing [23]. Therefore, in the present work, strip drawing tests were carried out to investigate the effect of important process variables on the friction coefficient under lubricated conditions in the warm deep drawing temperature range of AA5182 aluminum alloy sheets. The friction coefficient was determined for different contact conditions by varying temperature, contact pressure, and drawing speed. The results obtained from the strip drawing tests were subsequently used as input for defining the friction conditions in the finite element (FE) simulation of warm deep drawing of cylindrical cups, accounting for the variation in the friction coefficient with contact pressure and speed at different temperatures. The Barlat89 yield criterion was used to define the effect of anisotropy in the material. The Voce hardening law and Cowper–Symonds model were used to incorporate the effect of strain hardening and strain rate, respectively, in the simulation. The simulation results obtained by using the variable friction coefficient were compared with those obtained when a constant friction coefficient was assumed to predict the drawability. Warm deep drawing experiments were conducted to validate the predicted drawability and load–displacement curves.

2. Materials and Methods

Specimens of 1.15 mm-thick AA5182 (Al–Mg–Mn) alloy sheets in fully annealed condition were used in the present work. This grade of aluminum is widely used in the automobile industry for sheet metal stamping due to its high work-hardening ability. The arithmetic average roughness (Ra) of the specimens determined using Talysurf was 0.95 ± 0.05 μm.

2.1. Strip Drawing Tests

Strip drawing experiments were conducted on AA5182 alloy sheet specimens to determine the effects of temperature, drawing speed and contact pressure on the coefficient of friction. In this test, a strip of size 500 mm × 65 mm was drawn between two flat dies after applying a predefined normal force (N) on the strip, as shown in Figure 1a. The strip drawing tests were performed at LFT, FAU Erlangen, Germany. The experimental setup used for the determination of the friction coefficient is shown in Figure 1b. The strip was pulled by holding one end with wedge grips over a displacement of 200 mm at a constant speed, and the draw force (F) was measured. Frictional force (Ff) acts on both sides of the strip. The friction coefficient was calculated using half the ratio of the draw force to the normal force. Flat dies of cross-section area 100 mm × 55 mm made up of high-carbon, high-chromium tool steel were used in the tests. The die surfaces had an arithmetic average roughness (Ra) of 0.30 ± 0.05 μm after being ground and polished. The dies and the samples were cleaned with acetone before performing every experiment to remove any dirt that might affect the friction coefficient measurement. Oil-based lubricants KTL N16 and SHF 430 were used for testing at ambient and elevated temperatures, respectively. The amount of lubricant used was equivalent to 2.0 g/m2, which is the amount typically used in sheet metal stamping operations.
The dies were preheated by cartridge heaters. Insulating isolation plates and cooling plates were installed to keep the surrounding electrical and mechanical components from overheating. When the required temperature of the dies was reached, the strip was heated to a sufficiently high temperature, taking into account the loss of temperature while placing it between the dies. Insulations was provided around the heating system to minimize the heat loss. The temperature was continuously measured using a thermocouple and maintained within ±5 °C of the required temperature during the test. Although the recrystallization temperature of aluminum alloys is generally in the range of 300 °C–400 °C, the strength decreases significantly beyond 300 °C. Thus, to balance both strength and ductility, the recommended warm forming temperature of aluminum alloys is in the range of 100 °C–250 °C. Thus, the strip drawing tests in this work were carried out at 25 °C, 100 °C, 125 °C, 150 °C, and 250 °C at different combinations of contact pressure and drawing speed. The blank holding pressure applied in the flange area during warm deep drawing of AA5182 aluminum alloys usually varies from 1.5 MPa–2.5 MPa. To study the effect of blank holding pressure on the friction coefficient in warm deep drawing at 150 °C and 250 °C, the strip drawing tests were carried out at contact pressures of 1.3 MPa, 1.8 MPa, and 2.3 MPa by varying the normal force (7.5 kN, 10 kN 12.5 kN) for a contact area of 5500 mm2. The strips were drawn by varying the speed (2.5 mm/s, 5 mm/s, 10 mm/s) to capture the effect of speed also on the tribological behavior at 150 °C and 250 °C. The experiments were repeated three times for each combination of parameters to ensure the reproducibility of the results. The average friction coefficient was determined from the force–displacement data obtained over the sliding distance range of 50 mm–150 mm.

2.2. Warm Deep Drawing Simulation

The finite element simulations were carried out using the commercially available LS-Dyna software. Postprocessing of the results was conducted using DynaForm software. The finite element simulation of a flat bottom cylindrical cup deep drawing of AA5182 alloy blanks with a punch of 50 mm diameter was carried out with blank temperatures of 200 °C and 250 °C. The FE model used for the simulation is shown in Figure 2. The specifications for the tool and the workpiece dimensions, along with the process parameters, are shown in Table 1. Belytschko–Tsay elements of initial size 1.5 mm were used for meshing the blank with five integration points. To improve the accuracy of simulation results, a refining mesh option with a maximum refinement level of 5 was used.
The tools (die, binder, and punch) were modeled as rigid bodies to prevent deflection of the tools and the blank as a deformable body for the simulations. Circular blanks of 105 mm, 110 mm, 115 mm and 120 mm diameter were used in the simulations. A gap equal to blank thickness was provided between the binder and the die to avoid penetration of blank surface with the tool surface. The predictions from the FE model have been validated with earlier published work [7] on the same alloy.

2.2.1. Friction Conditions

Forming one-way surface to surface was used to define the contact at the tool–blank interfaces. To avoid undesirable oscillation in contact during simulations, a 20% viscous damping coefficient was used. Two different methods to define the friction coefficient were used in this work. The first one is the standard method, where a constant value was defined for the friction coefficient (0.2 for 200 °C and 0.25 for 250 °C [24]) whereas in the second method, the variation in friction coefficient with speed and contact pressure obtained from the strip drawing tests performed at elevated temperatures was incorporated in the FE simulation. The friction coefficient determined at 200 °C and 250 °C at three contact pressures (1.3 MPa, 1.8 MPa, and 2.3 MPa) and speeds (2.5 mm/s, 5 mm/s, and 10 mm/s) were defined as inputs in the simulation.

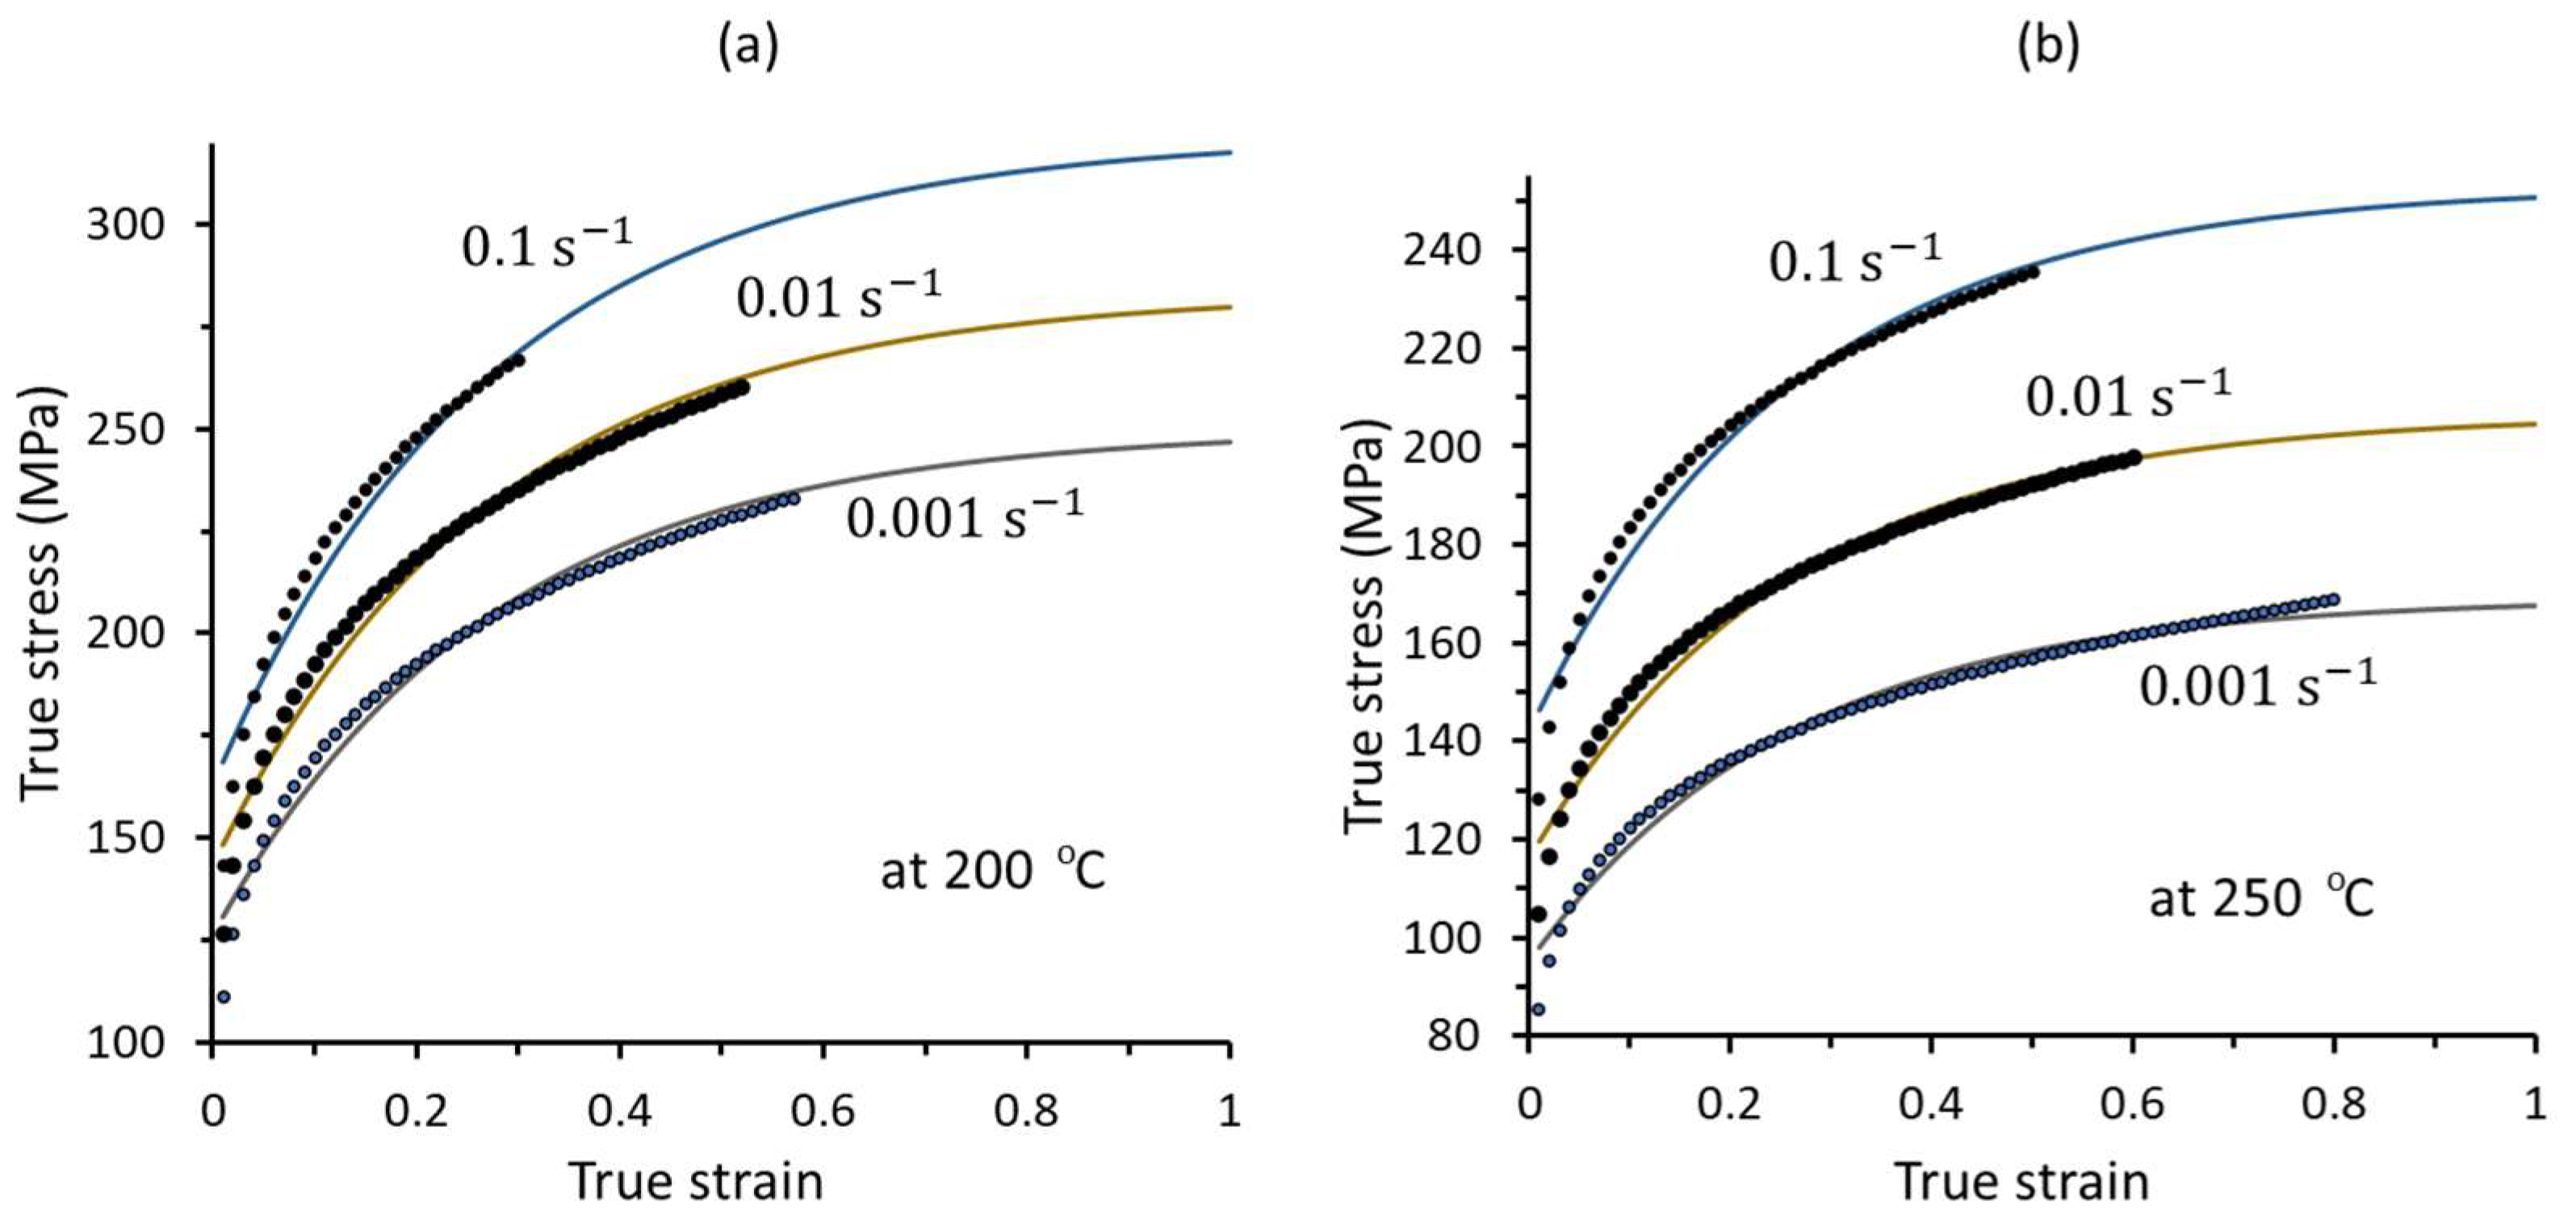
2.2.2. Material Model

The mechanical properties of the alloy were determined by performing uniaxial tensile tests as per ASTM E8M [7]. Constant strain rate tests were conducted at two temperatures—200 °C and 250 °C. At elevated temperatures, the flow stress is influenced by both strain and strain rate, so at each of the temperatures, the samples were tested at three strain rates—0.001, 0.01, and 0.1 s−1—to investigate the effect of strain rate on the flow curves.
In the warm deep drawing simulation, the Voce–Cowper–Symonds model is used to define the flow curves. In this model, the flow stress is predicted at a quasistatic strain rate using Voce’s law, and the strain rate sensitivity is incorporated using the Cowper–Symonds strain rate sensitivity factor. The Voce hardening law [25] is used to predict the quasistatic flow stress ( σ f s ) at any level of plastic strain ( ε p ) , as given by Equation (1):
σ f s ε p = a b   e d   ε p
where, a, b, and d are material constants. These constants were determined by the least squares method using the stress–strain data obtained from the tensile tests performed at quasistatic strain rate (0.001 s−1).
The Cowper–Symonds model [26] scales the flow stress ( σ f ) determined at the quasistatic strain rate by a factor, as given in Equation (2):
σ f ε p , ε ˙ p = σ f s ε p 1 + ε ˙ p C 1 P
where C and P are Cowper–Symonds strain rate parameters. These parameters were determined by least squares method using the experimental results obtained at large strain rates (0.01 s−1 and 0.1 s−1).
The constants (a, b, d, C, and P) determined for 1.15 mm thick AA5182 sheet at 200 °C and 250 °C are shown in Table 2. By combining the Voce hardening law with the Cowper–Symonds model, the flow curve was extrapolated to a plastic strain of 1.0, as shown in Figure 3.
The Barlat89 nonquadratic anisotropic yield criterion [18] was used in the FE simulation of warm deep drawing to incorporate the effect of anisotropy in the yielding behavior of the material. It is given by Equation (3):
a K 1 + K 2 M + a K 1 K 2 M + c 2 K 2 M = 2 σ ¯ M
where M is a material exponent, which was taken to be 8, as suggested for FCC materials. K 1 and K 2 are the invariants of the stress tensor and can be obtained using Equation (4) and Equation (5), respectively:
K 1 = σ 11 + h σ 22 2
K 2 = σ 11 h σ 22 2 2 + p σ 12 2
where, a, c, h, and p are the anisotropic coefficients. These coefficients can be found [18] using the plastic strain ratios (ro, r45, and r90) determined through tensile tests performed at 0°, 45°, and 90° to the rolling direction [27] at elevated temperatures at a strain rate of 0.001 s−1 (Table 3). The values of M, ro, r45, and r90 are given as input in the MAT36 material model in LS-Dyna, and the coefficients of the Barlat89 yield criterion were determined by the software using the above equations.

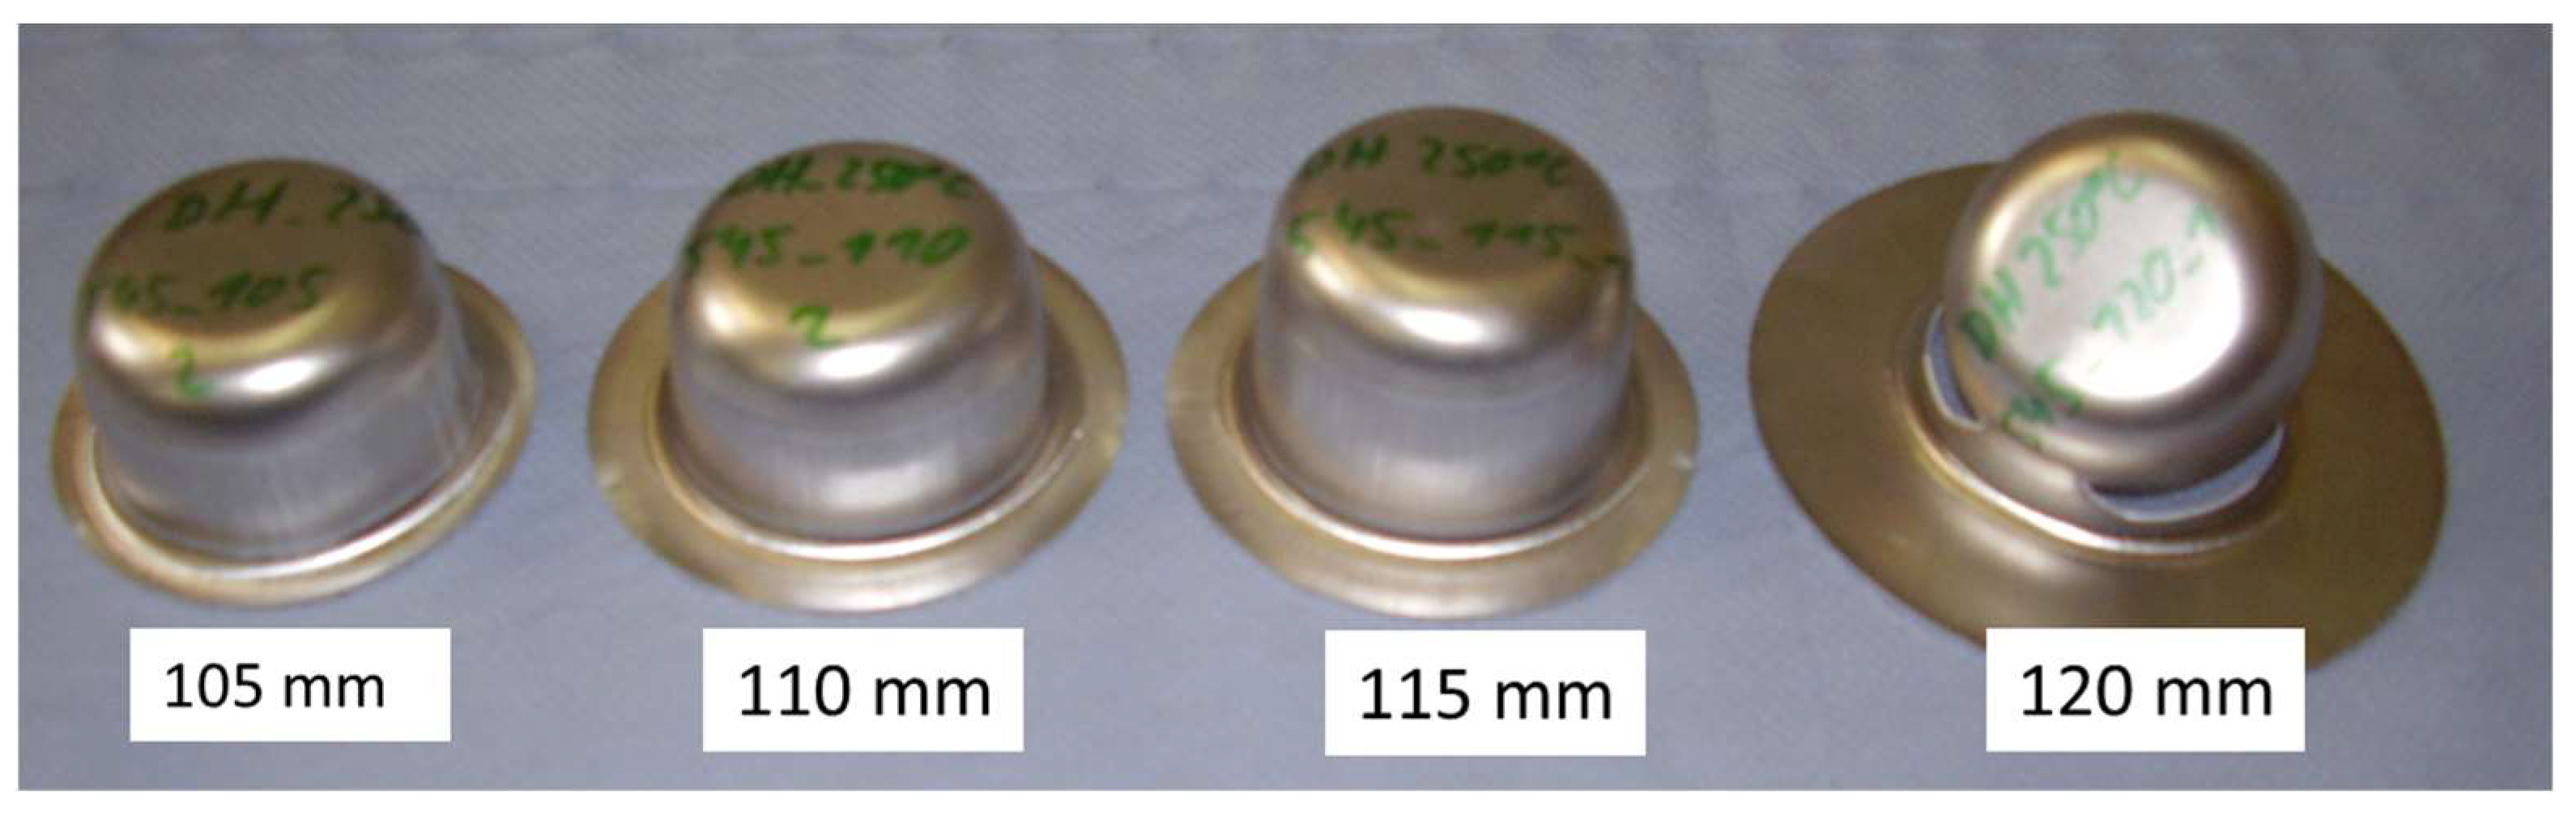
2.3. Deep Drawing Experiments

To verify the simulation results with constant friction and variable friction conditions in warm deep drawing, Swift flat-bottomed cup deep drawing tests [28] were performed using 1.15 mm-thick circular blanks of AA5182 alloy using a 50 mm-diameter flat-bottomed cylindrical punch. Blanks of varying diameter from 105 mm to 120 mm were used in the deep drawing experiments at 200 °C and 250 °C. Figure 4a depicts a schematic diagram of the warm deep drawing test setup. The warm deep drawing tests were performed at LFT, FAU Erlangen, Germany. The experimental setup is shown in Figure 4b. The tests were carried out on a servo-hydraulic press at a constant punch speed of 10 mm/s and an initial blank holding pressure of 0.6 MPa. The tools were heated using cartridge heaters embedded in the tools and the blanks were heated in an external oven. To maintain the isothermal condition prior to the tests, the blanks were also heated to the desired temperature by placing them between closed tools for a few seconds. The temperature of the dies and the strip was continuously measured using thermocouples and maintained within ±5 °C of the required temperature during the test. The cups were drawn to a constant depth of 30 mm with SHF 430 as the lubricant. The punch load and the displacement were measured using a load cell and an LVDT, respectively. The limiting draw ratio of the material was predicted by finding the maximum blank diameter that can be drawn successfully.

3. Results and Discussion

3.1. Effect of Process Variables on Friction in Strip Drawing Tests

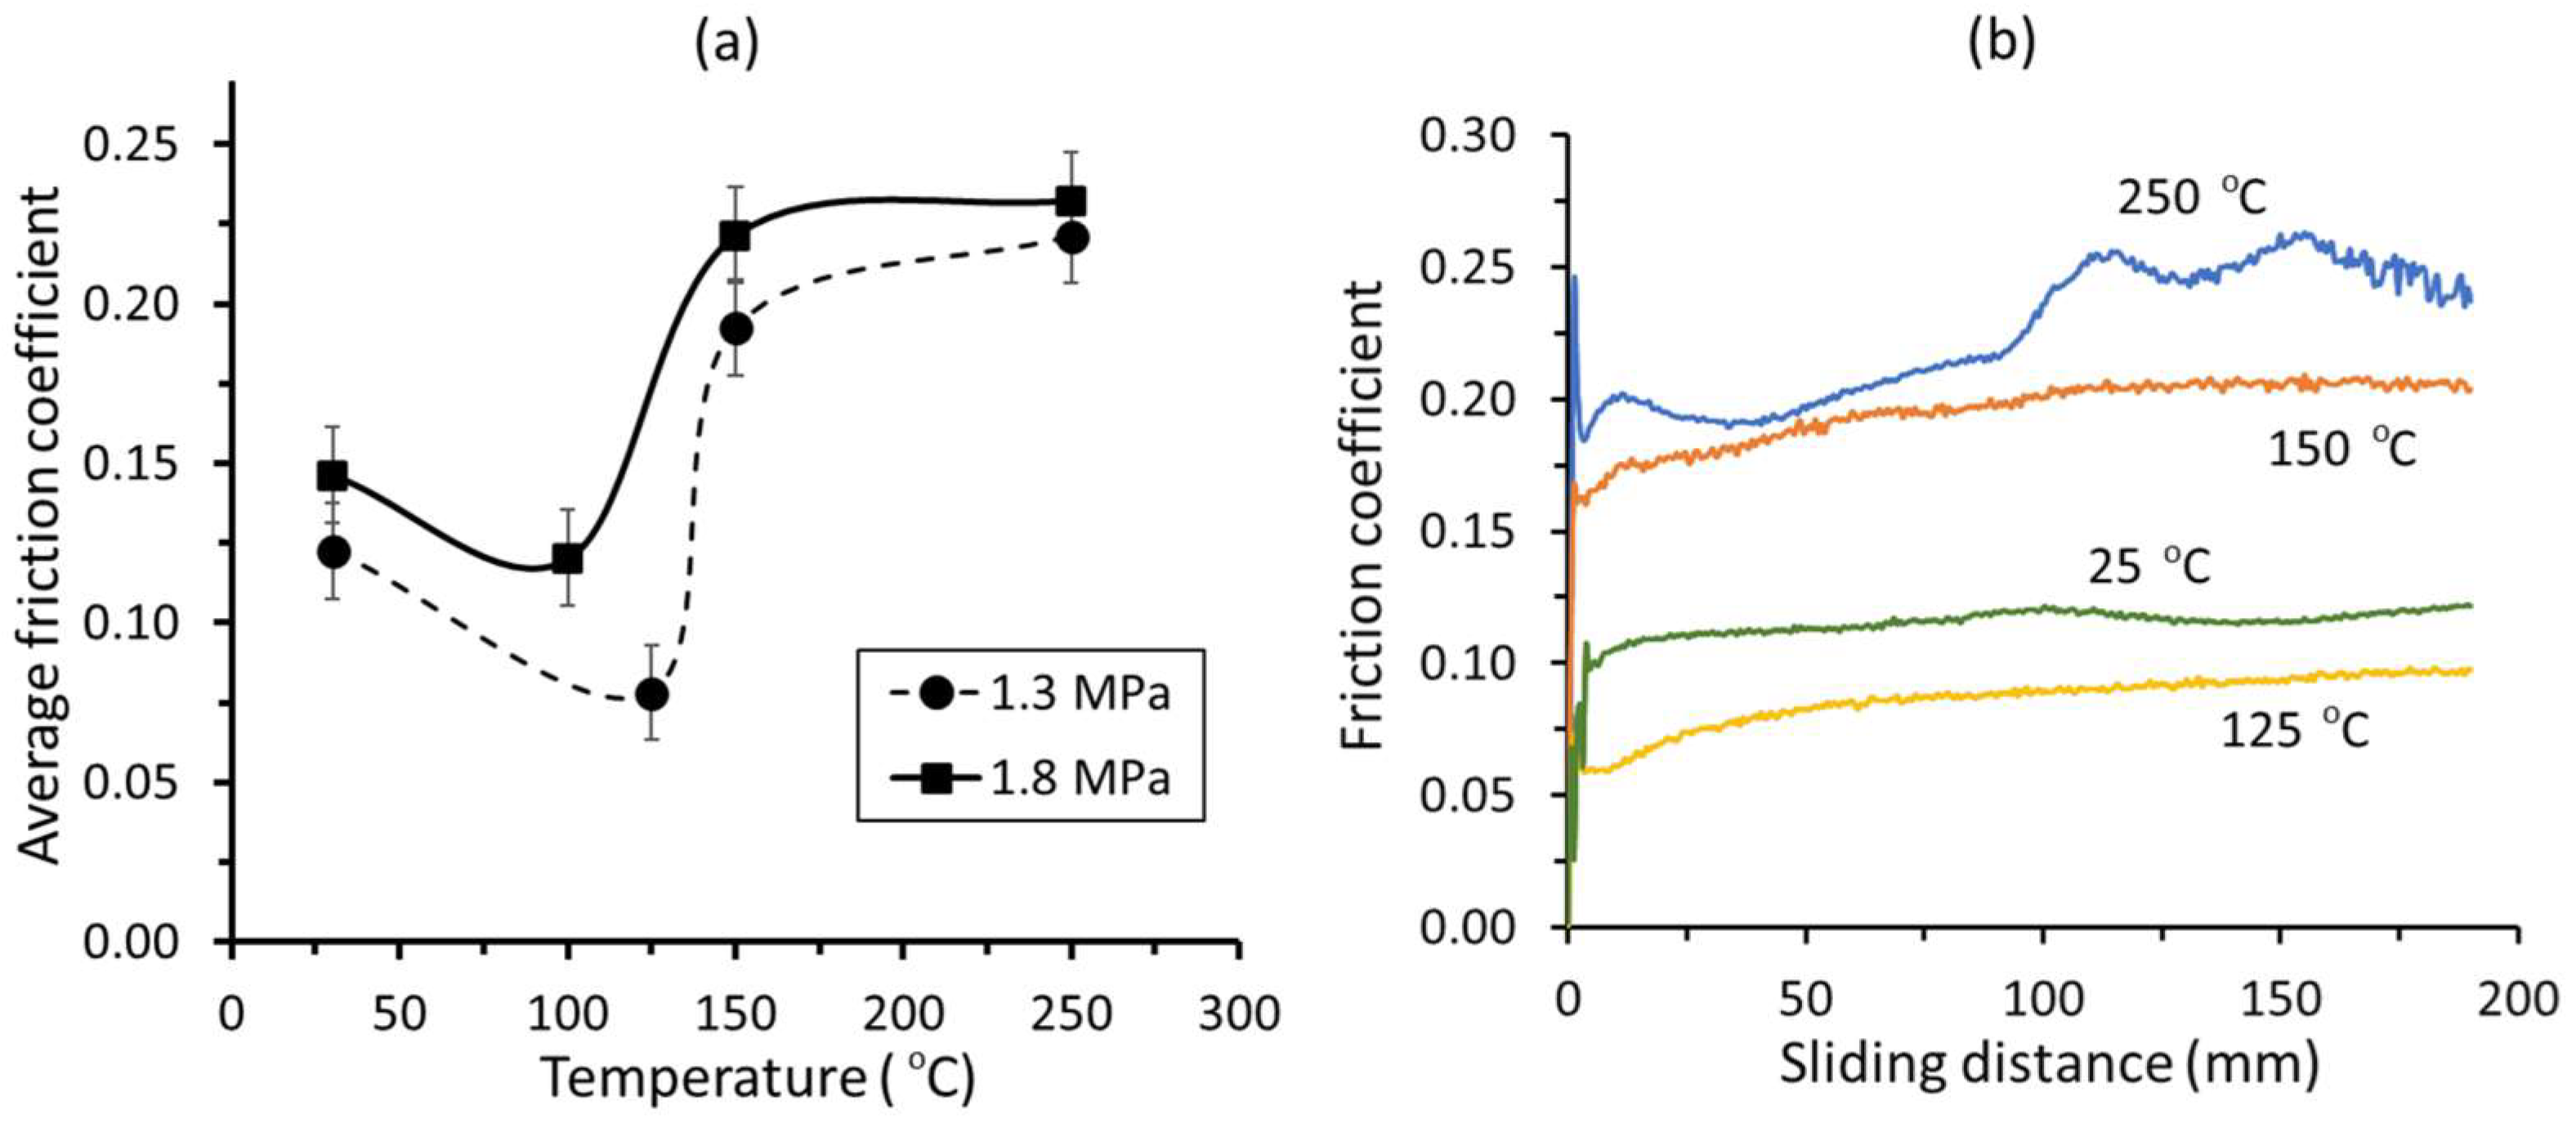
3.1.1. Effect of Temperature

The variation on friction coefficient with temperature in strip drawing experiments under lubricated condition is shown in Figure 5a at a constant drawing speed of 10 mm/s. At ambient temperature, the friction coefficient is found to be 0.12 and 0.15 at a contact pressure of 1.3 MPa and 1.8 MPa, respectively. The tests at elevated temperatures indicated the friction coefficient at 100 °C and 125 °C is lower than at ambient temperature. This could be due to material softening and lower shear stress required to draw the strip. At 1.8 MPa contact pressure, with a further increase in temperature, the friction coefficient is found to increase before becoming nearly constant. The susceptibility of adhesion increases with increase in temperature, leading to a gradual change in the interface condition and rise in friction coefficient. The friction coefficient sharply increased to 0.22 when the temperature is raised to 150 °C and further increases to 0.23 at 250 °C. The variation in the friction coefficient at 1.3 MPa exhibits a similar behavior, with a minor shift in the overall shape of the curve. The friction coefficient is minimum (0.078) at 125 °C at a contact pressure of 1.3 MPa.
The variation in the friction coefficient with the sliding distance for different temperatures is depicted in Figure 5b. These experiments were carried out at a contact pressure of 1.3 MPa and a drawing speed of 10 mm/s. The friction coefficient is nearly constant along the sliding distance at ambient temperature, but slightly increased at higher temperatures. An increase in temperature causes the lubricant’s viscosity to decrease at the contact interface, which reduces the lubricant film thickness and its life span along the sliding distance. A sharp increase in friction coefficient is observed towards the end of the sliding at 250 °C, possibly due to inadequate lubricant at the interface at later stages of strip drawing leading to dry sliding condition and galling. Similar behavior was observed by Januszkiewicz et al. [15] on AA5182 aluminum alloy at temperatures over the critical temperature, where a significant metal transfer to the tool and severe scratches on the workpiece were observed.
The effect of process variables (contact pressure and drawing speed) on the friction coefficient at two different temperatures (150 °C and 250 °C) is discussed in the following sections.

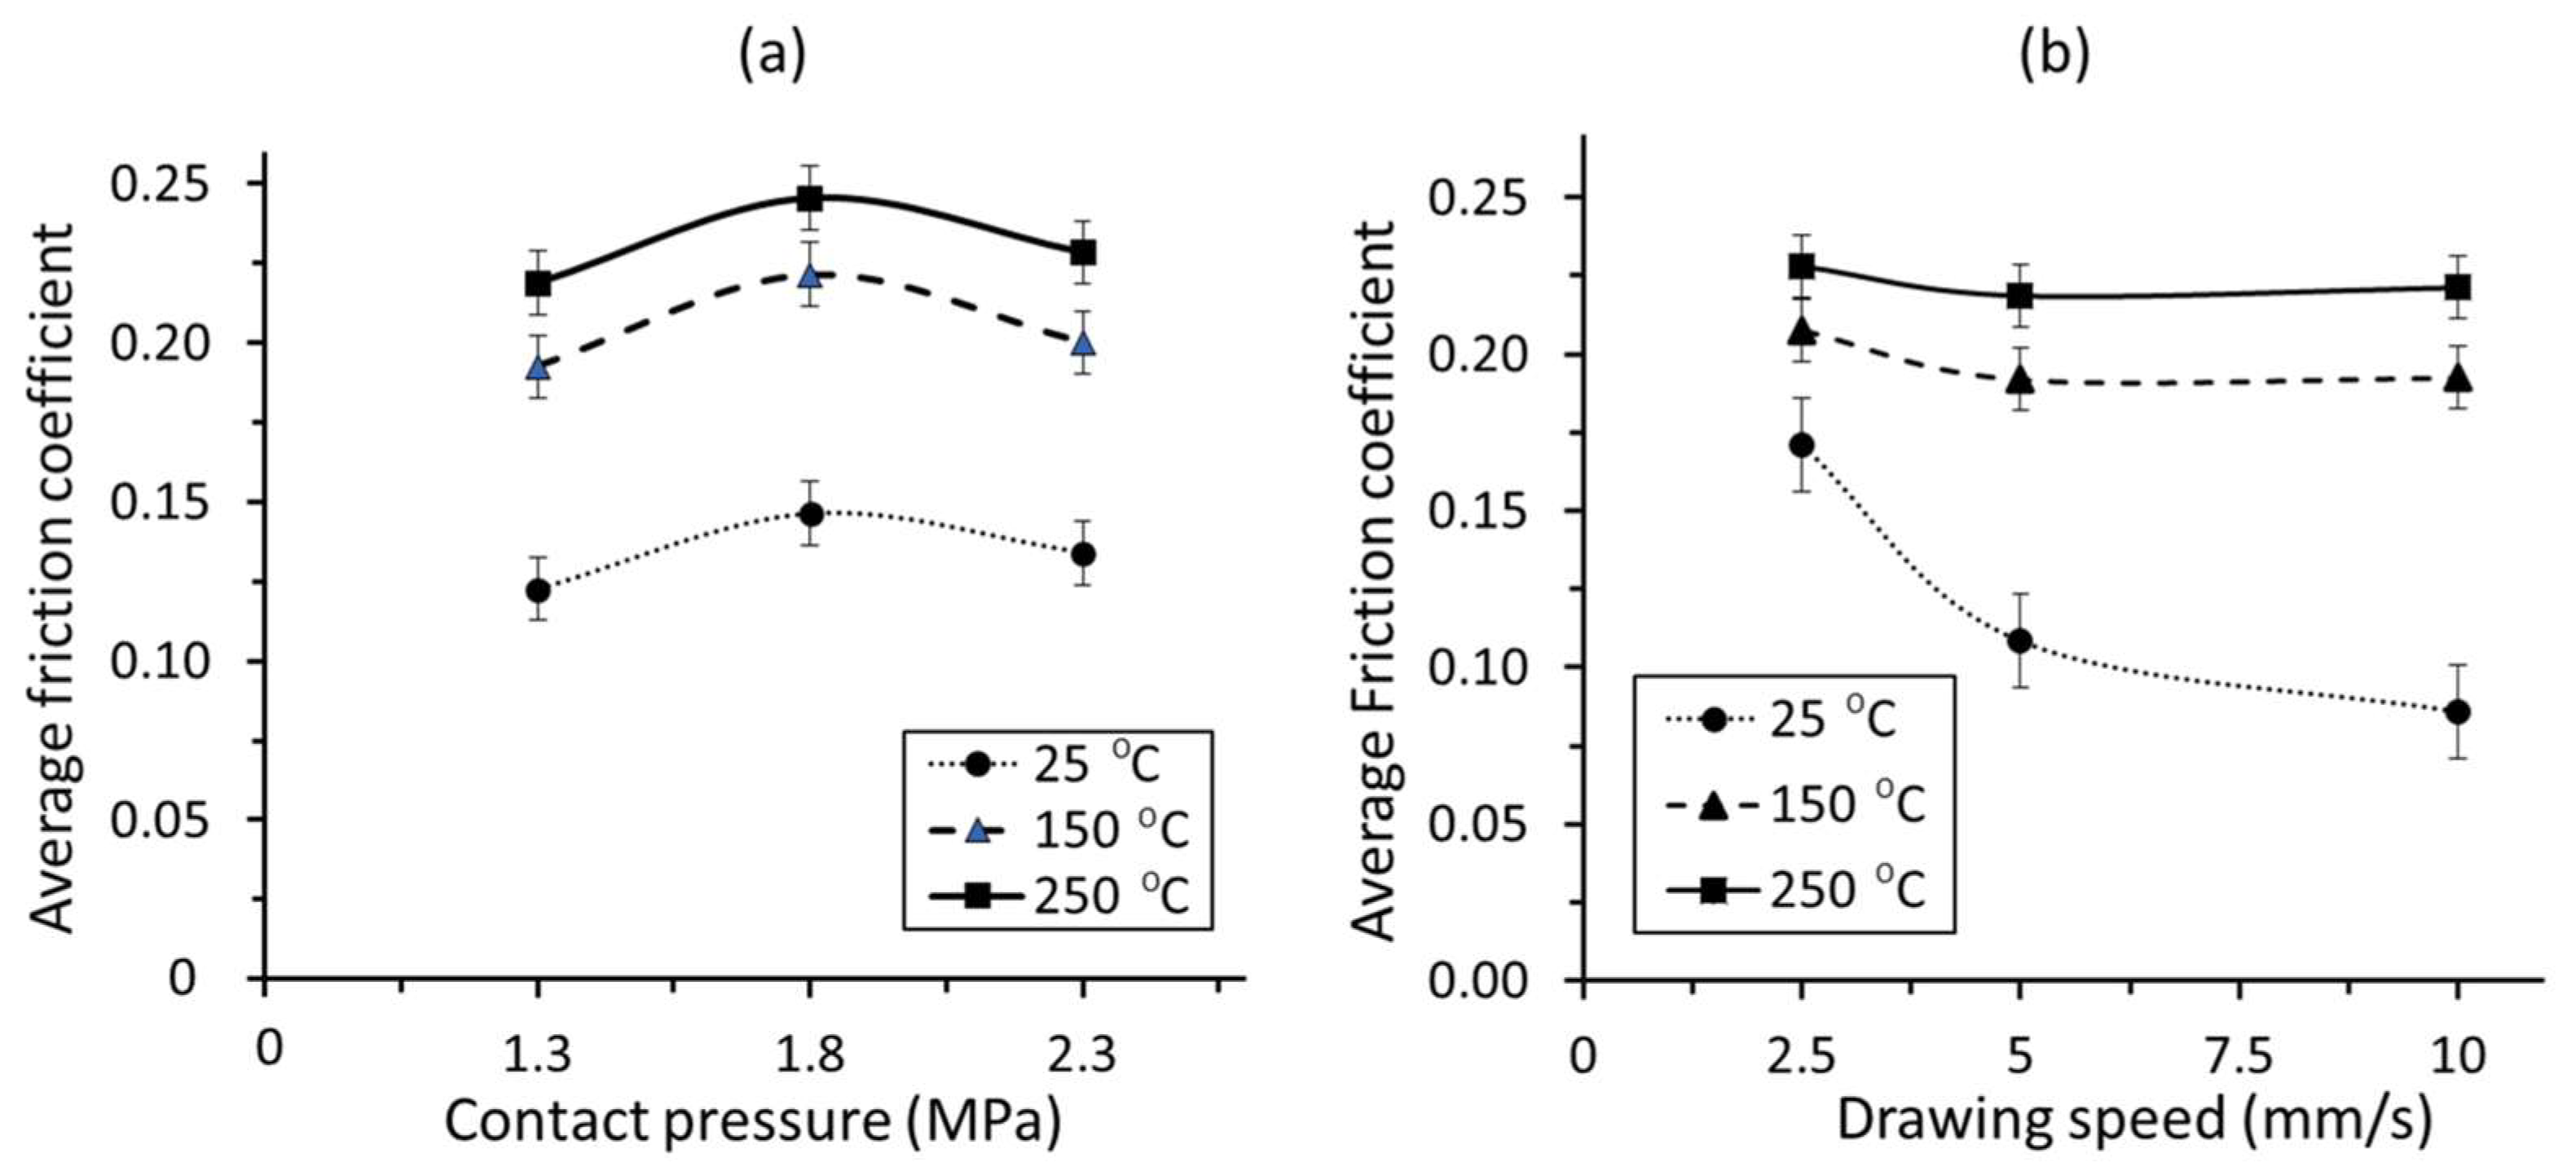
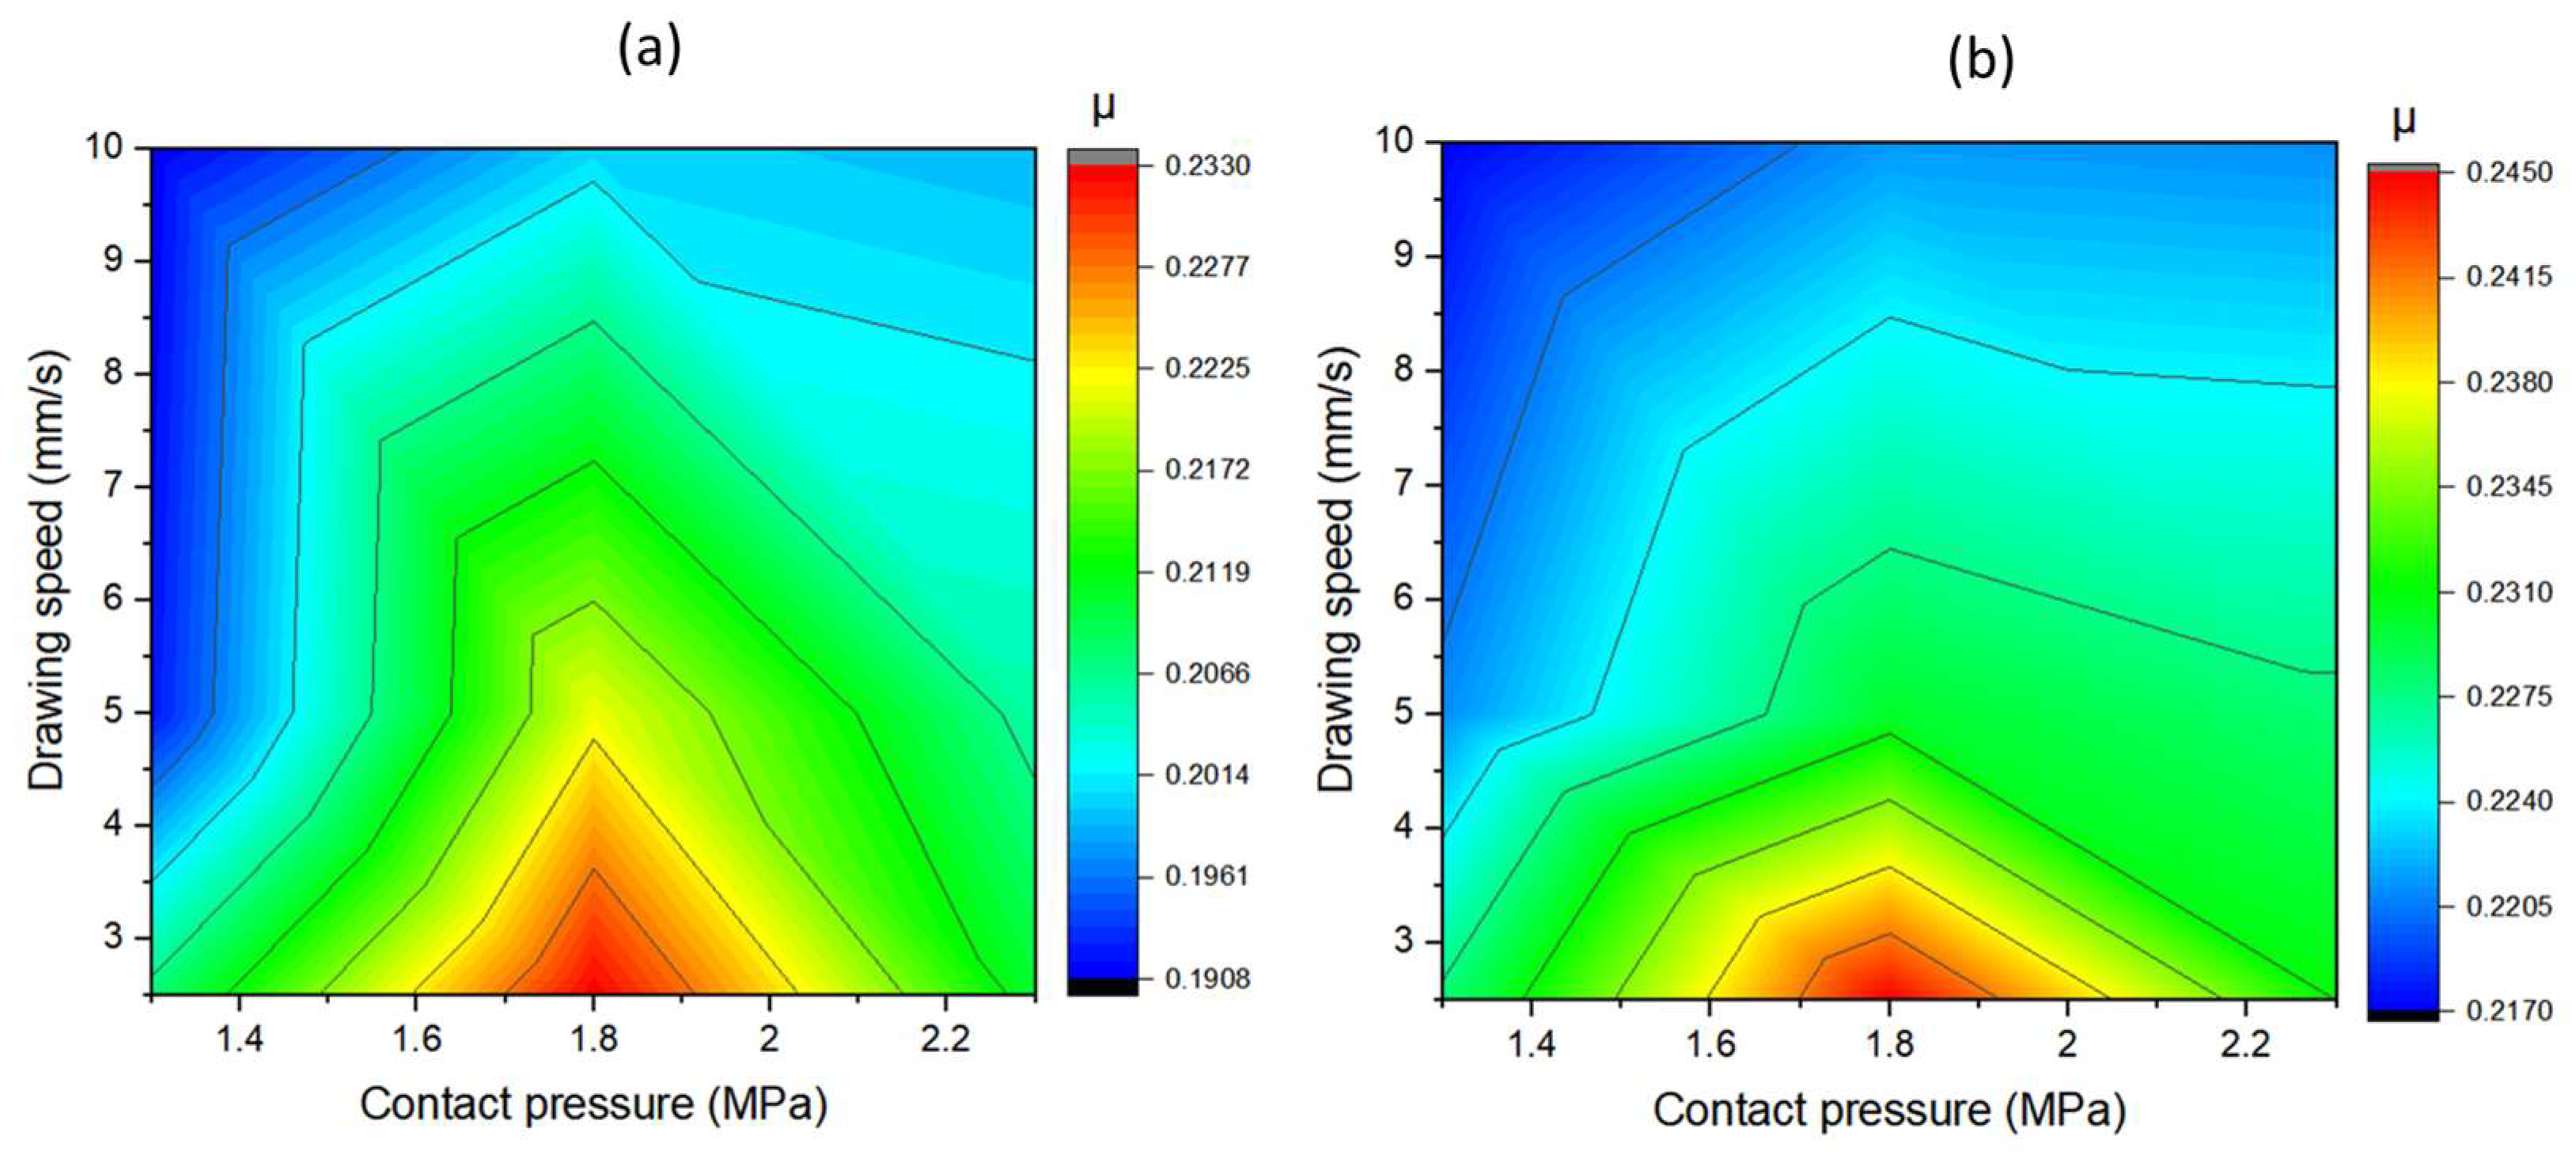
3.1.2. Effect of Contact Pressure

The variation in average friction coefficient value with contact pressure at elevated temperatures at a drawing speed of 10 mm/s is shown in Figure 6a. When the pressure is increased from 1.3 MPa to 1.8 MPa, the friction coefficient is raised by localized sticking due to high contact stresses produced under higher contact pressure. A similar trend is observed at the ambient temperature also, but at elevated temperatures, the friction coefficient is observed to decrease with a further increase in the pressure to 2.3 MPa. At high temperatures, the affinity of adhesion increases as the contact pressure increases. Asperities undergo excessive plastic deformation, so higher shear forces are required due to stronger workpiece–tool interface bonding, but the decrease in friction coefficient could be attributed to subsurface shear deformation, which requires a lower shear force [29].

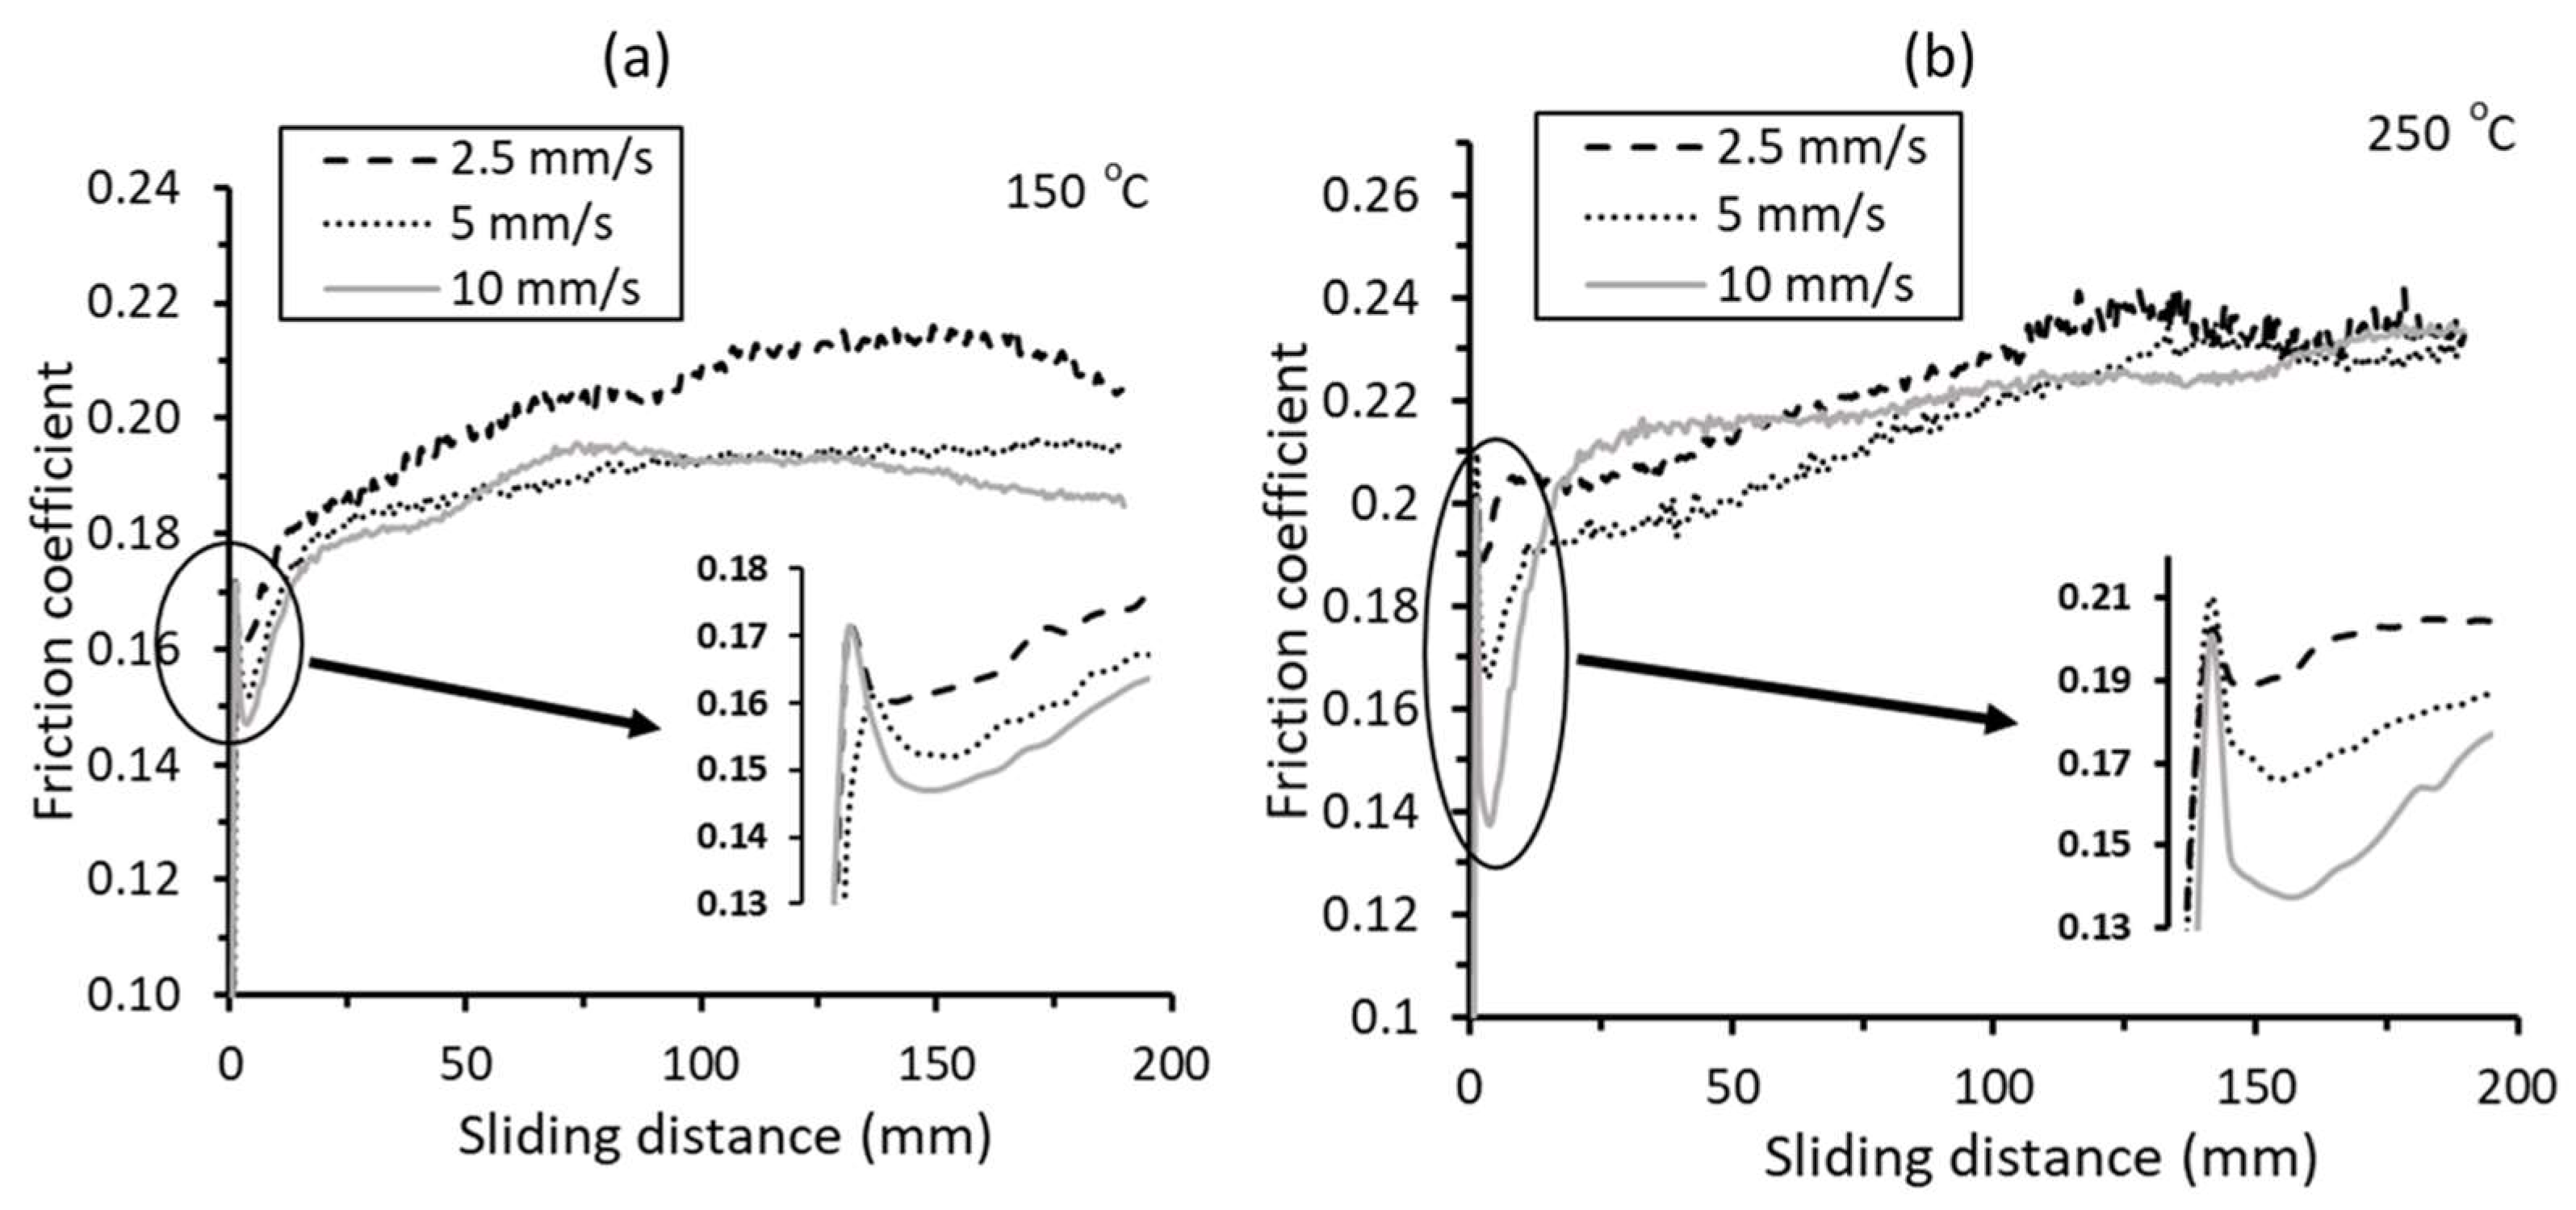
3.1.3. Effect of Drawing Speed

The effect of drawing speed on the friction coefficient at different temperatures at a contact pressure of 1.3 MPa is shown in Figure 6b. As drawing of the strip begins, the lubricant is drawn to the surface from the valleys, which act as pockets for lubricant storage. As less lubrication is being distributed in the contact area at low speeds, a higher friction coefficient is observed due to the stick–slip phenomenon of the contacting asperities. The flow rate of the lubricant from valleys to the surface increases with speed, thus reducing the friction coefficient.
However, the decrease in friction coefficient with increasing speed at higher temperatures is lower than at ambient temperature. The lubrication mechanism’s effectiveness at the contact interface plays an important role. Increasing tendency of oxidation and sticking friction that cause adhesion with increase in temperature might offset the decrease in friction coefficient with increase in drawing speed.
The variation in drawing speed on friction coefficient with sliding distance at 150 °C and 250 °C under a contact pressure of 1.3 MPa is shown in Figure 7a and b, respectively. The peak static friction coefficient at 150 °C is 0.17 ± 0.01 while it is 0.2 ± 0.01 at 250 °C. This increase in static friction coefficient is due to higher adhesion with an increase in temperature. The force required to draw the strip should overcome the static frictional force. The pulling force required to draw the strip decreases once the sliding begins. The static frictional force decreases once the sliding begins due to plastic deformation of peak asperities and removal of barrier due to interlocking peak asperities. The hydrodynamic pressure generated between the asperities increases with the increase in drawing speed [30] and this leads to a decrease in friction coefficient. Therefore, the kinetic frictional force is found to depend on the sliding speed. Figure 7 shows that the kinetic friction coefficient dropped to 0.15 at 10 mm/s. As the sliding continues, increase in adhesion tendency leads to increase in kinetic frictional forces. This leads to a rise in the friction coefficient again with the sliding distance. Thus, it is clear from Figure 7 that up to a sliding distance of 100 mm, there is a distinct variation in the friction coefficient at different speeds, and after that the fluctuation in the friction coefficient takes place, which is possibly due to the breakdown of the lubricant film.

3.2. Prediction of Effect of Friction in Warm Deep Drawing by FE Simulations

Figure 8 shows the contour plots of the variation of friction coefficient with contact pressure and drawing speed at 200 °C and 250 °C. Based on the results obtained from the strip drawing experiments, a tabular form was created to incorporate the variation in friction coefficient with contact pressures (1.3 MPa, 1.8 MPa, and 2.3 MPa) and drawing speeds (2.5 mm/s, 5 mm/s, and 10 mm/s) at different temperatures in the FE simulation. The contour surface was plotted using the friction coefficient obtained for these nine combinations of contact pressure and drawing speed. The friction coefficient at 200 °C was determined by interpolating the results obtained at 150 °C and 250 °C.

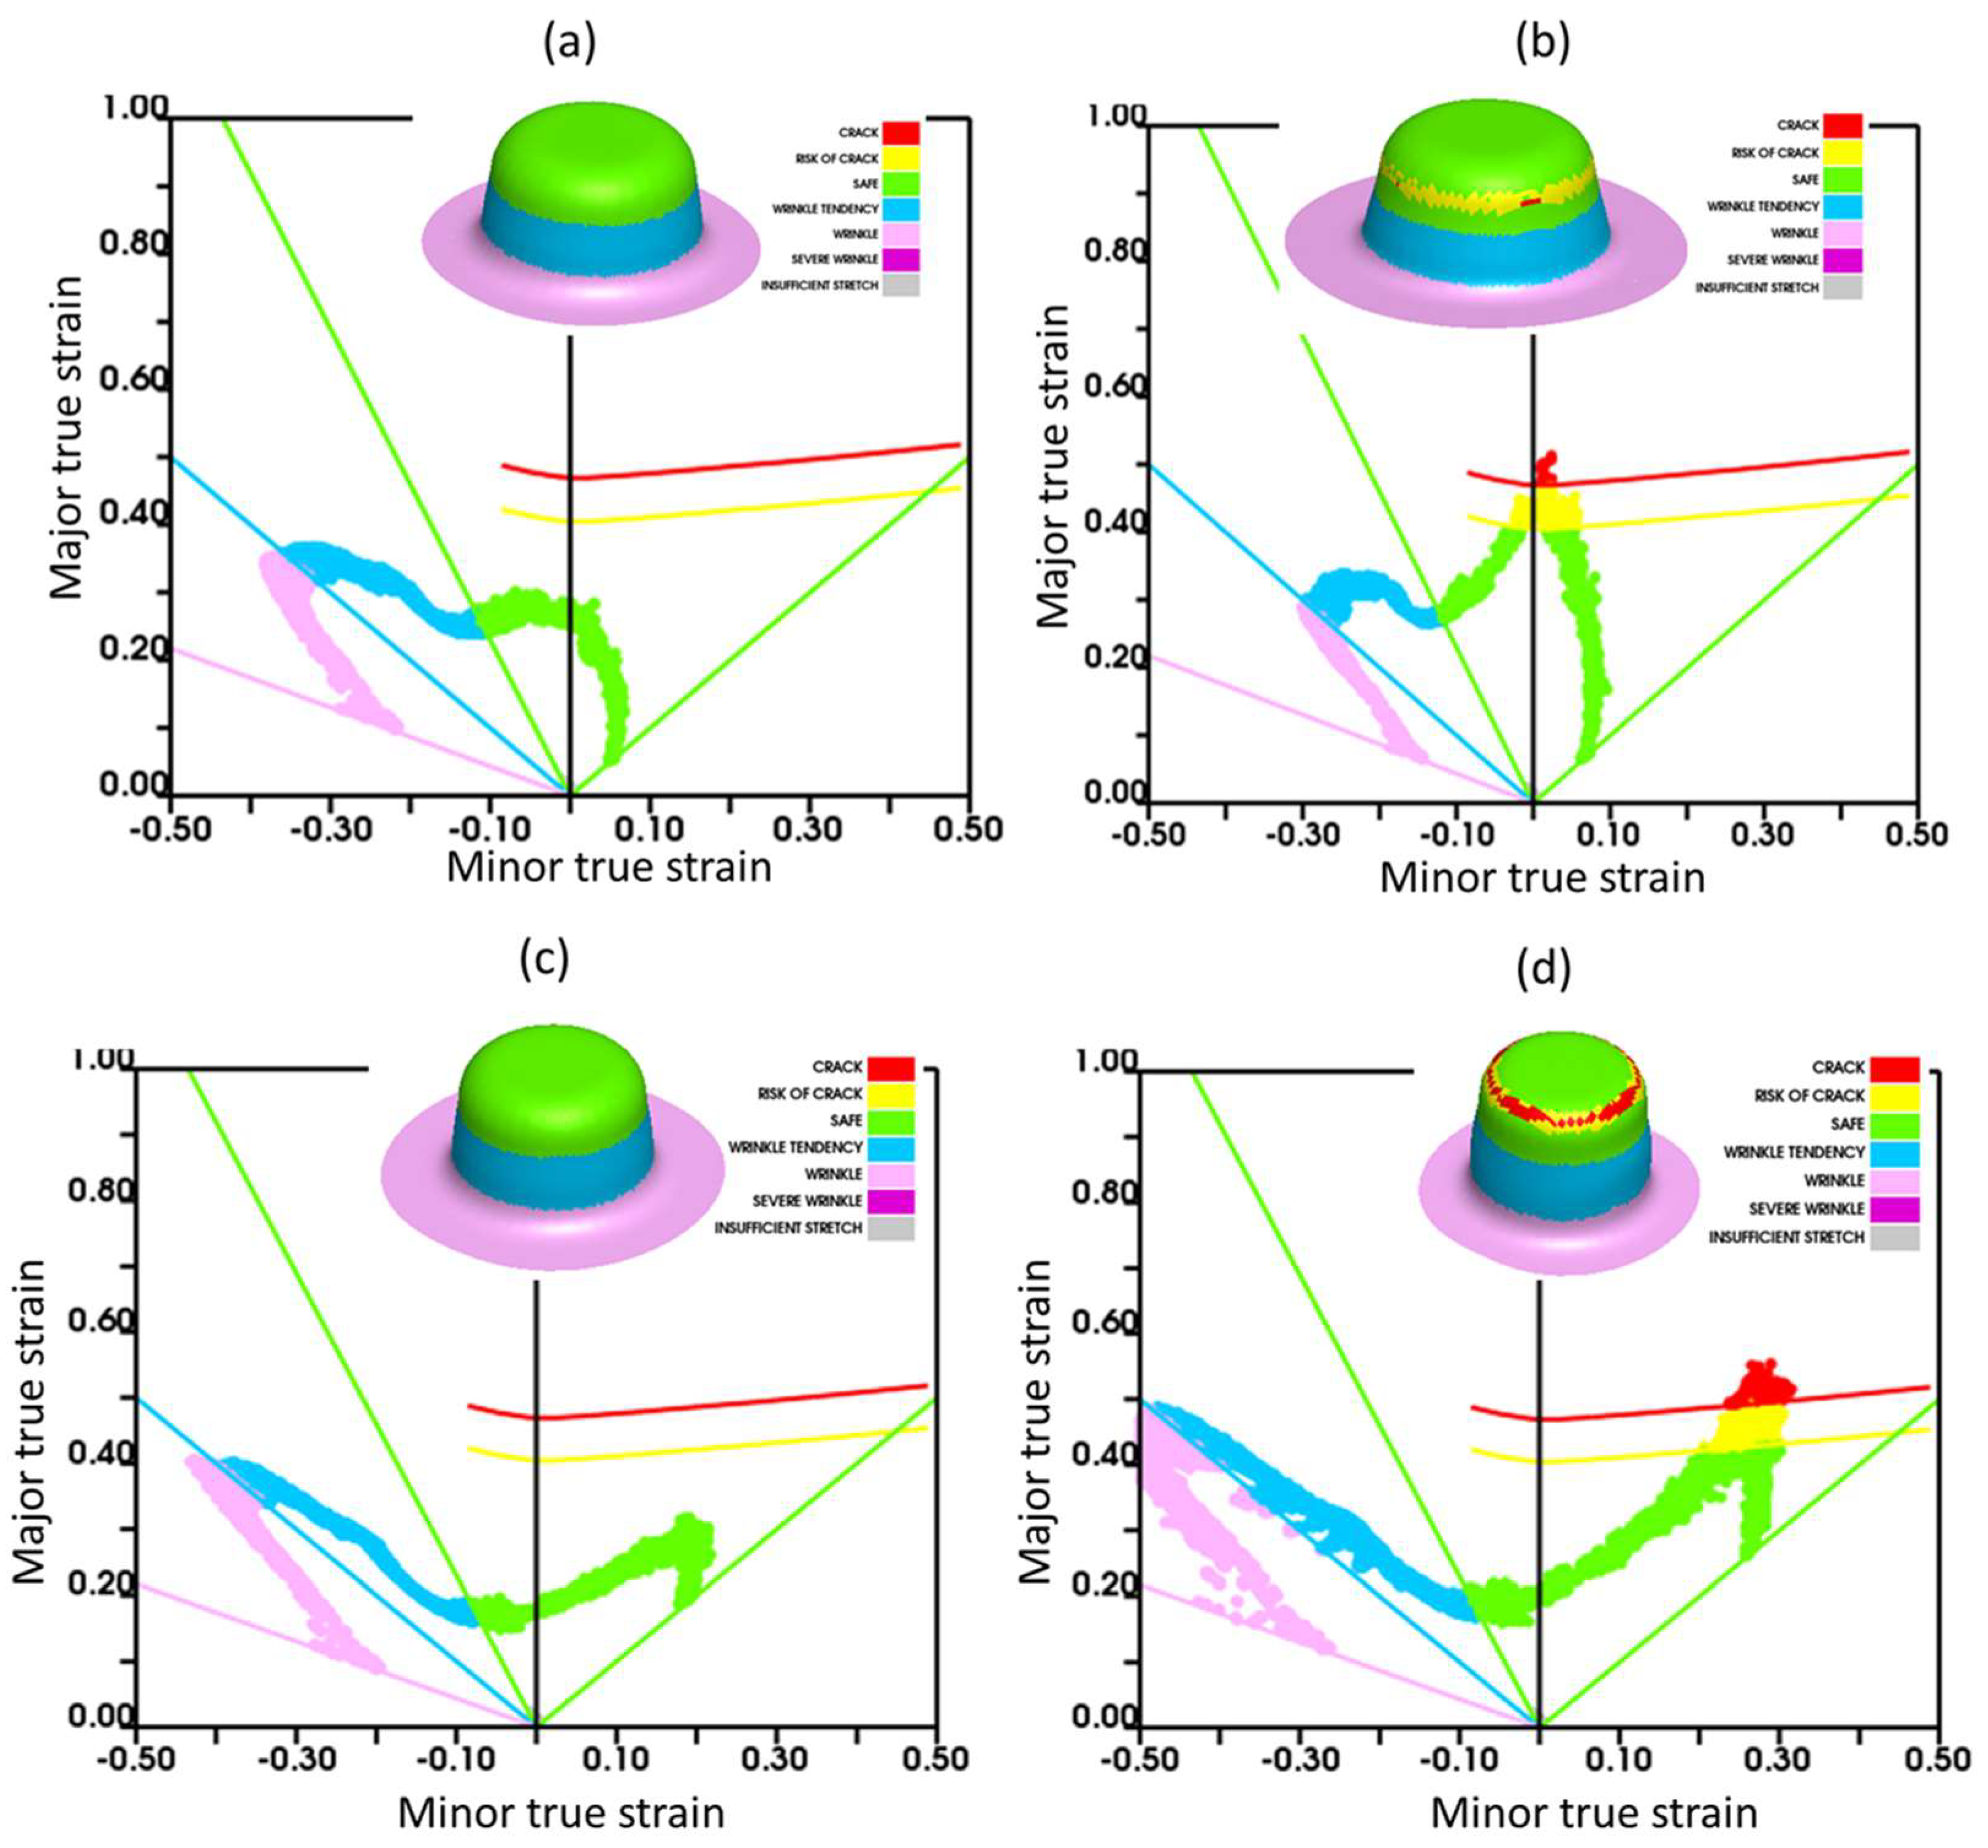
3.2.1. Prediction of Drawability

As previously mentioned, finite element (FE) simulations of warm deep drawing of AA5182 employing different friction models have been conducted. The simulation results for cups drawn at 250 °C with initial blank diameters of 105 mm and 110 mm using constant friction coefficient are presented in Figure 9a and b, respectively. The simulations performed considering the variable friction coefficient using blank diameters of 115 mm and 120 mm are shown in Figure 9c and d, respectively. The experimentally determined forming limit diagrams of this alloy at 200 °C and 250 °C by Satish et al. [7] using the Nakazima method have been used as the failure criterion in the simulations.
From the predicted results, it has been found that the maximum blank diameter that could be drawn successfully is 105 mm when the constant friction coefficient is used, indicating a limiting draw ratio of 2.1. Failure can be observed in the simulation with 110 mm blank diameter (Figure 9b). When the variable friction coefficient is used, a blank of 115 mm could also be drawn successfully, and failure was observed when the diameter was increased to 120 mm. Hence, the predicted limiting draw ratio in this case is 2.3. This is consistent with the experimental results with blanks of diameter 115 mm and 120 mm as shown in Figure 10, respectively. It is clearly observed that the accuracy of predictions in FE simulations can be improved by incorporating the effect of pressure and speed on friction coefficient, as it captures the local variations of friction during warm deep drawing precisely, rather than assuming a constant average friction coefficient at all the tool–blank contact areas. When a constant friction coefficient is used, the strains in the cup wall near the punch corner radius reach the failure limit close to the plane strain condition for 110 mm blank diameter. In contrast, when the variable friction model is utilized, the strains are more uniformly distributed leading to a successful draw, even in the case of 115 mm diameter, as validated by the experimental results. In the case of 120 mm blank diameter, the failure was observed in the biaxial stretching region due to larger deformation in the cup bottom. The change in strain path was due to reduction in friction coefficient with the increase in contact pressure. The shift in the strain path of the necking/failure point has also been observed by Kasaei et al. [31] from plane strain to biaxial stretching when the friction is reduced.

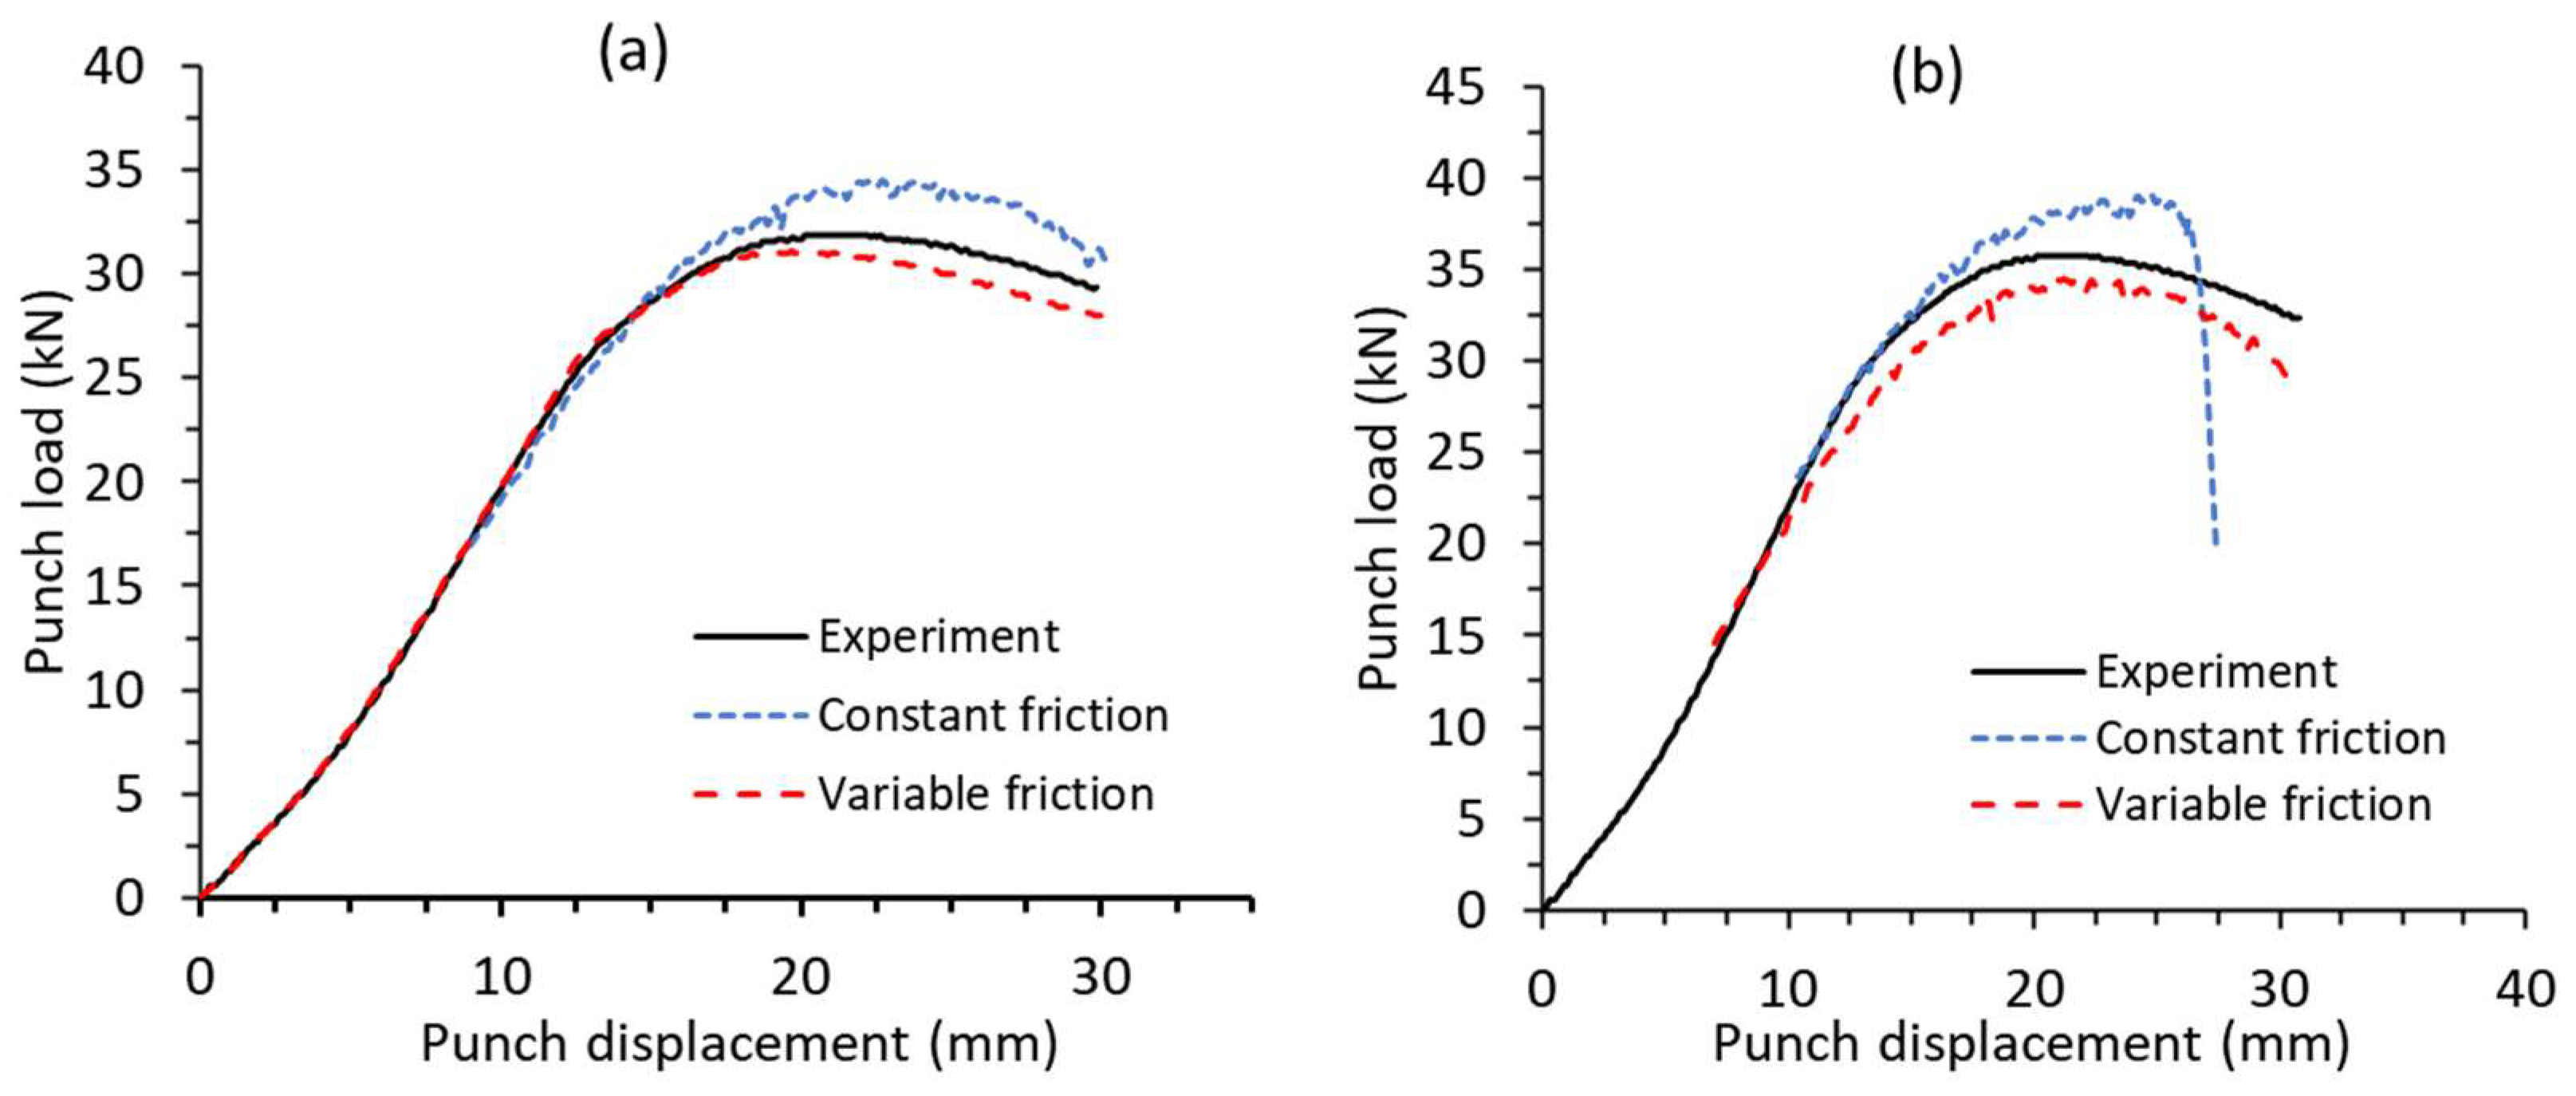
3.2.2. Predictions of Load–Displacement Curves

The punch load–displacement curves obtained from the FE simulations for the cups drawn at 250 °C with an initial blank diameter of 105 mm and 110 mm were compared with the experimental results, as shown in Figure 11a and b, respectively. The blank of 105 mm diameter was drawn successfully in simulations using both the friction conditions. With a constant friction coefficient of 0.25 in simulations, a higher peak load is predicted than the variable friction condition. When compared with the experimental values, the error in predicted values is 11% and 3% with constant friction and variable friction, respectively.
A comparison of the load–displacement curves from FE simulations for failed cups during deep drawing at temperatures of 200 °C (blank diameter 115 mm) and 250 °C (blank diameter 120 mm) with the experimental curves is shown in Figure 12a and b, respectively. The peak load predictions using the variable friction coefficient are more accurate than those using the constant friction coefficient. A decrease in peak load and increase in draw depth up to failure are observed with increase in temperature from 200 °C to 250 °C, due to the decrease in the flow stress and increase in ductility of the material.

3.2.3. Prediction of Shear Stress Distribution

In deep drawing, a constant blank holding force is applied on the blank in the flange region using blank holder. During drawing, as the blank is drawn into the die cavity, the blank holding pressure increases due to continuously reducing area of contact in the flange region. Figure 13 shows the shear stress distribution in the drawn cups with 105 mm blank diameter using the constant friction model and variable friction model. The maximum shear stress occurs in the die corner radius region in both the cases. Shear stress varies circumferentially due to anisotropic material behavior. Shear stress increases as blanks deform radially inward due to increasing circumferential compressive stresses within the flange. As seen in Figure 13, the maximum shear stress value at a constant depth of 30 mm is higher in the case of the constant friction model than in the case of variable friction model. Therefore, the predicted peak load in the case of the constant friction model is higher.

4. Conclusions

The effect of process variables on friction coefficient at the tool–strip interface in the warm forming temperature range of AA5182 aluminum alloy has been examined in conditions similar to those that exist in the flange region in warm deep drawing. The friction coefficient is significantly influenced by the blank temperature, contact pressure and drawing speed. The results obtained from the strip drawing tests were subsequently used as input for defining the friction conditions in the finite element simulation of warm deep drawing of cylindrical cups, accounting for the variation in the friction coefficient with contact pressure and speed at different temperatures. Drawability in terms of limiting drawing ratio is accurately predicted by utilizing the variable friction coefficient. When compared with the experimental values, the error in predicted values of peak drawing load reduced from 11% to 3% when the variable friction model is used. In this work, it is clearly observed that the accuracy of predictions in FE simulations can be improved by incorporating the effect of pressure and speed on friction coefficient, as it captures the local variations of friction during warm deep drawing precisely, rather than assuming a constant average friction coefficient at all the tool–blank contact areas.

Author Contributions

Conceptualization, A.S. and R.K.D.; methodology, A.S. and R.K.D.; software, A.S.; validation, A.S. and R.K.D.; formal analysis, A.S. and R.K.D.; investigation, A.S. and R.K.D.; resources, A.S. and R.K.D.; data curation, A.S.; writing—original draft preparation, A.S.; writing—review and editing, R.K.D.; visualization, A.S. and R.K.D.; supervision, R.K.D.; project administration, R.K.D. All authors have read and agreed to the published version of the manuscript.

Funding

The authors received no financial support for the research, authorship, and/or publication of this article.

Data Availability Statement

Data are available by request from the authors.

Acknowledgments

The authors would like to acknowledge the support received from Marion Merklein and her research group at the Lehrstuhl für Fertigungstechnologie, Friedrich-Alexander-Universität, Erlangen, Germany for the research carried out in this article. Archit Shrivastava would like to acknowledge the assistantship received from the Ministry of Human Resource Development (MHRD), Government of India for this research.

Conflicts of Interest

The authors declare no conflict of interest.

References

  1. Prasad Rambabu, N.; Eswara Prasad, V.V.K.; Wanhill, R.J.H. Aerospace Materials and Material Technologies; Springer: Singapore, 2017; Volume 1, p. 586. [Google Scholar] [CrossRef]
  2. Benedyk, J.C. Aluminum Alloys for Lightweight Automotive Structures; Woodhead Publishing Limited: Sawston, UK, 2010; ISBN 9781845694630. [Google Scholar]
  3. Marciniak, Z.; Duncan, J.L.; Hu, S.J. 2—Sheet Deformation Processes. In Mechanics of Sheet Metal Forming, 2nd ed.; Marciniak, Z., Duncan, J.L., Hu, S.J., Eds.; Butterworth-Heinemann: Oxford, UK, 2002; pp. 14–29. ISBN 978-0-7506-5300-8. [Google Scholar]
  4. Altan, T.; Tekkaya, A.E. Sheet Metal Forming Processes and Applications; ASM International: Novelty, OH, USA, 2012; pp. 83–98. ISBN 978-1-61503-844-2. [Google Scholar]
  5. Tisza, M.; Lukács, Z. High Strength Aluminum Alloys in Car Manufacturing. IOP Conf. Ser. Mater. Sci. Eng. 2018, 418, 012033. [Google Scholar] [CrossRef]
  6. Jang, D.H.; Kim, W.J. Warm Temperature Deformation Behavior and Processing Maps of 5182 and 7075 Aluminum Alloy Sheets with Fine Grains. Met. Mater. Int. 2018, 24, 455–463. [Google Scholar] [CrossRef]
  7. Satish, D.R.; Kumar, D.R.; Merklein, M. Effect of Temperature and Punch Speed on Forming Limit Strains of AA5182 Alloy in Warm Forming and Improvement in Failure Prediction in Finite Element Analysis. J. Strain Anal. Eng. Des. 2017, 52, 258–273. [Google Scholar] [CrossRef]
  8. Adamus, J.; Więckowski, W.; Lacki, P. Analysis of the Effectiveness of Technological Lubricants with the Addition of Boric Acid in Sheet Metal Forming. Materials 2023, 16, 5125. [Google Scholar] [CrossRef]
  9. Lachmayer, R.; Behrens, B.A.; Ehlers, T.; Müller, P.; Althaus, P.; Oel, M.; Farahmand, E.; Gembarski, P.C.; Wester, H.; Hübner, S. Process-Integrated Lubrication in Sheet Metal Forming. J. Manuf. Mater. Process. 2022, 6, 121. [Google Scholar] [CrossRef]
  10. Wu, Y.; Recklin, V.; Groche, P. Strain Induced Surface Change in Sheet Metal Forming: Numerical Prediction, Influence on Friction and Tool Wear. J. Manuf. Mater. Process. 2021, 5, 29. [Google Scholar] [CrossRef]
  11. Noder, J.; George, R.; Butcher, C.; Worswick, M.J. Friction Characterization and Application to Warm Forming of a High Strength 7000-Series Aluminum Sheet. J. Mater. Process. Technol. 2021, 293, 117066. [Google Scholar] [CrossRef]
  12. Prakash, V.; Kumar, D.R. Performance Evaluation of Bio-Lubricants in Strip Drawing and Deep Drawing of an Aluminium Alloy. Adv. Mater. Process. Technol. 2020, 8, 1044–1057. [Google Scholar] [CrossRef]
  13. Więckowski, W.; Adamus, J.; Dyner, M. Sheet Metal Forming Using Environmentally Benign Lubricant. Arch. Civil. Mech. Eng. 2020, 20, 51. [Google Scholar] [CrossRef]
  14. Tenner, J.; Andreas, K.; Radius, A.; Merklein, M. Numerical and Experimental Investigation of Dry Deep Drawing of Aluminum Alloys with Conventional and Coated Tool Surfaces. Procedia Eng. 2017, 207, 2245–2250. [Google Scholar] [CrossRef]
  15. Januszkiewicz, K.R.; Riahi, A.R.; Barakat, S. High Temperature Tribological Behaviour of Lubricating Emulsions. Wear 2004, 256, 1050–1061. [Google Scholar] [CrossRef]
  16. Tatipala, S.; Pilthammar, J.; Sigvant, M.; Wall, J.; Johansson, C.M. Introductory Study of Sheet Metal Forming Simulations to Evaluate Process Robustness. IOP Conf. Ser. Mater. Sci. Eng. 2018, 418, 012111. [Google Scholar] [CrossRef]
  17. Ben Said, L.; Allouch, M.; Wali, M.; Dammak, F. Numerical Formulation of Anisotropic Elastoplastic Behavior Coupled with Damage Model in Forming Processes. Mathematics 2023, 11, 204. [Google Scholar] [CrossRef]
  18. Barlat, F.; Lian, K. Plastic Behavior and Stretchability of Sheet Metals. Part I: A Yield Function for Orthotropic Sheets under Plane Stress Conditions. Int. J. Plast. 1989, 5, 51–66. [Google Scholar] [CrossRef]
  19. Banabic, D.; Kuwabara, T.; Balan, T.; Comsa, D.S. An Anisotropic Yield Criterion for Sheet Metals. J. Mater. Process. Technol. 2004, 157–158, 462–465. [Google Scholar] [CrossRef]
  20. Zabala, A.; de Argandoña, E.S.; Cañizares, D.; Llavori, I.; Otegi, N.; Mendiguren, J. Numerical Study of Advanced Friction Modelling for Sheet Metal Forming: Influence of the Die Local Roughness. Tribol. Int. 2022, 165, 107259. [Google Scholar] [CrossRef]
  21. Sigvant, M.; Hol, J.; Chezan, T.; van den Boogaard, T. Friction modelling in sheet metal forming simulations: Application and validation on an U-Bend product. In Proceedings of the 8th Forming Technology Forum Zurich, Advanced Constitutive Models in Sheet Metal Forming; Hora, P., Ed.; Institute of Virtual Manufacturing: Zurich, Switzerland, 2015; pp. 135–142. ISBN 978-3-906031-98-9. [Google Scholar]
  22. Hol, J.; Wiebenga, J.H.; Stock, J.; Wied, J.; Wiegand, K.; Carleer, B. Improving Stamping Simulation Accuracy by Accounting for Realistic Friction and Lubrication Conditions: Application to the Door-Outer of the Mercedes-Benz C-Class Coupé. J. Phys. Conf. Ser. 2016, 734, 032091. [Google Scholar] [CrossRef]
  23. Bay, N.; Olsson, D.D.; Andreasen, J.L. Lubricant Test Methods for Sheet Metal Forming. Tribol. Int. 2008, 41, 844–853. [Google Scholar] [CrossRef]
  24. Kim, H.S.; Koç, M.; Ni, J.; Ghosh, A. Finite Element Modeling and Analysis of Warm Forming of Aluminum Alloys—Validation through Comparisons with Experiments and Determination of a Failure Criterion. J. Manuf. Sci. Eng. 2006, 128, 613–621. [Google Scholar] [CrossRef]
  25. Voce, E. The Relationship between Stress and Strain for Homogeneous Deformation. J. Inst. Met. 1948, 74, 537–562. [Google Scholar]
  26. Cowper, G.R.; Symonds, P.S. Strain Hardening and Strain Rate Effect in the Impact Loading of Cantilever Beams; Division of Applied Mathematics, Brown University: Providence, RI, USA, 1957. [Google Scholar]
  27. Prakash, V.; Kumar, D.R. Numerical Simulation of Warm Deep Drawing Incorporating Strain Rate Effect in Sheet Material Properties. Mater. Today Proc. 2019, 18, 2595–2602. [Google Scholar] [CrossRef]
  28. Swift, H.W. Drawing Tests for Sheet Metal. Proc. Inst. Automob. Eng. 1939, 34, 10–1243. [Google Scholar]
  29. Dieter, G.E. Mechanical Metallurgy; SI Metric; McGraw-Hill: London, UK, 1988; pp. 539–546. [Google Scholar]
  30. Costa, H.L.; Hutchings, I.M. Hydrodynamic Lubrication of Textured Steel Surfaces under Reciprocating Sliding Conditions. Tribol. Int. 2007, 40, 1227–1238. [Google Scholar] [CrossRef]
  31. Kasaei, M.M.; Oliveira, M.C. Influence of the Contact with Friction on the Deformation Behavior of Advanced High Strength Steels in the Nakajima Test. J. Strain Anal. Eng. Des. 2022, 57, 193–207. [Google Scholar] [CrossRef]
Figure 1. (a) Schematic of strip drawing test and (b) the strip drawing machine used for determination of friction coefficient.
Jmmp 07 00175 g001
Figure 2. FE model used for simulation of warm deep drawing.
Jmmp 07 00175 g002
Figure 3. Experimental and predicted flow curves obtained from the uniaxial tensile tests in the rolling direction at three different strain rates at (a) 200 °C and (b) 250 °C.
Jmmp 07 00175 g003
Figure 4. (a) Schematic of warm deep drawing and (b) the experimental setup.
Jmmp 07 00175 g004
Figure 5. Variation of average friction coefficient with (a) temperature at a drawing speed of 10 mm/s and (b) sliding distance at different temperatures during strip drawing experiments.
Jmmp 07 00175 g005
Figure 6. Effect of (a) contact pressure and (b) drawing speed on friction coefficient in strip drawing in warm forming temperature range.
Jmmp 07 00175 g006
Figure 7. Variation of friction coefficient with sliding distance for different speeds in strip drawing experiments at (a) 150 °C and (b) 250 °C.
Jmmp 07 00175 g007
Figure 8. Contour plots showing variation of friction coefficient with contact pressure and drawing speed at (a) 200 °C and (b) 250 °C.
Jmmp 07 00175 g008
Figure 9. Results from deep drawing simulations at 250 °C using constant friction for blank diameters of (a) 105 mm and (b) 110 mm, and variable friction for blank diameters of (c) 115 mm and (d) 120 mm.
Jmmp 07 00175 g009
Figure 10. Experimentally deep drawn cups at 250 °C with blank diameters of 105 mm, 110 mm, 115 mm, and 120 mm.
Jmmp 07 00175 g010
Figure 11. Comparison of load–displacement curves predicted from FE simulations with experimental curves for deep drawing at 250 °C with blank diameters of (a) 105 mm and (b) 110 mm.
Jmmp 07 00175 g011
Figure 12. Comparison of load–displacement curves predicted from FE simulations with the experimental curves at (a) 200 °C (blank diameter 115 mm) (b) 250 °C (blank diameter 120 mm).
Jmmp 07 00175 g012
Figure 13. Shear stress distribution from the FE simulation on the cups drawn to a depth of 30 mm at 250 °C using (a) constant friction and (b) variable friction.
Jmmp 07 00175 g013
Table 1. Dimensions of the tools and the blanks and the process parameters.
ParameterValue
Punch diameter50 mm
Punch corner radius10 mm
Die diameter56 mm
Die corner radius6 mm
Blank diameters105 mm, 110 mm, 115 mm and 120 mm
Blank thickness1.15 mm
Initial blank holding pressure0.6 MPa
Punch travel (maximum)50 mm
Punch speed10 mm/s
Table 2. Voce–Cowper–Symonds model parameters for AA5182 at 200 °C and 250 °C.
Temperaturea (MPa)b (MPa)dC (s−1)P
200 °C249.8123.53.64.363.03
250 °C169.273.93.80.742.88
Table 3. Mechanical properties of AA5182 at 200 °C and 250 °C at 0.001 s−1.
TemperatureYS (MPa)UTS (MPa)r0r45r90
200 °C1171560.640.810.75
250 °C981140.680.840.72
Disclaimer/Publisher’s Note: The statements, opinions and data contained in all publications are solely those of the individual author(s) and contributor(s) and not of MDPI and/or the editor(s). MDPI and/or the editor(s) disclaim responsibility for any injury to people or property resulting from any ideas, methods, instructions or products referred to in the content.

