
Development of a Cost Model for Vertical Milling Machines to Assess Impact of Lightweighting


1
Environmental and Ecological Engineering, Purdue University, West Lafayette, IN 47907, USA
2
School of Mechanical Engineering, Purdue University, West Lafayette, IN 47907, USA
*
Author to whom correspondence should be addressed.
J. Manuf. Mater. Process. 2021, 5(4), 129; https://doi.org/10.3390/jmmp5040129
Submission received: 30 September 2021
/
Revised: 24 November 2021
/
Accepted: 29 November 2021
/
Published: 1 December 2021
(This article belongs to the Special Issue Advances in Multi-Axis Machining)
Abstract
:Lightweighting is a design strategy to reduce energy consumption through the reduction of mass of a product. Lightweighting can be applied to machine tools to reduce the amount of energy consumed during the use phase. Thus, the energy cost of machine operation will be reduced. One might also hypothesize that since a lighter-weight machine tool requires less material to build, the cost to produce such a machine will be less. However, it may also be the case that lightweighting a machine tool increases its complexity, which will likely drive up the cost to manufacture the machine. To explore the cost drivers associated with building a machine tool, data on the features associated with a wide variety of vertical milling machine tools are collected. Then, empirical cost models are fit to this data. The results from the cost models show that the machine tool mass is a significant cost driver; other key drivers are the number of axes and spindle power. The models are used to predict the cost benefits of lightweighting in terms of mass, which are compared to potential increased manufacturing costs associated with complexities introduced due to lightweighting.
1. Introduction
Manufacturing plays an important role in the global economy through its job creation and production of goods. In 2017, industry provided employment for close to 25% of the global labor force of 3.43 billion people and accounted for 30% of the global Gross Domestic Product (manufacturing is the dominant contributor to industrial activities) [1]. Along with its role in the global economy, manufacturing has a significant environmental footprint due to its energy and resource consumption and its waste generation. Considering this, reducing the energy/resource consumption of manufacturing is important. In 2020, 36% of end-use energy consumption in the U.S. was attributed to the industrial sector [2], with a significant portion of the electricity being generated by fossil fuels [3]. Additionally, in 2018, worldwide industry accounted for about 42% of the electricity consumed, with 67% of the electricity being generated by fossil fuels [4].
Machine tools (MTs) are essential manufacturing equipment that shape and form raw material into desired products through grinding, cutting, bending, and forming operations. MTs are everywhere; the global demand for MTs for material removal (in terms of sales) grew from USD 119.7 billion in 2008 to USD 144.6 billion in 2018 and is projected to grow to USD 174 billion by 2023 [5]. MTs, such as lathes, mills, drill presses, and grinders, can vary greatly in size, from fitting on a tabletop to filling an entire room. They also vary in complexity and technology, and over time, they have become more automated, accurate, and powerful.
MTs have a significant environmental impact and reducing this impact is necessary to reduce manufacturing’s large environmental footprint. Across an MT lifecycle, most of the environmental impact associated with a machine is due to its use stage, in particular, the energy consumed during MT use. Assuming an MT has a life of 10 years, based off of global demand data for 2008, 2013, and 2018 from Freedonia Focus Reports [5], it is estimated about 15 million MTs were in service during 2018. This set of MTs consumed approximately 50 TWh of energy per year (calculated from data of Diaz et al. [6]). This means that just a 10% energy reduction via an improved MT design will reduce energy consumption by 5 TWh. This saved energy can power about 480,000 houses for a month [7].
One potential strategy to reduce MT energy consumption is lightweighting. Lightweighting is a design strategy that lowers energy consumption of a product by reducing its mass since smaller masses require less energy to move. Lightweighting of MTs is accomplished by reducing the mass of moving components. Kroll et al. [8] found that lightweighting of MTs has the potential to reduce energy consumption, improve acceleration capability, and enhance process stability. Herrmann et al. [9] also examined lightweighting of MTs, and, more broadly, lightweighting of components and products, and found the energy savings in the use stage more than offsets any additional impacts occurring during the manufacturing stage, e.g., using a more energy-intensive material, such as replacing steel with aluminum.
However, reducing the mass of an MT, or any product, generally requires more than a simple material change. Design changes may be required, such as dimensional changes, due to differences in material stiffness, hardness, etc. A result of these design changes may be that the material cost for an MT is less, but the design changes may also have unintended or undesired consequences. One major concern from lightweighting is the potential increase in the cost to manufacture the machine. While lightweighting may reduce a user’s operation cost during the MT use stage through energy reduction, design changes could increase the complexity of the machine and the manufacturing processes needed to fabricate components to build the machine. As a result, the cost to build a lightweight MT may be larger than a standard MT. If cost significantly increases, MT builders may be hesitant to implement lightweighting—especially if the overall lifecycle cost to a customer will be higher. Therefore, it is important to understand the cost drivers of MTs, including how much of the cost is driven by the mass of the MT or materials in the MT and how much of the cost is due to the complexity of design, i.e., whether additional complexity will outweigh the reduction in mass in terms of cost.
Currently, there has been no investigation into how lightweighting with the intent to reduce energy consumption affects the MT cost. Therefore, this paper explores the cost drivers associated with building an MT. This is accomplished by collecting data on the features associated with a wide variety of MTs and the associated cost/price of the machines. Ideally the cost to manufacture the MT would be used in place of the price, but since MT builders are hesitant to provide that data, the price of the machine is used instead. Per personal communications [10], MT builders price their machines close to the manufacturing cost since the MT industry is extremely competitive. Therefore, in this paper, it is assumed the price of the machine is proportional to the cost to manufacture the machine; there is a consistent markup among the machines. This markup is assumed to be equal to the S&P 500 Operating Profit Margins for Industrial Machinery, which is 12.9% for 2021 [11]. Then, empirical models will be fit to this MT data. First, simple linear regression models are fit to individually assess the relative importance of each feature in describing the variation in price data. Then, using stepwise regression, empirical models are fit for the price based on the features, as the features are not independent of each other. The resulting cost/price models are examined to reveal insights into how design changes (i.e., differences among the MTs) affect the overall cost/price of the MT. While these models may not consider aspects such as some of the technology in the MT, they allow us to link environmentally minded design changes (lightweighting) to the cost of MTs. The remainder of this paper is organized as follows. Section 2 reviews the environmental impact of MTs, the potential impact reduction through lightweighting, lightweighting cost implications, and cost models related to MTs and manufacturing. Data collection and model formulation are described in Section 3, along with the results. Section 4 discusses the MT cost drivers, the implications of the results, and how this model can be used in the design of lower-energy-consuming MTs. Finally, Section 5 concludes the paper and provides insights for future directions.
2. Literature Review—Environmental Impact Reduction, Lightweighting, and Costs
Due to the importance of MTs and their impact on the environment, this section reviews methods to reduce their carbon footprint, methods for lightweighting MTs, cost implications of lightweighting, and cost models related to manufacturing and MTs.
2.1. Machine Tool Environmental Impact Reduction
MTs contribute significantly to manufacturing’s environmental impact through their considerable carbon footprint and widespread use. Much of an MT’s carbon footprint is due to its energy consumption during use. Because of the significant energy consumption and carbon footprint of MTs, much work has been carried out to reduce their environmental impact. This subsection reviews reported efforts for reducing MT energy consumption and environmental impact.
A foundational study by Dahmus and Gutowksi [12] showed how cutting can account for only a portion of the total energy consumed by MTs. Dahmus and Gutowski studied multiple MTs and found that the supporting systems, those not directly related to cutting, can account for a large portion of the MT energy consumption. Zein [13] showed that the power demand of an MT, including the demand of the support systems, has become more complex due to the implementation of automation. Therefore, it is important to look at a variety of strategies to reduce MT energy consumption.
According to Flum et al. [14], methods for reducing MT energy consumption include energy recovery (e.g., thermoelectric devices to recover waste heat), energy demand reduction, and energy reuse (e.g., kinetic energy associated with spindle braking/deceleration is converted to electrical energy). Much work has focused on energy demand reduction and is covered here as well. Energy demand reduction research can be conducted by process-related and machine-related efforts [14] that are expanded upon in the following subsections.
2.1.1. Process-Related Improvements for Energy Reduction
Toolpath selection is an important part of process design, and the proper choice of a toolpath may lead to reduced energy consumption. Li et al. [15] presented a methodology to optimize toolpaths for lower energy consumption and carbon footprint in the milling process. The authors used their method to find toolpaths and then compared these with conventional milling toolpaths; the proposed method reduced the toolpath length and resulted in energy savings of up to 21%. Hu et al. [16] explored the relationship between processing sequence of features of a part (PSFP) and the energy consumption during the transition between features. The authors applied a depth-first search and genetic algorithm (GA) to find the optimal PSFP and achieved a 28.6% energy reduction during feature transition.
Cutting conditions can also be modified to reduce energy consumption. Jdidia et al. [17] used particle swarm operation (PSO) to optimize the cutting parameters to lead to a lower energy consumption during milling operations. The authors optimized the parameters of rotational speed, feed per tooth, and axial depth of cut. Mori et al. [18] measured power consumption of machining centers under various conditions with a goal of choosing better process parameters. The authors found that for drilling and face/end milling, energy consumption can be reduced by setting cutting conditions to a high feed/speed condition but within a range that does not compromise tool life or surface finish. Beyond the issue of energy consumed during cutting, Diaz et al. [19] noted that many elements within an MT consume energy (e.g., controller, cutting fluid pump, chip conveyor), and that the energy consumption of these elements allocated to a single component can be lowered by reducing the cycle time per component (the noncutting energy is allocated to more components). It should be noted that these works related to cutting parameters and conditions considered conventional cutting as opposed to high-speed machining (HSM), where cutting conditions differ greatly. During HSM, it has been found that forces can decrease with an increased cutting speed, and a higher dimensional accuracy and surface quality can be achieved for certain materials of workpieces [20]. It is also important to note that if a machine sits idle between jobs, even if the cutting time has been reduced based on Mori et al. [18] and Diaz et al. [19], any energy savings is lost due to the machines running but not cutting parts.
Modifying machine and component states can also reduce energy consumption. Schlechtendahl et al. [21] designed a control system to change the state of systems and components in the MT for energy consumption reduction. The control system would change the state to a lower energy consumption state if possible. Can et al. [22] proposed a method to shut down components and subsystems of MTs during nonproductive periods while allowing them the ability to produce components on demand. The authors were able to shut down two components during an idle state, while not compromising the readiness of the machine, and reduced energy consumption by 25% when compared to a machine with all components running while idle.
2.1.2. Machine-Related Improvements for Reducing Environmental Impact
A strategy of machine-related improvements for energy reduction is designing machines with more energy-efficient components and systems. Albertelli [23] investigated the energy-saving potential of a spindle direct drive. The author analyzed two spindle units, one traditional gear-based spindle and one direct-drive spindle. It was found that up to 7% of the overall MT energy consumption can be saved by replacing a traditional gear-based spindle with a direct-drive spindle system. Mori et al. [24] investigated the energy consumption of a hot-gas-bypass spindle cooling system. The authors proposed an on–off cooling method that could reduce the power consumption of the cooling unit by up to 75% with minimal thermal displacement. Zhao et al. [25] explored the relationship between tool geometry, i.e., geometric angles, and energy consumption. The authors employed a multi-objective optimization model to optimize tool geometry, e.g., cutting-edge diameter, helix angle, and rake angle, along with cutting parameters. From the results, the authors found an average energy savings of 16.6%.
Another machine-related improvement strategy is component structure and arrangement. One example of this strategy is demonstrated by Gao et al. [26], where energy consumption of a hydraulic press was reduced by optimizing the size of the clearances. Clearance size affects the amount of oil leakage and friction but can also impact forming accuracy. The authors optimized the clearance size to minimize energy loss while not impacting forming accuracy. Lightweighting is another example of this strategy. Since lightweighting is the focus of this paper, it is discussed in its own section.
2.2. Lightweighting Design to Reduce Environmental Impact
Lightweighting strategies usually fall into one of three categories: change in material type, manufacturing-enabled design improvements, and product structure change. Lightweighting via a material change involves replacing a high-density material with a lower density material, e.g., replacing steel with aluminum or titanium. Implementing manufacturing-enabled design improvements for lightweighting involves the use of “new” manufacturing methods that allow for the reduction of parts or amount of material. Examples include semisolid thixo-forming, tailor-rolled blanks, and additive manufacturing (to enable product changes not achievable with conventional manufacturing methods). Product structure changes involve the design/redesign to optimize the product structure. This includes topology analysis, shell design instead of frame construction, and the use of fewer subassemblies and fasteners. It should be noted that there is overlap in these three categories and that all require design changes, e.g., a change of materials requires dimensional changes due to different material properties.
Lightweighting has been used to reduce energy consumption and environmental impact (through CO2 linked to energy consumption) of products, especially in the transportation sector. Lightweighting can also reduce an MT’s energy consumption (and CO2 linked to energy) when it is applied to moving components. This is due to a smaller mass needing less energy to move. Some applications of lightweighting MTs include the mass reduction of a gantry machine. Sulitka et al. [27] explored lightweighting of crossbeam and columns by applying composites and sandwich structures. The x-axis moving mass was reduced by 35% and the crossbeam and columns mass was reduced by 52.3%. This mass reduction allowed for the employment of a smaller motor with a 20% power reduction. Another lightweighting MT application includes lathes. Lv et al. [28] explored reducing the inertia of the spindle by using an aluminum chuck. The authors decreased the mass of the chuck by 60% and the reduced spindle inertia from 0.3354 to 0.2380 kg m2. This decrease in inertia reduced the energy consumption and peak power by 20.6% and 21.2%, respectively.
Other applications include milling machines. Zulaika et al. [29] explored lightweighting through thinner wall thicknesses in the ram. The authors decreased the mass while increasing stiffness with additional/redundant guideways of the frame. When redesigning the ram, the authors modeled machine dynamics and representative milling operations. Suh et al. [30] lightweighted a large computer numerical control (CNC) MT by reducing the mass of the horizontal and vertical slides by 26% and 34% respectively. Carbon-fiber-reinforced polymer (CFRP) composite sandwiches were bonded to welded steel structures to reduce the mass. This also increased damping without reducing stiffness and allowed for greater acceleration and deceleration. Zhao et al. [31] designed a lightweight working table through different construction methods: hollow stem, sandwich node, and radial root. To determine which construction method should be applied, the authors used a fuzzy assessment to assist in the design. Another application of lightweighting milling machines proposed by Triebe et al. [32,33] lightweighted the MT slide table. Since the table moves throughout the use of the machine, for many types of mills, there is potential to reduce energy consumption within the feed system. In Triebe et al. [32,33], the authors proposed a GA to optimize the core of a sandwich structure table. Various types of sandwich structures were proposed, including metal foam core, honeycomb core (cells running vertically), and a single row of cells running horizontally. The proposed method allowed for a mass saving of up to 50%. This application is discussed in more depth in Section 4.
2.3. Embodied Monetary and Environmental Costs of Materials
Cost of materials is very important within manufacturing. According to Kalpakjian and Schmid [34], the approximate breakdown of costs in manufacturing is as follows:
- Design: 5%.
- Material: 50%.
- Direct Labor: 15%.
- Overhead: 30%.
While this is true in general, researchers may wish to develop cost breakdowns more appropriate to specific applications, e.g., MTs. However, as, in general, materials make up approximately 50% of the manufacturing cost, it is important to consider both the type and amount of each material being used. This breakdown also helps to explain the economic motivation for lightweighting: reduce the amount of materials to decrease the product cost, though the method of lightweighting must be considered. For example, if lightweighting is accomplished by a material change, then the new material cost must be considered. Ashby [35] provided approximate ranges of material prices; the price range of metals from Ashby can be found in Figure 1a.
If lightweighting is accomplished through a product structure change or manufacturing improvement, e.g., reducing the number of subassemblies and fasteners through bonded structures or switching from high-pressure die-casting to super-vacuum die-casting, then the new method of manufacturing must be considered. Allen and Swift [36] calculated the costs of various manufacturing methods and showed that cost depends on both the type of process being used and on how many parts are being made. This occurs for a number of reasons, including the cost of the machinery and how long it takes to pay off the machine or machines.
Besides material and manufacturing costs, lightweighting can reduce energy costs and CO2 emissions. Reduction of energy and CO2 emissions during the use stage has already been described in Section 2.2. However, there is potential for reducing energy and CO2 further upstream in the lifecycle. This potential comes from the extraction and processing of the materials. Reducing the amount of material or substituting the material with a lower embodied energy and carbon footprint can reduce the upstream energy and CO2 emissions. Figure 1b shows which materials have lower energy and carbon footprints, and which materials have the largest potential for reducing upstream impacts. In 2018, approximately 18.6 GJ of energy was consumed per metric ton of iron and steel produced [37]. The iron and steel industry produced 2.1 Gt of CO2 [38], while 1.82 Gt of crude steel were produced worldwide [39]. This means that for every kilogram of steel reduced in an MT, 5.167 kWh of energy and 1.15 kg CO2 are saved during the extraction and processing of the ore to produce the steel.
2.4. Manufacturing and MT Cost Models
Manufacturing and MT-related cost models typically consist of lifecycle cost (LCC) models, total cost of ownership (TCO) models, and machining cost models. There are a few cost models associated with the acquisition of large pieces of manufacturing equipment. All these different types of cost models are reviewed here.
LCC consists of all costs related to a product from conception to end-of-life [40]. LCC models of MTs include that of Enparantza et al. [41], who built an LCC calculation and management program that had a goal of providing LCC data to customers when purchasing a machine and to assist in the design of MTs. The program allowed for the calculation of LCC costs and performance data. Bengtsson and Kurdve [42] performed an LCC analysis on turning equipment at an automotive driveline manufacturing company to see if the machines, which were past their life length, should be replaced, reconditioned, or run with increased cost and risk. Using project costs, acquisition costs, operation costs, and maintenance costs, the authors found that purchasing a new machine would have the lowest LCC due to lower life support costs and life operations cost.
Total cost of ownership (TCO) is similar to LCC, but instead of adopting the product perspective (costs related to the product from conception to end-of-life) as LCC does, TCO adopts the purchaser’s perspective (costs incurred by the purchaser from purchase to disposal) [43]. Roda et al. [44] proposed a methodology to build a TCO aimed at supporting decision-making for manufacturing asset lifecycle management. The requirements to address were uncertainty in asset operations, systemic performance losses, and quantifying costs. Heilala et al. [45] developed a TCO through component-based simulation, overall equipment efficiency (OEE), and cost of ownership to assist in the design of modular assembly systems. The authors broke down costs into fixed and recurring or variable and used a simulation of a semiautomated assembly line as a case study.
Other authors explored the costs of machining. Anderberg et al. [46] connected productivity and cost-efficiency improvements with energy savings by building a machining cost model that included energy and carbon costs. The machining costs comprised MT costs, labor costs, and tool change costs, while energy costs included energy directly and indirectly related to machining, e.g., costs associated with unloaded motors, fans, and running of computers. Wang and Liang [47] proposed a method to ensure quality and reduce production costs through addressing tolerance, process selection, and machining parameter optimization. To calculate production cost, the authors considered machining cost, quality cost, and expected cost to machine a feature.
Work related to acquisition cost models for MTs and other large equipment includes that of Ciurana et al. [48], who built two cost models for vertical high-speed machining centers based on machine characteristics. These models included a buyer’s cost model and a manufacturer’s cost model. These were built through multiple regression analysis (MRA) and artificial neural networks (ANN), and ANN was found to create more accurate cost models. Chen and Keys [49] presented a method to model the total cost of heavy equipment, including their use. The authors’ model included the delivered costs (cost of the machine plus its delivery), installation costs, cost of securing capital, miscellaneous ownership costs (e.g., taxes), and operating costs (maintenance, energy, and operators’ costs). Thokala et al. [50] examined the lifecycle costs of an unmanned aircraft vehicle (UAV). The authors defined acquisition cost as the sum of each individual component and defining characteristics such as material, type of component, and manufacturing method. The authors then approximated repair costs through a simulation that calculated how often a UAV would require repairs. Roth et al. [51] examined the costs of automobile bodies to determine if aluminum could be a cost-effective alternative to steel. The motivation for this switch comes from the regulatory pressures to meet fuel efficiency and recycling standards. From the study, the authors found that for small and midsize automobiles, material cost was the second largest contributor, with tooling cost being the first.
3. Cost Model Development
The cost to manufacture an MT depends on many factors, such as the size, number of axes, and capability of the MT. Understanding how these characteristics and specifications affect cost is important to both customers and manufacturers. For customers, being able to choose a machine that will satisfy their requirements and be within budget is very important. For MT builders, knowing how design changes will affect the final cost is also important. It can allow for design improvements that reduce an MT’s energy consumption without significantly increasing the price of the machine. With this knowledge, manufacturers may be better equipped to reduce environmental impact through lightweighting without increasing manufacturing cost. To investigate the relationship between costs and various MT features, data on the features associated with a wide variety of MTs and the associated prices of the machines were collected. As MT builders are hesitant to supply the cost to manufacture their machines, the price of the machine was used in place of cost to manufacture the machine. Per personal communications [10], MT builders price their machines close to the manufacturing cost since the MT industry is extremely competitive. Therefore, it is assumed that as the price of the machine is proportional to the cost to manufacture the machine; there is a consistent markup among the machines. This markup is assumed to be equal to the S&P 500 Operating Profit Margins for Industrial Machinery, which is 12.9% for 2021 [11]. Two sets of empirical models were then fit to this MT data: simple linear regression models and stepwise regression models; stepwise regression was employed as the features are not independent of each other. The resulting cost/price models, though built from price data instead of manufacturing cost data, reveal insights into how differences among the MTs affect the overall cost/price of the MT. This section describes the data collection and formulation of the model and demonstrates the results.
3.1. Data Collection and Model Formulation
The data collected includes various MT features and specifications in terms of capabilities, sizes, and complexities. This data is used to build a model that considers a wide range of machines. This section describes the data collection and construction of the model.
3.1.1. Data Acquisition
Data was acquired from three MT builders who were willing to provide price data: Hurco, Mazak, and Haas. All the machines were CNC vertical milling machines. These included a range of sizes and capabilities of MTs across the three different companies. Information from Hurco, Mazak, and Haas was retrieved by various means, e.g., literature from distributors and company websites. Hurco provided basic specifications of MTs on their website but had no pricing information. However, a distributor provided price information and a catalog of three machines with detailed specifications. Similarly, Mazak only provided basic specifications on their website. A distributor provided more in-depth catalogs as well as price ranges from the least to the most expensive. It was assumed that the extremes of the price range accurately reflected the extremes of the machines. A total of four Mazak machines were analyzed. The Haas website provided the specifications of each machine as well as their pricing. A total of 72 machines were considered.
A single dataset was created using only the data provided by the Haas website. This dataset included 72 MTs and considered a range of machine types. A second dataset was constructed from the data provided by the three companies. However, due to having far more data from Haas, not all the Haas machines were included in the multi-company dataset to avoid skewing the results (a comparable number of each company’s machines were included in the dataset). The multi-company dataset had 3 Hurco MTs, 4 Mazak MTs, and 13 Haas MTs. Of these machines, both 3-axis and 5-axis machines were included from different series.
When building the Haas dataset, 16 variables were used. For the multi-company dataset, not all features could be found for all three companies, and therefore less features were included than for the Haas-only dataset. The multi-company dataset included 12 variables. The MT price was used as the dependent variable (response). The 16 features for the Haas dataset (e.g., working volume, travel in the x, y, and z axes, maximum speed, number of axes, and mass) and the 12 features for the multi-company dataset served as the independent variables. The Haas dataset can be found in Table 1. However, due to confidentiality concerns, the data provided by Hurco and Mazak are not provided in this paper, although a total list of features can be found in Table 2. For both datasets, the features were standardized using Equation (1):
where QC is the coded (standardized) value, Qmax is the maximum value of the features, Qmin is the minimum value of the features, and QU is the uncoded feature value. Standardization provides for similar scaling among all the features.
3.1.2. Model Formulation
There are many features of an MT, and the price is not impacted equally by each feature. With the goal of finding the major price drivers (assuming cost to manufacture is correlated to the price of the machine), it is important to find which features have the largest impact on the price of the MT. Specifically, given our interest in lightweighting, it is important to find out if the mass of an MT significantly impacts its price. Working with the two datasets (Haas and multi-company), two types of models are built: simple linear regression models and stepwise regression models. We first explored simple linear regression to individually assess the relative importance of each feature in describing the variation in price data. Then, using stepwise regression, we developed empirical models for the price based on the features, as the features are not independent of each other.
Simple linear regression was used to build models relating each feature individually to price. The linear regression models provide an initial view as to which features are most influential to the price of the machine through an R2 value. The R2 value describes how much of the variation in the price data is described by the feature (independent variable). These models were built for both the Haas dataset (16 features) and the multi-company dataset (12 features). These results can be found in Table 2. As is evident from the table, the features whose models have the highest R2, larger than 50%, are identified (shaded). For the Haas dataset, these high-impact variables are mass, volume, z-axis travel, and x-axis travel. For the multi-company dataset, these high-impact variables include mass, x-axis travel, spindle torque, y-axis travel, and z-axis travel. The significance of mass comes from the cost of materials. Volume is tied closely to mass and would therefore be significant in determining price. This is similar for x-, y-, and z-axis travel. The reason for torque being important in the multi-company dataset but not in the Haas dataset could be due to the Haas dataset representing a wider range of sizes and types of vertical milling machines.
With some understanding of the relative importance of each variable on price for the different datasets, attention now shifts to developing a single empirical model for MT price for each dataset. We might initially consider employing a standard multiple linear regression model. Such a model envisions that the predicted price is the sum of terms (one for each independent variable), with each term (or predictor) being the product of the independent variable and a coefficient. If desired, terms (predictors) may also be added to consider interactions among features (for an interaction term, the independent variable is the product of the feature values, e.g., volume x mass). Conventionally, we can then drop terms from the model that are not important. However, for our datasets, the variables are not independent of one another. For example, if the x-axis travel distance increases, this would most likely increase the volume of the machine as well as the mass. This can be seen in that in a more productive machine, greater power and cutting speeds will require greater stiffness and moment of inertia. This would potentially mean larger mass in the structural components. This relationship can be seen in Table 3 and Table 4, where Table 3 shows the variance–covariance matrix for the Haas dataset and Table 4 shows the variance–covariance matrix for the multi-company dataset. The variance is shown in bold across the diagonal, and significant covariances (those greater than the respective variance) are shaded. It can be seen there are a number of interactions between the variables. Therefore, if building a model through multiple linear regression, dropping a term (or adding one) may have a dramatic effect on the other terms. To understand which features are important in determining the price of the machine when the explanatory variables are not independent, stepwise regression is often employed, and this was the method we utilized in this case.
The goal of stepwise regression is to iteratively develop a multi-term (multi-predictor) regression model for the response. The procedure to accomplish this goal includes three steps and can be seen in Figure 2. The process starts by fitting a simple linear regression model for each variable (i.e., find a coefficient for each variable). A t-test is performed to judge the significance of each model coefficient (a p-value is determined). Each p-value (significance value) is then compared to the significance-to-enter value, αE. If any of the significance values are smaller than αE, then the coefficient with the smallest significance value is chosen. Now that a starting single-variable model is available, the process moves on to the second step of testing terms not in the model. Similar to the first step, regression models are fit for each variable not in the model. These regression models include the variable(s) already in the model plus an additional variable to be tested. A significance test is then performed for each of the models and the corresponding p-value determined. Each p-value (significance value) is compared to the αE. If any of the p-values is smaller than αE then the term with the smallest significance value is added to the model. This second step is repeated until no more terms can be added to the model. The process then moves on to the third and final step. In this step, the features in the model are tested to see if their significance has changed due to the addition of other terms. The significance of the terms in the most up-to-date regression model are evaluated (corresponding p-values calculated), and each p-value (significance value) is compared to the significance-to-remove value, αR. If any terms have a significance greater than αR, then the term with the largest p-value is removed. The model is then refit and the step is repeated until no more terms can be removed; then, the process stops.
From the stepwise regression, it was found the top three influencers of price for the multi-company dataset are mass, volume, and spindle power; for the Haas dataset, the top three influencers of price are number of axes, mass, and spindle speed.
3.2. Cost Model Results
From the data provided by the MT builders, multiple empirical cost (price) models were created: simple linear regressions for each feature of both datasets, a stepwise regression for the multi-company dataset, and a stepwise regression for the Haas dataset. The simple linear regression model results can be found in Table 2. The coded (standardized) stepwise regression model for the Haas dataset can be found in Equation (2) and the uncoded model can be found in Equation (3). The coded (standardized) stepwise regression model for the multi-company can be found in Equation (4) and the uncoded model can be found in Equation (5). The nomenclature and data ranges for the stepwise models can be found in Table 5. In the models, a subscript of “C” represents a coded value (standardized), and a subscript of “U” represents an uncoded value (not standardized). The standard error and p-values for the Haas model can be found in Table 6 and the standard error and p-values for the multi-company model can be found in Table 7.
4. Discussion
From the results presented above, a number of conclusions may be drawn as to the main cost drivers of an MT (price was used to build the models, but it was assumed price is proportional to cost to manufacture the MT). This section discusses these results and implications, along with methods to design MTs considering both energy and cost.
4.1. Cost Drivers
From the results in Table 6 and Table 7, and Equations (2)–(5), several observations about cost drivers can be made. The first model, Haas only (results in Table 6), shows that the complexity of the MT (as represented by the number of axes), machine size (shown by mass, volume, and x- and y-axis travel), and MT capability (represented by spindle speed and spindle power) have the most significant impact on the price of the machine. The number of axes has the largest impact on price, followed by mass, then spindle speed, volume, and finally x- and y-axis travel. The second model, multi-company (results in Table 7), shows similar results in that size (represented by mass and volume) and machine capability (represented by spindle power) significantly affect machine price. The model shows that mass has the largest impact, followed by volume, with spindle power having the smallest impact of the three.
These results show that mass is very important in determining the price of the machine; this is undoubtedly due to the fact that greater mass means larger material costs. Volume and x- and y-axis travel are also shown to be important. However, these variables also relate to the mass of the MT and the associated material costs. This is consistent with the discussion in Section 2.3 regarding how material cost plays a significant role in the cost of the product (in this case, the cost of an MT). With both models showing mass to be a significant cost driver, it can be concluded that lightweighting an MT should reduce the overall machine price. However, since mass and size of the MT are not the only price drivers, other design elements should still be considered. These include the complexity of the MT (seen by the number of axes) and the capability of the MT (spindle power, spindle speed, and x- and y-axis travel). The three price driver categories are summarized below:
- Size (mass, volume, x- and y-axis travel).
- Complexity (number of axes).
- Capability (spindle power spindle speed, x- and y-axis travel).
What is not described though in the model is the design of the technology, e.g., material choice, control, and drive selection, which is required for HSM. These may have a significant impact on cost beyond some of the features described in the model. Further investigation into the technology and design of the machines may be required. In addition, these machines may not necessarily be optimized in their design due to many being modular in order to meet many different requirements. This will also impact the cost model.
4.2. Case Study: Design of MTs with Consideration of Energy and Cost
With an understanding of how the mass of the MT, more specifically the materials, affects the price of an MT, strategies may be implemented to consider both energy and cost while designing a machine. This section explores design methods that consider both energy and cost based on prior work of the authors.
4.2.1. Lightweighting Design Method
Previous work of the authors [32,33] explored lightweighting the table of a milling machine to reduce its energy consumption. The table was chosen since it moves throughout cutting and provides potential for energy reduction during the use of the machine. Other components within the MT will provide a greater opportunity for mass reduction and, therefore, price reduction, e.g., the housing and columns, but do not move and will not provide the energy savings during use. Since the goal of this paper is to examine how lightweighting with the intent of reducing energy consumption will impact the cost of the machine, the table was chosen.
Both papers proposed Gas to design the table with reduced mass. Triebe et al. [32] examined and compared two lightweight sandwich panel designs, i.e., a honeycomb core and a metal foam core, to a solid table. The GA varied parameters such as honeycomb core thickness and height to search for designs that minimized mass while minimizing bending. Triebe et al. [33] also searched for lightweight sandwich panel table designs. These designs consisted of a single row of cross-sectional beams that run along the length of the table. An example with square cross-sections (or cells) is shown in Figure 3. The GA searches for shapes of cells that minimize the mass of the table while maximizing its resistance to bending (stiffness); stiffness was assumed to be proportional to the inverse of the moment of inertia (MoI) and polar moment of inertia (PMoI). The GA found that cells with an I-shaped cross section were best suited to reduce mass while retaining strength. The final design was compared to a solid table design using finite element analysis (FEA), and it was found that the I-shaped cross-section design did deflect more under a load than the solid table, but the deflection was small.
GA was chosen to search for table designs due to its ability to find multiple solutions, allow for multiple objectives, and for its ability to demonstrate tradeoffs between the objectives. This allowed for the comparison between mass and stiffness. GA also reduces the chance of convergence at a local optimum through the introduction of mutations and broad consideration/searching of the entire solution space. The final population of solutions provides various design options that allow for a choice with an acceptable stiffness and a small mass.
When lightweighting the table, it is important to consider vibrations since vibrations contribute to the precision of the machine and quality of the finished part. A lighter-weight table can increase vibrations due to a potential decrease in the natural frequencies as a result of the lower mass. Future work will explore the dynamic performance of the lightweight table. However, for this paper, the reduction in mass with its impact on cost is the focus in the following subsections.
4.2.2. Including Cost/Price and Energy in the Design
With the cost model built in Section 3 (price was used to build the model but it was assumed price is proportional to cost to manufacture the MT), MT cost can now be considered during design. Due to the link found in this paper between the mass of the MT and its cost, instead of adding MT cost as an objective, mass and cost can be considered simultaneously as a single objective. This allows for cost to be considered during design while attempting to reduce energy consumption. To consider MT cost simultaneously, the mass savings, calculated from comparing the lightweight table design to the original table design, is plugged into the equation and all other terms are deleted since they are not considered in the optimization. This will provide a cost (price) savings. For an estimation of total cost (price), the rest of the machine tool specifications should be included in the calculation.
Since lightweighting reduces the amount of materials in the MT, as is in the case of Triebe et al. [32,33], upstream energy consumption and CO2 can also be considered in the design of the MT. This is similarly accomplished by including the relationship between materials and energy consumption/CO2 within the GA. However, if switching between materials, energy and CO2 will change. These relationships between material and energy/CO2 can be found in Figure 1b.
4.2.3. Example: Lightweighting Table
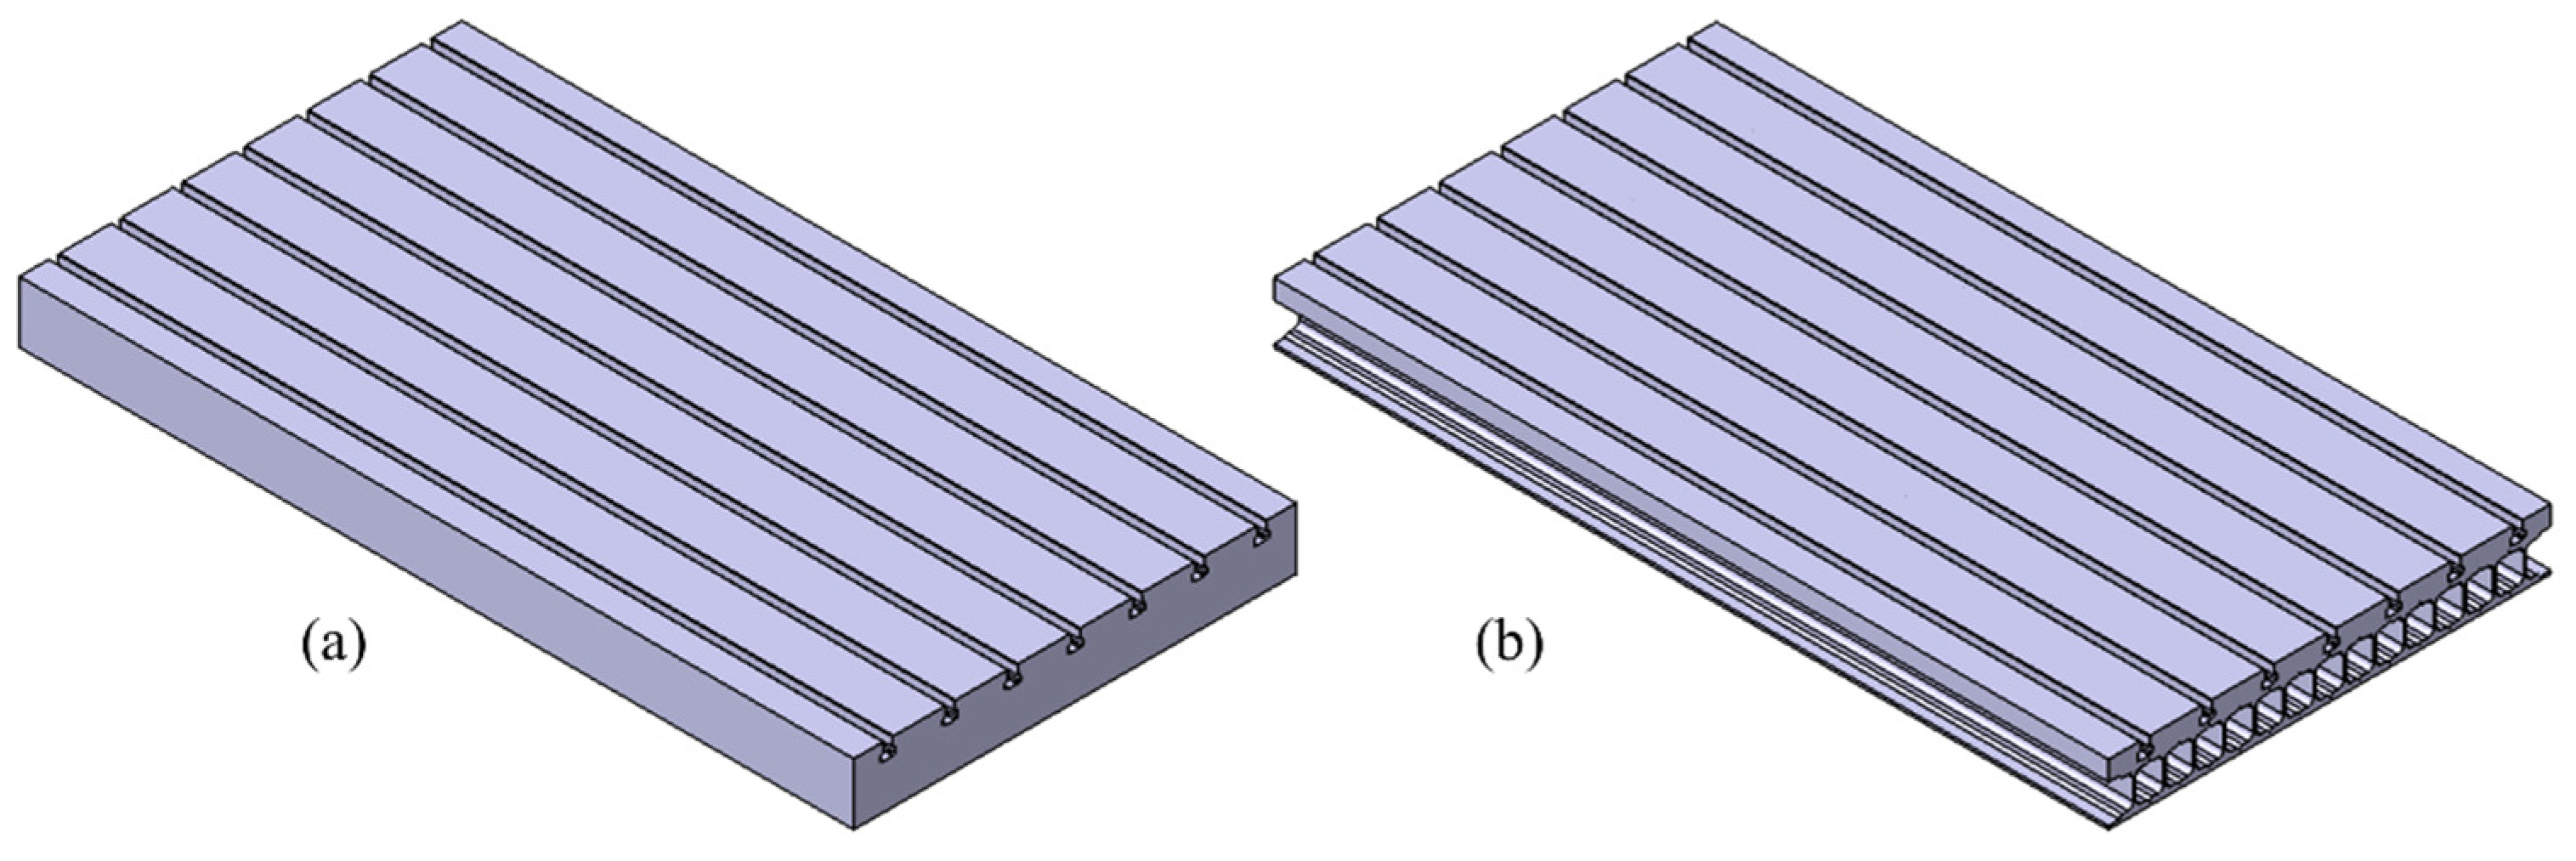
Using the lightweighting method outlined in Triebe et al. [33], the cost (price) savings along with upstream CO2 and energy savings can be calculated. The standard table (shown in Figure 4a) is considered as a baseline for comparison purposes. This table is assumed to be made from steel and has dimensions of 889 × 1676 × 122.9 mm with a mass of 1370 kg. A lightweight table design is shown in Figure 4b and has the same dimensions as the solid table but has a mass of 687 kg. With a mass savings of 683 kg, the manufacturing cost savings and the savings from reduced mass in terms of embodied energy and CO2 can be calculated. This is dependent on how the table is manufactured, e.g., if the table is machined from the same amount of material as the first table, then there will be no embodied energy savings. Embodied energy and CO2 savings are calculated using the values in Figure 1b (N.B., there will also be energy and CO2 savings during use of the reduced mass table, but this issue is not considered here). Changes to the machine tool that might be possible owing to a table with reduced mass are also not considered here; for example, a smaller motor may be possible when the table has reduced mass. However, these other design changes will most likely not increase the overall mass (in fact, it is more likely that they will reduce the mass even further). Therefore, assuming strictly a reduction in table mass can provide a lower bound to any savings resulting from the mass reduction. The cost/price, embodied energy, and embodied CO2 savings can be found in Table 8. The cost/price savings is about half, but some savings is lost to a greater complexity of design.
Complexity of the MT is considered in the cost/price model through the number of axes. However, this would be difficult to apply to a change in complexity of other components and systems of the MT. To further explore the issue of MT complexity, estimations of cost for the solid table design and the lightweight table design are compared from Figure 4.
To manufacture the solid table from Figure 4a, first, the table would be cast. Then, the sides and top and bottom would be machined to the required dimensions. Finally, the t-slots would be machined. To manufacture the lightweight table from Figure 4b, more processes are needed. To build the core of the sandwich panel design, the I-shaped beams are rolled and then cut to length. Then, the beams are arranged horizontally, as shown in Figure 4b, and joined to the top- and bottom-facing plates. Both the bottom- and top-facing plates are made from rolled steel. The top plate includes machined t-slots.
The cost of the two tables can be calculated from the cost of each manufacturing step plus the material cost. It was assumed that the material cost for the solid table is about USD 4.50/kg. The mass of the cast plate was assumed to be 1620 kg, which is about 18% more massive than the finished plate; this extra material allowed for cleanup cuts to produce the final plate. The material cost of the 1620 kg cast plate is USD 7300. The casting and machining processes add a relatively small amount compared to the material cost. For the lightweight table, the cost of the I-beams, lower-facing plate, and upper-facing plate are about USD 1200, USD 800, and USD 2700, respectively. The cost to purchase the I-beams and plates is about USD 4700 (this includes the material and manufacturing costs) [52]. The joining and machining would add a relatively small amount compared to the material price. The cost to join and machine the lightweight table should be similar to the cost to cast and machine the solid table. As a result, there would be a cost savings of about USD 2600. While the savings is not as high as predicted (see Table 8), there is still a cost reduction due to lightweighting. Part of this difference may also be due to the fact that the models built in this paper were built from price data instead of cost data. This savings, though, is calculated from manufacturing cost data.
5. Conclusions
This paper has developed an empirical cost model for (or cost of an individual/company to purchase) an MT that may be used to estimate the economic benefits of lightweighting (reducing MT mass). Price data was used to build the model as MT builders are hesitant to provide cost data. Per personal communications [10], MT builders price their machines close to the manufacturing cost since the MT industry is extremely competitive. Therefore, it was assumed that price is proportionally related to cost; there is a consistent markup among the machines. This development effort was motivated by the concern that lightweighting to reduce energy consumption may increase the cost of the machine due to a more complex design. This model, though it was built from price data, provides the desired insight into how lightweighting affects MT cost. From building the cost model, it was found that the mass of the MT is a cost driver. This means that reducing the mass through lightweighting will reduce the MT cost due to less materials being used. However, the method of lightweighting must still be considered due to the potential for increasing the design complexity and, therefore, cost.
This cost model was built considering various features of the MT including mass, spindle power, and number of axes. Two datasets were developed from which empirical models for MT purchase price were created. The first dataset reflected information obtained from a single company (Haas), and the second dataset contained data from multiple companies (Haas, Hurco, and Mazak). Simple linear regression models were made for each feature considered from both datasets, and a stepwise regression model was built for both datasets. The simple linear regression models provided some understanding of the relative importance of each variable on price, but due to the variables not being independent of each other, the simple linear regression models may not be completely accurate. Therefore, stepwise regression models were built.
From the stepwise regression model built from the Haas-only data, it was found that the number of axes was the most significant cost driver, followed by mass. The following were also important, but the results show they were not as significant: spindle speed, volume, and x- and y-axis travel. Results from the multi-company dataset showed that mass was the most significant, followed by volume and spindle power. From these results, it is seen that lightweighting of an MT will not increase the cost of a machine; rather, it will decrease it. What is not described, though, in the model is the fine-tuning of the design or the modularity of the machines to meet various requirements. Further investigation may be required to describe these.
Using the slide table of a milling machine as an example, it was shown how cost, energy, and CO2 can be considered during the design of the MT. The table was chosen since it moves throughout cutting and provides a potential for energy reduction during the use of the machine. Other components within the MT will provide a greater opportunity for mass reduction and, therefore, price reduction, e.g., the housing and columns, but do not move and will not provide the energy savings during use. Since the goal of this paper is to examine how lightweighting with the intent of reducing energy consumption will impact the cost of the machine, the table was chosen. Previous work by the authors, Triebe et al. [32,33], showed how to reduce the mass of the table through a sandwich panel design. In these papers, the table design was optimized by a multi-objective GA. Using this approach, it was found that cost, energy, and CO2 could be included in the GA as an objective. In this manner, the MT slide table could be designed to reduce its mass and the MT cost, energy, and CO2 emissions while preserving the strength of the table.
This paper has made a number of key contributions and observations related to the cost modeling and the design of MTs for energy savings:
- This paper created a cost model of CNC vertical milling machines, assuming price of the machines is proportional to the cost to manufacture, based on various features of the MTs to find the cost drivers.
- Mass was found to be a significant driver for MT cost, and therefore lightweighting has the potential to decrease the cost of an MT, but complexity of design can reduce or even eliminate the cost savings, depending on the manufacturing processes and cost of material (if material is changed).
- This paper provides an example illustrating the potential cost, embodied energy, and embodied CO2 savings through the design of a vertical milling machine slide table.
It is suggested that future work should explore the application of lightweighting to other components and systems to further improve the energy efficiency of MTs.
Author Contributions
M.J.T.: investigation, data curation, formal analysis, writing—original draft presentation, review and editing; F.Z.: writing—review and editing, funding acquisition; J.W.S.: supervision, writing—review and editing, funding acquisition. All authors have read and agreed to the published version of the manuscript.
Funding
This work is supported in part by the U.S. National Science Foundation (Grant No. 1512217). Any opinions, findings, conclusions, and/or recommendations expressed are those of the authors and do not necessarily reflect the views of the U.S. National Science Foundation.
Data Availability Statement
The Haas machine data is publicly available and can be found on their website at https://www.haascnc.com/ (accessed on 6 October 2020). The machine data from Hurco and Mazak is not publicly available.
Acknowledgments
We gratefully acknowledge the contribution from Adriana M. Muñoz Soto for gathering machine tool data.
Conflicts of Interest
The authors declare no conflict of interest. The funders had no role in the design of the study; in the collection, analyses, or interpretation of data; in the writing of the manuscript, or in the decision to publish the results.
References
- The World Factbook: Economy—Overview; Central Intelligence Agency: Langley, VA, USA, 2017.
- EIA. Use of Energy Explained Energy Use in Industry. Available online: https://www.eia.gov/energyexplained/use-of-energy/industry.php (accessed on 1 May 2021).
- Annual Energy Outlook 2021 with Projections to 2050; U.S. Energy Information Administration: Washington, DC, USA, 2021.
- IEA. Electricity. Available online: https://www.iea.org/fuels-and-technologies/electricity (accessed on 1 May 2021).
- Freedonia Focus Reports. Global Machine Tools; The Freedonia Group: Cleveland, OH, USA, 2019. [Google Scholar]
- Diaz, N.; Helu, M.; Jayanathan, S.; Chen, Y.; Horvath, A.; Dornfeld, D. Environmental analysis of milling machine tool use in various manufacturing environments. In Proceedings of the 2010 IEEE International Symposium on Sustainable Systems and Technology, Arlington, VA, USA, 17–19 May 2010; pp. 1–6. [Google Scholar] [CrossRef] [Green Version]
- US EIA. How Much Electricity Does an American Home Use? Available online: https://www.eia.gov/tools/faqs/faq.php?id=97&t=3 (accessed on 1 May 2021).
- Kroll, L.; Blau, P.; Wabner, M.; Frieß, U.; Eulitz, J.; Klärner, M. Lightweight components for energy-efficient machine tools. CIRP J. Manuf. Sci. Technol. 2011, 4, 148–160. [Google Scholar] [CrossRef]
- Herrmann, C.; Dewulf, W.; Hauschild, M.; Kaluza, A.; Kara, S.; Skerlos, S. Life cycle engineering of lightweight structures. CIRP Ann. 2018, 67, 651–672. [Google Scholar] [CrossRef]
- Personal communication, 2021.
- Yardeni, E.; Abbot, J. S & P 500 Sectors & Industries Profit Margins (Quarterly); Yardeni Research, Inc.: Glen Head, NY, USA, 2021. [Google Scholar]
- Dahmus, J.B.; Gutowski, T.G. An Environmental Analysis of Machining. In Proceedings of the ASME 2004 International Mechanical Engineering Congress and Exposition, Anaheim, CA, USA, 13–19 November 2004; pp. 643–652. [Google Scholar]
- Zein, A. Transition Towards Energy Efficient Machine Tools; Springer Science & Business Media: Berlin/Heidelberg, Germany, 2012. [Google Scholar] [CrossRef]
- Flum, D.; Sossenheimer, J.; Stück, C.; Abele, E. Towards Energy-Efficient Machine Tools Through the Development of the Twin-Control Energy Efficiency Module. In Twin-Control; Armendia, M., Ghassempouri, M., Ozturk, E., Peysson, F., Eds.; Springer International Publishing: Cham, Switzerland, 2019; pp. 95–110. ISBN 978-3-030-02203-7. [Google Scholar]
- Li, L.; Deng, X.; Zhao, J.; Zhao, F.; Sutherland, J.W. Multi-objective optimization of tool path considering efficiency, energy-saving and carbon-emission for free-form surface milling. J. Clean. Prod. 2018, 172, 3311–3322. [Google Scholar] [CrossRef]
- Hu, L.; Liu, Y.; Peng, C.; Tang, W.; Tang, R.; Tiwari, A. Minimising the energy consumption of tool change and tool path of machining by sequencing the features. Energy 2018, 147, 390–402. [Google Scholar] [CrossRef] [Green Version]
- Ben Jdidia, A.; Hentati, T.; Hassine, H.; Khabou, M.T.; Haddar, M. Optimization of the Electrical Energy Consumed by a Machine Tool for a Coupled and Uncoupled Cutting System. In Advances in Materials, Mechanics and Manufacturing II; Springer: Cham, Switzerland, 2021; pp. 288–300. ISBN 9783030849573. [Google Scholar]
- Mori, M.; Fujishima, M.; Inamasu, Y.; Oda, Y. A study on energy efficiency improvement for machine tools. CIRP Ann.-Manuf. Technol. 2011, 60, 145–148. [Google Scholar] [CrossRef]
- Diaz, N.; Redelsheimer, E.; Dornfeld, D.; Houlton, S. Energy Consumption Characterization and Reduction Strategies for Milling Machine Tool Use. Manuf. Chem. 2011, 82, 22–24. [Google Scholar] [CrossRef] [Green Version]
- Jain, A.; Bajpai, V. Introduction to high-speed machining (HSM). In High Speed Machining; Elsevier: Amsterdam, The Netherlands, 2020; pp. 1–25. ISBN 9780128150207. [Google Scholar]
- Schlechtendahl, J.; Eberspächer, P.; Schraml, P.; Verl, A.; Abele, E. Multi-level Energy Demand Optimizer System for Machine Tool Controls. Procedia CIRP 2016, 41, 783–788. [Google Scholar] [CrossRef]
- Can, A.; Thiele, G.; Kruger, J.; Fisch, J.; Klemm, C. A practical approach to reduce energy consumption in a serial production environment by shutting down subsystems of a machine tool. Procedia Manuf. 2019, 33, 343–350. [Google Scholar] [CrossRef]
- Albertelli, P. Energy saving opportunities in direct drive machine tool spindles. J. Clean. Prod. 2017, 165, 855–873. [Google Scholar] [CrossRef]
- Mori, K.; Bergmann, B.; Kono, D.; Denkena, B.; Matsubara, A. Energy efficiency improvement of machine tool spindle cooling system with on–off control. CIRP J. Manuf. Sci. Technol. 2019, 25, 14–21. [Google Scholar] [CrossRef]
- Zhao, J.; Li, L.; Nie, H.; Chen, X.; Liu, J.; Shu, X. Multi-objective integrated optimization of tool geometry angles and cutting parameters for machining time and energy consumption in NC milling. Int. J. Adv. Manuf. Technol. 2021, 117, 1427–1444. [Google Scholar] [CrossRef]
- Gao, M.; Huang, H.; Liu, Z.; Li, X.; Sutherland, J. Design and Optimization of the Slide Guide System of Hydraulic Press Based on Energy Loss Analysis. Energies 2016, 9, 434. [Google Scholar] [CrossRef] [Green Version]
- Sulitka, M.; Novotny, L.; Sveda, J.; Strakos, P.; Hudec, J.; Smolik, J.; Vlach, P. Machine tool lightweight design and advanced control techniques. MM Sci. J. 2008, 2008, 30–34. [Google Scholar] [CrossRef]
- Lv, J.; Tang, R.; Tang, W.; Liu, Y.; Zhang, Y.; Jia, S. An investigation into reducing the spindle acceleration energy consumption of machine tools. J. Clean. Prod. 2017, 143, 794–803. [Google Scholar] [CrossRef] [Green Version]
- Zulaika, J.J.; Campa, F.J.; Lopez De Lacalle, L.N. An integrated process–machine approach for designing productive and lightweight milling machines. Int. J. Mach. Tools Manuf. 2011, 51, 591–604. [Google Scholar] [CrossRef]
- Suh, J.D.; Lee, D.G.; Kegg, R. Composite machine tool structures for high speed milling machines. CIRP Ann.-Manuf. Technol. 2002, 51, 285–288. [Google Scholar] [CrossRef]
- Zhao, L.; Ma, J.; Wang, T.; Xing, D. Lightweight design of mechanical structures based on structural bionic methodology. J. Bionic Eng. 2010, 7, S224–S231. [Google Scholar] [CrossRef]
- Triebe, M.J.; Zhao, F.; Sutherland, J.W. Achieving Energy Efficient Machine Tools by Mass Reduction through Multi-Objective Optimization. Procedia CIRP 2019, 80, 73–78. [Google Scholar] [CrossRef]
- Triebe, M.J.; Zhao, F.; Sutherland, J.W. Genetic Optimization for the Design of a Machine Tool Slide Table for Reduced Energy Consumption. J. Manuf. Sci. Eng. 2021, 143, 101003. [Google Scholar] [CrossRef]
- Kalpakjian, S.; Schmid, S.R. Manufacturing Engineering and Technology, 4th ed.; Schmid, S.R., Ed.; Prentice Hall: Upper Saddle River, NJ, USA, 2000; ISBN 0201361310. [Google Scholar]
- Ashby, M.F. Materials and the Environment Eco-Informed Material Choice, 2nd ed.; Butterworth-Heinemann: Waltham, MA, USA, 2012; ISBN 0-12-385971-9. [Google Scholar]
- Allen, A.J.; Swift, K.G. Manufacturing Process Selection and Costing. Proc. Inst. Mech. Eng. Part B J. Eng. Manuf. 1990, 204, 143–148. [Google Scholar] [CrossRef]
- IEA. Iron and Steel; International Energy Agency: Paris, France, 2020. [Google Scholar]
- IEA. Tracking Industry 2020; International Energy Agency: Paris, France, 2020. [Google Scholar]
- Steel Statistical Yearbook 2019; Worldsteel Association: Brussels, Belgium, 2019.
- Sherif, Y.S.; Kolarik, W.J. Life cycle costing: Concept and practice. Omega 1981, 9, 287–296. [Google Scholar] [CrossRef]
- Enparantza, R.; Revilla, O.; Azkarate, A.; Zendoia, J. A Life Cycle Cost Calculation and Management System for Machine Tools. In Proceedings of the 13th CIRP International Conference on Life Cycle Engineering, Leuven, Belguim, 31 May–2 June 2006; pp. 717–722. [Google Scholar]
- Bengtsson, M.; Kurdve, M. Machining Equipment Life Cycle Costing Model with Dynamic Maintenance Cost. Procedia CIRP 2016, 48, 102–107. [Google Scholar] [CrossRef] [Green Version]
- Saccani, N.; Perona, M.; Bacchetti, A. The total cost of ownership of durable consumer goods: A conceptual model and an empirical application. Int. J. Prod. Econ. 2017, 183, 1–13. [Google Scholar] [CrossRef]
- Roda, I.; Macchi, M.; Albanese, S. Building a Total Cost of Ownership model to support manufacturing asset lifecycle management. Prod. Plan. Control 2020, 31, 19–37. [Google Scholar] [CrossRef]
- Heilala, J.; Helin, K.; Montonen, J. Total cost of ownership analysis for modular final assembly systems. Int. J. Prod. Res. 2006, 44, 3967–3988. [Google Scholar] [CrossRef]
- Anderberg, S.E.; Kara, S.; Beno, T. Impact of energy efficiency on computer numerically controlled machining. Proc. Inst. Mech. Eng. Part B J. Eng. Manuf. 2010, 224, 531–541. [Google Scholar] [CrossRef]
- Wang, P.; Liang, M. An integrated approach to tolerance synthesis, process selection and machining parameter optimization problems. Int. J. Prod. Res. 2005, 43, 2237–2262. [Google Scholar] [CrossRef]
- Ciurana, J.; Quintana, G.; Garcia-Romeu, M.L. Estimating the cost of vertical high-speed machining centres, a comparison between multiple regression analysis and the neural networks approach. Int. J. Prod. Econ. 2008, 115, 171–178. [Google Scholar] [CrossRef]
- Chen, S.; Keys, L.K. A cost analysis model for heavy equipment. Comput. Ind. Eng. 2009, 56, 1276–1288. [Google Scholar] [CrossRef]
- Thokala, P.; Scanlan, J.; Chipperfield, A. Life cycle cost modelling as an aircraft design support tool. Proc. Inst. Mech. Eng. Part G J. Aerosp. Eng. 2010, 224, 477–488. [Google Scholar] [CrossRef]
- Roth, R.; Clark, J.; Kelkar, A. Automobile bodies: Can aluminum be an economical alternative to steel? JOM 2001, 53, 28–32. [Google Scholar] [CrossRef]
- MetalsDepot. Available online: https://www.metalsdepot.com (accessed on 1 August 2021).
Figure 1.
(a) Cost of materials based on mass (data taken from Ashby [35]). (b) Embodied energy and carbon footprint of various metals (data taken from Ashby [35]).
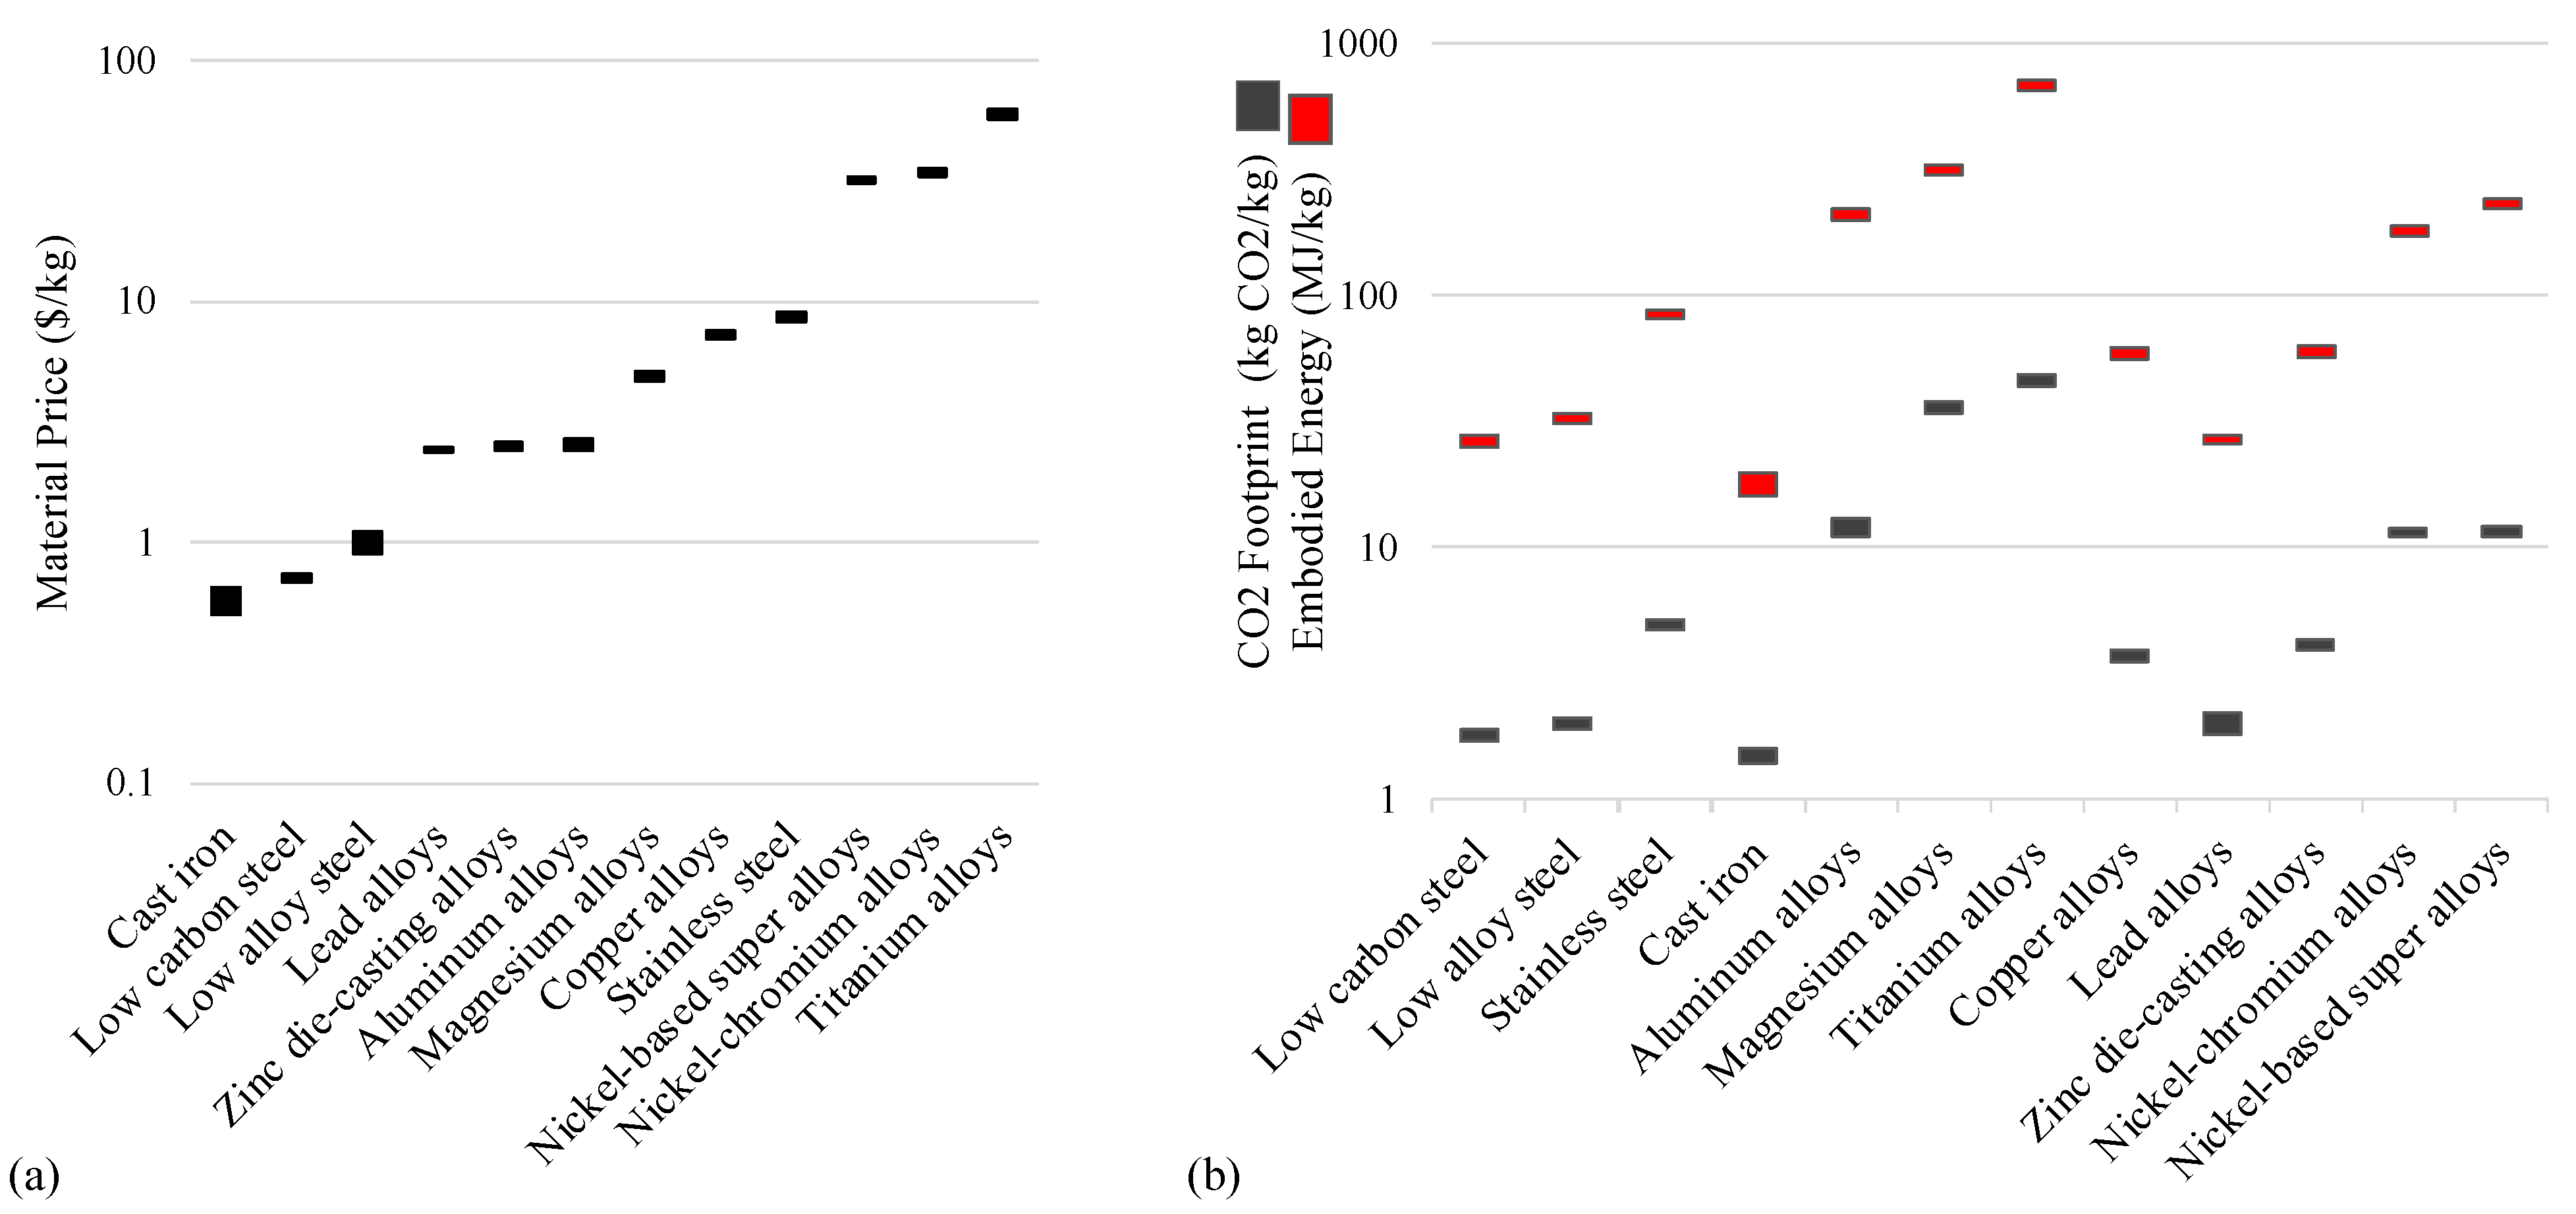
Figure 2.
Flow chart of the procedure for stepwise regression.
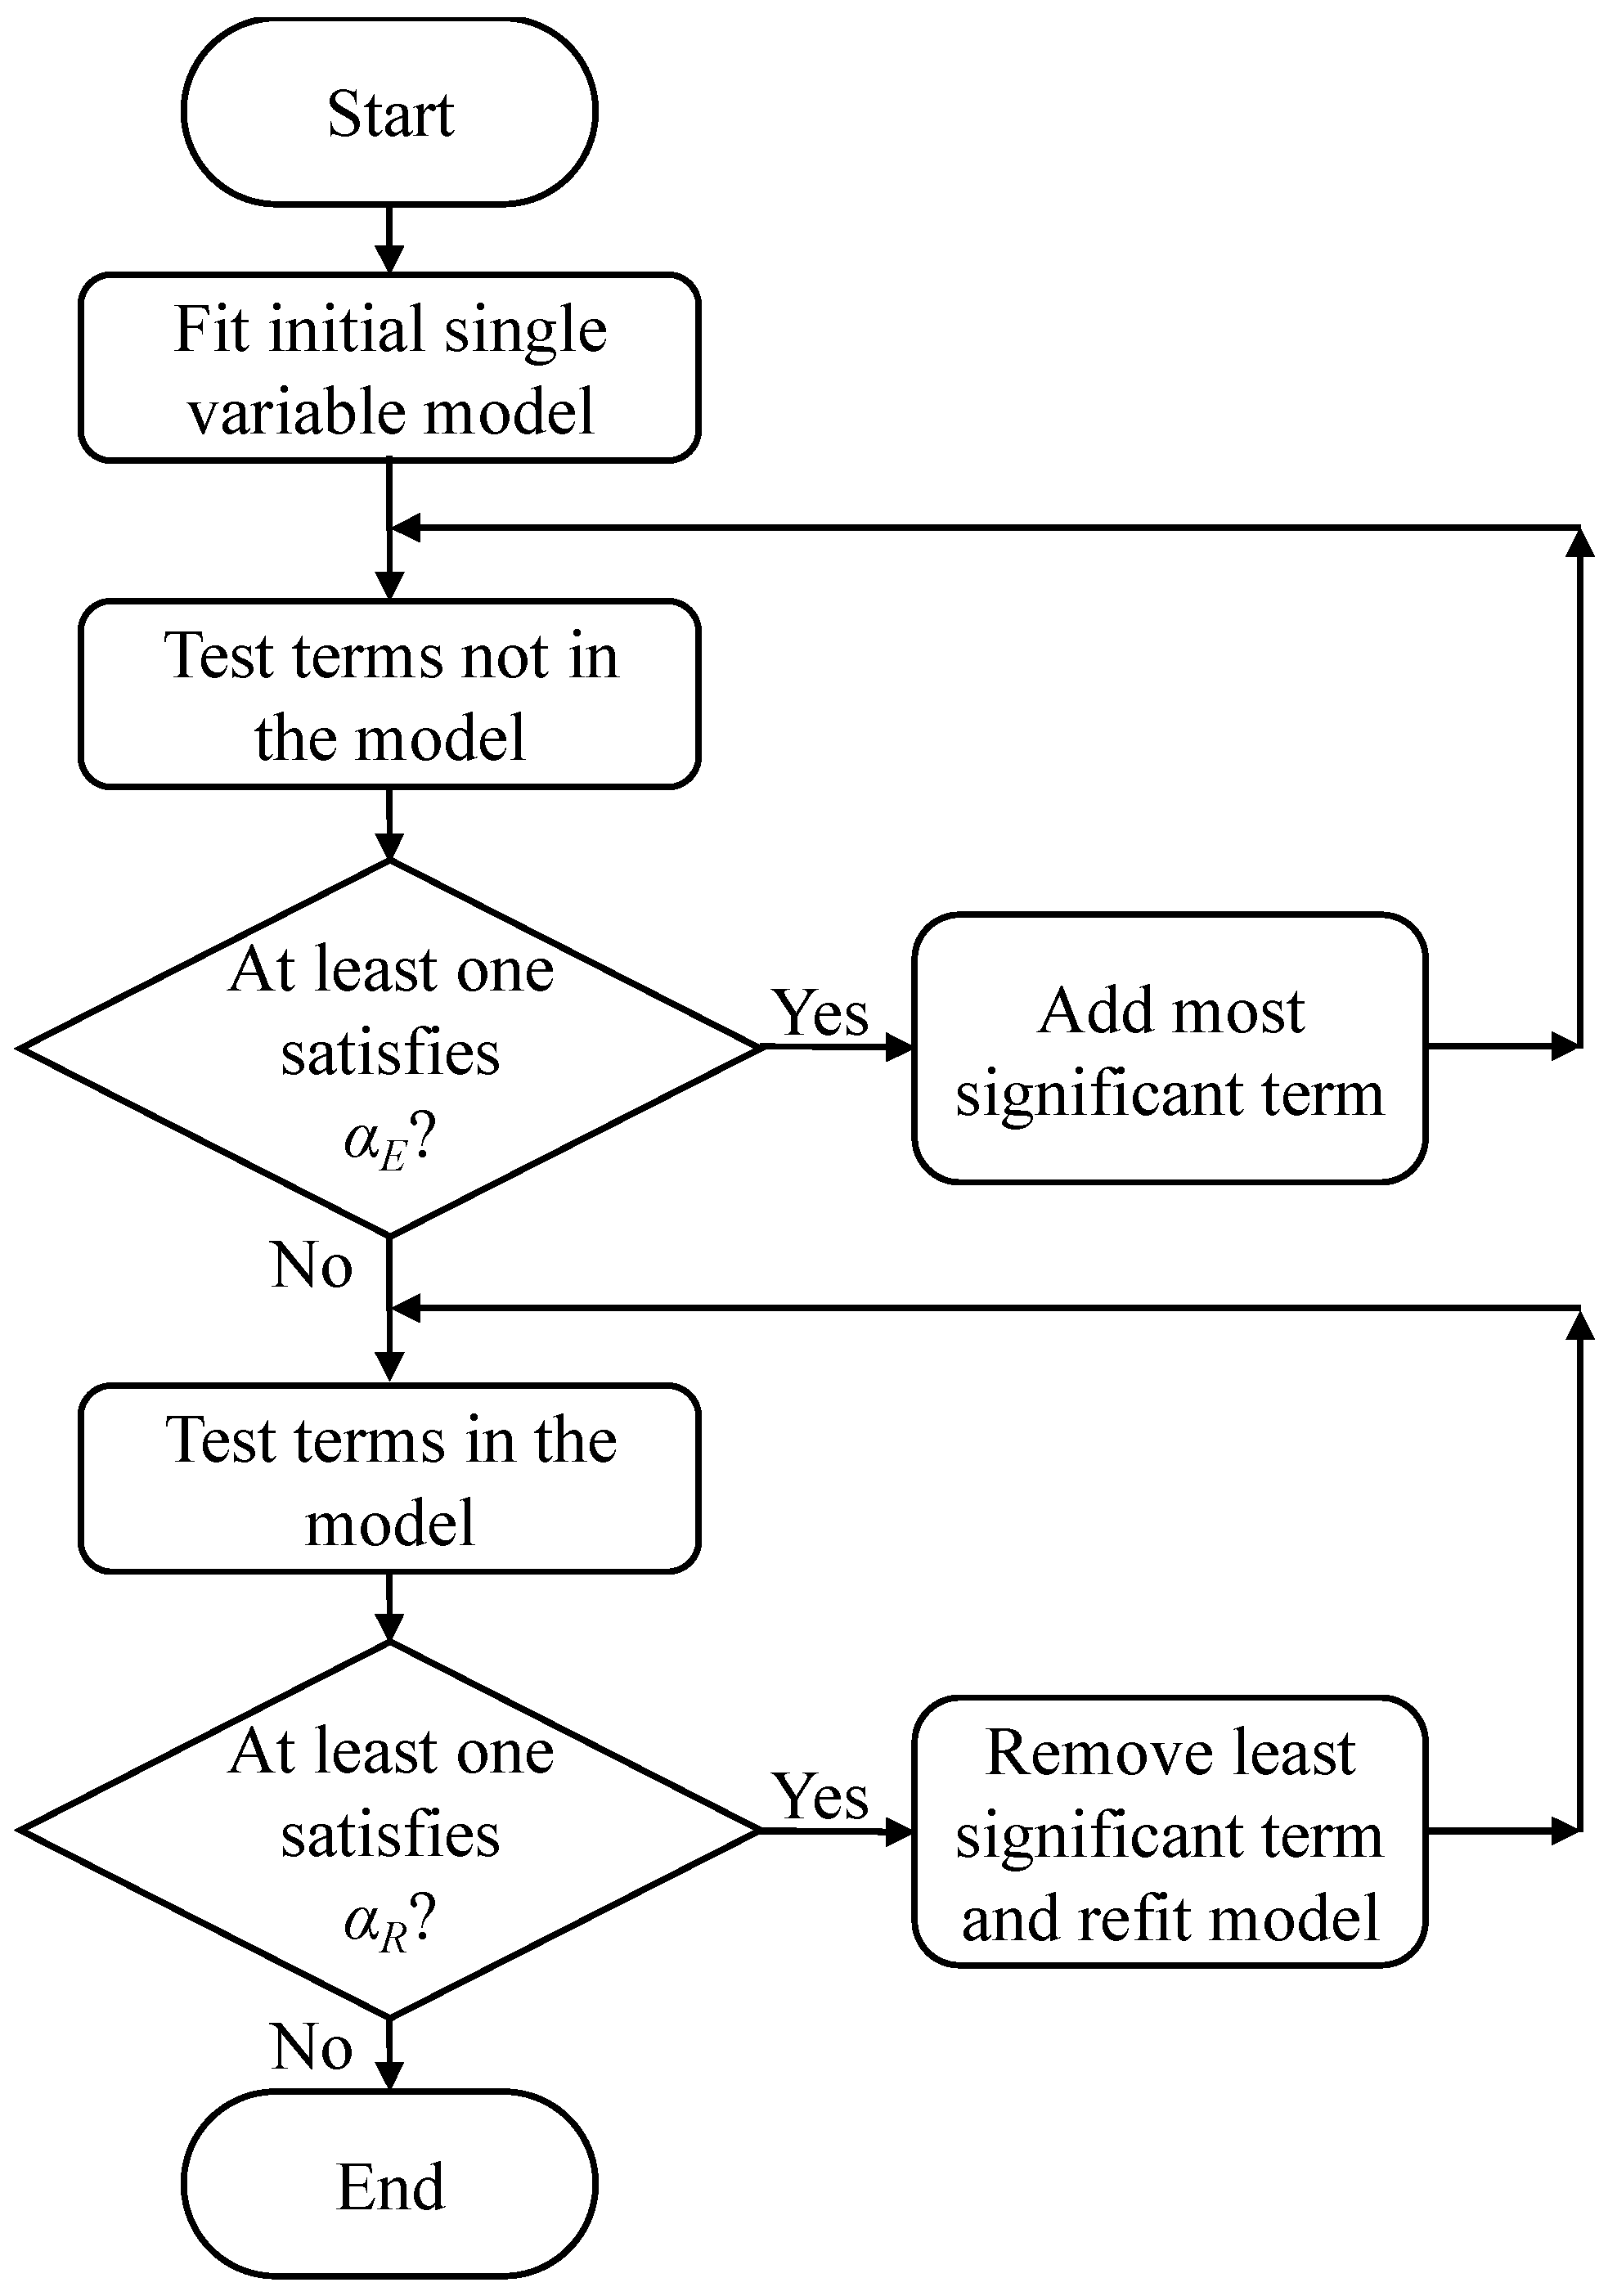
Figure 3.
Sandwich panel table with a core of square cells, adapted from Triebe et al. [33].
Figure 3.
Sandwich panel table with a core of square cells, adapted from Triebe et al. [33].
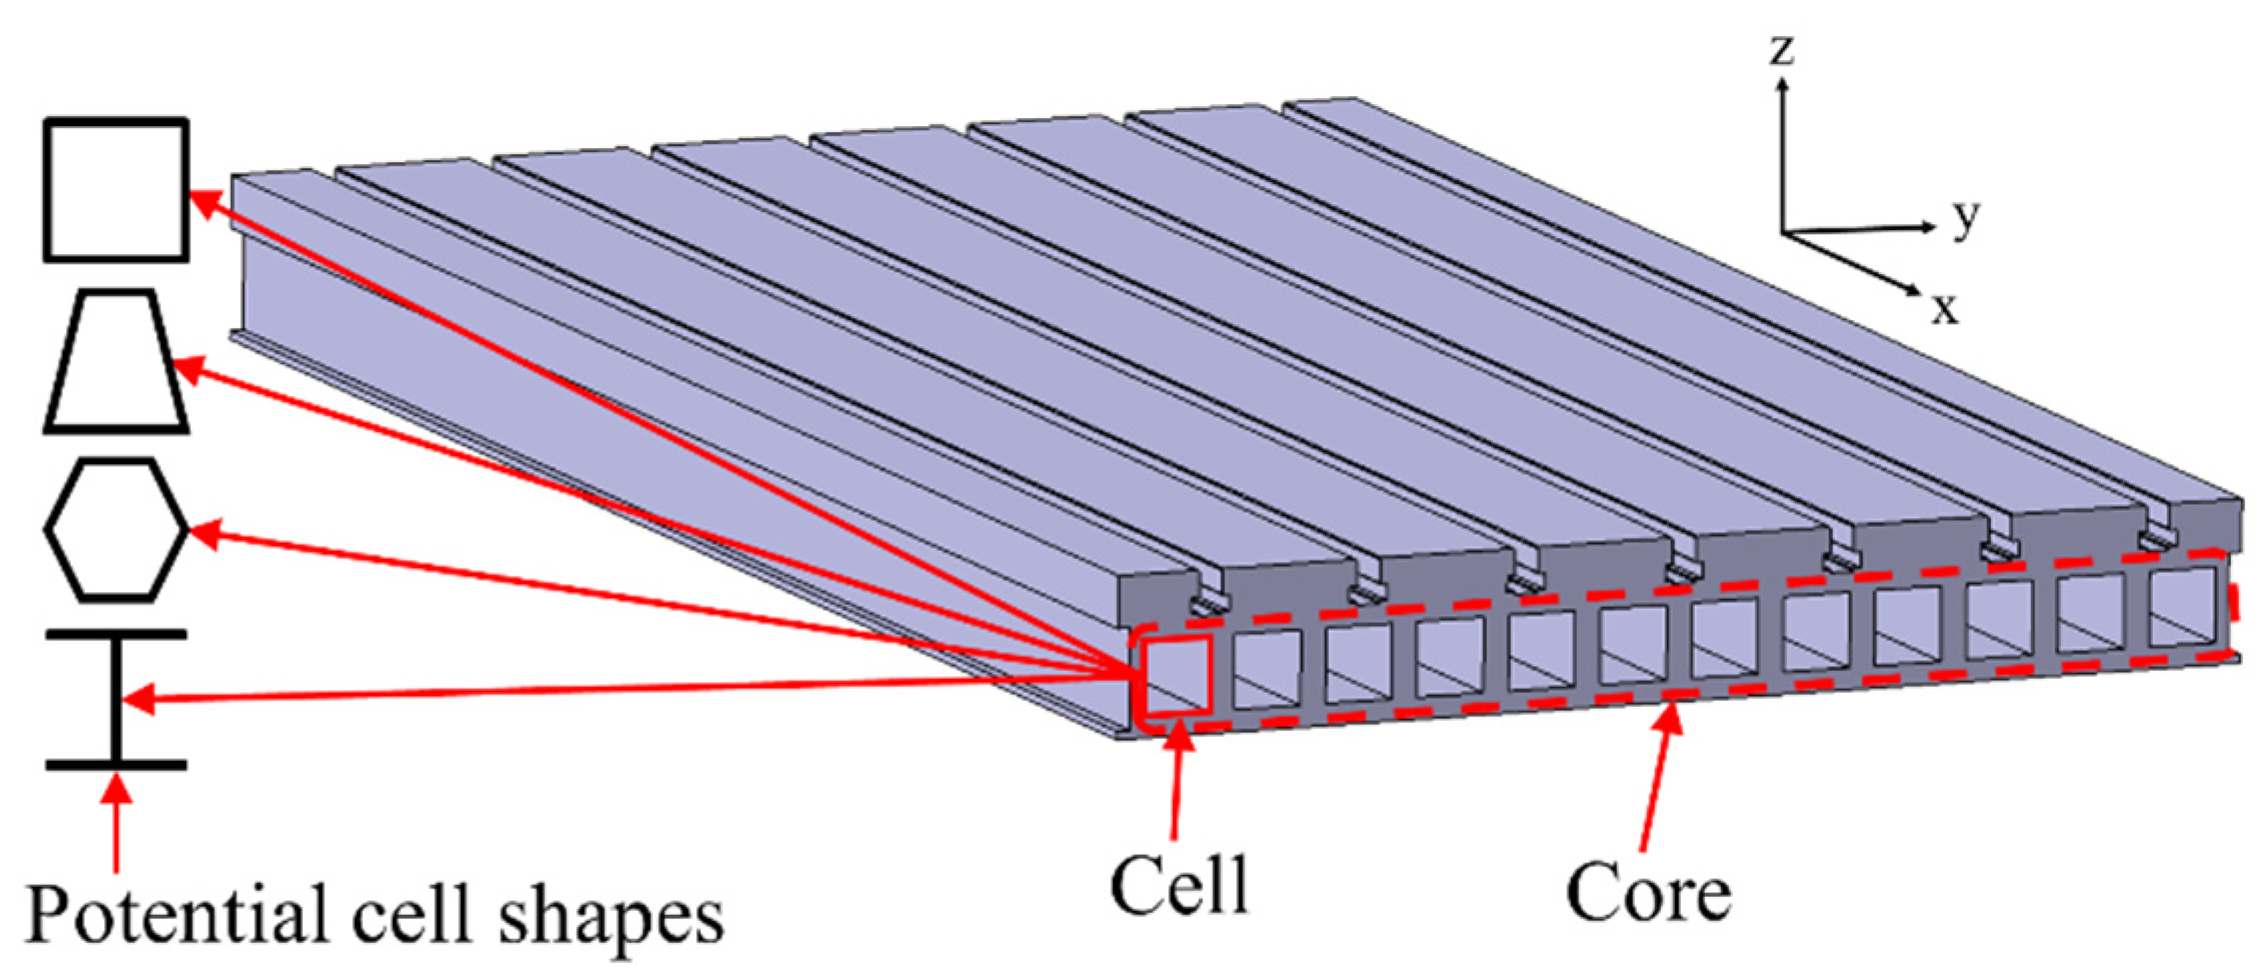
Figure 4.
(a) Standard solid table design having a mass of 1370 kg. (b) Lightweight table design having a mass of 687 kg.
Figure 4.
(a) Standard solid table design having a mass of 1370 kg. (b) Lightweight table design having a mass of 687 kg.

Table 1.
Haas data (dataset #1).
| MTs | Volume mm3 | Spindle Speed (RPM) | x-Axis (mm) | y-Axis (mm) | z-Axis (mm) | Axes | Max Rating (kW) | Max Torque (Nm) | Max Cutting (m/min) | Rapids on x (m/min) | Rapids on y (m/min) | Rapids on z (m/min) | Max Thrust x (N) | Max Thrust y (N) | Max Thrust z (N) | Mass (kg) | Price (USD) |
|---|---|---|---|---|---|---|---|---|---|---|---|---|---|---|---|---|---|
| VF-1 | 104,773,984 | 8100 | 508 | 406 | 508 | 3 | 22.4 | 122 | 16.5 | 25.4 | 25.4 | 25.4 | 11,343 | 11,343 | 18,683 | 3539 | 49,995.00 |
| VF-2 | 157,160,976 | 8100 | 762 | 406 | 508 | 3 | 22.4 | 122 | 16.5 | 25.4 | 25.4 | 25.4 | 11,343 | 11,343 | 18,683 | 3539 | 52,995.00 |
| VF-2TR | 157,160,976 | 8100 | 762 | 406 | 508 | 5 | 22.4 | 122 | 16.5 | 25.4 | 25.4 | 25.4 | 11,343 | 11,343 | 18,683 | 3765 | 123,995.00 |
| VF-2SS | 157,160,976 | 12,000 | 762 | 406 | 508 | 3 | 22.4 | 122 | 21.2 | 35.6 | 35.6 | 35.6 | 8874 | 8874 | 13,723 | 3539 | 64,995.00 |
| VF-2YT | 196,644,768 | 8100 | 762 | 508 | 508 | 3 | 22.4 | 122 | 16.5 | 25.4 | 25.4 | 25.4 | 11,343 | 11,343 | 18,683 | 3539 | 60,995.00 |
| VF-2SSYT | 196,644,768 | 12,000 | 762 | 508 | 508 | 3 | 22.4 | 122 | 21.2 | 35.6 | 35.6 | 35.6 | 8874 | 8874 | 13,723 | 3539 | 71,995.00 |
| VF-3 | 327,741,280 | 8100 | 1016 | 508 | 635 | 3 | 22.4 | 122 | 16.5 | 25.4 | 25.4 | 25.4 | 11,343 | 11,343 | 18,683 | 6124 | 67,995.00 |
| VF-3SS | 327,741,280 | 12,000 | 1016 | 508 | 635 | 3 | 22.4 | 122 | 21.2 | 35.6 | 35.6 | 35.6 | 13,723 | 13,723 | 17,450 | 6124 | 79,995.00 |
| VF-3YT | 425,805,600 | 8100 | 1016 | 660 | 635 | 3 | 22.4 | 122 | 12.7 | 18 | 18 | 18 | 11,343 | 18,238 | 18,238 | 6804 | 77,995.00 |
| VF-3SSYT | 425,805,600 | 12,000 | 1016 | 660 | 635 | 3 | 22.4 | 122 | 21.2 | 35.6 | 35.6 | 35.6 | 13,723 | 13,723 | 17,450 | 6804 | 89,995.00 |
| VF-3YT/50 | 425,805,600 | 7500 | 1016 | 660 | 635 | 3 | 22.4 | 460 | 12.7 | 18 | 18 | 18 | 15,124 | 18,238 | 24,910 | 7485 | 99,995.00 |
| VF-4 | 409,676,600 | 8100 | 1270 | 508 | 635 | 3 | 22.4 | 122 | 16.5 | 25.4 | 25.4 | 25.4 | 11,343 | 11,343 | 18,683 | 6124 | 70,995.00 |
| VF-4SS | 409,676,600 | 12,000 | 1270 | 508 | 635 | 3 | 22.4 | 122 | 21.2 | 35.6 | 35.6 | 35.6 | 13,723 | 13,723 | 17,459 | 6124 | 82,995.00 |
| VF-5SS | 532,257,000 | 12,000 | 1270 | 660 | 635 | 3 | 22.4 | 122 | 21.2 | 30.5 | 30.5 | 30.5 | 14,902 | 14,902 | 14,902 | 5761 | 99,995.00 |
| VF-5/40 | 532,257,000 | 8100 | 1270 | 660 | 635 | 3 | 22.4 | 122 | 12.7 | 18 | 18 | 18 | 11,343 | 18,238 | 18,238 | 5761 | 85,995.00 |
| VF-5/40TR | 532,257,000 | 8100 | 1270 | 660 | 635 | 5 | 22.4 | 122 | 12.7 | 18 | 18 | 18 | 11,343 | 18,238 | 18,238 | 5761 | 163,995.00 |
| VF-5/40XT | 638,708,400 | 8100 | 1524 | 660 | 635 | 3 | 22.4 | 122 | 12.7 | 18 | 18 | 18 | 15,124 | 18,238 | 18,238 | 7100 | 96,995.00 |
| VF-5/50 | 532,257,000 | 7500 | 1270 | 660 | 635 | 3 | 22.4 | 460 | 12.7 | 18 | 18 | 18 | 15,124 | 18,238 | 24,910 | 7371 | 114,995.00 |
| VF-5/50TR | 532,257,000 | 7500 | 1270 | 660 | 635 | 5 | 22.4 | 460 | 12.7 | 18 | 18 | 18 | 15,124 | 18,238 | 24,910 | 7371 | 177,995.00 |
| VF-5/50XT | 638,708,400 | 7500 | 1524 | 660 | 635 | 3 | 22.4 | 460 | 12.7 | 18 | 18 | 18 | 15,124 | 18,238 | 24,910 | 7371 | 128,995.00 |
| VF-6/40 | 1,007,316,756 | 8100 | 1626 | 813 | 762 | 3 | 22.4 | 122 | 12.7 | 15.2 | 15.2 | 15.2 | 15,124 | 15,124 | 24,910 | 10,116 | 123,995.00 |
| VF-6SS | 1,007,316,756 | 12,000 | 1626 | 813 | 762 | 3 | 22.4 | 122 | 21.2 | 30.5 | 30.5 | 30.5 | 15,124 | 15,124 | 15,124 | 10,116 | 133,995.00 |
| VF-6/40TR | 1,007,316,756 | 8100 | 1626 | 813 | 762 | 5 | 22.4 | 122 | 12.7 | 15.2 | 15.2 | 15.2 | 15,124 | 15,124 | 24,910 | 11,839 | 194,995.00 |
| VF-6/50 | 1,007,316,756 | 7500 | 1626 | 813 | 762 | 3 | 22.4 | 460 | 12.7 | 15.2 | 15.2 | 15.2 | 15,124 | 18,238 | 24,910 | 11,567 | 150,995.00 |
| VF-6/50TR | 1,007,316,756 | 7500 | 1626 | 813 | 762 | 5 | 22.4 | 460 | 12.7 | 15.2 | 15.2 | 15.2 | 15,124 | 18,238 | 24,910 | 12,003 | 212,995.00 |
| VF-7/40 | 1,322,025,804 | 8100 | 2134 | 813 | 762 | 3 | 22.4 | 122 | 12.7 | 15.2 | 15.2 | 15.2 | 15,124 | 15,124 | 24,910 | 11,612 | 143,995.00 |
| VF-7/50 | 1,322,025,804 | 7500 | 2134 | 813 | 762 | 3 | 22.4 | 460 | 12.7 | 15.2 | 15.2 | 15.2 | 15,124 | 18,238 | 24,910 | 12,021 | 170,995.00 |
| VF-8/40 | 1,258,836,192 | 8100 | 1626 | 1016 | 762 | 3 | 22.4 | 122 | 12.7 | 15.2 | 15.2 | 15.2 | 15,124 | 15,124 | 24,910 | 11,250 | 154,995.00 |
| VF-8/50 | 1,258,836,192 | 7500 | 1626 | 1016 | 762 | 3 | 22.4 | 460 | 12.7 | 15.2 | 15.2 | 15.2 | 15,124 | 18,238 | 24,910 | 13,155 | 182,995.00 |
| VF-9/40 | 1,652,125,728 | 8100 | 2134 | 1016 | 762 | 3 | 22.4 | 122 | 12.7 | 15.2 | 15.2 | 15.2 | 15,124 | 15,124 | 24,910 | 12,837 | 175,995.00 |
| VF-9/50 | 1,652,125,728 | 7500 | 2134 | 1016 | 762 | 3 | 22.4 | 460 | 12.7 | 15.2 | 15.2 | 15.2 | 15,124 | 18,238 | 24,910 | 13,109 | 203,995.00 |
| VF-10/40 | 1,888,254,288 | 8100 | 3048 | 813 | 762 | 3 | 22.4 | 122 | 9.1 | 9.1 | 15.2 | 15.2 | 15,124 | 15,124 | 24,910 | 13,654 | 203,995.00 |
| VF-10/50 | 1,888,254,288 | 7500 | 3048 | 813 | 762 | 3 | 22.4 | 460 | 9.1 | 9.1 | 15.2 | 15.2 | 15,124 | 18,238 | 24,910 | 14,334 | 230,995.00 |
| VF-11/40 | 2,359,737,216 | 8100 | 3048 | 1016 | 762 | 3 | 22.4 | 122 | 9.1 | 9.1 | 15.2 | 15.2 | 15,124 | 15,124 | 24,910 | 15,150 | 225,995.00 |
| VF-12/40 | 2,360,317,860 | 8100 | 3810 | 813 | 762 | 3 | 22.4 | 122 | 9.1 | 9.1 | 15.2 | 15.2 | 15,124 | 15,124 | 24,910 | 16,466 | 255,995.00 |
| VF-12/50 | 2,360,317,860 | 7500 | 3810 | 813 | 762 | 3 | 22.4 | 460 | 9.1 | 9.1 | 15.2 | 15.2 | 15,124 | 18,238 | 24,910 | 16,874 | 279,995.00 |
| VF-14/40 | 2,949,671,520 | 8100 | 3810 | 1016 | 762 | 3 | 22.4 | 122 | 9.1 | 9.1 | 15.2 | 15.2 | 15,124 | 15,124 | 24,910 | 16,466 | 299,995.00 |
| VF-14/50 | 2,949,671,520 | 7500 | 3810 | 1016 | 762 | 3 | 22.4 | 460 | 9.1 | 9.1 | 15.2 | 15.2 | 15,124 | 18,238 | 24,910 | 16,874 | 319,995.00 |
| UMC-500 | 100,549,960 | 8100 | 610 | 406 | 406 | 5 | 22.4 | 122 | 16.5 | 22.9 | 22.9 | 22.9 | 14,680 | 14,680 | 18,015 | 5400 | 124,995.00 |
| UMC-750 | 196,644,768 | 8100 | 762 | 508 | 508 | 5 | 22.4 | 122 | 16.5 | 22.9 | 22.9 | 22.9 | 12,233 | 12,233 | 15,124 | 6464 | 154,995.00 |
| UMC-750SS | 196,644,768 | 12,000 | 762 | 508 | 508 | 5 | 22.4 | 122 | 16.5 | 30.5 | 30.5 | 30.5 | 12,233 | 12,233 | 15,124 | 6464 | 194,995.00 |
| UMC-1000 | 409,676,600 | 8100 | 1016 | 635 | 635 | 5 | 22.4 | 122 | 16.5 | 22.9 | 22.9 | 22.9 | 14,680 | 14,680 | 18,015 | 7077 | 199,995.00 |
| UMC-1000-P | 409,676,600 | 8100 | 1016 | 635 | 635 | 5 | 22.4 | 122 | 16.5 | 22.9 | 22.9 | 22.9 | 14,680 | 14,680 | 18,015 | 7077 | 224,995.00 |
| UMC-1000SS | 409,676,600 | 12,000 | 1016 | 635 | 635 | 5 | 22.4 | 122 | 16.5 | 30.5 | 30.5 | 30.5 | 14,680 | 14,680 | 18,015 | 7711 | 229,995.00 |
| UMC-1000SS-P | 409,676,600 | 12,000 | 1016 | 635 | 635 | 5 | 22.4 | 122 | 16.5 | 30.5 | 30.5 | 30.5 | 14,680 | 14,680 | 18,015 | 7711 | 259,995.00 |
| UMC-1500-DUO | 393,289,536 | 8100 | 1524 | 508 | 508 | 5 | 22.4 | 122 | 16.5 | 22.9 | 22.9 | 22.9 | 12,233 | 12,233 | 15,124 | 9120 | 219,995.00 |
| VR-8 | 1,784,177,280 | 20,000 | 1626 | 1016 | 1080 | 5 | 18 | 21 | 12.7 | 15.2 | 15.2 | 15.2 | 15,124 | 15,124 | 24,910 | 11,410 | 299,995.00 |
| VR-9 | 2,341,595,520 | 20,000 | 2134 | 1016 | 1080 | 5 | 18 | 21 | 12.7 | 15.2 | 15.2 | 15.2 | 15,124 | 15,124 | 24,910 | 11,410 | 329,995.00 |
| VR-11 | 3,344,509,440 | 20,000 | 3048 | 1016 | 1080 | 5 | 18 | 21 | 9.1 | 9.1 | 15.2 | 15.2 | 15,124 | 15,124 | 24,910 | 15,320 | 369,995.00 |
| VR-14 | 4,180,636,800 | 20,000 | 3810 | 1016 | 1080 | 5 | 18 | 21 | 9.1 | 9.1 | 15.2 | 15.2 | 15,124 | 15,124 | 24,910 | 15,320 | 419,995.00 |
| VC-400 | 115,292,632 | 8100 | 559 | 406 | 508 | 3 | 22.4 | 122 | 12.7 | 20.3 | 20.3 | 20.3 | 15,035 | 15,035 | 15,035 | 7947 | 119,995.00 |
| Mini Mill | 31,452,820 | 6000 | 406 | 305 | 254 | 3 | 5.6 | 45 | 12.7 | 15.2 | 15.2 | 15.2 | 8896 | 8896 | 8896 | 1815 | 32,995.00 |
| Super Mini Mill | 31,452,820 | 10,000 | 406 | 305 | 254 | 3 | 11.2 | 23 | 21.2 | 30.5 | 30.5 | 30.5 | 8896 | 8896 | 8896 | 1815 | 43,995.00 |
| Mini Mill 2 | 73,424,288 | 6000 | 508 | 406 | 356 | 3 | 5.6 | 45 | 12.7 | 15.2 | 15.2 | 15.2 | 8896 | 8896 | 8896 | 2314 | 39,995.00 |
| Super Mini Mill2 | 73,424,288 | 10,000 | 508 | 406 | 356 | 3 | 11.2 | 23 | 21.2 | 30.5 | 30.5 | 30.5 | 8896 | 8896 | 8896 | 2314 | 49,995.00 |
| VM-2 | 196,644,768 | 12,000 | 762 | 508 | 508 | 3 | 22.4 | 122 | 12.7 | 18 | 18 | 18 | 15,124 | 15,124 | 24,910 | 4264 | 86,995.00 |
| VM-3 | 425,805,600 | 12,000 | 1016 | 660 | 635 | 3 | 22.4 | 122 | 12.7 | 18 | 18 | 18 | 18,238 | 18,238 | 18,238 | 6940 | 99,995.00 |
| VM-6 | 1,007,316,756 | 12,000 | 1626 | 813 | 762 | 3 | 22.4 | 122 | 12.7 | 15.2 | 15.2 | 15.2 | 15,124 | 18,238 | 24,910 | 10,887 | 139,995.00 |
| DT-1 | 81,261,712 | 10,000 | 508 | 406 | 394 | 3 | 11.2 | 62 | 30.5 | 61 | 61 | 61 | 11,343 | 11,343 | 18,683 | 2336 | 49,995.00 |
| DT-2 | 113,734,404 | 10,000 | 700 | 406 | 394 | 3 | 11.2 | 62 | 30.5 | 61 | 61 | 61 | 11,343 | 11,343 | 18,683 | 2427 | 51,995.00 |
| DM-1 | 81,261,712 | 10,000 | 508 | 406 | 394 | 3 | 11.2 | 62 | 30.5 | 61 | 61 | 61 | 11,343 | 11,343 | 18,683 | 2336 | 59,995.00 |
| DM-2 | 113,734,404 | 10,000 | 711 | 406 | 394 | 3 | 11.2 | 62 | 30.5 | 61 | 61 | 61 | 11,343 | 11,343 | 18,683 | 2427 | 61,995.00 |
| TM-1 | 94,358,460 | 4000 | 762 | 305 | 406 | 3 | 5.6 | 45 | 5.1 | 5.1 | 5.1 | 5.1 | 8896 | 8896 | 8896 | 2042 | 30,995.00 |
| TM-1P | 94,358,460 | 6000 | 762 | 305 | 406 | 3 | 5.6 | 45 | 10.2 | 10.2 | 10.2 | 10.2 | 8896 | 8896 | 8896 | 2042 | 34,995.00 |
| TM-2 | 167,473,376 | 4000 | 1016 | 406 | 406 | 3 | 5.6 | 45 | 5.1 | 5.1 | 5.1 | 5.1 | 8896 | 8896 | 8896 | 2359 | 34,995.00 |
| TM-2P | 167,473,376 | 6000 | 1016 | 406 | 406 | 3 | 5.6 | 45 | 10.2 | 10.2 | 10.2 | 10.2 | 8896 | 8896 | 8896 | 2359 | 37,995.00 |
| TM-3 | 209,547,968 | 4000 | 1016 | 508 | 406 | 3 | 5.6 | 45 | 5.1 | 5.1 | 5.1 | 5.1 | 8896 | 8896 | 8896 | 2813 | 40,995.00 |
| TM-3P | 209,547,968 | 6000 | 1016 | 508 | 406 | 3 | 5.6 | 45 | 10.2 | 10.2 | 10.2 | 10.2 | 8896 | 8896 | 8896 | 2813 | 43,995.00 |
| CM-1 | 23,628,350 | 30,000 | 305 | 254 | 305 | 3 | 3.7 | 11 | 12.7 | 19.2 | 19.2 | 19.2 | 5111 | 5111 | 5111 | 917 | 59,995.00 |
| GR-510 | 1,328,061,483 | 8100 | 3073 | 1549 | 279 | 3 | 11.2 | 65 | 20.3 | 20.3 | 53.3 | 27.9 | 11,210 | 4537 | 9119 | 8800 | 125,995.00 |
| GR-712 | 2,218,495,563 | 8100 | 3683 | 2159 | 279 | 3 | 11.2 | 65 | 20.3 | 20.3 | 53.3 | 27.9 | 11,210 | 4537 | 9119 | 10,887 | 169,995.00 |
| GM-2-5AX | 8,191,809,626 | 24,000 | 3683 | 2223 | 1000 | 5 | 12 | 15 | 20.3 | 20.3 | 53.3 | 27.9 | 20,017 | 7340 | 8896 | 10,000 | 369,995.00 |
Table 2.
Simple linear regression models including R2 values for each feature, where the values greater than 0.5 are shaded (nomenclature shown in the Features column is used in Table 3 and Table 4).
| Haas Dataset | Multi-Company Dataset | |||||
|---|---|---|---|---|---|---|
| Features | Intercept | Coefficient | R2 | Intercept | Coefficient | R2 |
| Mass | 1.639 × 10⁵ | 1.380 × 10⁵ | 0.6823 | 2.188 × 10⁵ | 1.530 × 10⁵ | 0.7237 |
| Max Cutting Speed (MCS) | 1.300 × 10⁵ | −6.085 × 10⁴ | 0.0823 | |||
| Spindle Power (SP) | 1.119 × 10⁵ | 5.324 × 10⁴ | 0.1441 | 1.129 × 10⁵ | 7.218 × 10⁴ | 0.2751 |
| Max Thrust x (MTX) | 1.326 × 10⁵ | 1.702 × 10⁵ | 0.4497 | |||
| Max Thrust y (MTY) | 1.219 × 10⁵ | 6.808 × 10⁴ | 0.1627 | |||
| Max Thrust z (MTZ) | 1.155 × 10⁵ | 8.013 × 10⁴ | 0.2726 | |||
| Spindle Torque (ST) | 1.545 × 10⁵ | 2.954 × 10⁴ | 0.0402 | 2.151 × 10⁵ | 1.607 × 10⁵ | 0.6098 |
| Number of Axes (NA) | 1.750 × 10⁵ | 6.247 × 10⁴ | 0.3371 | 1.603 × 10⁵ | 2.844 × 10⁴ | 0.0532 |
| Rapid Travel on x (RTX) | 1.137 × 10⁵ | −7.184 × 10⁴ | 0.1184 | 1.388 × 10⁵ | 2.604 × 10⁴ | 0.0201 |
| Rapid Travel on y (RTY) | 1.341 × 10⁵ | −2.821 × 10⁴ | 0.0211 | 1.430 × 10⁵ | 3.243 × 10⁴ | 0.0407 |
| Rapid Travel on z (RTZ) | 1.240 × 10⁵ | −5.191 × 10⁴ | 0.0565 | 1.436 × 10⁵ | 3.604 × 10⁴ | 0.0472 |
| Spindle Speed (SS) | 2.058 × 10⁵ | 1.111 × 10⁵ | 0.1638 | 1.383 × 10⁵ | −2.936 × 10⁴ | 0.0307 |
| Volume (Vol) | 3.288 × 10⁵ | 2.380 × 10⁵ | 0.6129 | 2.098 × 10⁵ | 1.062 × 10⁵ | 0.4063 |
| x-Axis Travel (XAT) | 1.830 × 10⁵ | 1.250 × 10⁵ | 0.5798 | 2.336 × 10⁵ | 1.508 × 10⁵ | 0.6439 |
| y-Axis Travel (YAT) | 2.350 × 10⁵ | 1.648 × 10⁵ | 0.4002 | 1.965 × 10⁵ | 1.397 × 10⁵ | 0.5589 |
| z-Axis Travel (ZAT) | 1.649 × 10⁵ | 1.546 × 10⁵ | 0.6218 | 1.396 × 10⁵ | 1.232 × 10⁵ | 0.5322 |
Table 3.
Variance–covariance matrix for the Haas data with the variances (across the diagonal) in bold and the significant covariances shaded (see Table 2 for nomenclature).
Table 3.
Variance–covariance matrix for the Haas data with the variances (across the diagonal) in bold and the significant covariances shaded (see Table 2 for nomenclature).
| Vol | SS | XAT | YAT | ZAT | NA | SP | ST | MCS | RTX | RTY | RTZ | MTX | MTY | MTZ | Mass | |
|---|---|---|---|---|---|---|---|---|---|---|---|---|---|---|---|---|
| Vol | 1.59 × 10¹⁸ | 2.40 × 10¹² | 1.05 × 10¹² | 3.63 × 10¹¹ | 1.67 × 10¹¹ | 2.48 × 10⁸ | 7.42 × 10⁸ | 1.10 × 10¹⁰ | −1.47 × 10⁹ | −5.36 × 10⁹ | 1.64 × 10⁸ | −3.03 × 10⁹ | 1.97 × 10¹² | 5.73 × 10¹¹ | 2.08 × 10¹² | 3.86 × 10¹² |
| SS | 2.40 × 10¹² | 1.98 × 10⁷ | 5.77 × 10⁵ | 3.92 × 10⁵ | 3.32 × 10⁵ | 1.26 × 10³ | −1.23 × 10³ | −1.99 × 10⁵ | 4.68 × 10³ | 8.21 × 10³ | 1.40 × 10⁴ | 1.00 × 10⁴ | 1.73 × 10⁶ | −2.13 × 10⁶ | −6.75 × 10⁵ | 1.85 × 10⁶ |
| XAT | 1.05 × 10¹² | 5.77 × 10⁵ | 1.00 × 10⁶ | 2.76 × 10⁵ | 1.18 × 10⁵ | 4.07 × 101 | 1.34 × 10³ | 3.35 × 10⁴ | −1.95 × 10³ | −5.79 × 10³ | −1.52 × 10³ | −3.64 × 10³ | 1.45 × 10⁶ | 9.23 × 10⁵ | 2.53 × 10⁶ | 3.88 × 10⁶ |
| YAT | 3.63 × 10¹¹ | 3.92 × 10⁵ | 2.76 × 10⁵ | 1.26 × 10⁵ | 3.43 × 10⁴ | 4.59 × 101 | 3.01 × 10² | 6.02 × 10³ | −1.68 × 10² | −1.26 × 10³ | 7.12 × 10² | −6.65 × 10² | 5.25 × 10⁵ | 9.11 × 10⁴ | 4.67 × 10⁵ | 1.03 × 10⁶ |
| ZAT | 1.67 × 10¹¹ | 3.32 × 10⁵ | 1.18 × 10⁵ | 3.43 × 10⁴ | 3.91 × 10⁴ | 5.93 × 101 | 6.79 × 10² | 7.57 × 10³ | −3.70 × 10² | −8.73 × 10² | −8.28 × 10² | −7.31 × 10² | 4.14 × 10⁵ | 4.79 × 10⁵ | 8.60 × 10⁵ | 6.90 × 10⁵ |
| NA | 2.48 × 10⁸ | 1.26 × 10³ | 4.07 × 101 | 4.59 × 101 | 5.93 × 101 | 7.61 × 10⁻¹ | 1.12 × 100 | −1.13 × 101 | −1.59 × 10⁻¹ | −5.06 × 10⁻¹ | −3.16 × 10⁻¹ | −4.95 × 10⁻¹ | 6.68 × 10² | 4.12 × 10² | 6.37 × 10² | 6.24 × 10² |
| SP | 7.42 × 10⁸ | −1.23 × 10³ | 1.34 × 10³ | 3.01 × 10² | 6.79 × 10² | 1.12 × 100 | 3.91 × 101 | 4.23 × 10² | −1.28 × 100 | −2.14 × 100 | −9.99 × 100 | −2.29 × 100 | 1.14 × 10⁴ | 1.74 × 10⁴ | 2.74 × 10⁴ | 1.48 × 10⁴ |
| ST | 1.10 × 10¹⁰ | −1.99 × 10⁵ | 3.35 × 10⁴ | 6.02 × 10³ | 7.57 × 10³ | −1.13 × 101 | 4.23 × 10² | 2.05 × 10⁴ | −1.87 × 10² | −3.84 × 10² | −4.85 × 10² | −3.72 × 10² | 1.65 × 10⁵ | 3.56 × 10⁵ | 4.90 × 10⁵ | 2.75 × 10⁵ |
| MCS | −1.47 × 10⁹ | 4.68 × 10³ | −1.95 × 10³ | −1.68 × 10² | −3.70 × 10² | −1.59 × 10⁻¹ | −1.28 × 100 | −1.87 × 10² | 3.16 × 101 | 6.75 × 101 | 7.04 × 101 | 6.47 × 101 | −2.06 × 10³ | −6.53 × 10³ | −6.95 × 10³ | −1.01 × 10⁴ |
| RTZ | −5.36 × 10⁹ | 8.21 × 10³ | −5.79 × 10³ | −1.26 × 10³ | −8.73 × 10² | −5.06 × 10⁻¹ | −2.14 × 100 | −3.84 × 10² | 6.75 × 101 | 1.58 × 10² | 1.47 × 10² | 1.48 × 10² | −6.30 × 10³ | −1.09 × 10⁴ | −1.12 × 10⁴ | −2.63 × 10⁴ |
| RTY | 1.64 × 10⁸ | 1.40 × 10⁴ | −1.52 × 10³ | 7.12 × 10² | −8.28 × 10² | −3.16 × 10⁻¹ | −9.99 × 100 | −4.85 × 10² | 7.04 × 101 | 1.47 × 10² | 1.82 × 10² | 1.50 × 10² | −3.18 × 10³ | −2.02 × 10⁴ | −1.94 × 10⁴ | −1.71 × 10⁴ |
| RTZ | −3.03 × 10⁹ | 1.00 × 10⁴ | −3.64 × 10³ | −6.65 × 10² | −7.31 × 10² | −4.95 × 10⁻¹ | −2.29 × 100 | −3.72 × 10² | 6.47 × 101 | 1.48 × 10² | 1.50 × 10² | 1.44 × 10² | −4.35 × 10³ | −1.15 × 10⁴ | −9.23 × 10³ | −1.95 × 10⁴ |
| MTX | 1.97 × 10¹² | 1.73 × 10⁶ | 1.45 × 10⁶ | 5.25 × 10⁵ | 4.14 × 10⁵ | 6.68 × 10² | 1.14 × 10⁴ | 1.65 × 10⁵ | −2.06 × 10³ | −6.30 × 10³ | −3.18 × 10³ | −4.35 × 10³ | 7.60 × 10⁶ | 7.47 × 10⁶ | 1.20 × 10⁷ | 8.98 × 10⁶ |
| MTY | 5.73 × 10¹¹ | −2.13 × 10⁶ | 9.23 × 10⁵ | 9.11 × 10⁴ | 4.79 × 10⁵ | 4.12 × 10² | 1.74 × 10⁴ | 3.56 × 10⁵ | −6.53 × 10³ | −1.09 × 10⁴ | −2.02 × 10⁴ | −1.15 × 10⁴ | 7.47 × 10⁶ | 1.45 × 10⁷ | 1.90 × 10⁷ | 9.87 × 10⁶ |
| MTZ | 2.08 × 10¹² | −6.75 × 10⁵ | 2.53 × 10⁶ | 4.67 × 10⁵ | 8.60 × 10⁵ | 6.37 × 10² | 2.74 × 10⁴ | 4.90 × 10⁵ | −6.95 × 10³ | −1.12 × 10⁴ | −1.94 × 10⁴ | −9.23 × 10³ | 1.20 × 10⁷ | 1.90 × 10⁷ | 3.66 × 10⁷ | 1.91 × 10⁷ |
| Mass | 3.86 × 10¹² | 1.85 × 10⁶ | 3.88 × 10⁶ | 1.03 × 10⁶ | 6.90 × 10⁵ | 6.24 × 10² | 1.48 × 10⁴ | 2.75 × 10⁵ | −1.01 × 10⁴ | −2.63 × 10⁴ | −1.71× 10⁴ | −1.95 × 10⁴ | 8.98 × 10⁶ | 9.87 × 10⁶ | 1.91 × 10⁷ | 2.01 × 10⁷ |
Table 4.
Variance–covariance matrix for the multi-company data with the variances (across the diagonal) in bold and the significant covariances shaded (see Table 2 for nomenclature).
Table 4.
Variance–covariance matrix for the multi-company data with the variances (across the diagonal) in bold and the significant covariances shaded (see Table 2 for nomenclature).
| Vol | SS | XAT | YAT | ZAT | SP | ST | NA | RAT | RAY | RAZ | Mass | |
|---|---|---|---|---|---|---|---|---|---|---|---|---|
| Vol | 3.90 × 10²⁰ | −6.35 × 10¹² | 7.80 × 10¹² | 1.51 × 10¹² | 1.49 × 10¹² | 6.17 × 10⁹ | 1.07 × 10¹² | −2.38 × 10⁹ | 8.46 × 10¹⁰ | 8.15 × 10¹⁰ | 7.14 × 10¹⁰ | 4.42 × 10¹³ |
| SS | −6.35 × 10¹² | 7.39 × 10⁶ | −9.23 × 10⁵ | −1.17 × 10⁵ | −3.63 × 10⁴ | −1.27 × 10² | −6.75 × 10⁴ | 5.39 × 10² | 1.55 × 10⁴ | 1.48 × 10⁴ | 1.40 × 10⁴ | −2.55 × 10⁶ |
| XAT | 7.80 × 10¹² | −9.23 × 10⁵ | 8.40 × 10⁵ | 1.33 × 10⁵ | 1.06 × 10⁵ | 2.49 × 10³ | 8.35 × 10⁴ | −1.39 × 10² | −1.82 × 10³ | −9.58 × 10² | −8.85 × 10² | 3.92 × 10⁶ |
| YAT | 1.51 × 10¹² | −1.17 × 10⁵ | 1.33 × 10⁵ | 3.71 × 10⁴ | 2.54 × 10⁴ | 5.89 × 10² | 1.39 × 10⁴ | 5.07 × 100 | −2.46 × 10² | −1.55 × 10² | −1.56 × 10² | 7.99 × 10⁵ |
| ZAT | 1.49 × 10¹² | −3.63 × 10⁴ | 1.06 × 10⁵ | 2.54 × 10⁴ | 2.32 × 10⁴ | 5.75 × 10² | 1.24 × 10⁴ | −1.12 × 101 | 2.59 × 101 | 1.04 × 10² | 7.35 × 101 | 5.37 × 10⁵ |
| SP | 6.17 × 10⁹ | −1.27 × 10² | 2.49 × 10³ | 5.89 × 10² | 5.75 × 10² | 3.82 × 101 | 3.32 × 10² | 1.59 × 100 | 5.32 × 100 | 6.85 × 100 | 8.54 × 100 | 1.45 × 10⁴ |
| ST | 1.07 × 10¹² | −6.75 × 10⁴ | 8.35 × 10⁴ | 1.39 × 10⁴ | 1.24 × 10⁴ | 3.32 × 10² | 1.15 × 10⁴ | 2.96 × 100 | −6.12 × 101 | 3.87 × 101 | 1.53 × 101 | 4.19 × 10⁵ |
| NA | −2.38 × 10⁹ | 5.39 × 10² | −1.39 × 10² | 5.07 × 100 | −1.12 × 101 | 1.59 × 100 | 2.96 × 100 | 6.74 × 10⁻¹ | 7.16 × 10⁻¹ | 5.89 × 10⁻¹ | 6.95 × 10⁻¹ | 5.73 × 10² |
| RTX | 8.46 × 10¹⁰ | 1.55 × 10⁴ | −1.82 × 10³ | −2.46 × 10² | 2.59 × 101 | 5.32 × 100 | −6.12 × 101 | 7.16 × 10⁻¹ | 8.26 × 101 | 7.65 × 101 | 7.33 × 101 | −1.71 × 10³ |
| RTY | 8.15 × 10¹⁰ | 1.48 × 10⁴ | −9.58 × 10² | −1.55 × 10² | 1.04 × 10² | 6.85 × 100 | 3.87 × 101 | 5.89 × 10⁻¹ | 7.65 × 101 | 7.23 × 101 | 6.91 × 101 | 1.60 × 10³ |
| RTZ | 7.14 × 10¹⁰ | 1.40 × 10⁴ | −8.85 × 10² | −1.56 × 10² | 7.35 × 101 | 8.54 × 100 | 1.53 × 101 | 6.95 × 10⁻¹ | 7.33 × 101 | 6.91 × 101 | 6.78 × 101 | 1.94 × 10³ |
| Mass | 4.42 × 10¹³ | −2.55 × 10⁶ | 3.92 × 10⁶ | 7.99 × 10⁵ | 5.37 × 10⁵ | 1.45 × 10⁴ | 4.19 × 10⁵ | 5.73 × 10² | −1.71 × 10³ | 1.60 × 10³ | 1.94 × 10³ | 2.59 × 10⁷ |
Table 5.
Significant MT features from stepwise regression.
| Nomenclature | Acquired Data Range | ||
|---|---|---|---|
| Haas | Multi-Company | ||
| A | Number of axes | 3, 5 | |
| m | Mass (kg) | 917–16,874 | 1815–19,900 |
| P | Spindle power (kW) | 5.6–22.4 | |
| S | Spindle speed (rpm) | 4000–30,000 | |
| V | Volume (m3) | 0.024–8.19 | 0.031–65 |
| X | x-axis travel | 305–3810 | |
| Y | y-axis travel | 254–2223 | |
Table 6.
Standard error and p-values for Haas cost (price) model (found in Equation (2)).
| Features | Standard Error | p-Value |
|---|---|---|
| Volume (mm3) | 1.919 × 10⁴ | 7.666 × 10⁻⁴ |
| Spindle speed (RPM) | 8.639 × 10³ | 7.663 × 10⁻⁵ |
| x-axis travel (mm) | 1.256 × 10⁴ | 7.324 × 10⁻³ |
| y-axis travel (mm) | 1.181 × 10⁴ | 5.009 × 10⁻³ |
| Number of axes | 3.038 × 10³ | 1.794 × 10⁻²² |
| Mass (kg) | 8.794 × 10³ | 8.075 × 10⁻¹⁴ |
Table 7.
Standard errors and p-values for multi-company cost (price) model (found in Equation (4)).
| Features | Standard Error | p-Value |
|---|---|---|
| Volume (V, mm3) | 1.814 × 10⁴ | 3.570 × 10⁻³ |
| Spindle Power (P, kW) | 1.516 × 10⁴ | 4.518 × 10⁻² |
| Mass (m, kg) | 2.205 × 10⁴ | 2.389 × 10⁻⁴ |
Table 8.
Cost/price, embodied energy, and embodied CO2, savings from lightweighting the table.
| Savings | |
|---|---|
| Cost/Price | USD 7112 |
| Embodied Energy | 22,200 (MJ) |
| Embodied CO2 | 485 (kg CO2) |
Publisher’s Note: MDPI stays neutral with regard to jurisdictional claims in published maps and institutional affiliations. |
© 2021 by the authors. Licensee MDPI, Basel, Switzerland. This article is an open access article distributed under the terms and conditions of the Creative Commons Attribution (CC BY) license (https://creativecommons.org/licenses/by/4.0/).
Share and Cite
MDPI and ACS Style
Triebe, M.J.; Zhao, F.; Sutherland, J.W. Development of a Cost Model for Vertical Milling Machines to Assess Impact of Lightweighting. J. Manuf. Mater. Process. 2021, 5, 129. https://doi.org/10.3390/jmmp5040129
AMA Style
Triebe MJ, Zhao F, Sutherland JW. Development of a Cost Model for Vertical Milling Machines to Assess Impact of Lightweighting. Journal of Manufacturing and Materials Processing. 2021; 5(4):129. https://doi.org/10.3390/jmmp5040129
Chicago/Turabian StyleTriebe, Matthew J., Fu Zhao, and John W. Sutherland. 2021. "Development of a Cost Model for Vertical Milling Machines to Assess Impact of Lightweighting" Journal of Manufacturing and Materials Processing 5, no. 4: 129. https://doi.org/10.3390/jmmp5040129