1. Introduction
Research works on cellular materials have been primarily motivated by the possibility of expanding the effective range of mechanical properties attainable with convectional materials via the fabrication of strong and stiff lightweight structures [
1,
2]. Their distinguishing characteristics depend on a specific mesoscale distribution of solid and void volumes, which can be either stochastic (foams) or periodically ordered (lattice structures). One of the advantages of the ordered structures is that a regular arrangement of the matter allows greater control of their macroscopic physical and mechanical behavior, which is especially important for long-term applications [
3].
Developments experimented in recent years by additive manufacturing (AM) technologies have boosted the research in the field of lattice structures, thanks to the unique capacity of AM to fabricate complex engineered components, which would otherwise be unfeasible or prohibitively expensive [
4]. Available AM technologies allow the production of engineered components from a variety of polymers, metallic alloys, and ceramic materials.
Interest in lattice structures resides not only in their potentially enhanced structural performances, but also in the possibility of tailoring their functionality for different applications. For example, in the field of biomedicine, there is a strong interest in the development of engineered lattice structures capable of mimicking the mechanical behavior of bones and providing strong bonding with surrounding tissues via the bone tissue ingrowth [
5,
6]. Moreover, the high surface/volume ratio of lattice structures makes them especially appropriate for high-efficiency heat exchangers [
7] and catalyzers [
8]. The power requirements for pumping fluids and gases through the lattices are reduced as compared to traditional foams due to their periodicity and, therefore, their higher permeability. The possibility of conformal cooling of insert parts in injections molds also constitutes an interesting opportunity [
9]. Finally, lattice structures can be used to enhance the damping and energy-absorbing properties of engineered systems [
10,
11].
Predicting the functional and structural performances of mechanical components made entirely or partially of lattice structures requires that the mathematical models of such components be built and validated. For the mechanical properties, analytical models exist, allowing the prediction of the elastic moduli, yield, and ultimate stresses of regular lattice structures as functions of the cell type, porosity, and properties of the base material [
1,
12,
13]. Usual assumptions consider lattice structure struts as bars transmitting normal efforts (stretching dominated behavior) or beams transmitting bending moments (bending dominated behavior) [
13,
14,
15]. The more three-dimensional the stress state becomes, as it occurs with relatively dense lattices, the more complicated the numerical methods applied for their modeling must be [
16,
17]. Besides attaining a comprehensive description of deformation mechanisms acting during loading, such a modeling allows the elaboration of simplified constitutive laws by which the macroscopic behavior of lattice structures can be simulated. However, any numerical model must be thoroughly validated before it can be used with confidence, which justifies the need in extensive experimental studies of the mechanical behavior of lattice structures.
Given that almost every mechanical component is subjected to cyclic loading during its service life, the capacity to predict the fatigue resistance of lattice-containing components becomes particularly relevant. Likewise with convectional dense parts, the fatigue properties of lattice structures are strongly influenced by their microstructure (grain size, texture, phase state) and surface roughness. The layer-by-layer material deposition and localized melting phenomena, which take place during AM processing, result in a strong material anisotropy and in a high level of residual stresses, both effects strongly impacting the fatigue resistance of AM-built components [
11,
18,
19,
20,
21]. Moreover, porosity and surface defects induced by the process are prone to trigger failure mechanisms like crack nucleation or plastic collapse. Therefore, to account for the influence of defects on the mechanical behavior of AM-built components, it is necessary to correlate their type, size, and distribution with the process parameters [
22,
23,
24,
25]. Another aspect to be accounted for is related to the resulting dimensions of the components. The strut thickness of the commonly designed lattice structures (some hundreds of microns) is comparable to the melting pool and the heat-affected zone along the process [
23], whose sizes depend on laser power, spot size, layer thickness, and scanning speed. Additionally, surface roughness and dimensional accuracy of AM components depend on the powder particle size distribution, typically ranging from 20 to 60 μm [
23,
24]. In their statistical study, Sing et al. concluded that, while all the parameters mentioned affect the dimensions and, therefore, the mechanical properties of AM-built lattice structures [
25], the laser power appears to be the most relevant one to be optimized.
The problem becomes even more complex when we consider that the mechanical response of lattice structures can also be orientation-dependent due to the intrinsic anisotropy of building blocks (cells). In this regard, Zhao et al. [
26] studied the compressive fatigue lives of different lattice structures with relative densities ranging from 36 to 38%. They differentiated the strut damage mechanism of bending from that of buckling, and suggested that the fatigue resistance of lattice structures could be improved if the cell struts were aligned along the loading direction. In another study of compressive fatigue of lattice structures with relative densities ranging from 11 to 34%, Amin Yavari et al. [
27] also argued that the fatigue properties of lattice structures depend on the angle between the cell struts and the loading direction.
In both these works [
26,
27], it was found that the fatigue lives of cubic cell-based structures were superior to those of lattice structures with other cell geometries, such as the diamond, dodecahedron, or truncated cuboctahedron, with this outcome being mainly attributed to particular orientations of these structures during their testing. A similar conclusion on the particular significance of the lattice structure cell orientation with respect to the loading direction was also drawn by Wauthle et al. [
28]. It should, however, be noted that, although the preceding studied exposed the importance of considering the cell orientation during loading, no systematic research was carried out with respect to the fatigue properties of differently oriented lattice structures.
Another point that must be mentioned is that most of the studies covering the fatigue resistance of lattice structures were carried out under compressive loads. In one of the scarce works on the tensile fatigue of lattice structures, Huynh et al. [
29] highlighted the importance of accounting for the effective concentration factors in the estimation of maximum stresses occurring in these structures under loading.
To sum-up, the continuous efforts to predict the fatigue resistance of AM-built lattice structures needs to be supported by a comprehensive experimental database, which would also include results from other materials than the extensively studied Ti-based alloys.
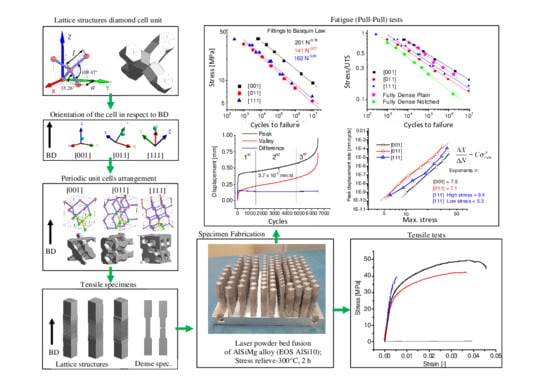
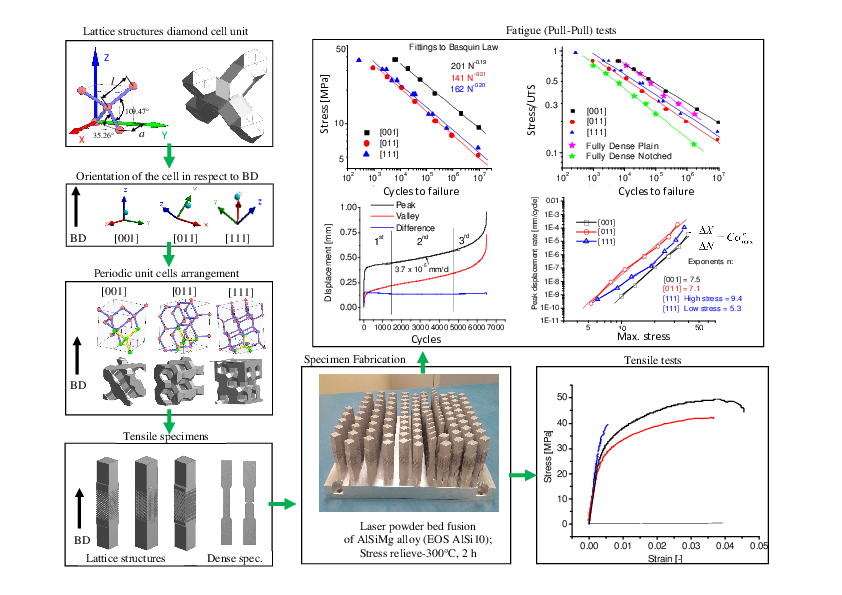
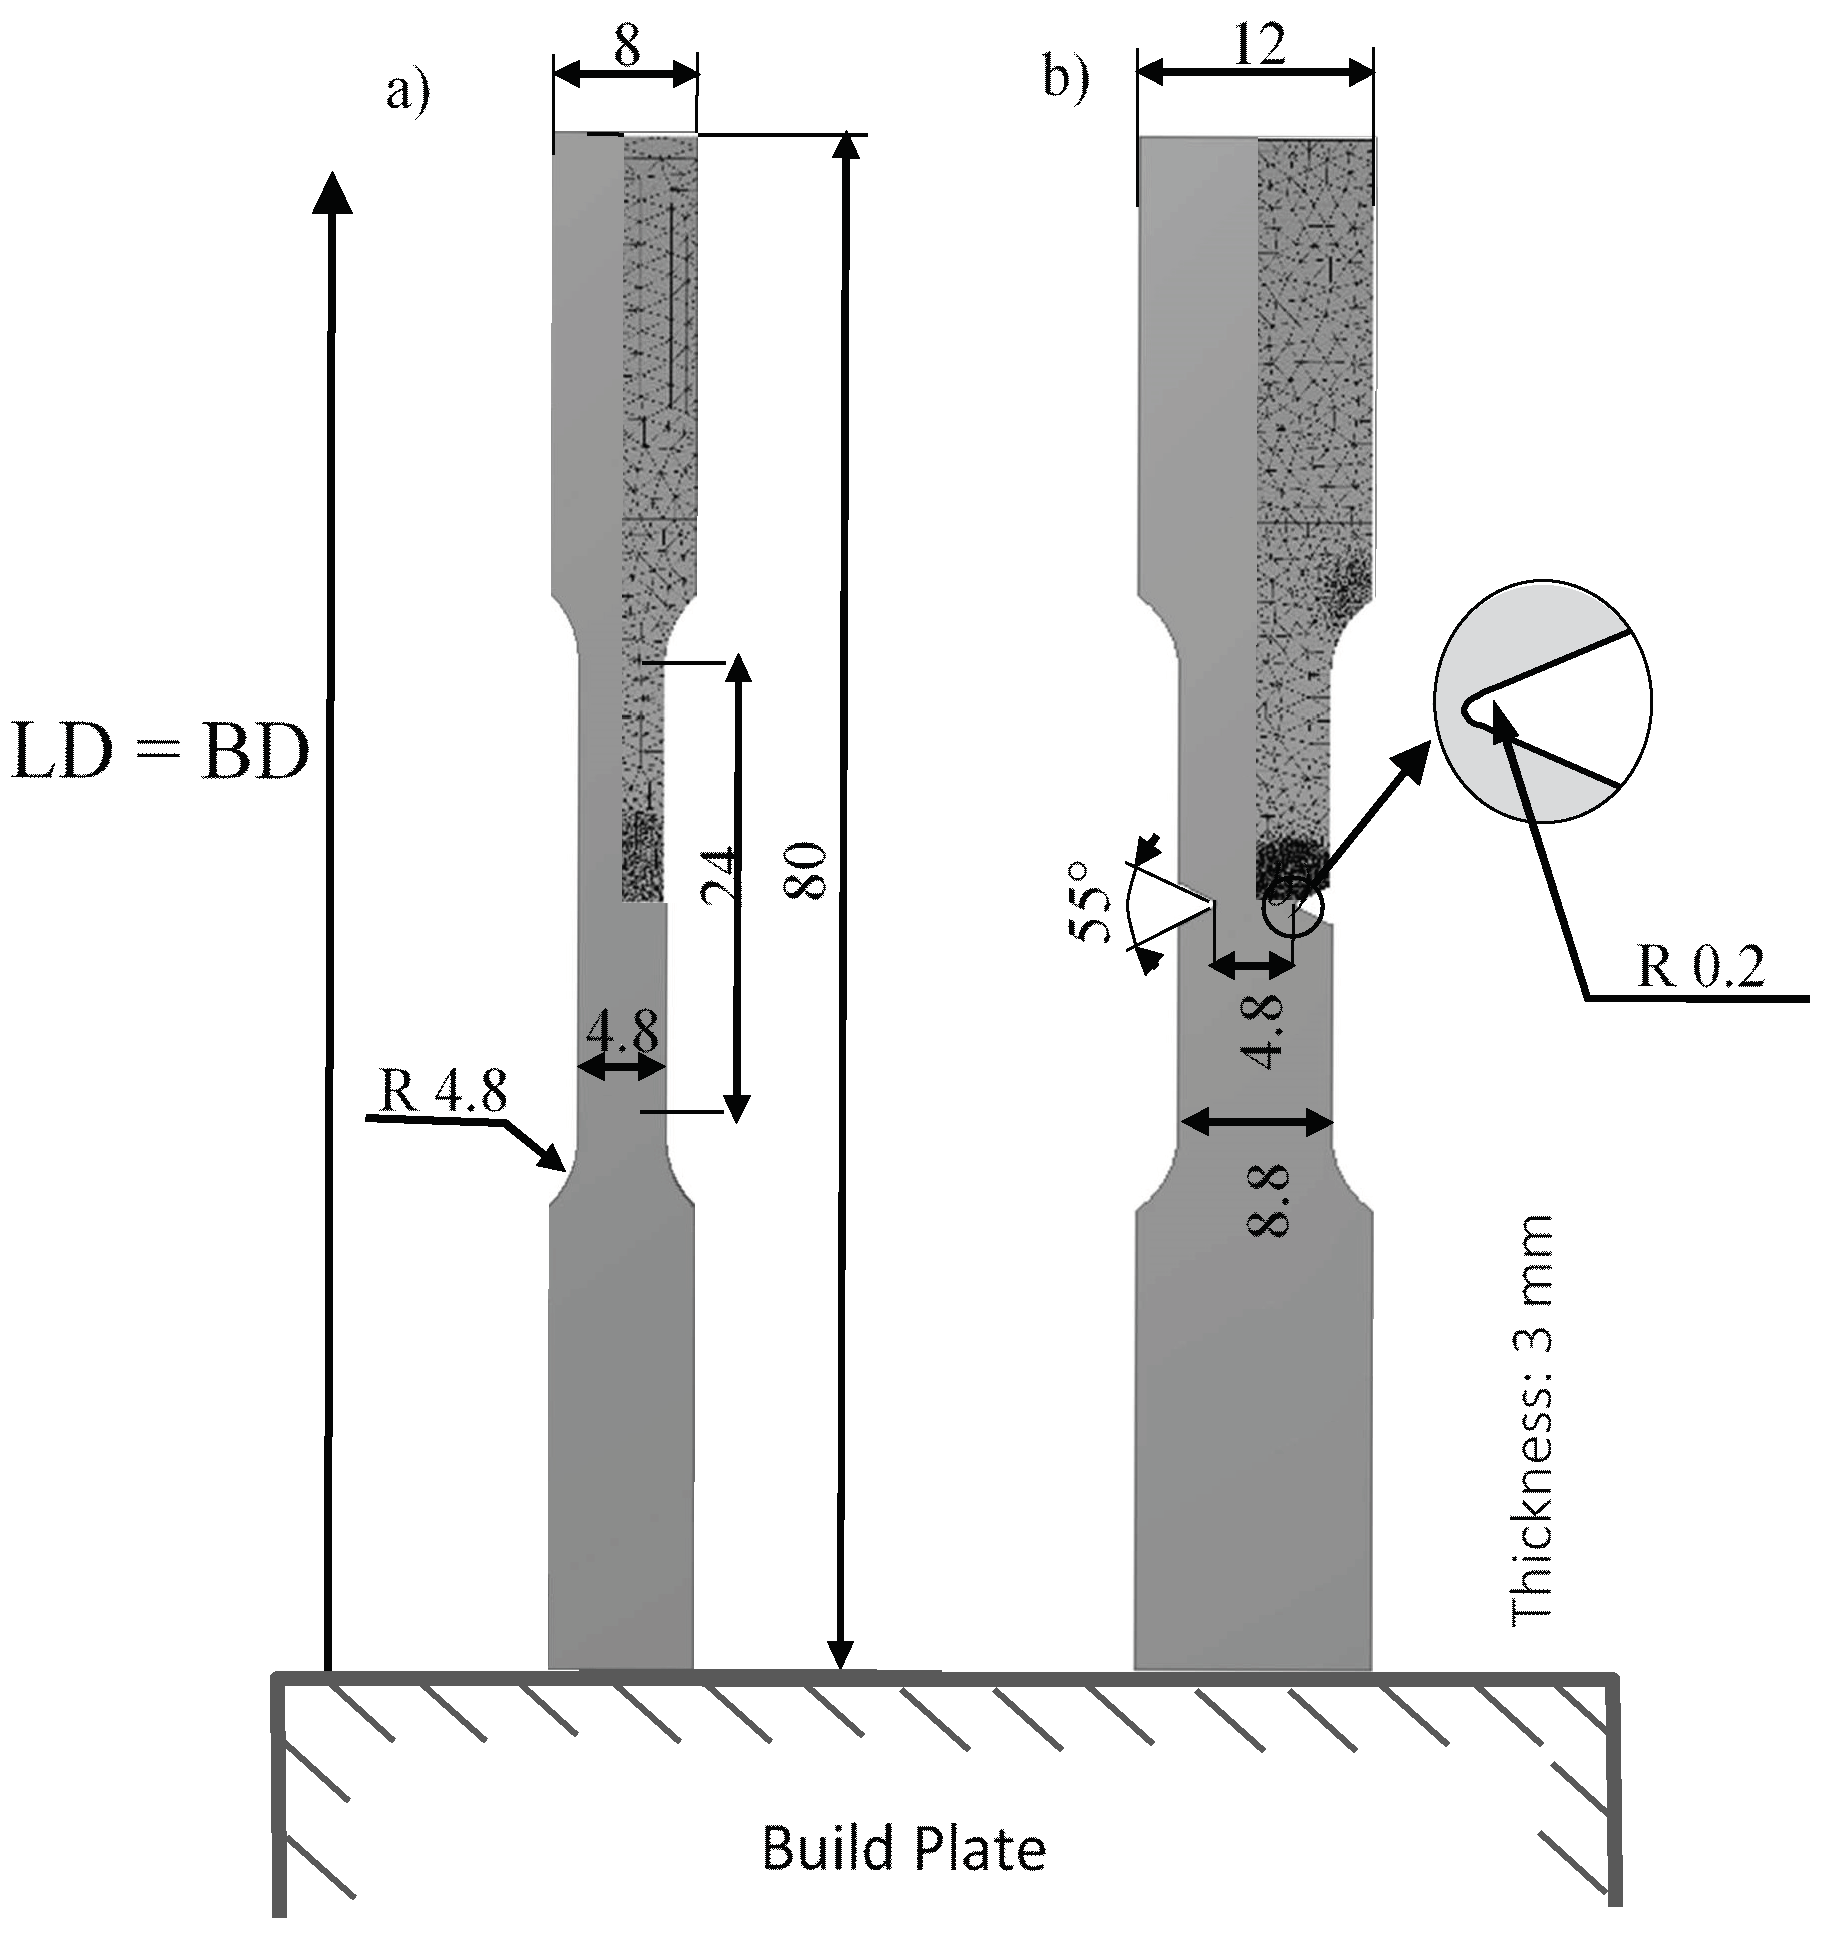
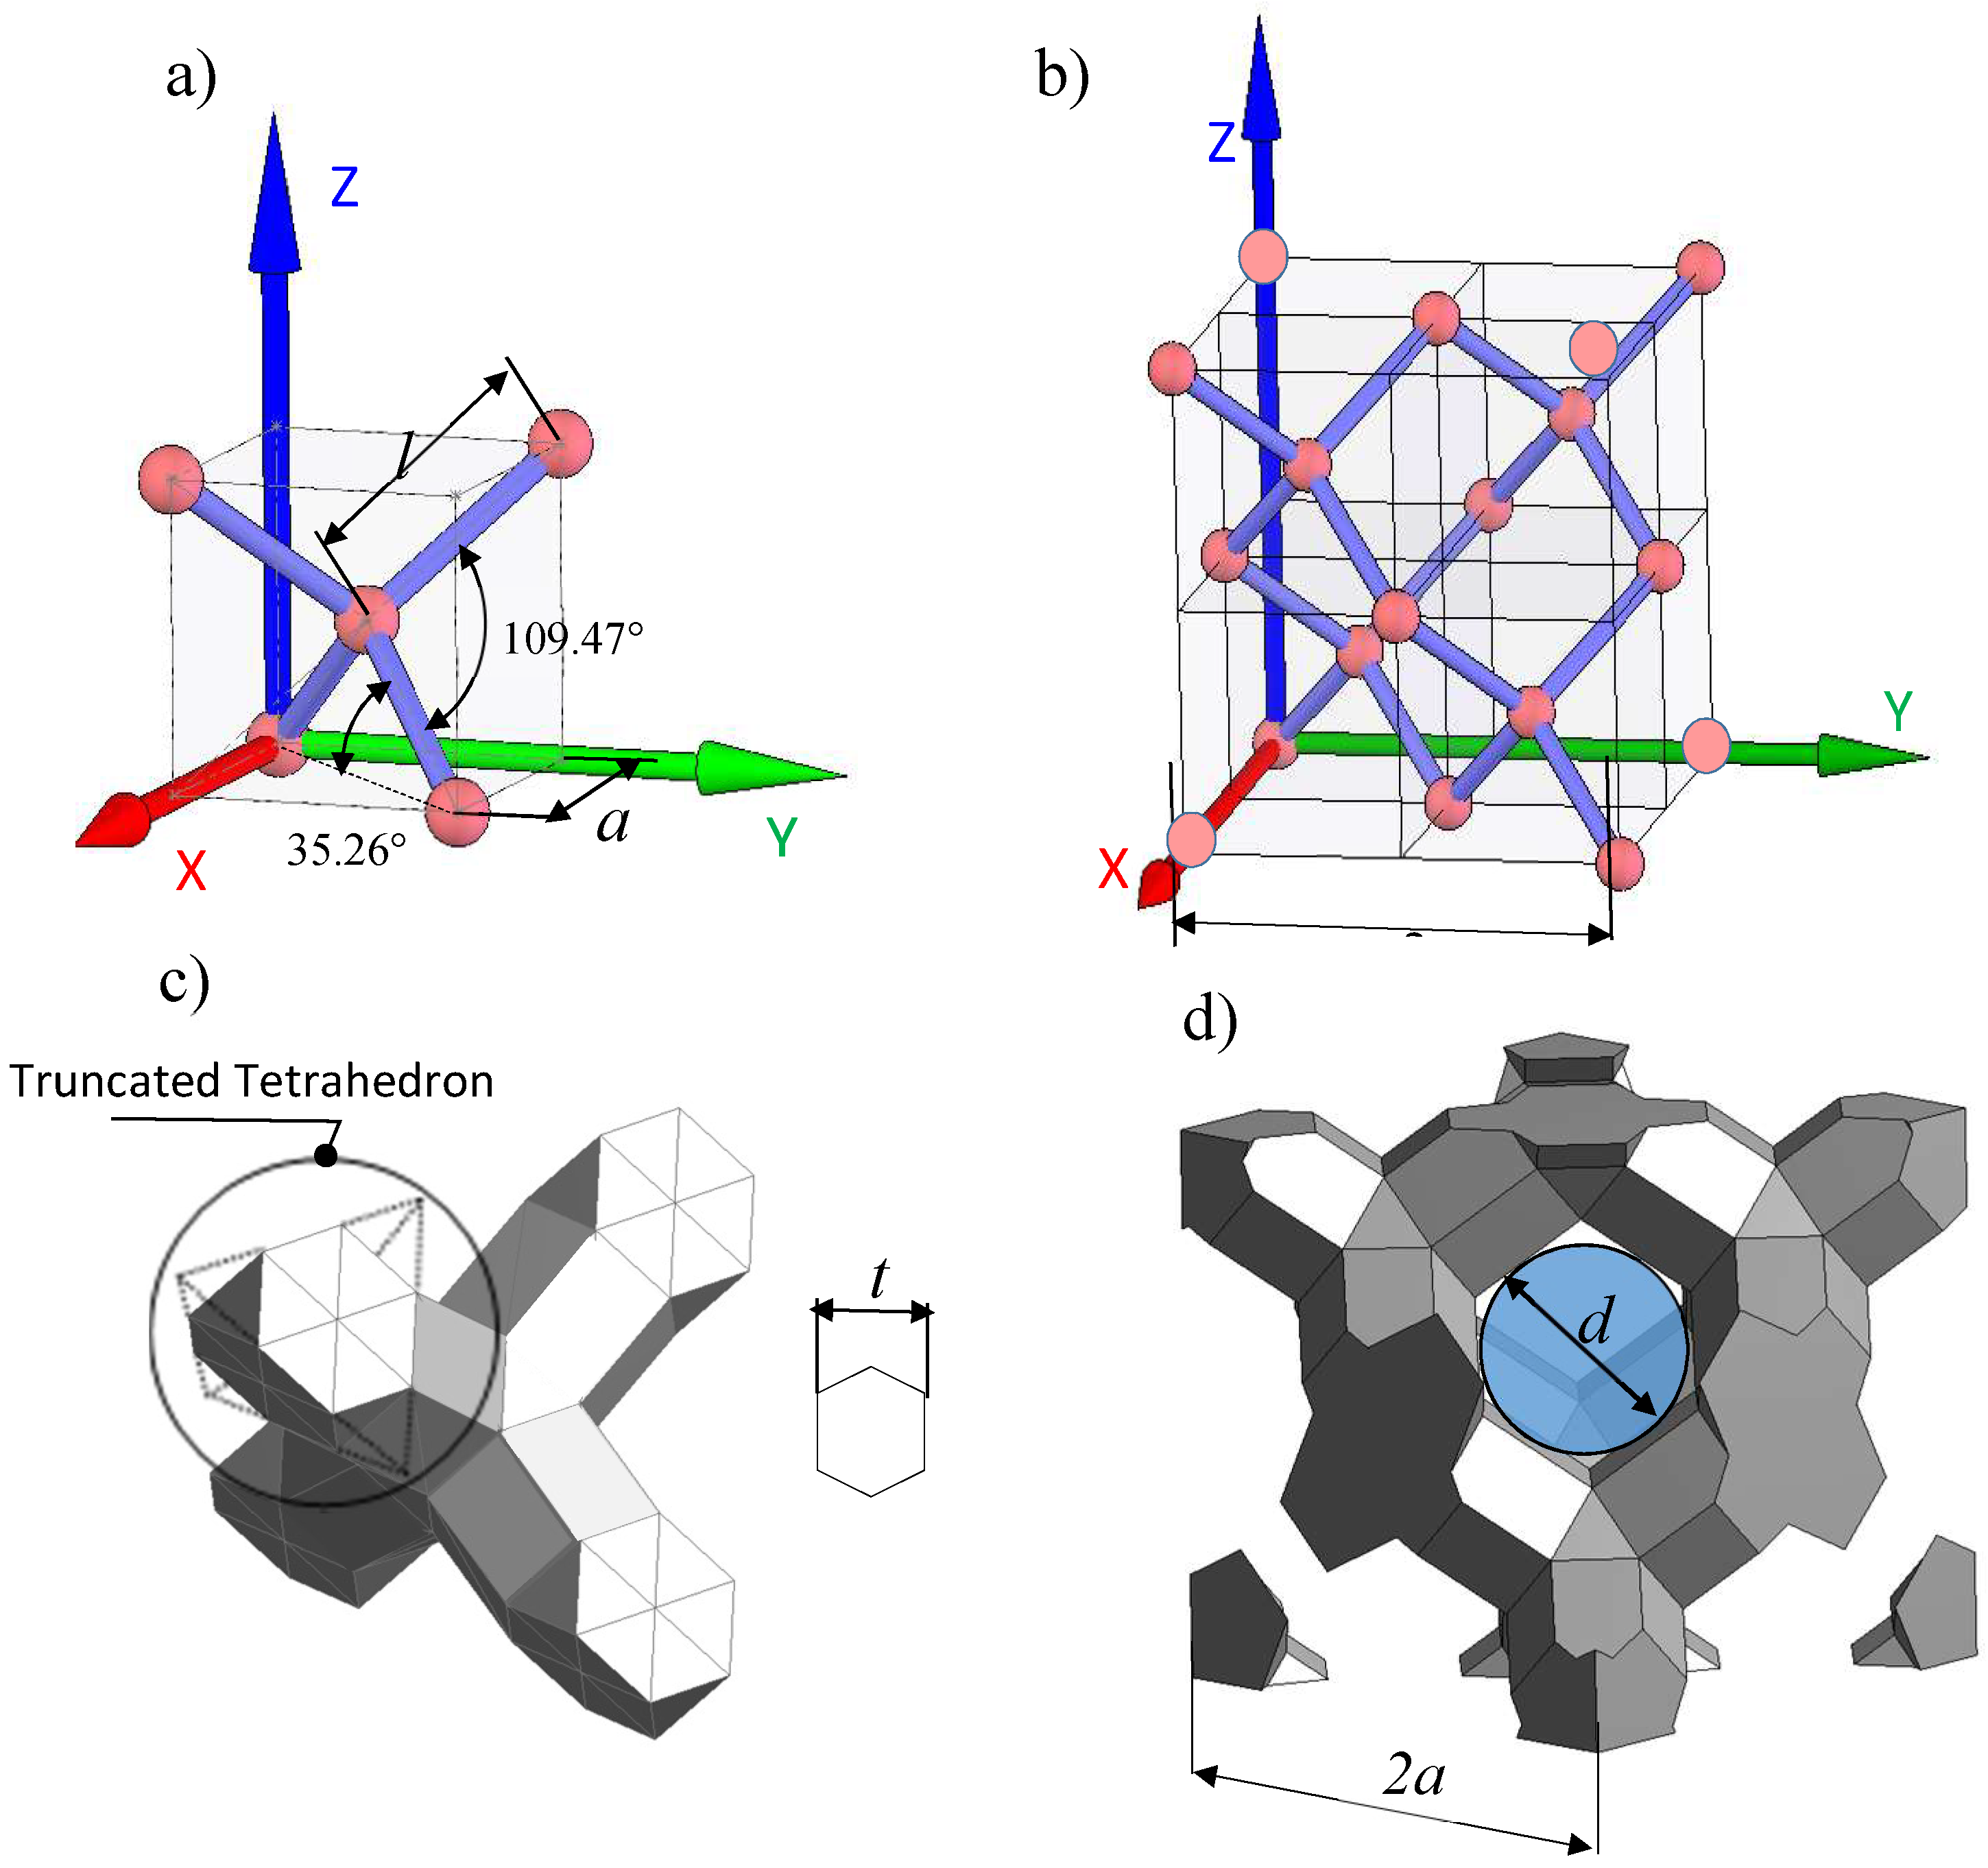
In this work, the tensile static and fatigue mechanical behavior of diamond lattice structure specimens made from an AlSiMg alloy using laser powder bed fusion (L-PBF) is experimentally assessed. The testing specimens are fabricated with three different unit cell orientations with respect to the manufacturing and testing directions, to verify if a significant anisotropy is present in their mechanical behavior. In parallel with the lattice specimens, fully dense plain and notched tensile specimens made from the same material and using the same technology are characterized, and the results obtained compared, in order to reach a conclusion on the impact of lattices on the static and fatigue behavior of L-PBF-built components.
3. Experimental Program and Results
Static and fatigue tensile testing with plain and notched fully dense specimens, and with specimens bearing differently oriented diamond lattice structures was carried out using an MTS 858 Minibionix II system equipped with a 15 kN load cell. The forces and displacements were recorded using a load cell and the position sensor (LVDT) of the system.
The fatigue testing was performed at room temperature at a 15 Hz frequency, and consisted in a force controlled tension–tension cycling up to a run-out value of 106 cycles for dense specimens and 107, for lattice specimens. For all the tests, the ratio of the minimum to the maximum force (stress) in a cycle, R, was set to 0.1. For each fatigue testing run, the maximum stress applied in a cycle, σmax was set as a fraction of the corresponding value of the yield stress, σy. Fatigue testing of fully dense plain specimens was performed for 1.2, 1, 0.8, 0.6, 0.5, and 0.4 σy fractions, while the notched specimens were tested for 1.2, 1, 0.8, 0.6, 0.5, 0.4, and 0.2 σy fractions. For the lattice specimens, the σy fractions were 1.2, 1, 0.8, 0.6, 0.4, 0.3, and 0.2. For the fully dense plain and notched specimens, one specimen for each stress level was fatigue-tested. For the lattice specimens, two tests for each level of maximum stresses were performed, except for the fractions 0.3 and 0.2, where a single fatigue test was carried out.
Finally, for some of the tests performed, a digital image correlation (DIC) system (GOM Aramis) was used for the acquisition of the displacement fields.
3.1. Monotonic Tensile Testing
3.1.1. Fully Dense Specimens
Plain Specimens
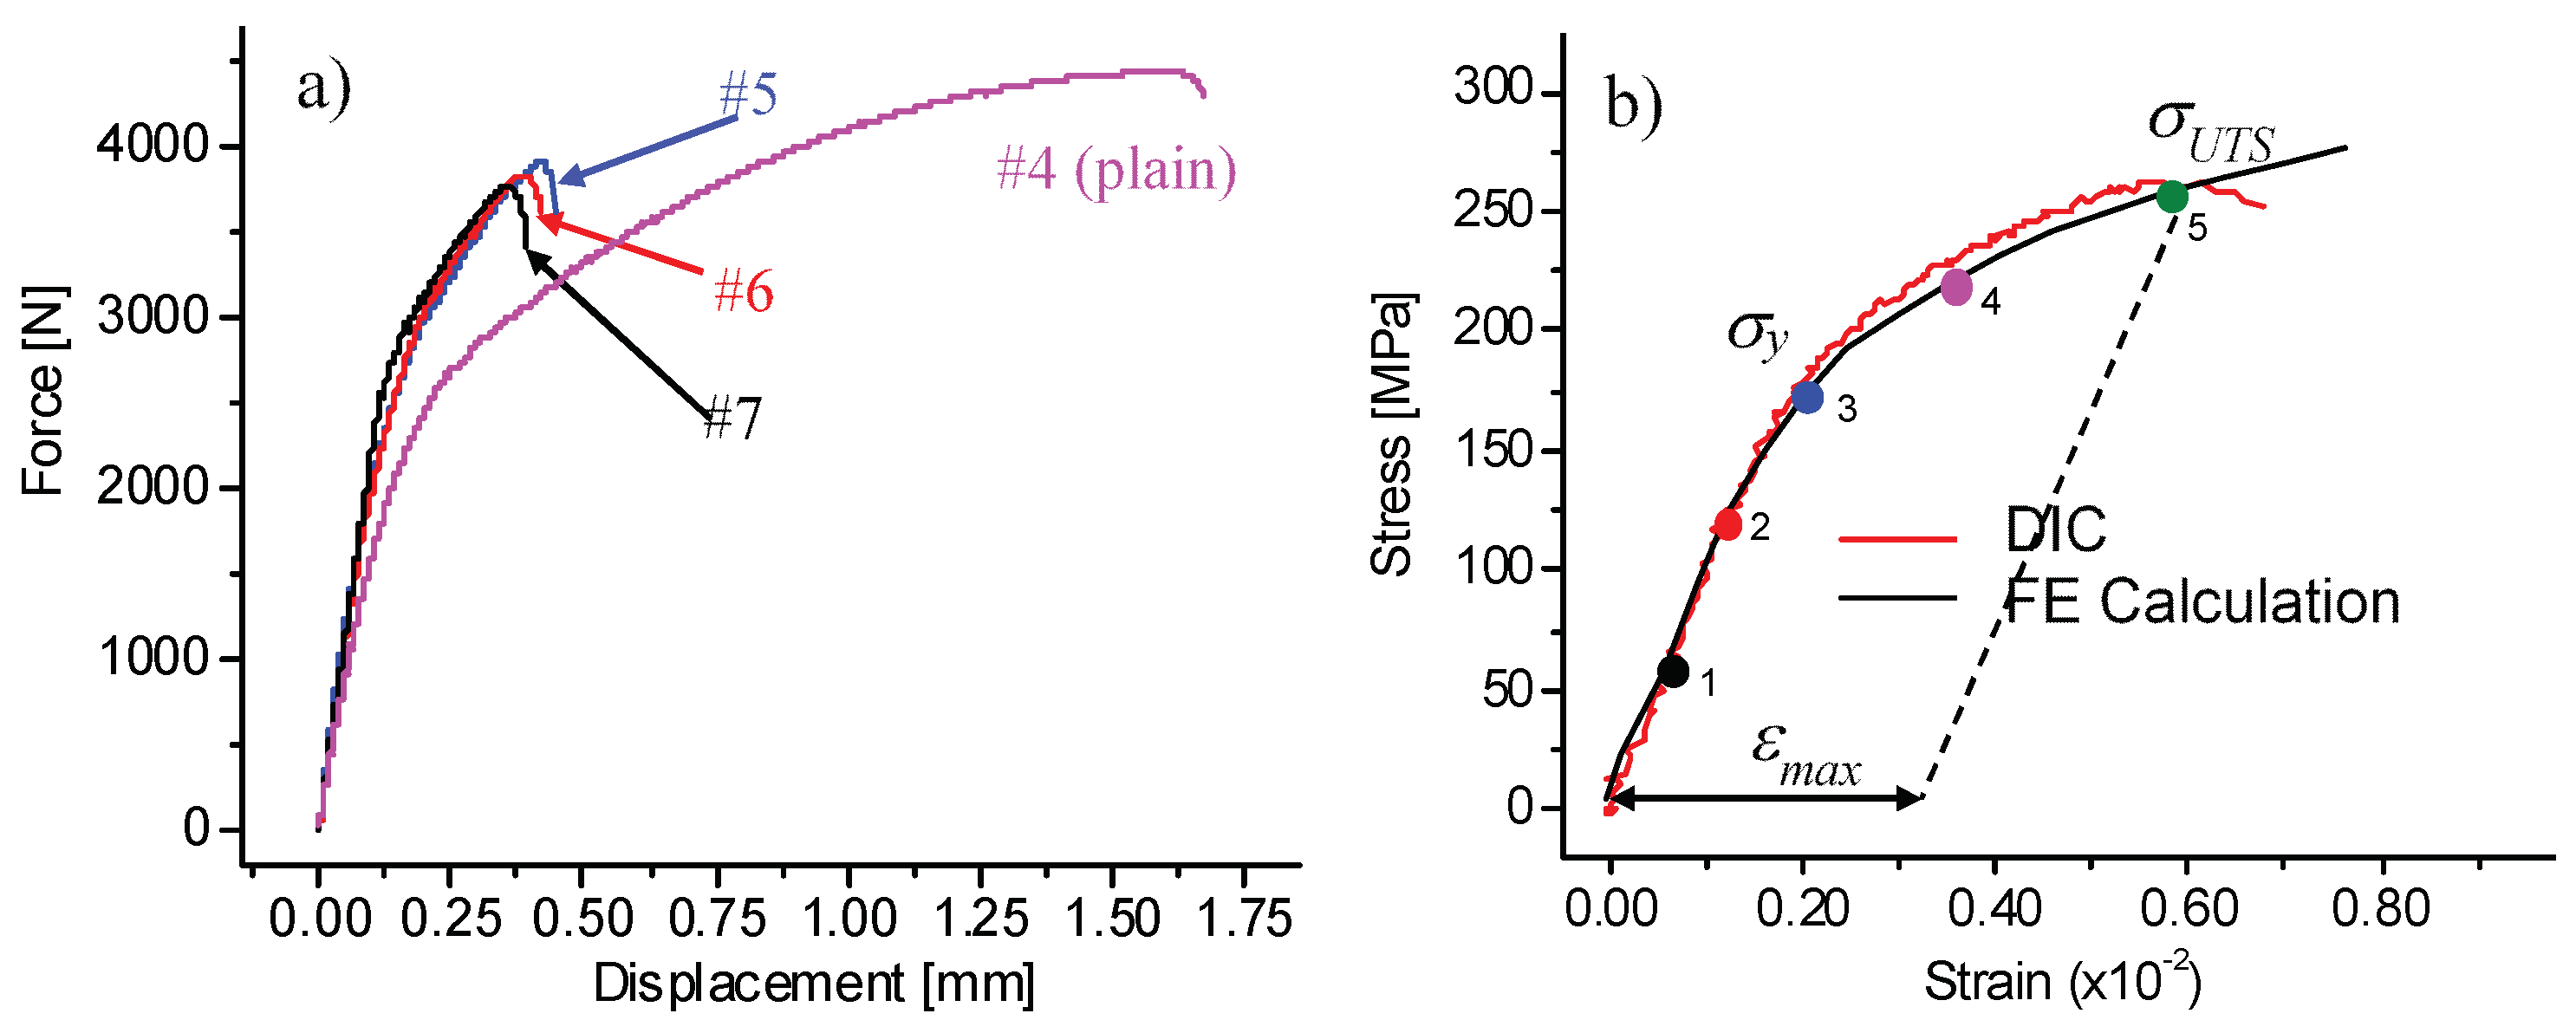
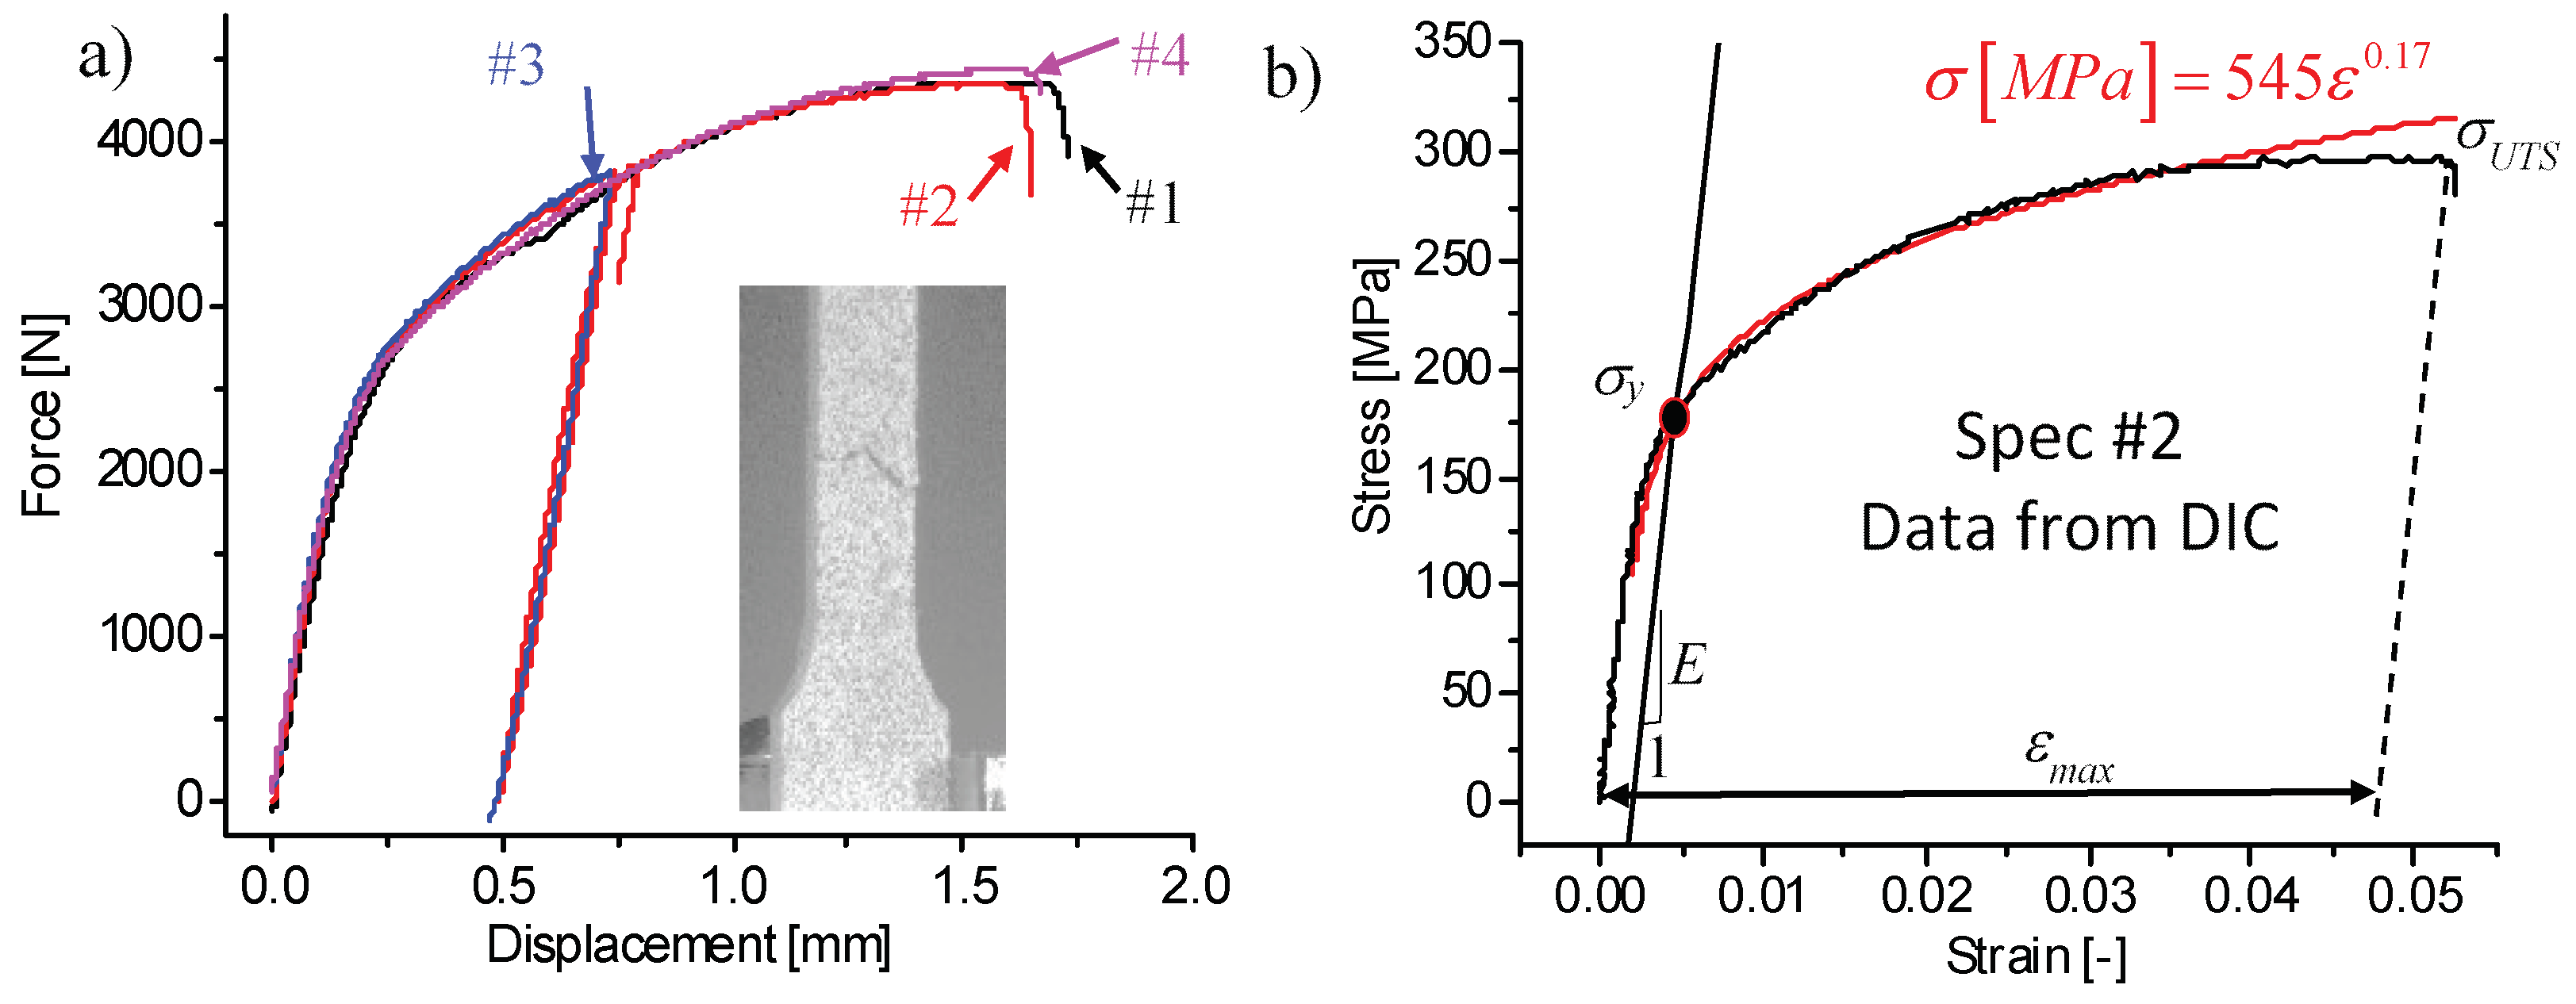
Four plain specimens were subjected to tensile testing: Specimens #1 and #4 were strained up to failure, #3 was loaded and unloaded, and #2 was loaded, unloaded, and strained up to failure. The force–displacement diagrams obtained during testing of plain specimens are shown in
Figure 8a, and they reflect almost perfect inter-specimen repeatability. Failure occurred with almost no localized area reduction, as seen in the picture included in
Figure 8a.
Using the displacement fields measured inside a 5 mm central gage length of one of the plain specimens (DIC-ARAMIS), the stress–strain diagram was built (
Figure 8b), and the Young’s modulus
E, the yield stress
σy, the ultimate tensile strength
σUTS, and the elongation at break
εmax were calculated and are shown in
Table 2. These results are comparable to those obtained with the same alloy subjected to a similar heat treatment by Geng et al. [
38]: the differences in the
E and
σUTS values are less than 4%, while that in the
σy values, less than 20%. The red curve in
Figure 8b corresponds to the stress–strain diagram fitted with an exponential expression (Hollomon fitting). This expression was utilized as a material law for the FE simulations presented below.
Notched Specimens
Figure 9a includes the force–displacement diagrams obtained during monotonic tensile testing of three notched specimens, #5, #6 and #7, along with the diagram of a selected plain specimen. As in the case of plain specimens, no significant variations were observed among the tested notched specimens. The same experiment was then FE-simulated using the model of the notched specimen shown in
Figure 1b, and the FE-calculated stress–strain diagram is superposed in
Figure 9b on the DIC-measured stress–strain diagram (a gage length of 3.6 mm was used for both the FE simulations and the DIC measurements). It can be seen that the tensile behavior of the notched specimens is reproduced by the FE simulations with acceptable agreement.
Since, in this case, the strain along the gage length was non-uniform, it was not possible to calculate the elastic modulus. However, a mean yield stress of 193 MPa, associated with the generalized plastic deformation in the notched zone, was measured at the point where the force–displacement diagram clearly departs from its linear region. The mean ultimate tensile strength of 266 MPa was also measured in the same zone of the specimen. Note that the mean yield stress for the notched specimens was 11% higher, while the mean ultimate tensile strength, 12.5% lower than those measured for their plain counterparts (
Table 2).
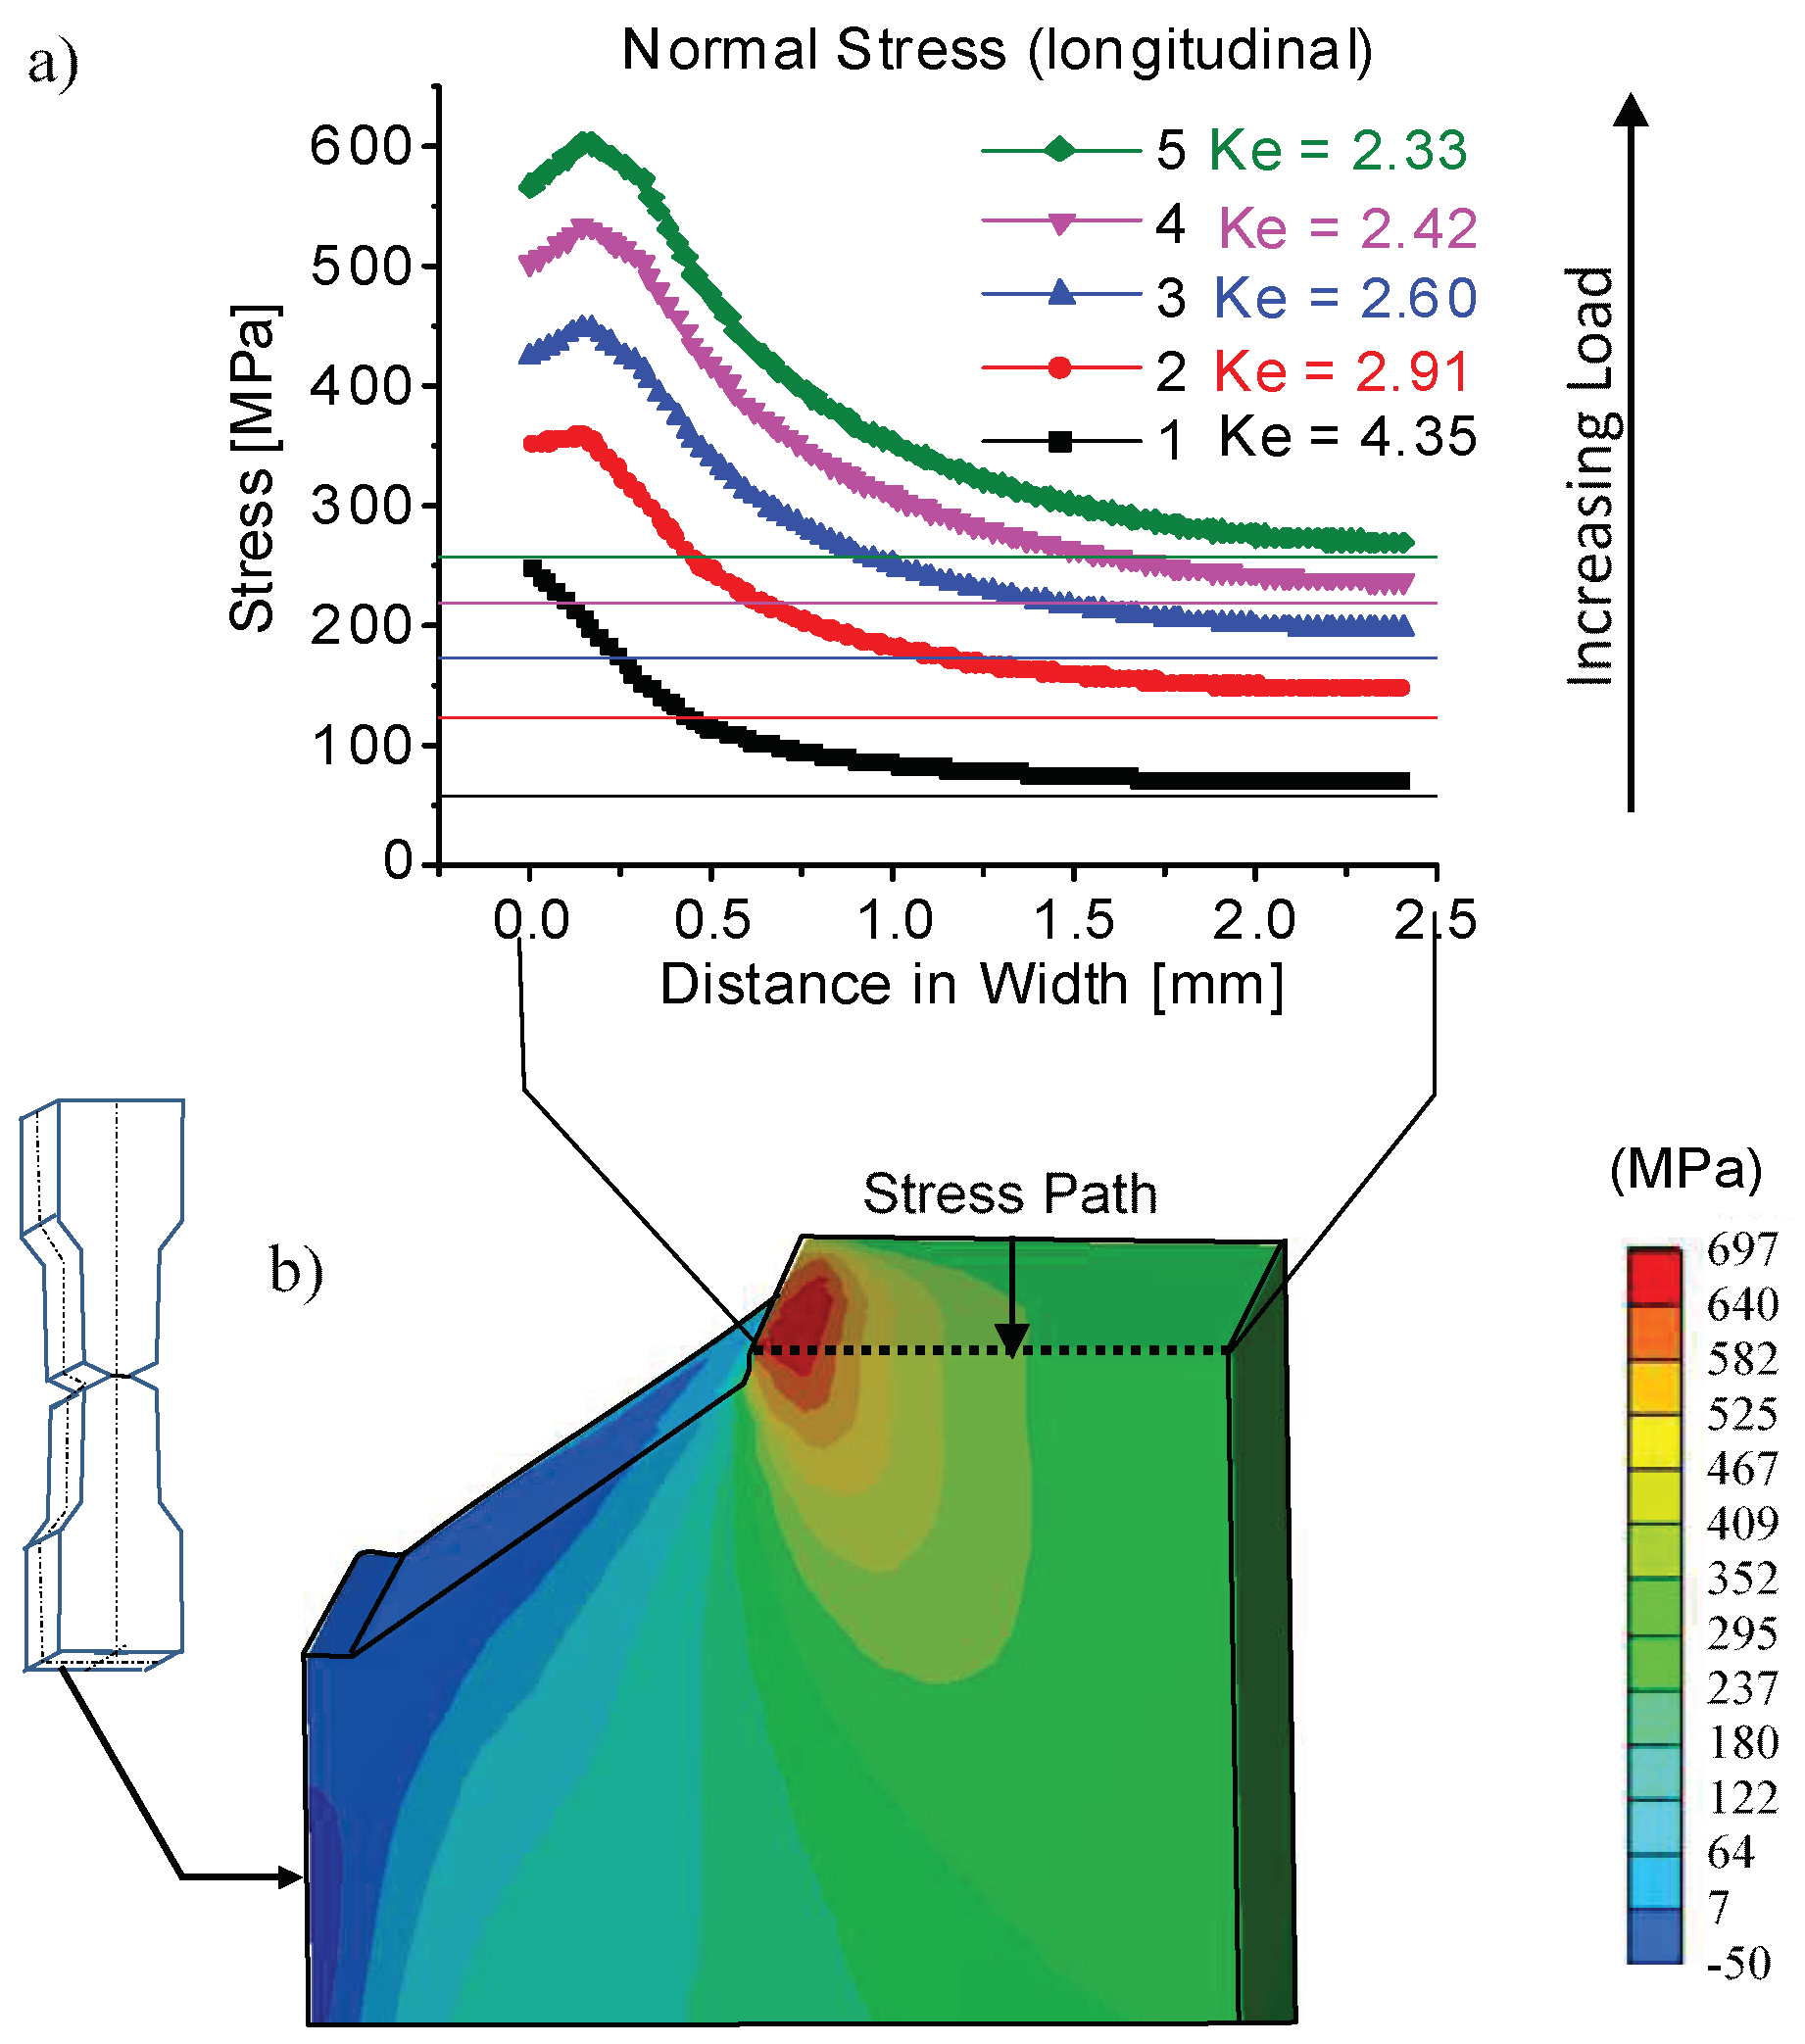
Next, the FE model of the notched specimens was used for the numerical evaluation of an effective stress concentration factors (
Ke) associated with the imposed notch geometry and the measured material behavior. Each plot in
Figure 10a corresponds to the evolution of the normal axial stress along a straight path that goes from the root of the notch to the center of the specimen (
Figure 10b), for each of the 5 levels of the mean stresses incrementally shown on the stress–strain diagram in
Figure 9b. It can be seen that the normal stress reaches its maximum,
σmax, at a certain distance from the notch root and then decreases to approach the colored horizontal straight lines. Each straight line corresponds to the value of a mean stress
for each loading level from 1 to 5 (an initial dense specimen net cross section of 14.4 mm
2 was used for these calculations). The effective stress concentration factor for each level of loading was then calculated as
It can be observed in
Figure 10a that the greater the load applied to the specimen, the lower the effective stress concentration factor caused by the notch; this phenomenon reflects stress relaxation in the vicinity of the notch due to local plasticity. Since the stress concentration factor remains significantly high even in the zone of plastic deformation (>2.33), the mechanical behavior of this material can be considered highly notch-sensitive.
3.1.2. Lattice Specimens
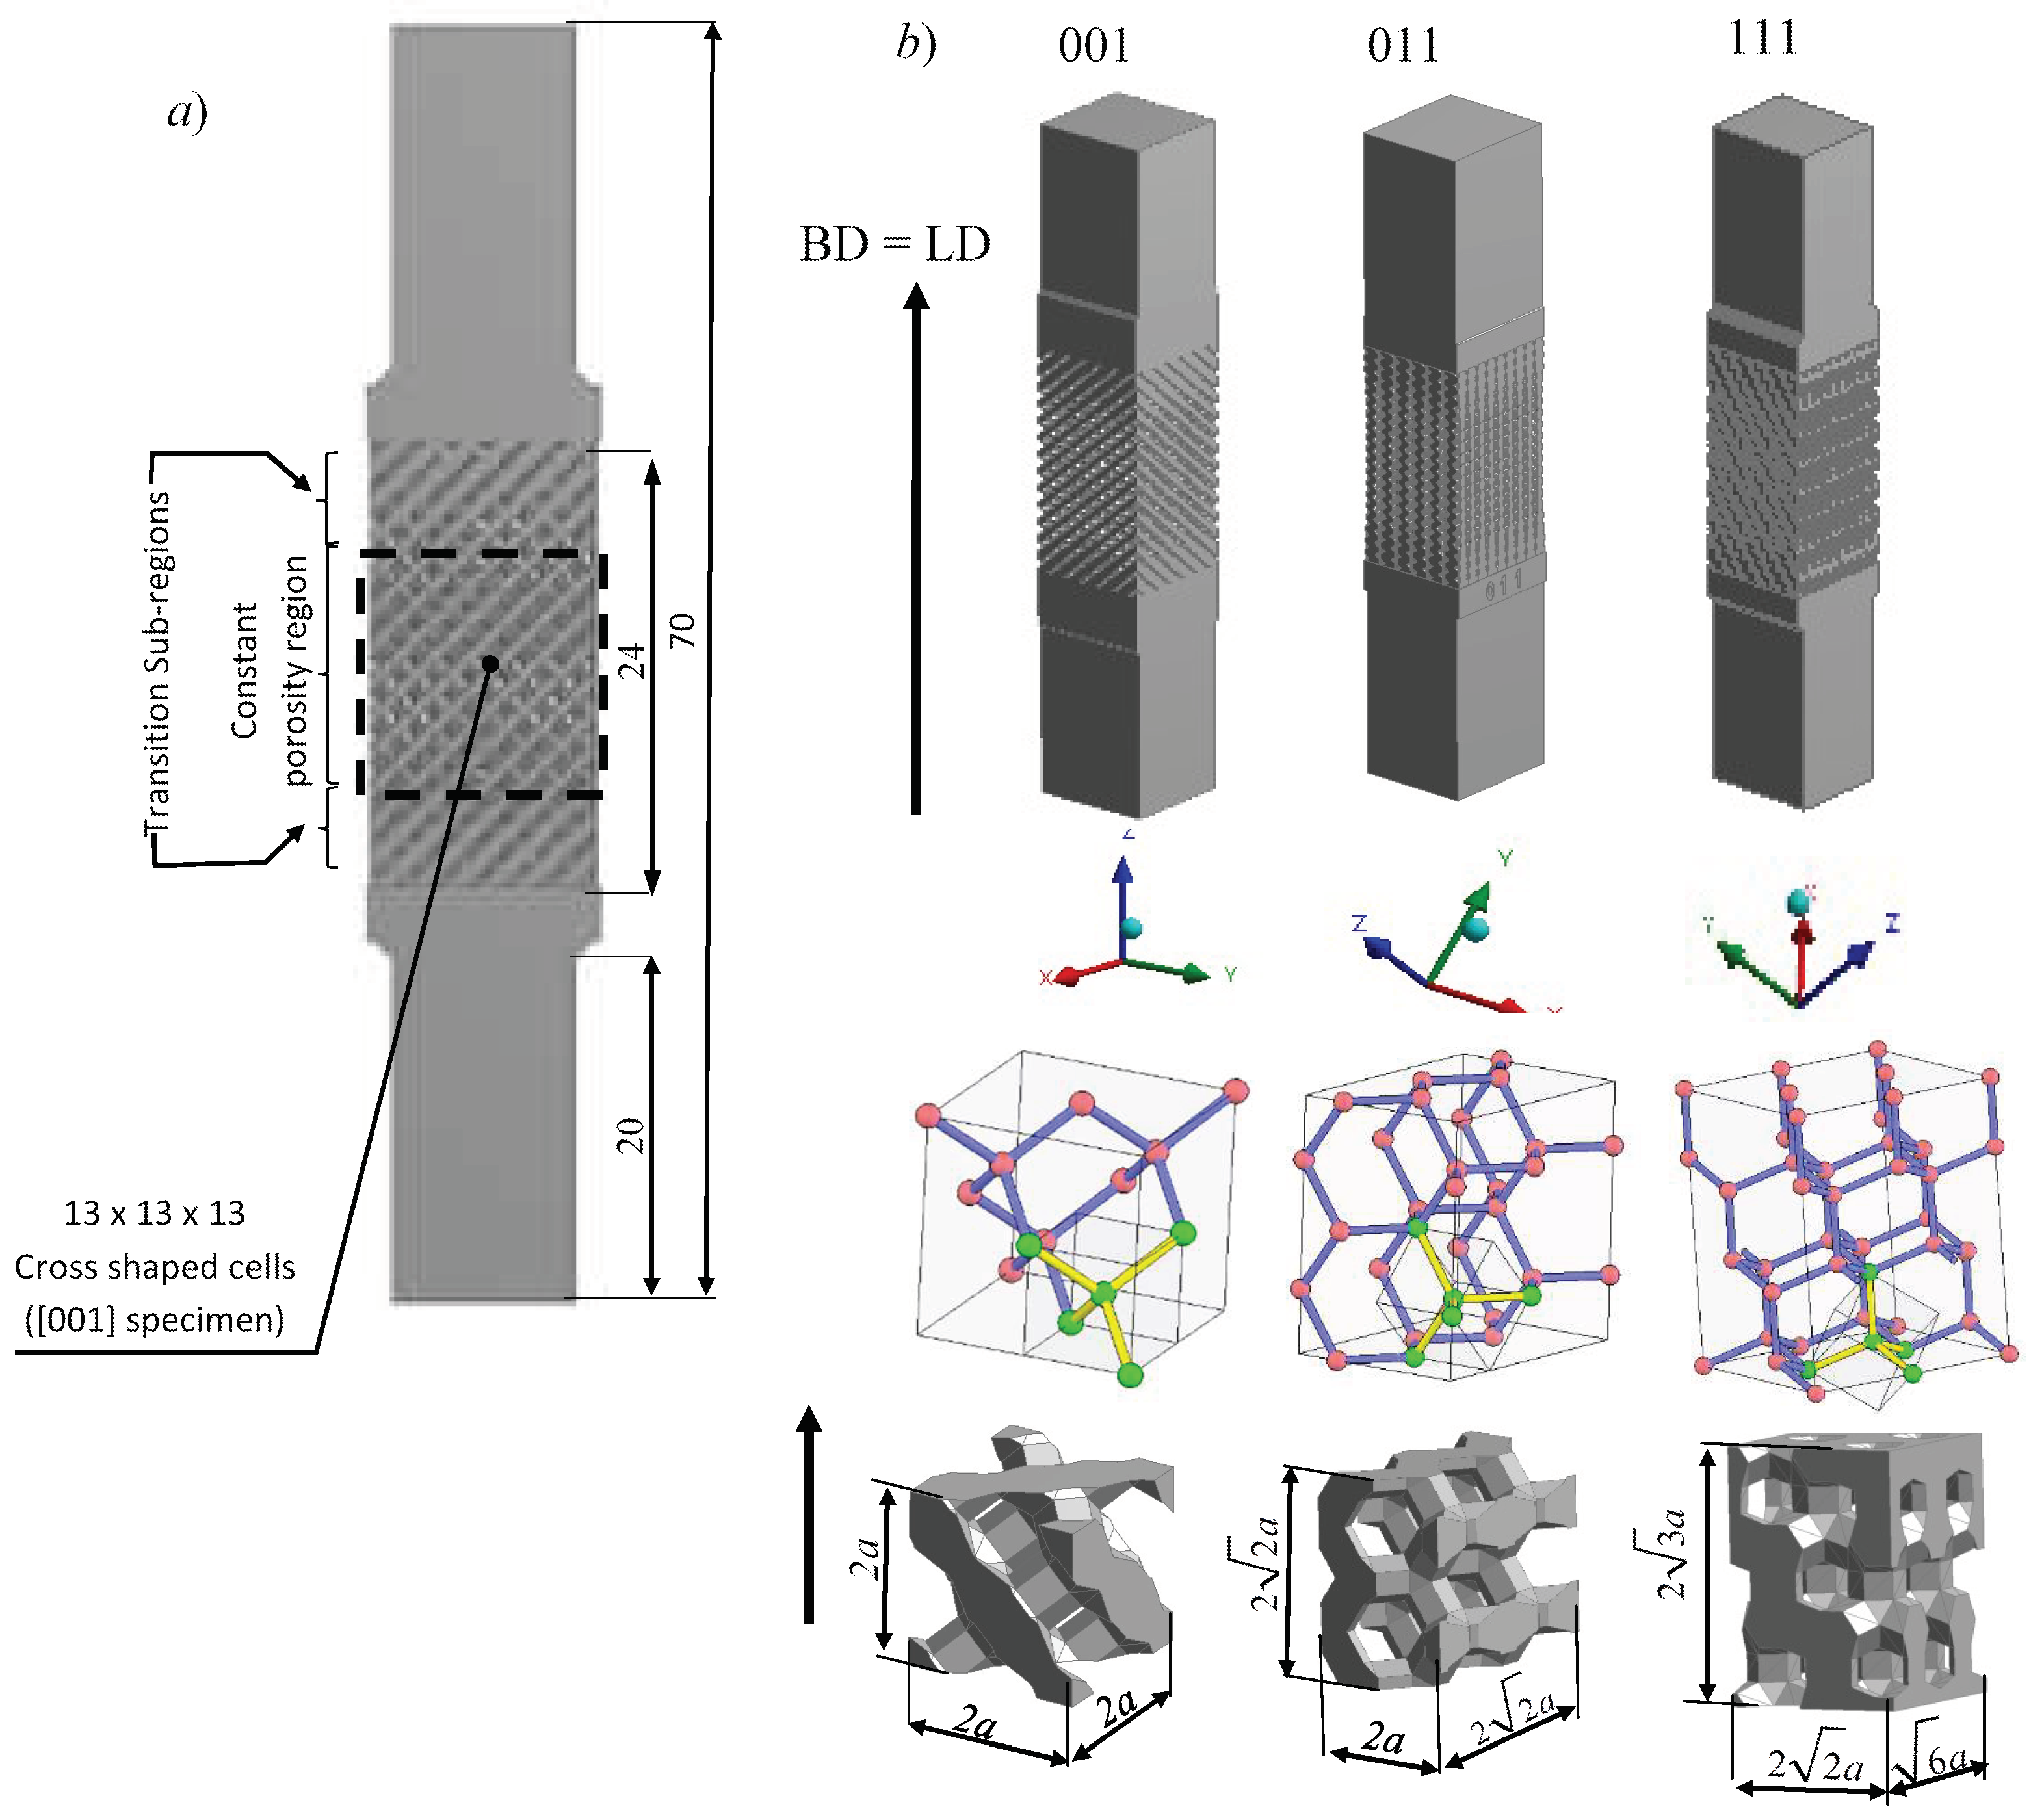
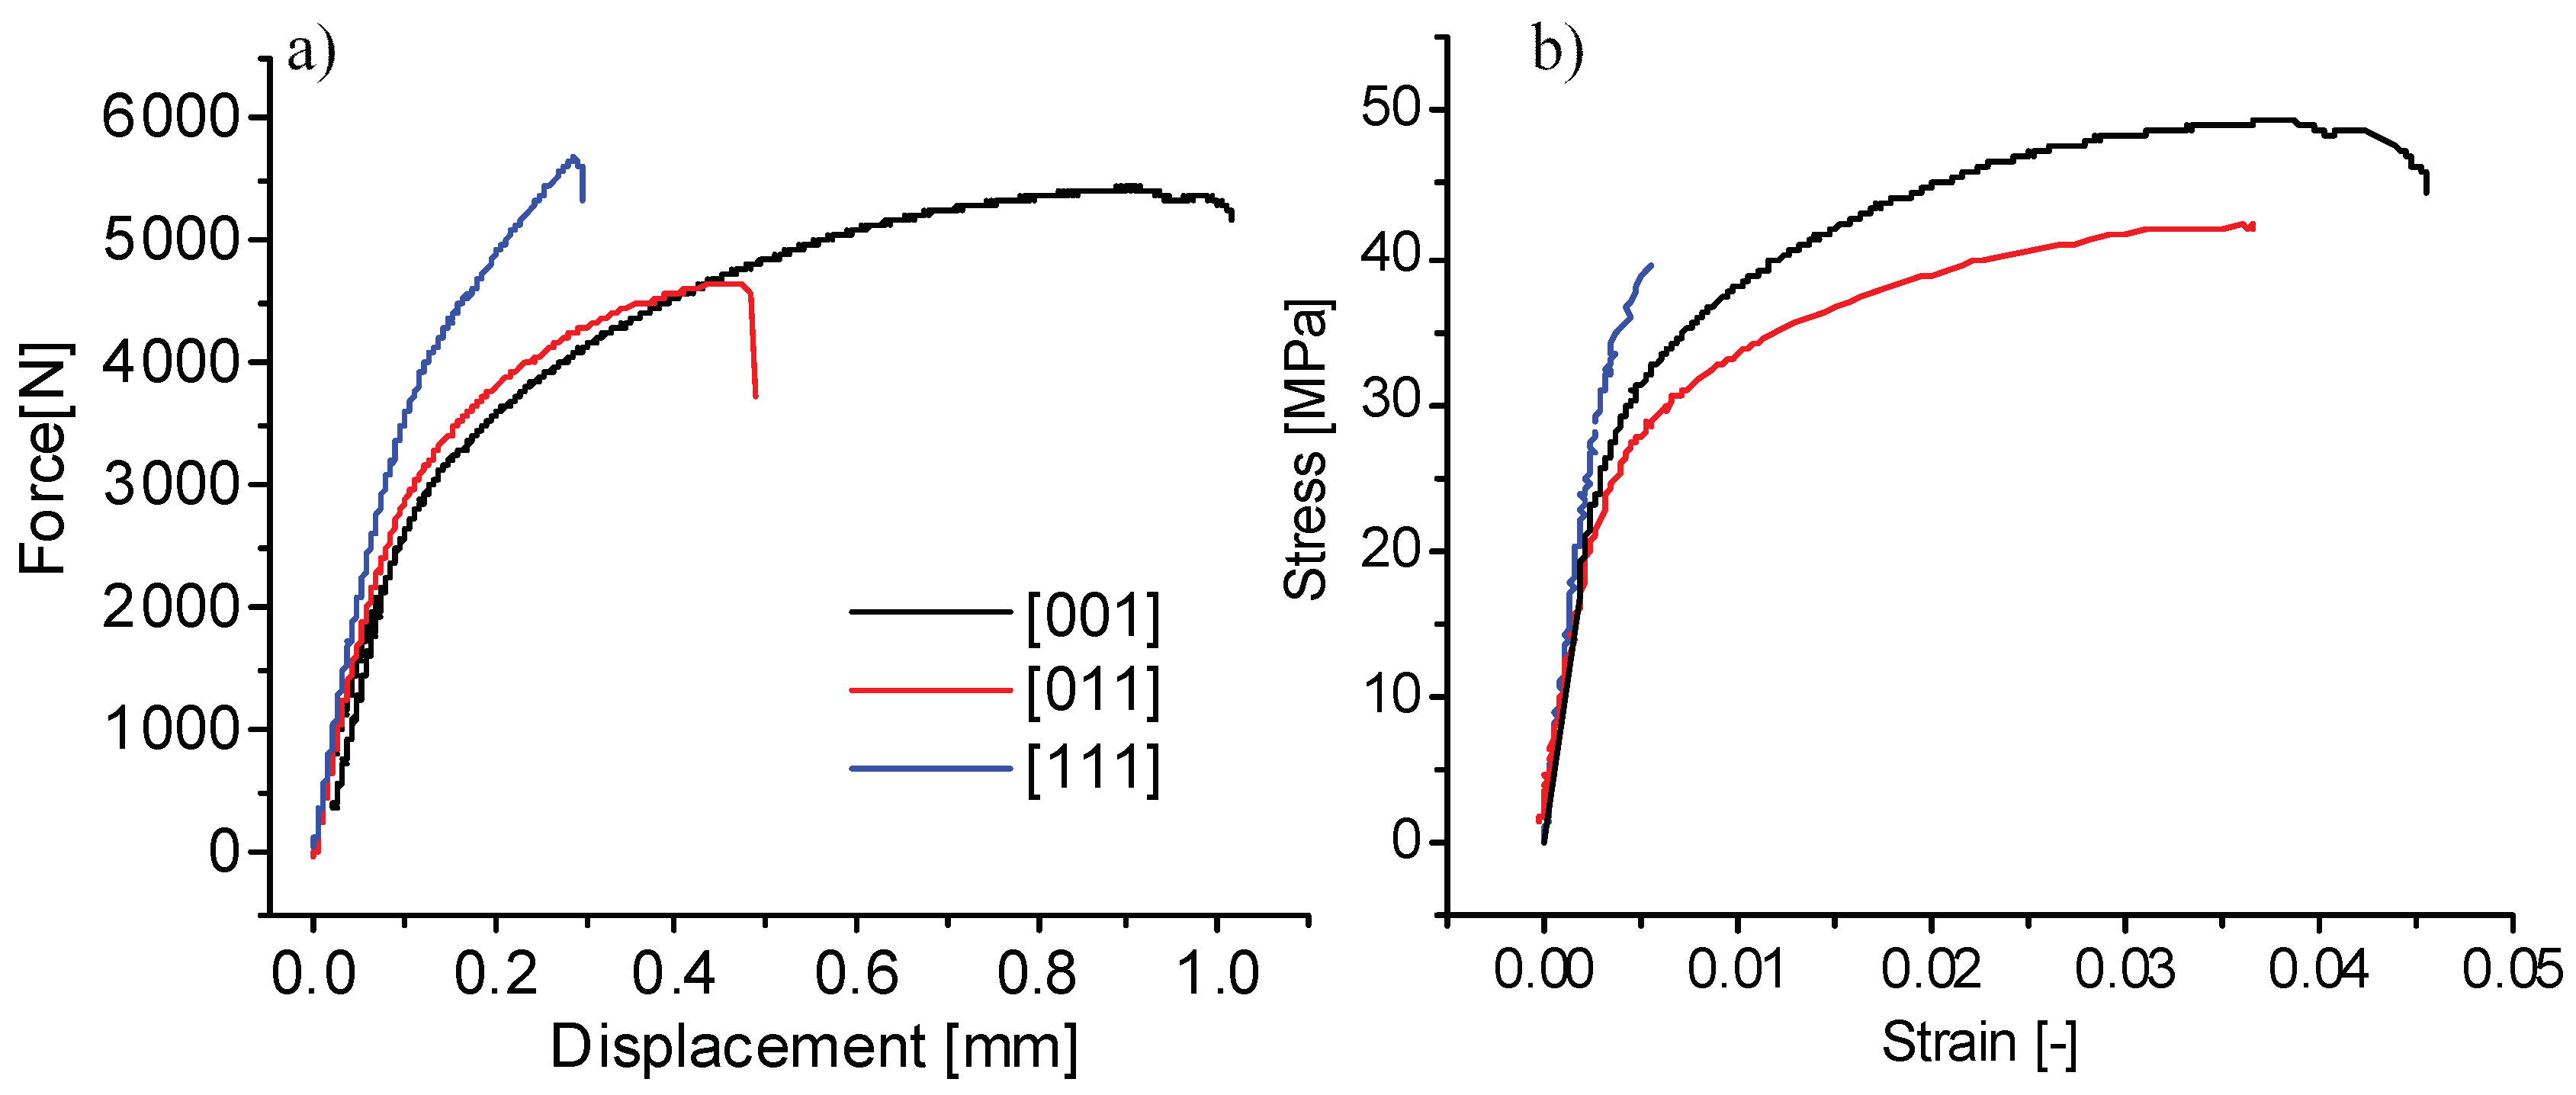
The force–displacement diagrams obtained with specimens having different diamond cell orientations are plotted in
Figure 11a. To measure uniaxial strains using the DIC technique, discrete targets were glued to the surface of these specimens in their constant density regions. The uniaxial stresses were calculated by dividing the forces applied to the specimens by their gross cross-section areas
AgrAS collected in
Table 1. This definition of stress corresponds to the recommendations of the ISO 13314 standard for compression testing of porous materials with relative densities lower than 50% (Standard ISO, 2011, [
39]).
The stress–strain diagrams shown in
Figure 11b allows for a comparison of the monotonic tensile behavior of three differently oriented lattice structures (see
Table 3 for selected characteristics). The reported elastic modulus
E is calculated from the linear part of the curves, with the highest value obtained for [111]-oriented specimens. The ultimate strength is the highest for [001]-oriented specimens. A yield stress was assigned to each specimen at a point where the stress–strain diagrams depart from their linear region, [001]-oriented specimens once again being the strongest. The lowest ductility, with intermediate stress characteristics, was seen with [111]-oriented specimens.
Fracture Surfaces of the Lattice Specimens
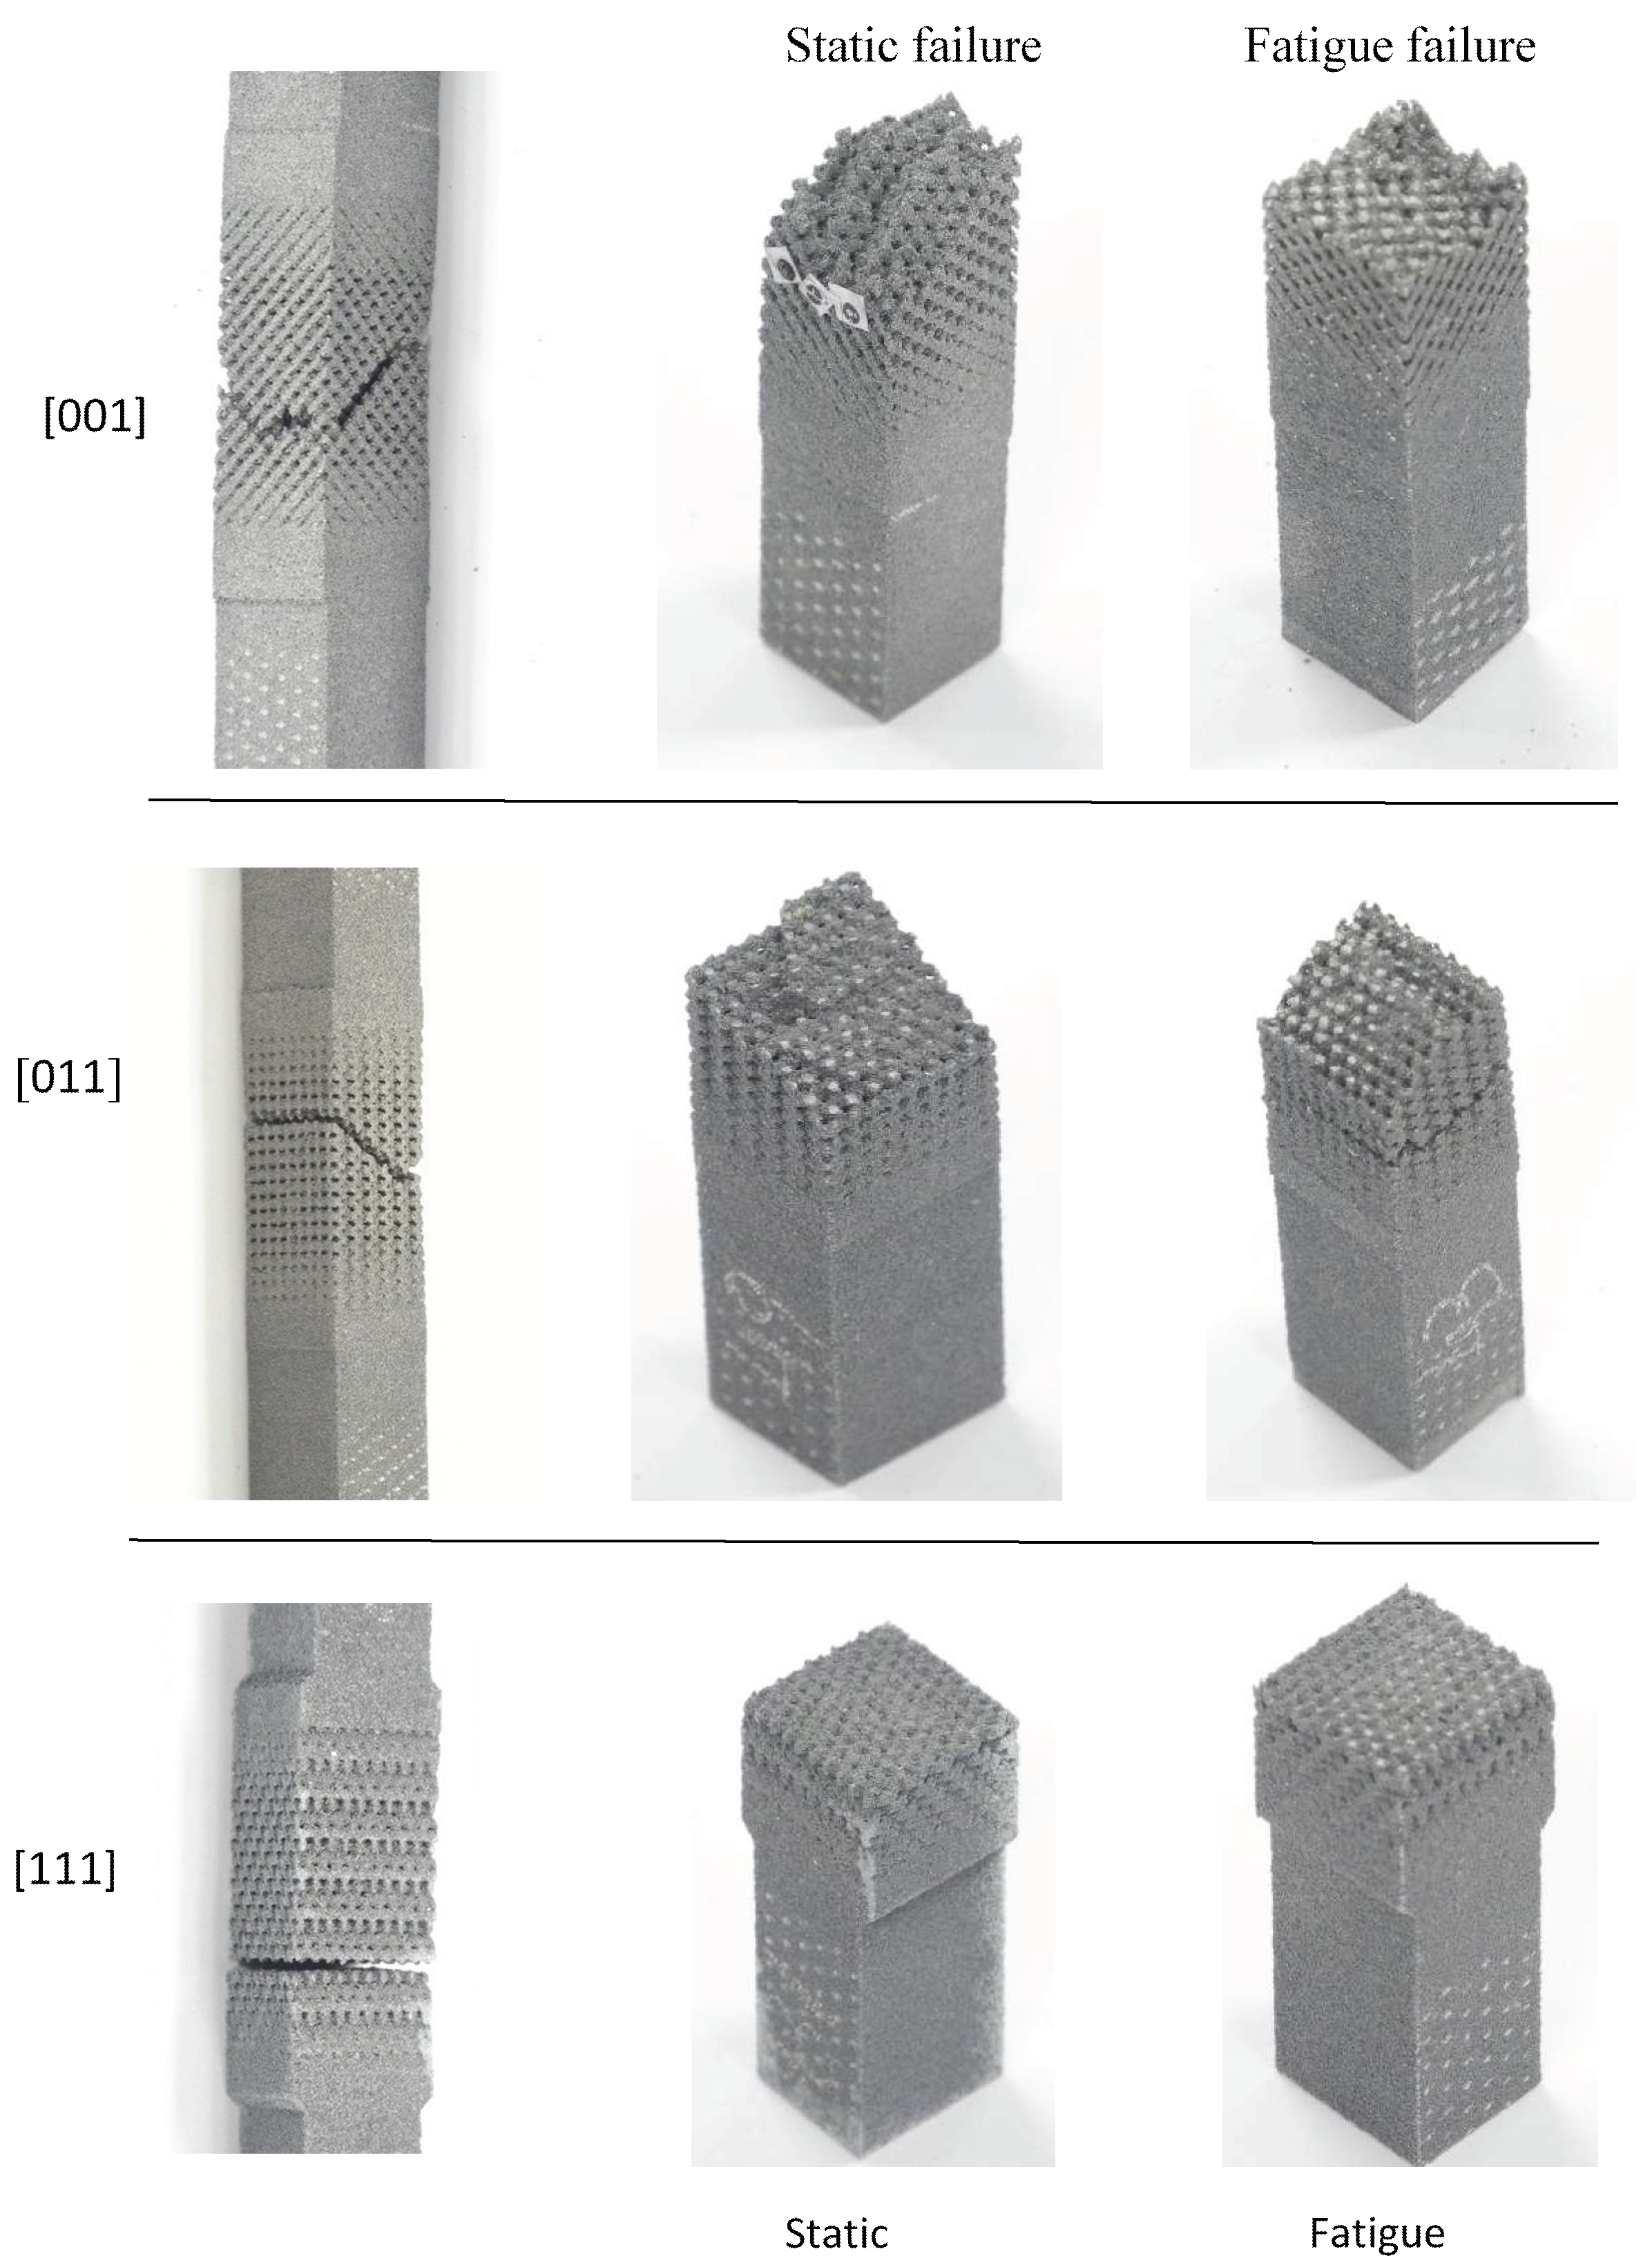
The fracture patterns of the differently oriented lattice specimens can provide useful information on the failure mechanisms acting at the level of struts and indicate the weakest planes for each orientation. It can be observed in
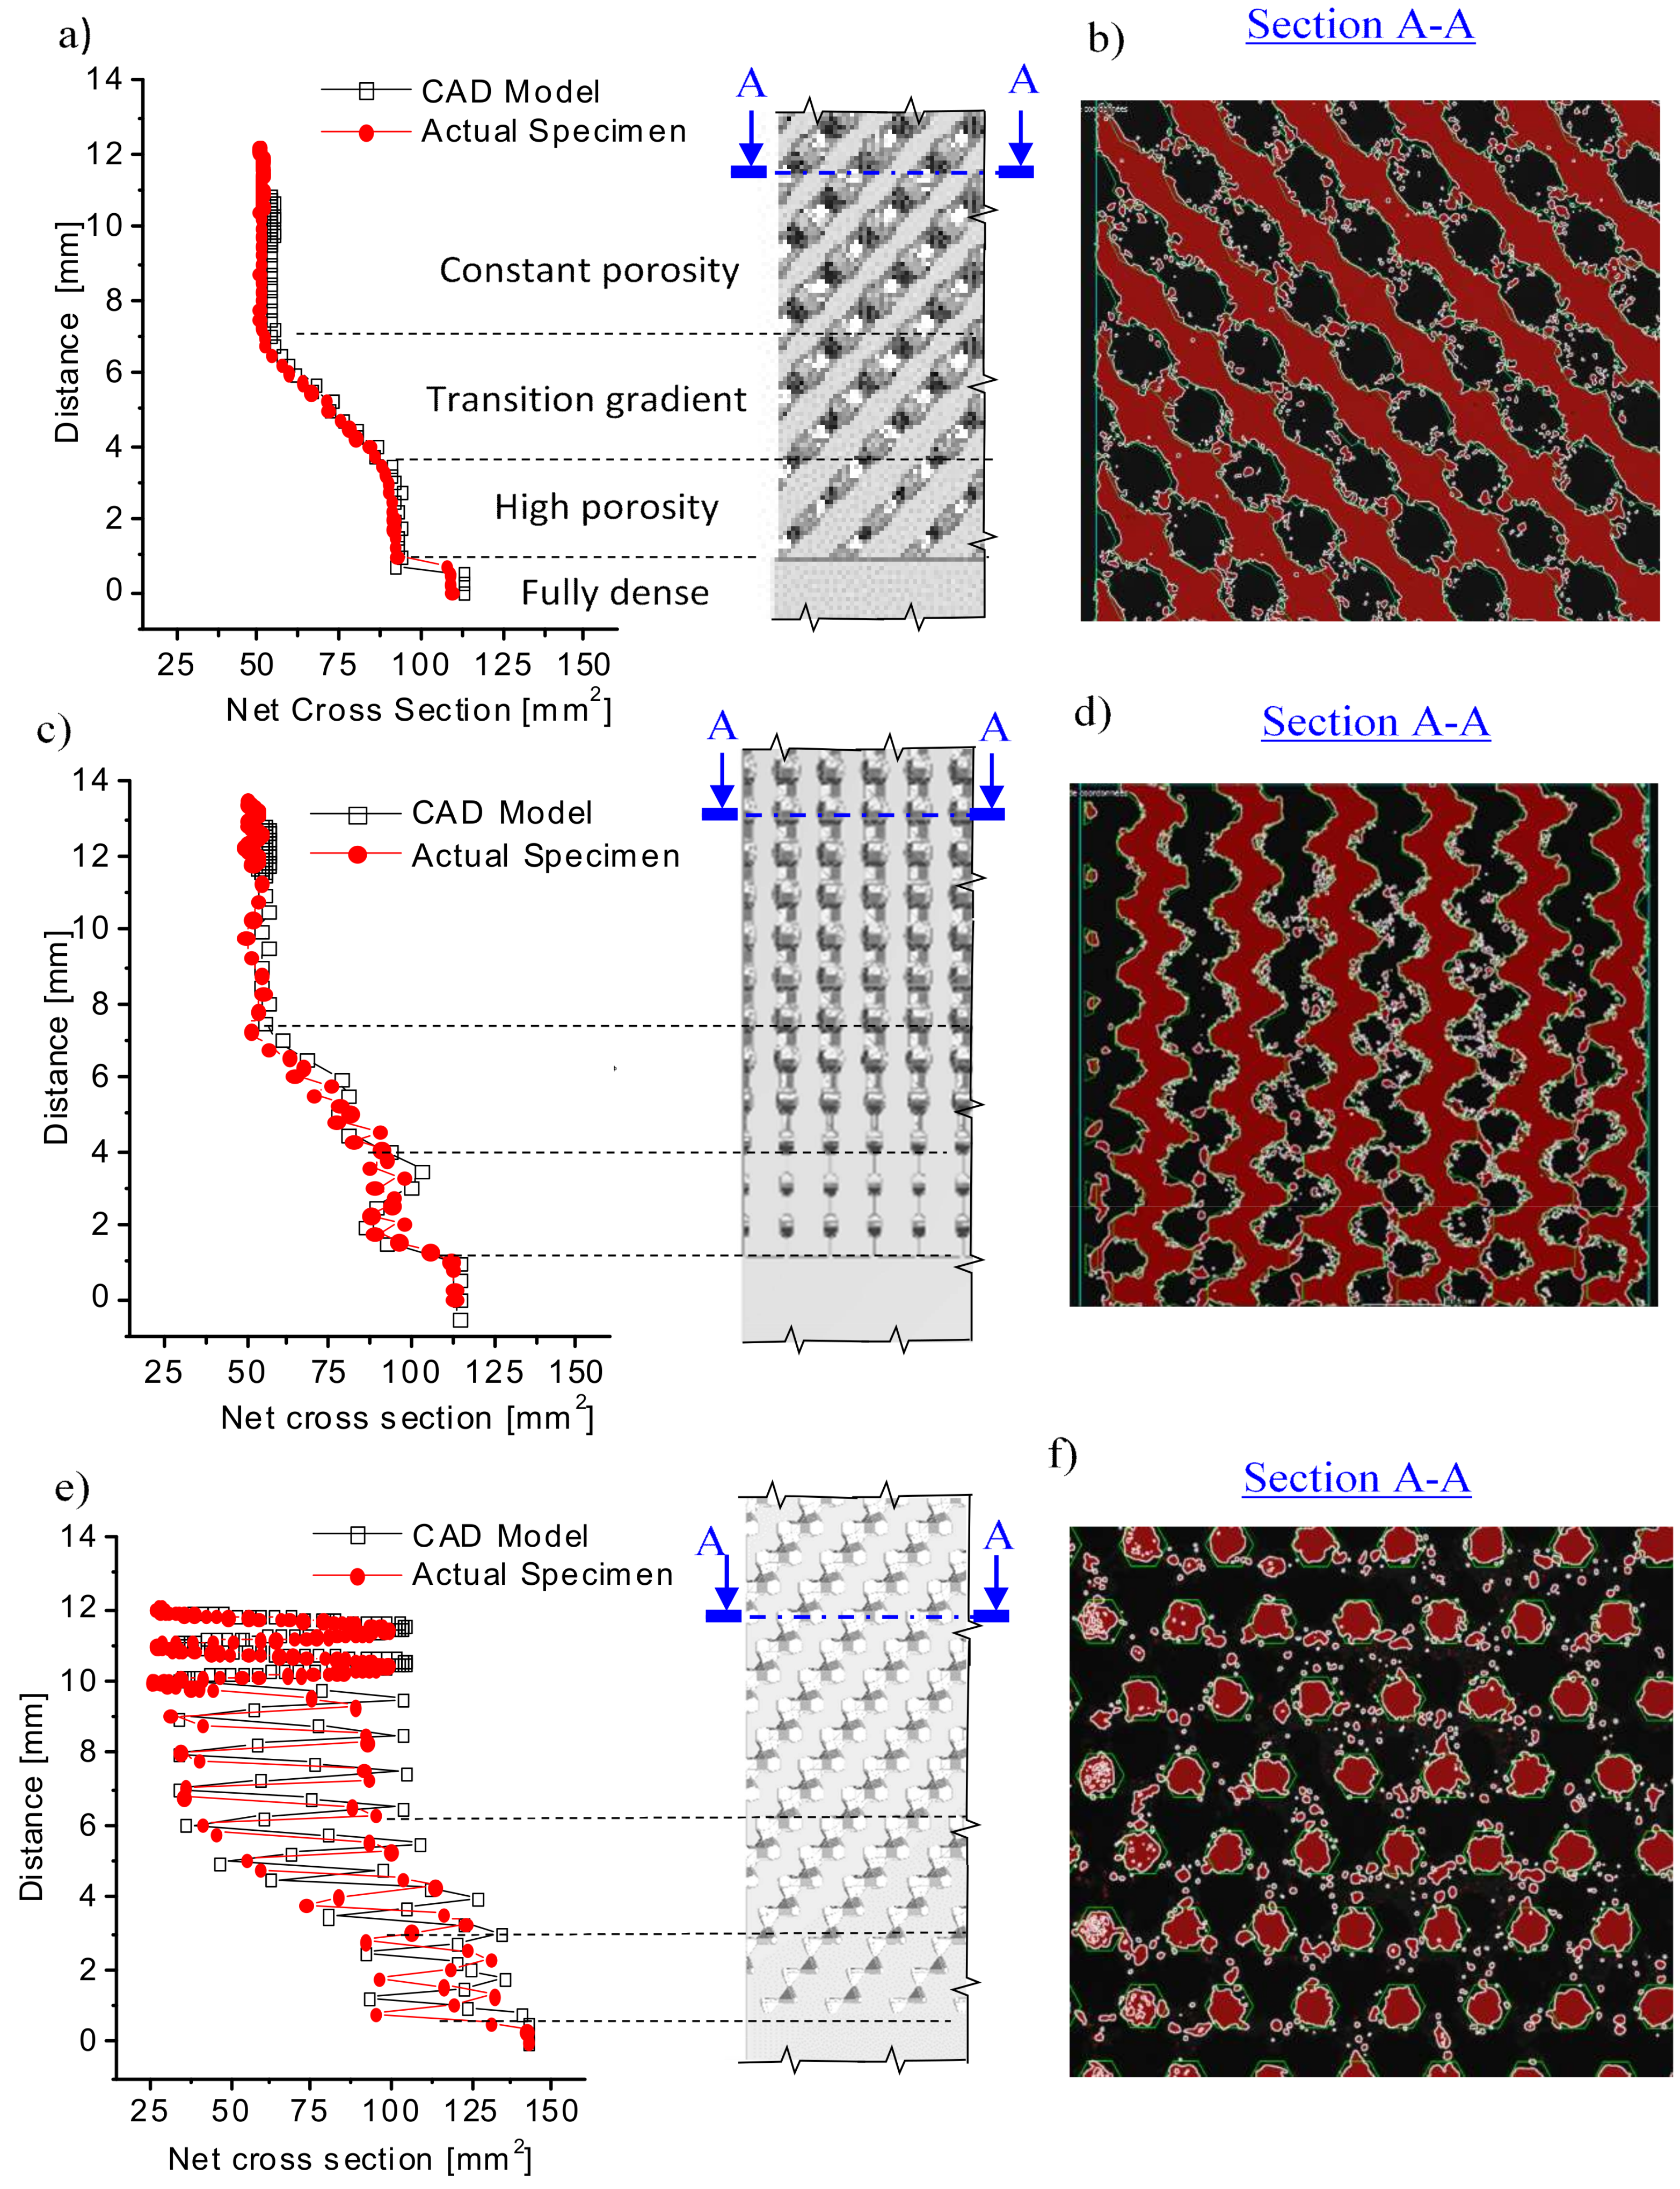
Figure 12 that each lattice orientation presents a specific fracture pattern, which is similar for the monotonic and the fatigue testing. (Fatigue tests results are reported in the next section.) The observations suggest that there is a competition between several planes through which the final fracture occurs. For the [011] orientation, the fracture propagates along a plane perpendicular to the struts oriented by 35.26° with respect to the loading direction, indicating a weak link for the [011] orientation under tension. The [111]-oriented specimens break in a very well-defined plane perpendicular to the loading direction. From observing the broken struts, it seems that the fracture is produced by normal loading of the vertical struts, which corresponds to the smallest net cross section of the specimen (
Figure 7). The [001] oriented specimens offer the most irregular fracture plane.
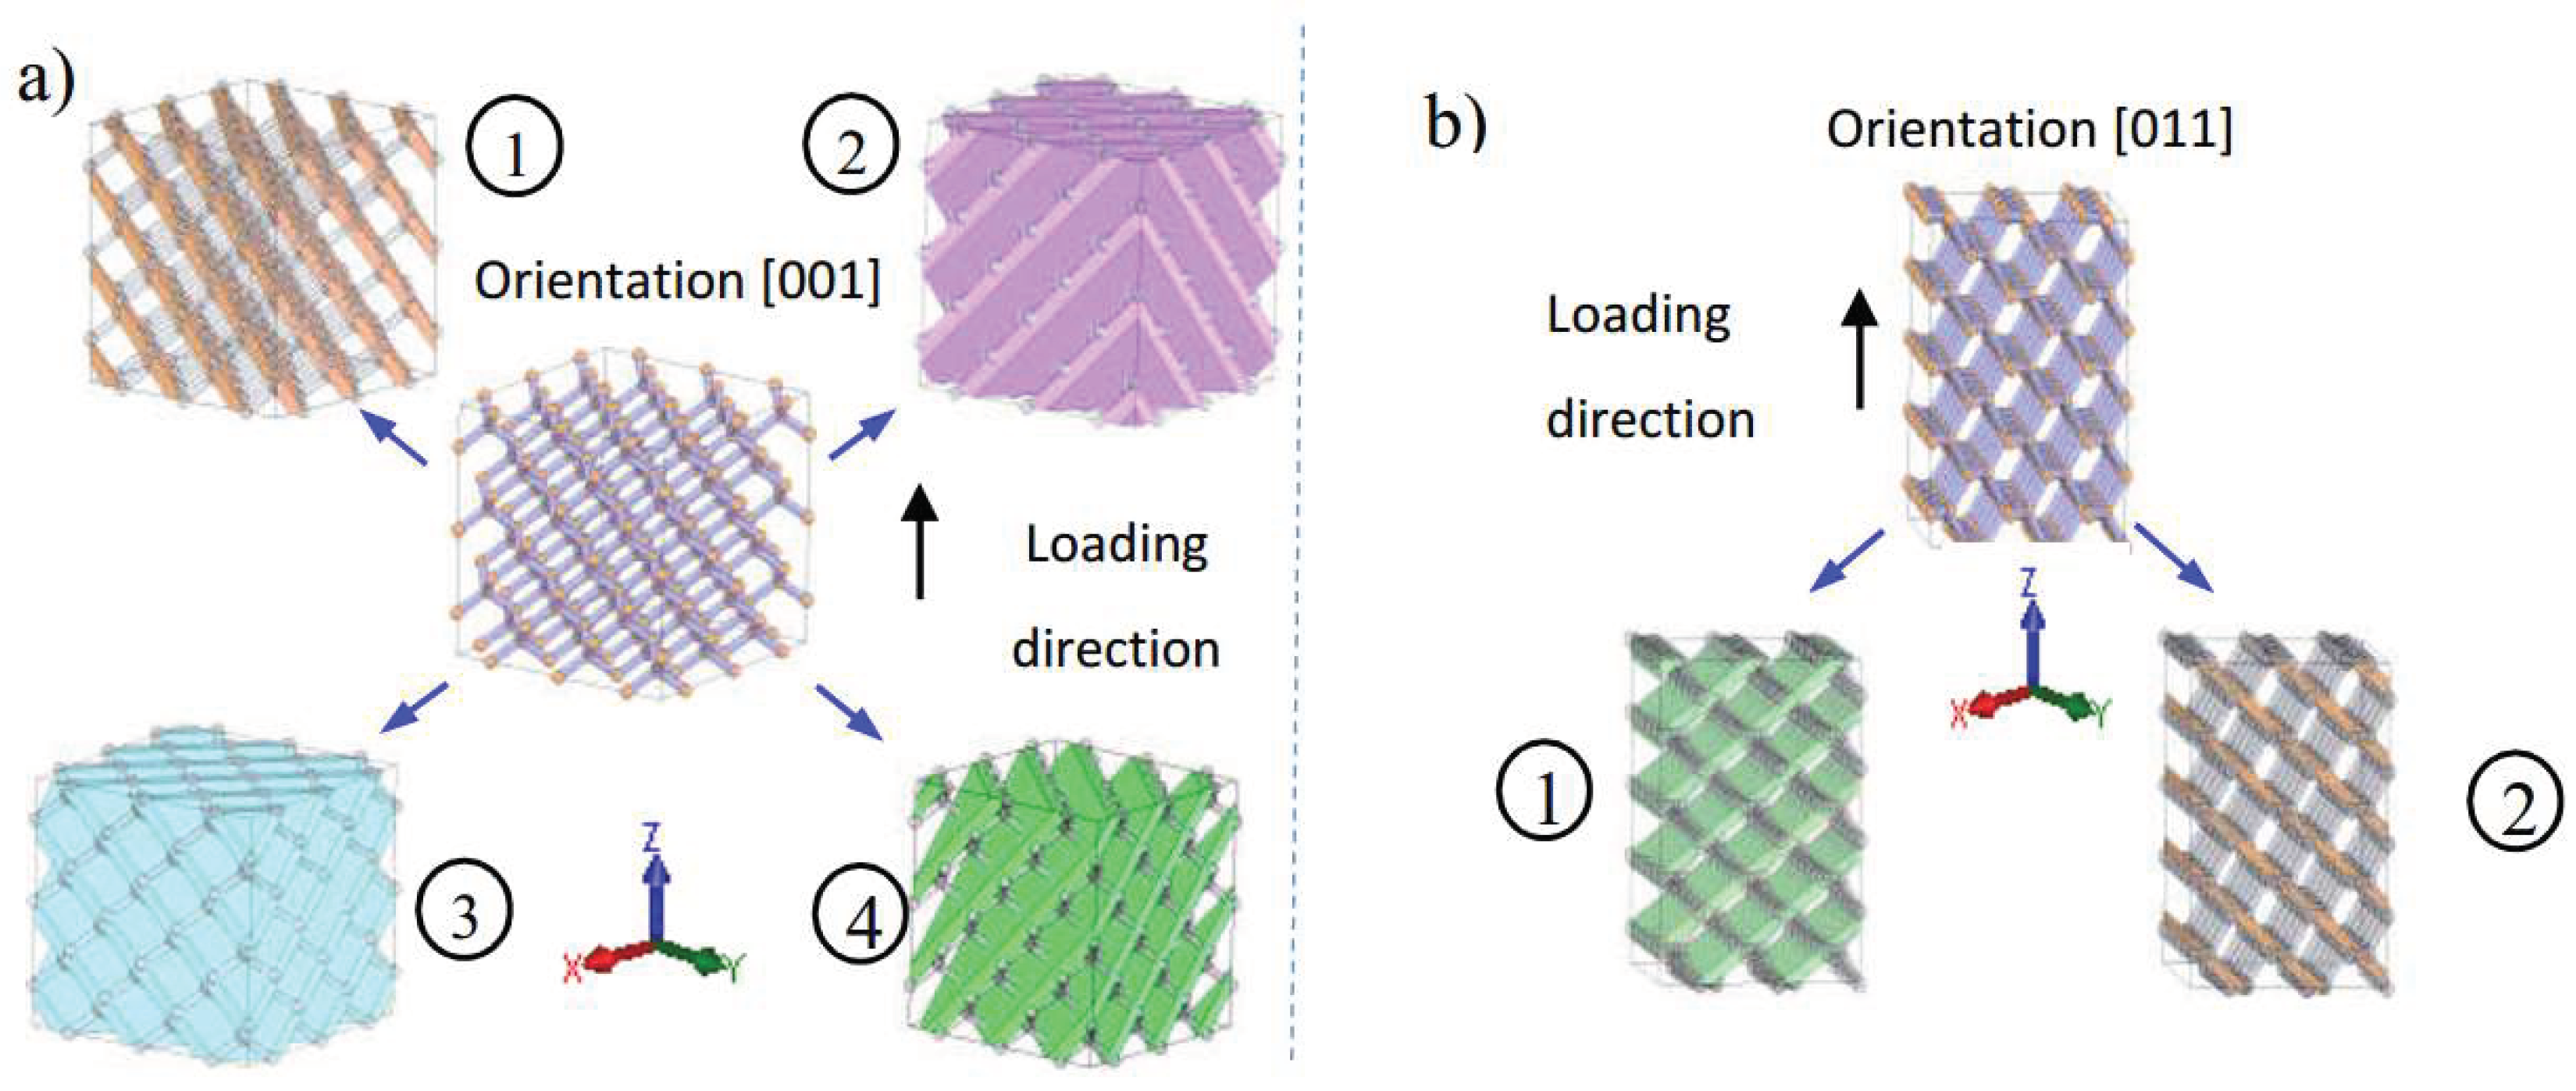
The fracture patterns observed for each lattice orientation can be related to the existence of well-defined weak regions limited by planes normal to the strut directions, which are schematized in
Figure 13a and
Figure 13b for [001]- and [011]-oriented specimens, respectively. In these systems, two neighboring planar regions are separated by a space with the lowest resistance to shear forces. Under uniaxial tensile test conditions, there are four equivalent weak systems for the [001]-oriented cell specimens labeled as 1, 2, 3, and 4 in
Figure 13a. In the case of the [011]-oriented cell specimens, two of the four struts are perpendicular to the loading direction, and they are not subjected to shear forces. The [011] orientation contains, therefore, only two weak systems (represented as 1 and 2 in
Figure 13b). In the [111]-oriented specimens, the loading direction coincides with one of the four strut orientations, and the other three orientations define equivalent weak systems. However, in this case, the fracture is initiated by normal forces applied to the vertical struts rather than by the bending moments, since the shear forces resolved on all other weak systems are notably smaller than their normal equivalents; the angle between them and the loading direction being as small as 19.47°. The existence of these planar weak systems explains the damage localization usually referred to as macroscopic shear or crush bands observed in experimental works and reproduced by numerical simulations involving compressive and tensile monotonic and cyclic study cases [
33,
40,
41].
3.2. Fatigue Testing
3.2.1. Damage Evolution
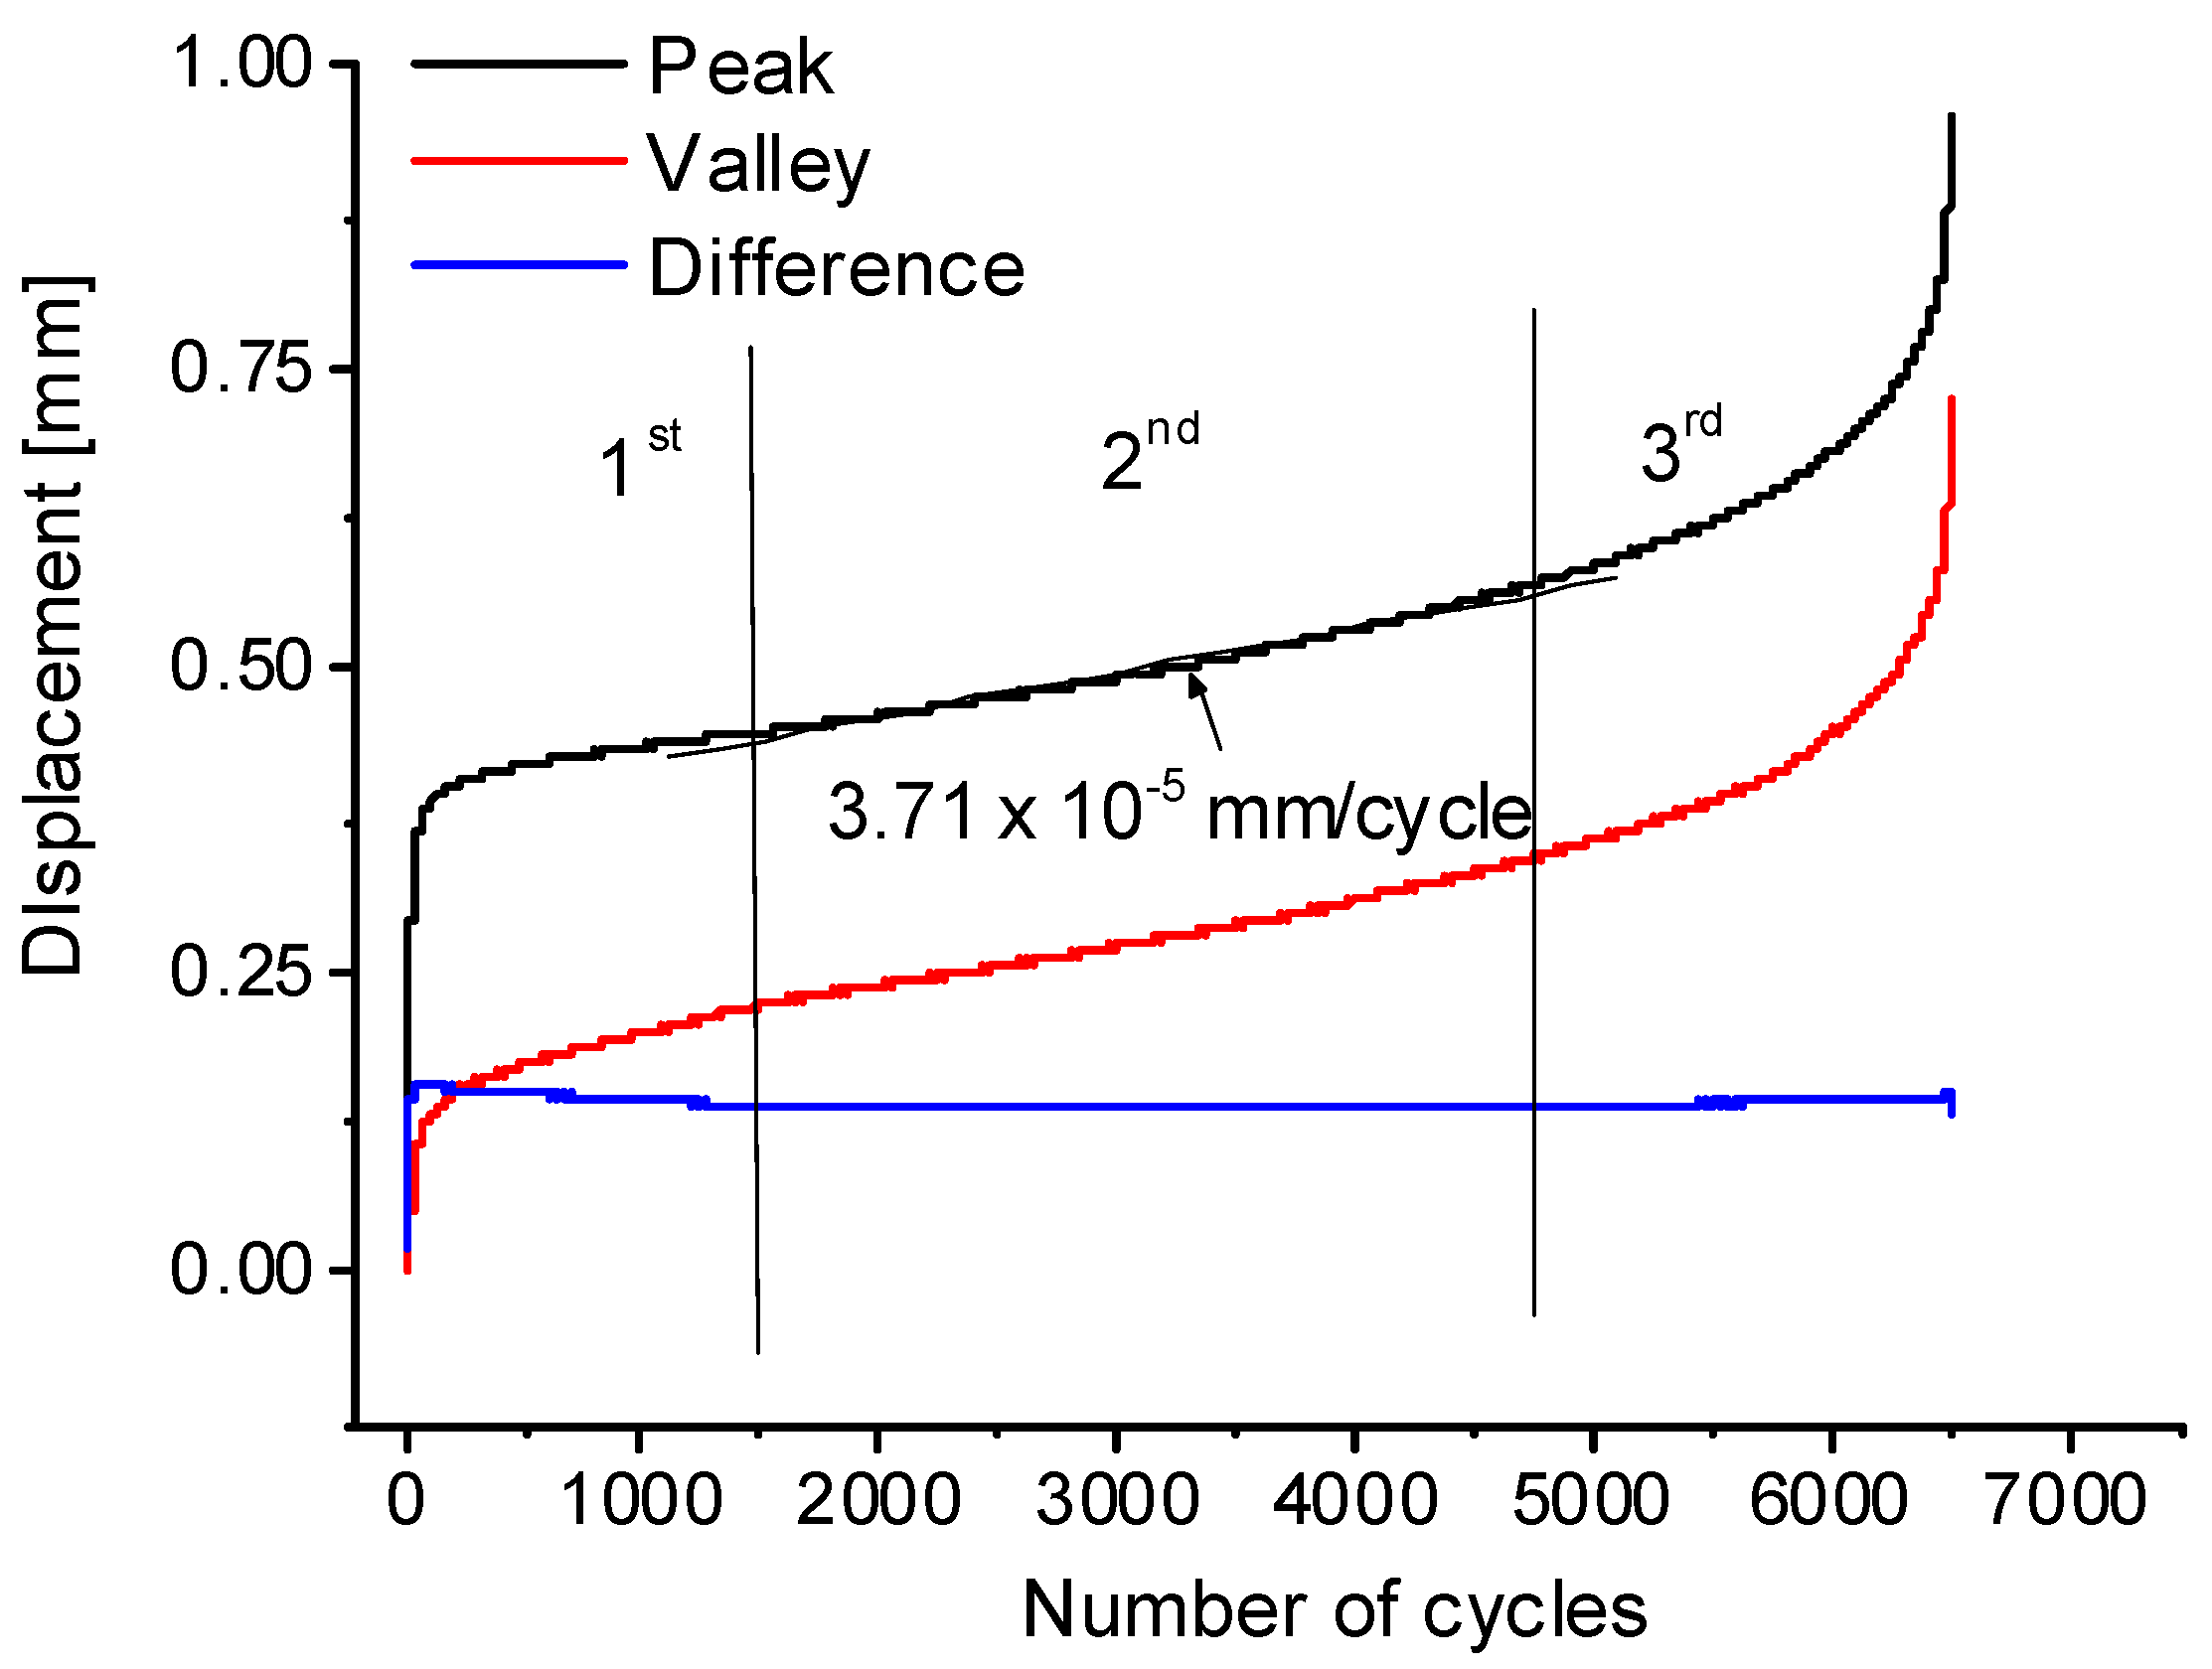
Fatigue testing was performed with notched and plain fully dense specimens, as well as with specimens bearing the differently oriented diamond lattices. The typical behavior of these specimens is represented by the plot in
Figure 14, where the displacements corresponding to the cyclic peak and valley positions, as well as to the peak-to-valley differences, are plotted as functions of the number of cycles. A simultaneous increase in the peak and valley displacements reveals a so-called ratcheting behavior associated with the accumulation of plasticity [
26]. An increase in the difference between the peak and the valley displacements is related to a decrease in specimen stiffness, which in turn is associated with a gradual growth of existing defects or a nucleation of the new ones. The three stages roughly defined in
Figure 14 resemble the commonly observed stages of plastic strain evolution during a creep test. During the 1st stage, the rate of plastic strain accumulation decreases down to a stationary value. During the second stage, the strain rate can be considered constant. Finally, during the third stage, the strain rate accelerates until failure occurs. This three-stage pattern of the gradual strain accumulation is widely reported for the compression fatigue of lattice or foam structures [
40,
41] and will be presented in this study for the lattice specimens only.
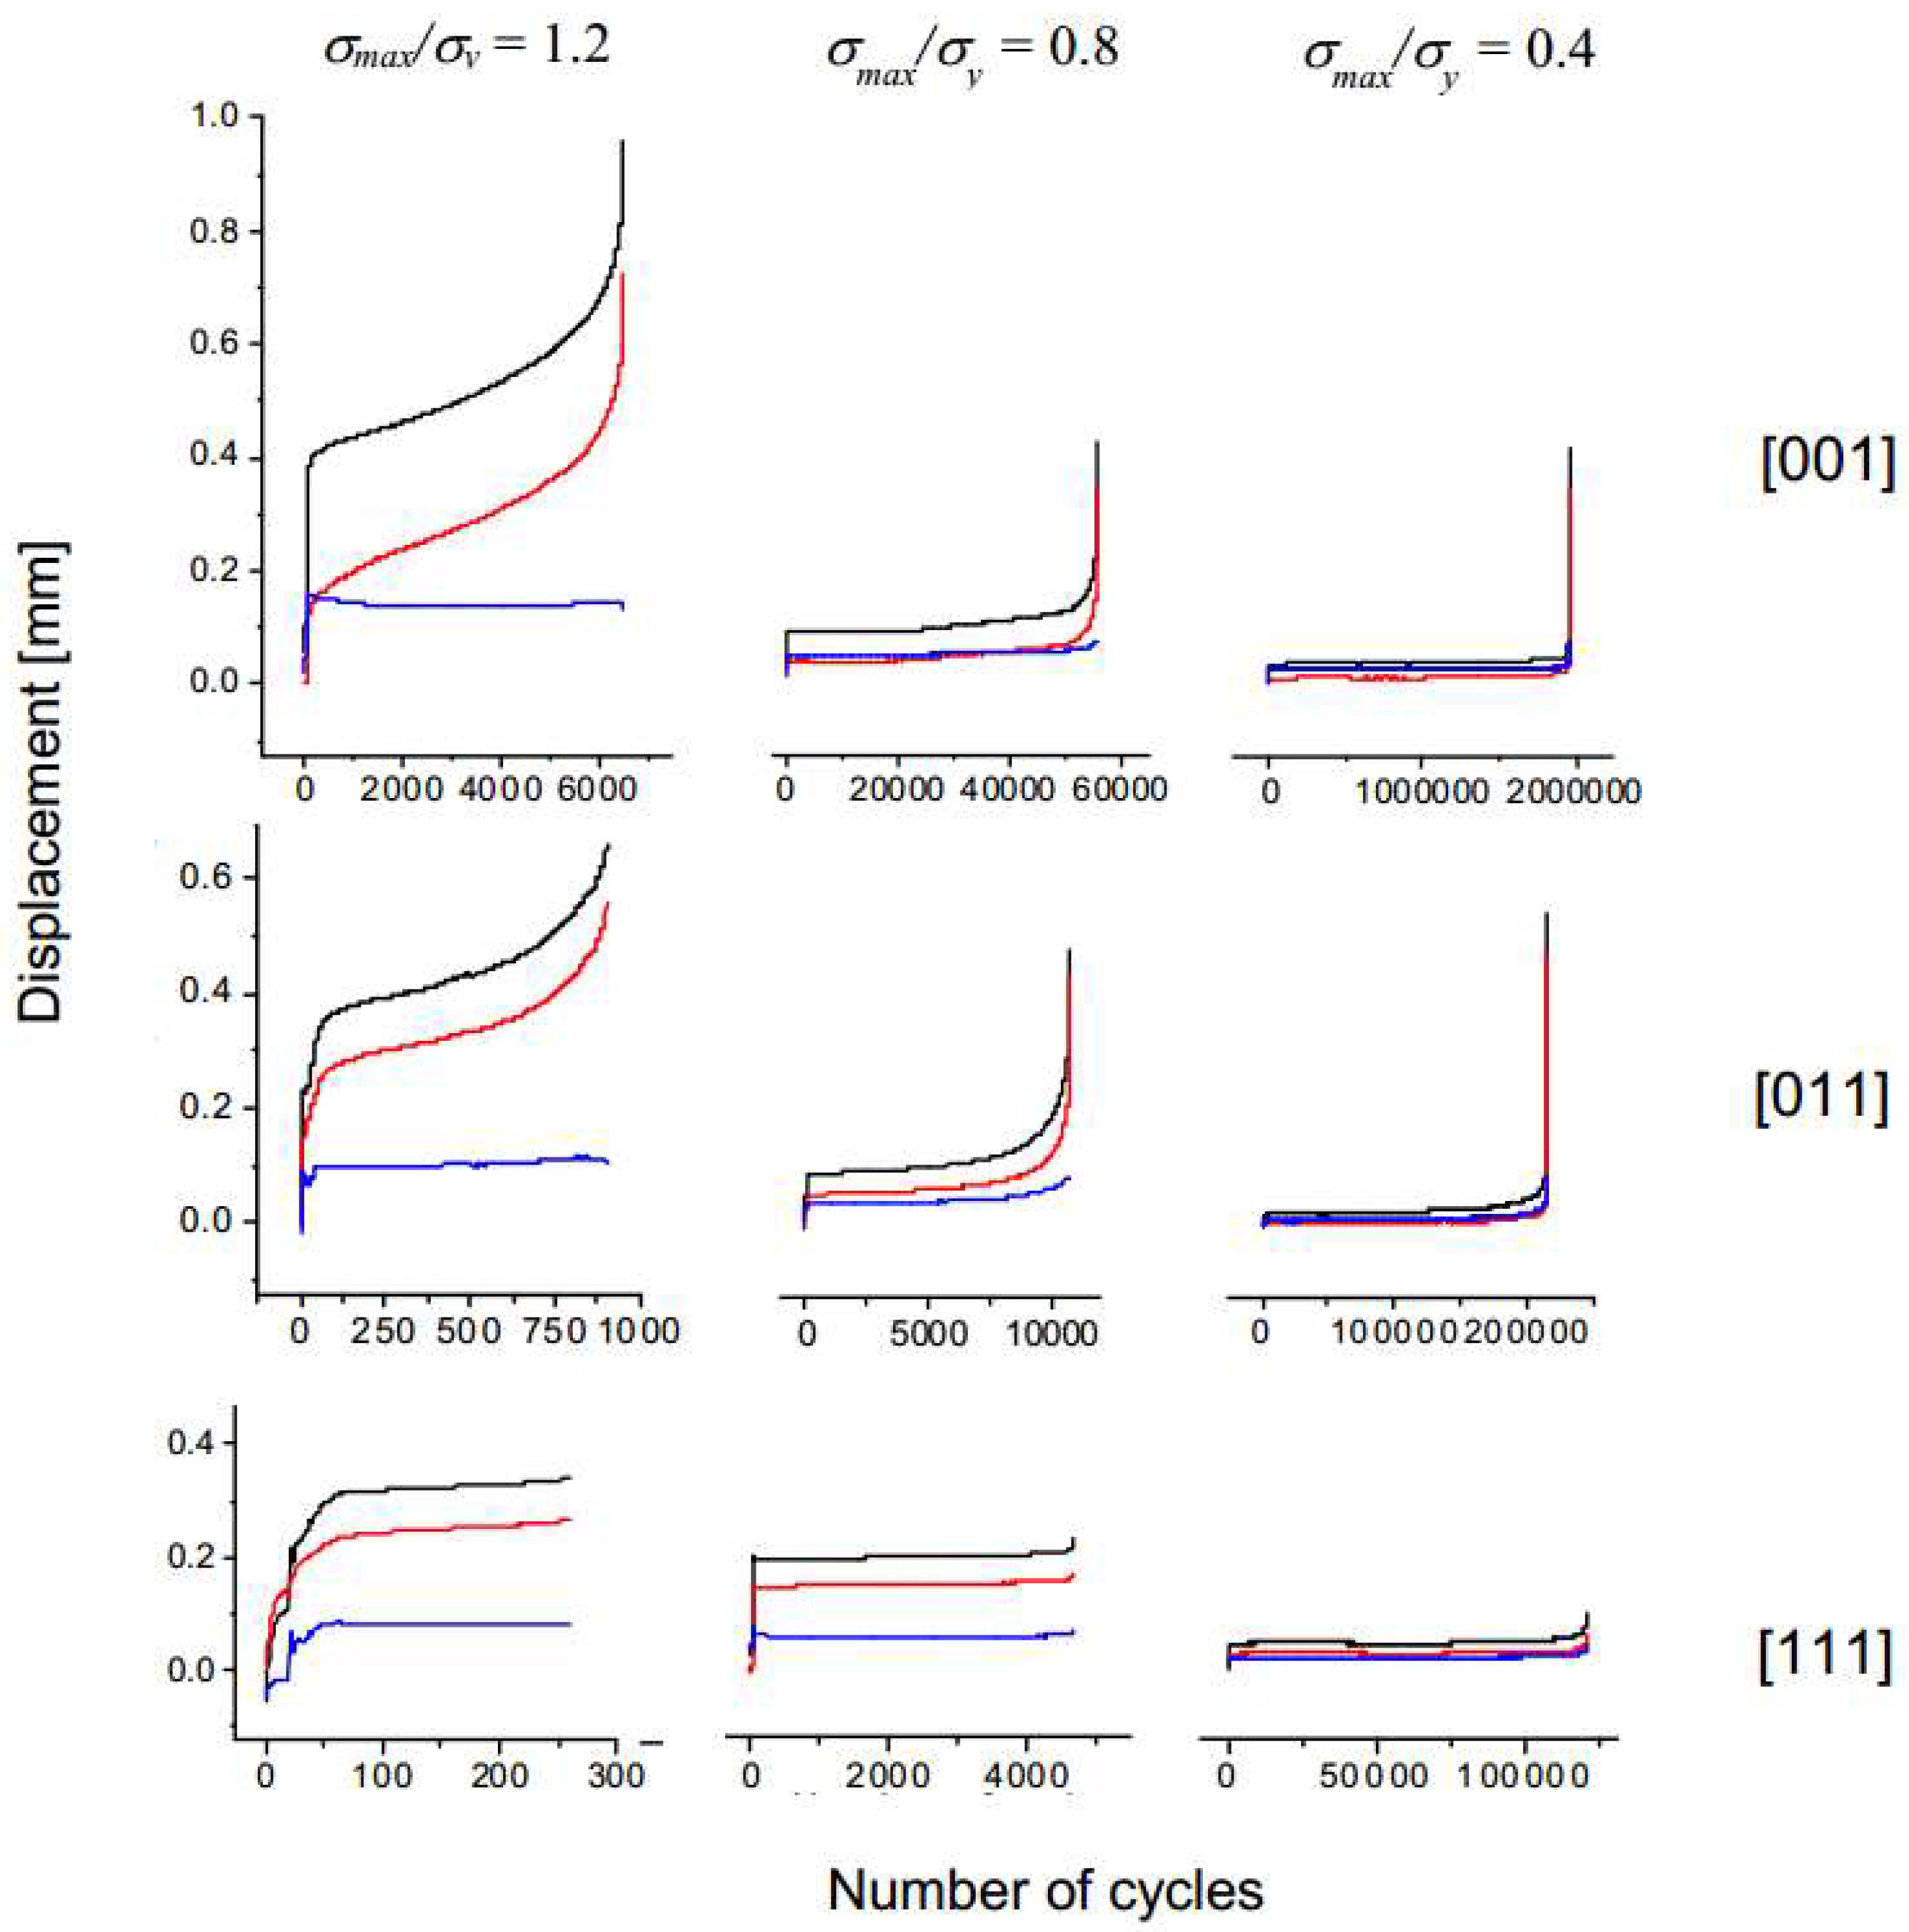
In
Figure 15, selected plots obtained for each lattice orientation are included. It is possible to compare the peak displacements (black lines), the valley displacements (red lines), and their peak-to-valley differences (blue lines) for tests with
σmax/
σyield = 1.2, 0.8, and 0.4. While all three deformation stages can be clearly observed for [001]- and [011]-oriented specimens, [111]-oriented specimens seem to reach the fracture just before or shortly after a third stage of deformation is reached. The observations are consistent with the low ductility values obtained in tensile tests for [111]-oriented specimens (
Figure 11).
The difference between the peak and the valley displacements, which indicates an increase in the size and quantity of defects, seems to remain stable along the tests, while showing an increase in the third stage, clearly observable for σmax/σyield = 0.8 and 0.4, in the case of [001]- and [011]-oriented specimens. In any case, ratcheting is the predominant mechanism of the damage evolution during the second stage.
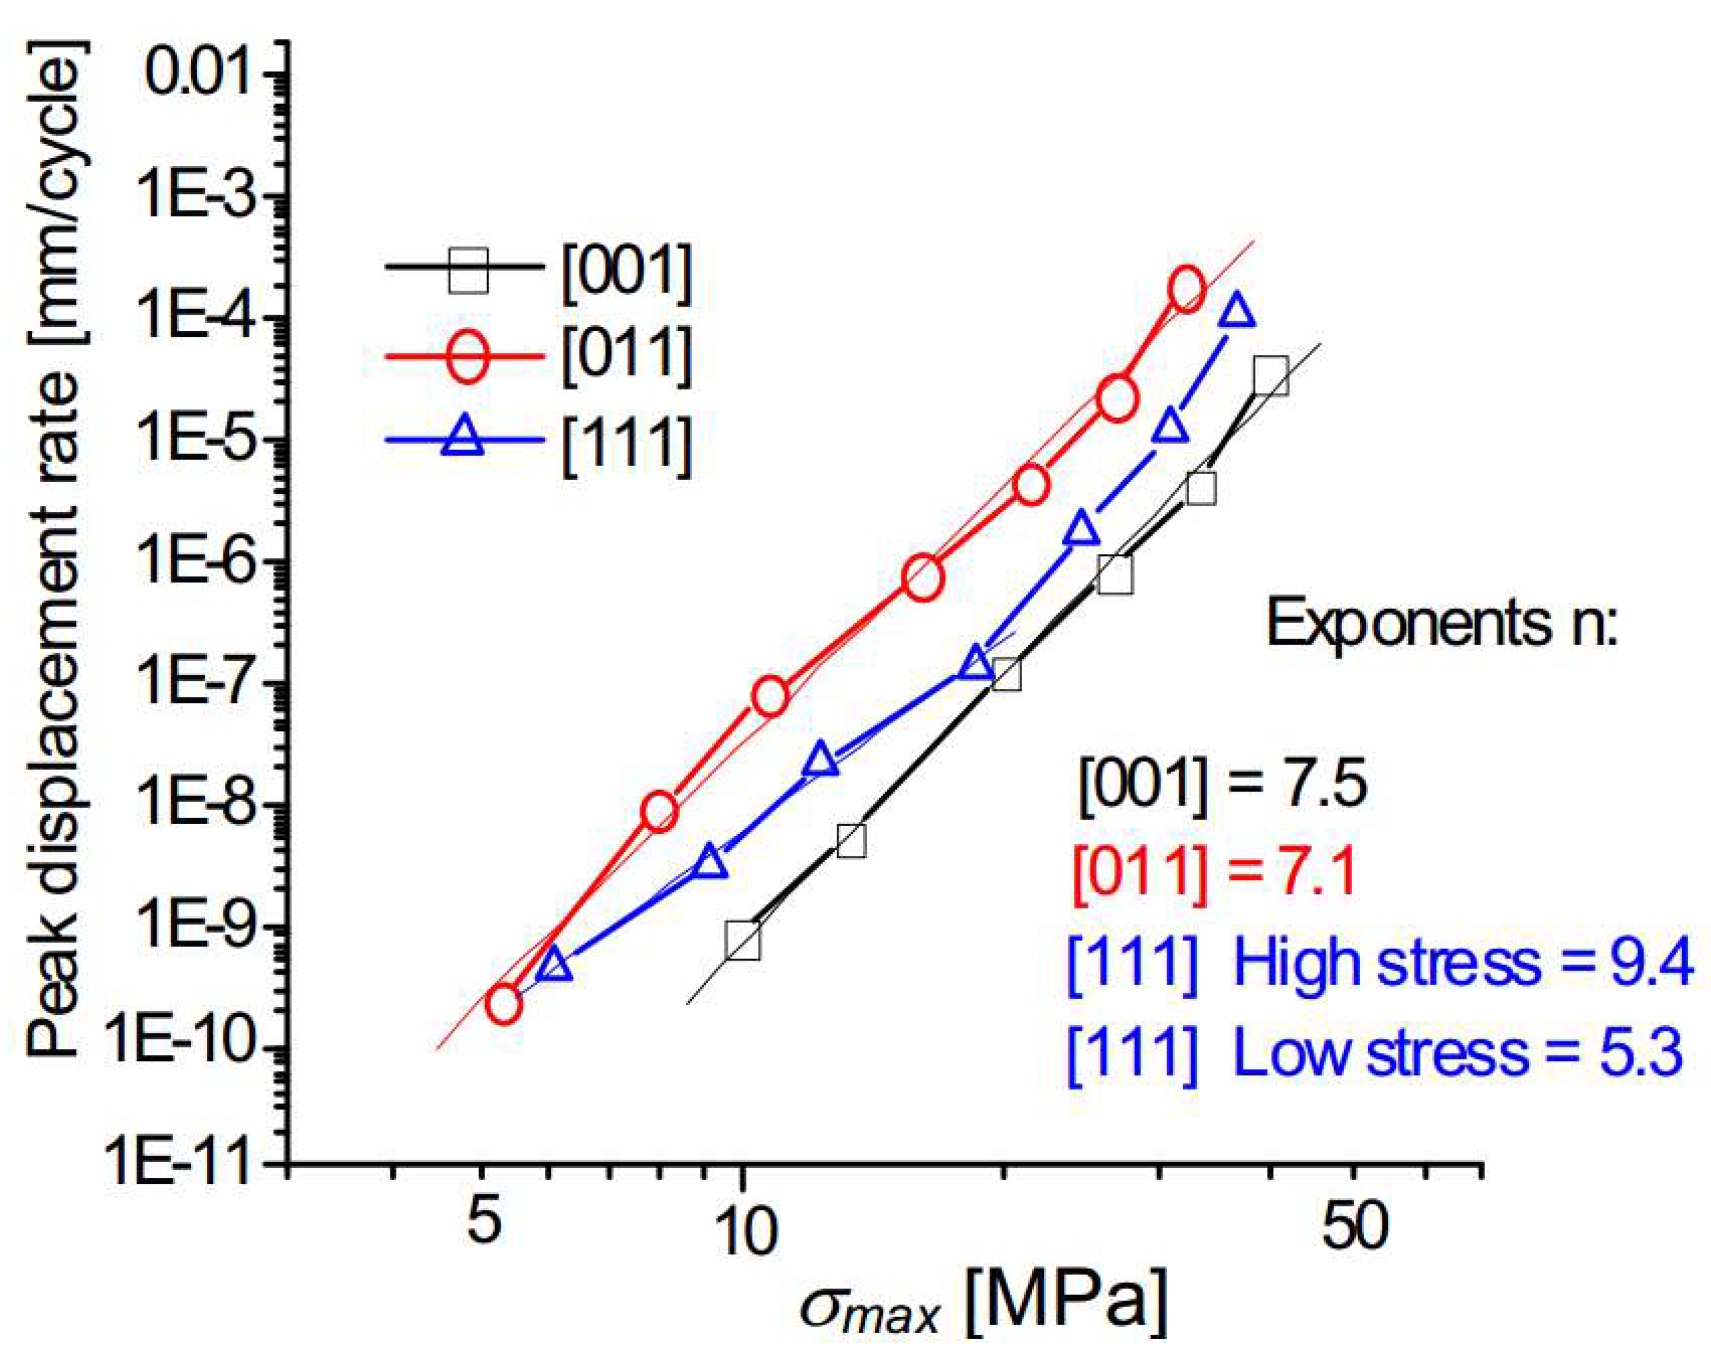
The rates at which the peak displacements are increased, measured for the second stage of the fatigue testing, are plotted in
Figure 16 with respect to the maximum applied stress
σmax. A power law relationship can therefore be established:
These results show that [001]-oriented specimens exhibit the highest resistance to damage accumulation. In contrast, [011]-oriented specimens are the worst, their damage rate being 1.5 orders of magnitude higher than that of [001]-oriented specimens. The ratcheting rate of [111]-oriented specimens is lower than that of [011]-oriented specimens but higher than that of [001]-oriented specimens. Even though the ratcheting rate of [111]-oriented specimens follows two different power law regimes for two different stress ranges, exponents n fitted to all three sets of data denote a strong dependence of the ratcheting on the maximum applied stress for all the lattice orientations, ranging between 5.3 and 9.4.
3.2.2. S-N Diagrams
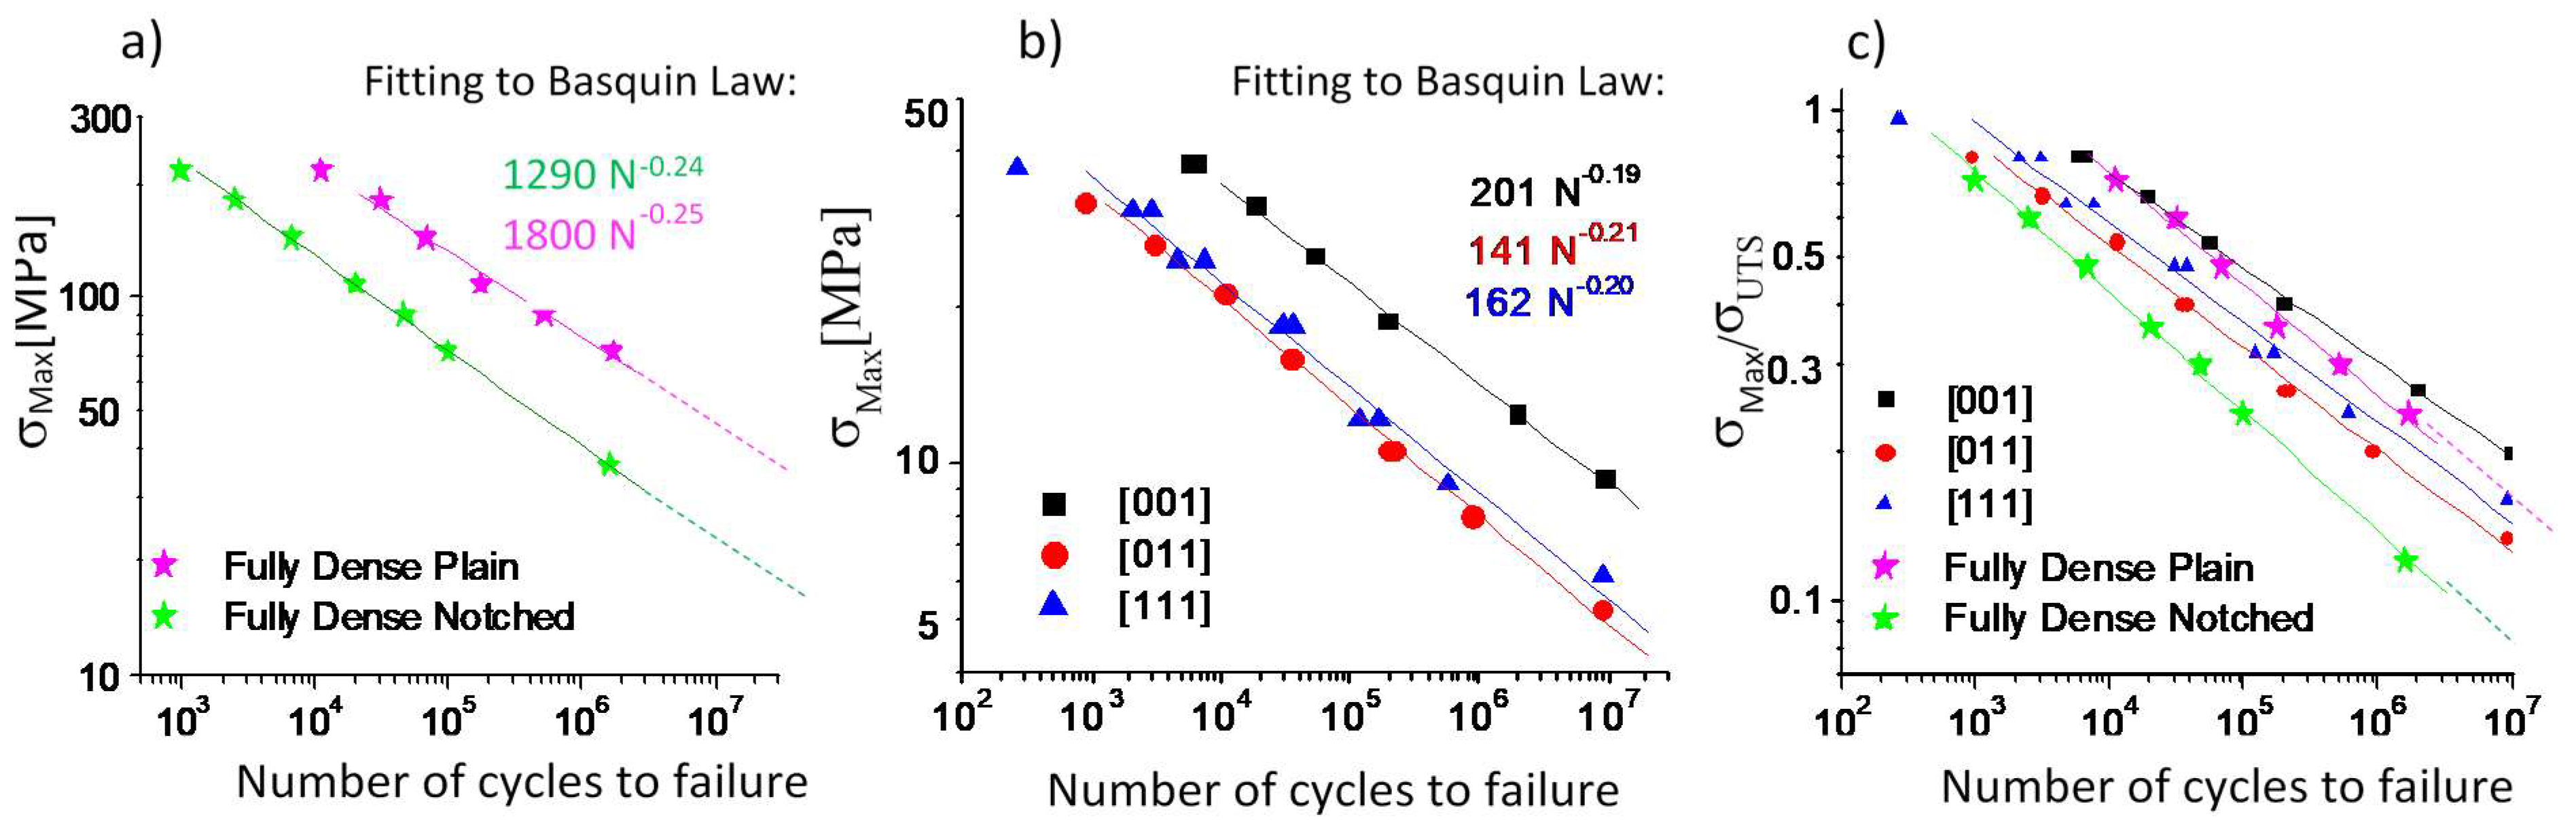
Figure 17a,b includes the S-N bi-logarithmic plots corresponding to the fatigue lives of the fully dense and lattice specimens as functions of the maximum applied stress
σ. A linear fitting corresponding to a Basquin law of type
was applied to all the fatigue data. The values of the constants
D and
m are included in the plot labels. Comparing the results obtained with the plain and the notched specimens, it is possible to conclude with respect to the detrimental effect of the notch (
Figure 17a). Regarding the lattice specimens,
Figure 17b shows that [001]-oriented specimens clearly outperform [011]- and [111]-oriented specimens in terms of their fatigue resistance, with the difference between the last two being insignificant.
In
Figure 17c, the fatigue lives of dense and lattice specimens are all compared by utilizing, as a variable, the maximum stress in a cycle
σ normalized by the corresponding ultimate strength
σUTS. This representation allows one to affirm that lattice [001]-oriented specimens outperform fully dense plain specimens in terms of normalized fatigue resistance. The normalized fatigue resistance of [011]- and [111]-oriented specimens is lower than that of the plain specimens and higher than that of the notched specimens. The notched specimens clearly do not perform as well in this representation.
3.2.3. Effective Stresses, Fatigue Concentration, and Notch Sensitivity Factors in Notched and Lattice Specimens
In
Figure 17c, the normalization of the maximum stress in a cycle by the ultimate strength allows for a direct comparison of the fatigue resistance of the dense and lattice specimens of this study. An alternative approach for such a comparison is also possible using the definition of an effective stress, which can be calculated by dividing the applied load by a minimum net cross section of the specimens (see values of
AminAS in
Table 1). This effective stress corresponds to a mean normal stress acting on the smallest (weakest) cross section of a lattice specimen along its loading direction.
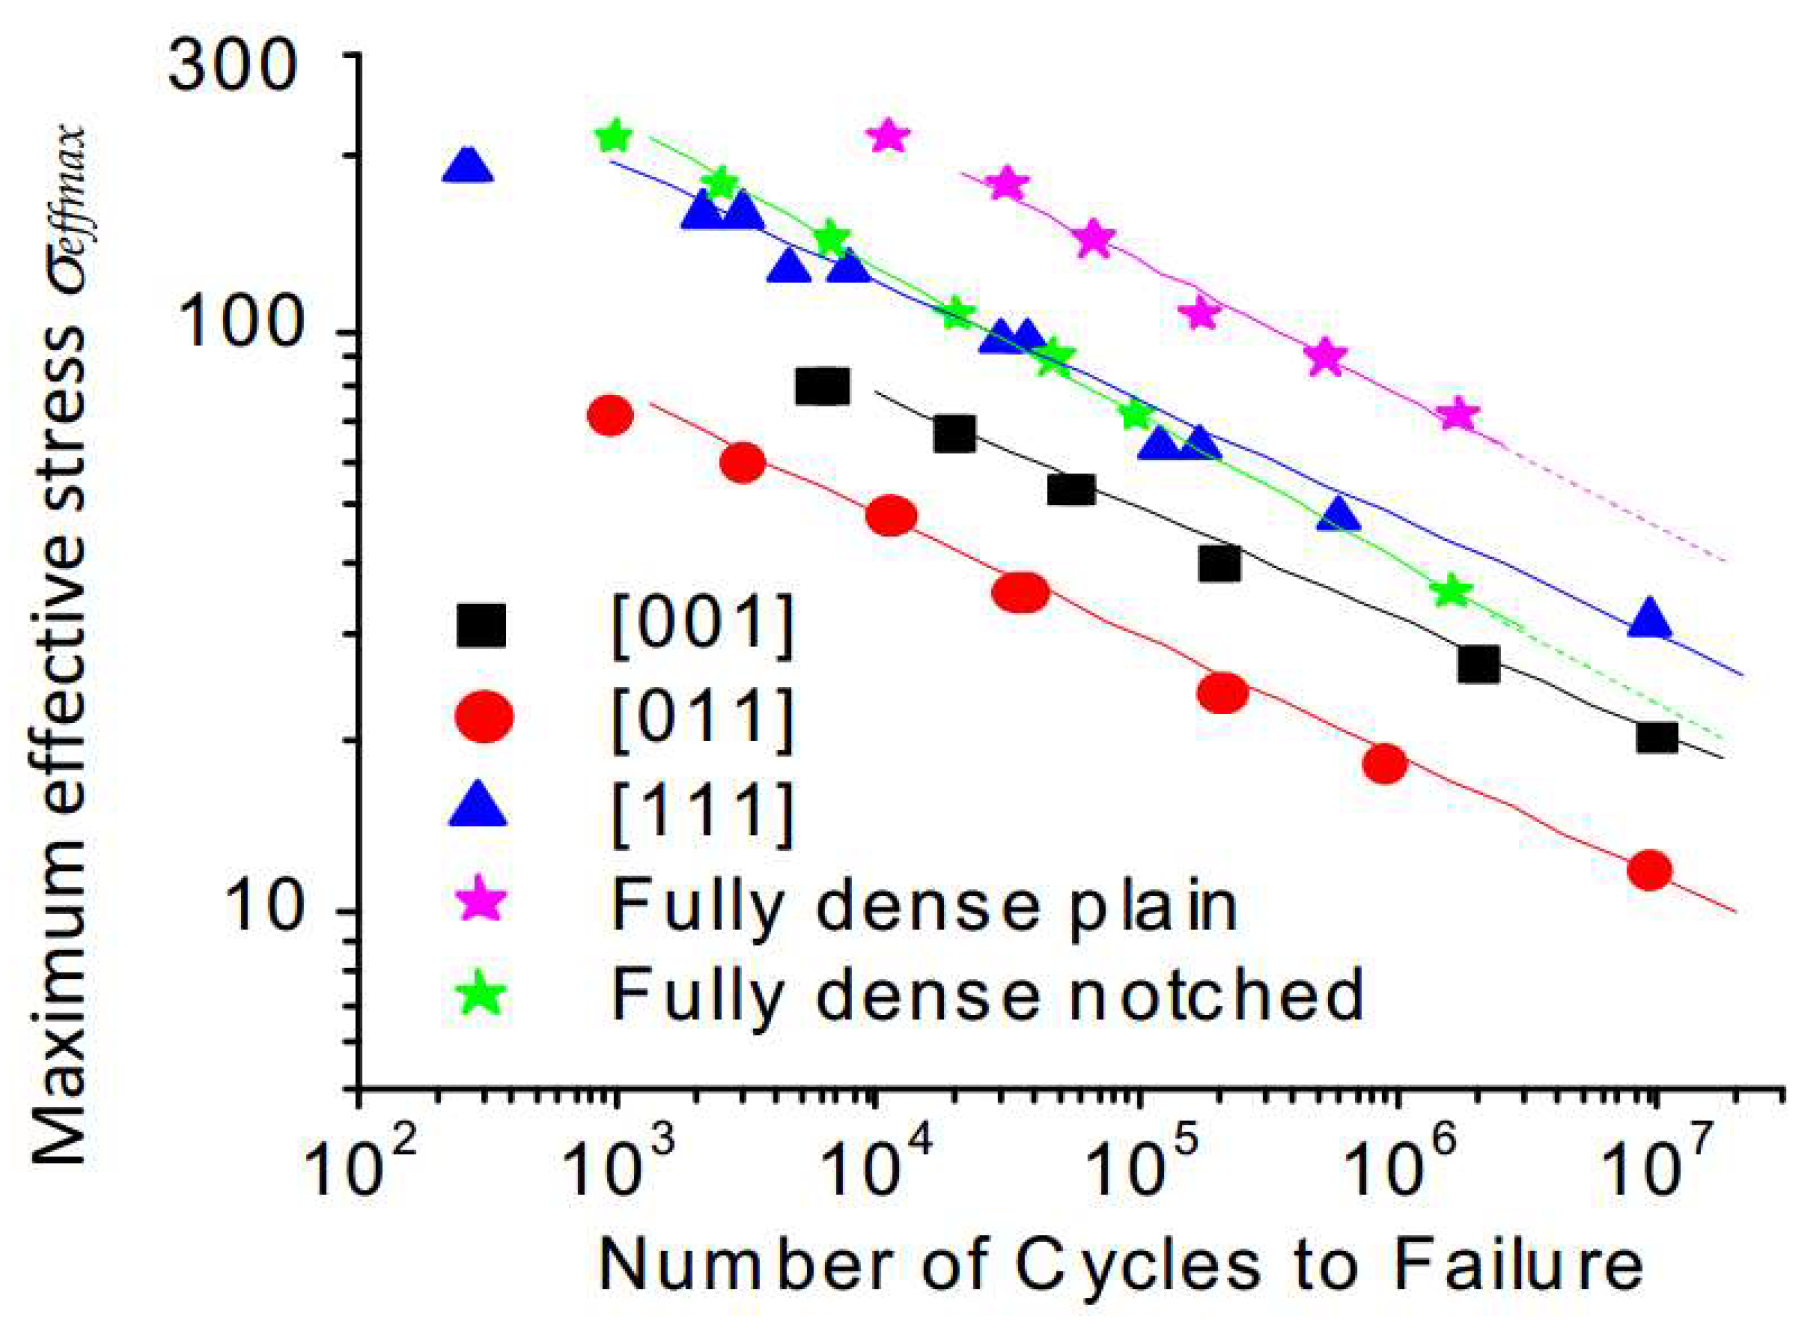
Using this definition, the fatigue lives of all the tested specimens are compared in
Figure 18, where the effective stresses are calculated using the minimum net cross-section areas reported in
Table 1 (for the plain and notched dense specimens, their effective stresses are the same as
σ in
Figure 17a). In agreement with this representation, the fatigue resistance of [111]-oriented specimens appears to be significantly higher than that of [001]- and [011]-oriented specimens and almost identical to that of their notched counterparts. The fully dense plain specimens are clearly the best performing, thus reflecting the detrimental effect of stress concentrations in lattice and notched specimens on their effective fatigue resistance.
Next, the endurance limit of each specimen
σe, defined as the maximum effective stress corresponding to a fatigue life of 10
7 cycles, can be calculated using the Basquin law fitting (
Table 4). The endurance limit in terms of effective stresses are finally used to calculate the fatigue stress concentration factor,
Kf, assuming the endurance limit of plain specimen,
σe(
pl) as the reference value.
4. Discussion
The results obtained in the framework of this study provide useful experimental information for the design of complex AM components, more specifically of lattice structures subjected to tension loads. This last aspect has not been extensively studied in the literature and constitutes the main contribution of this work. One of the points we aimed to highlight was the overall suitability of the L-PBF technology to the manufacture of lattice-containing components. Such components made of an AlSiMg alloy exhibit an irregular surface finish, with higher surface roughness and a greater number of defects than what was reported for TiAlV [
6]. Despite these drawbacks, the components kept their integrity during both monotonic and cyclic mechanical loading, even for the [011] and [111] orientations for which the minimum overhang angle was far below that for the [001] orientation. Therefore, this manufacturing process can be considered for applications where the functionality of lattice structures is required, and the properties of the AlSiMg alloy are suitable.
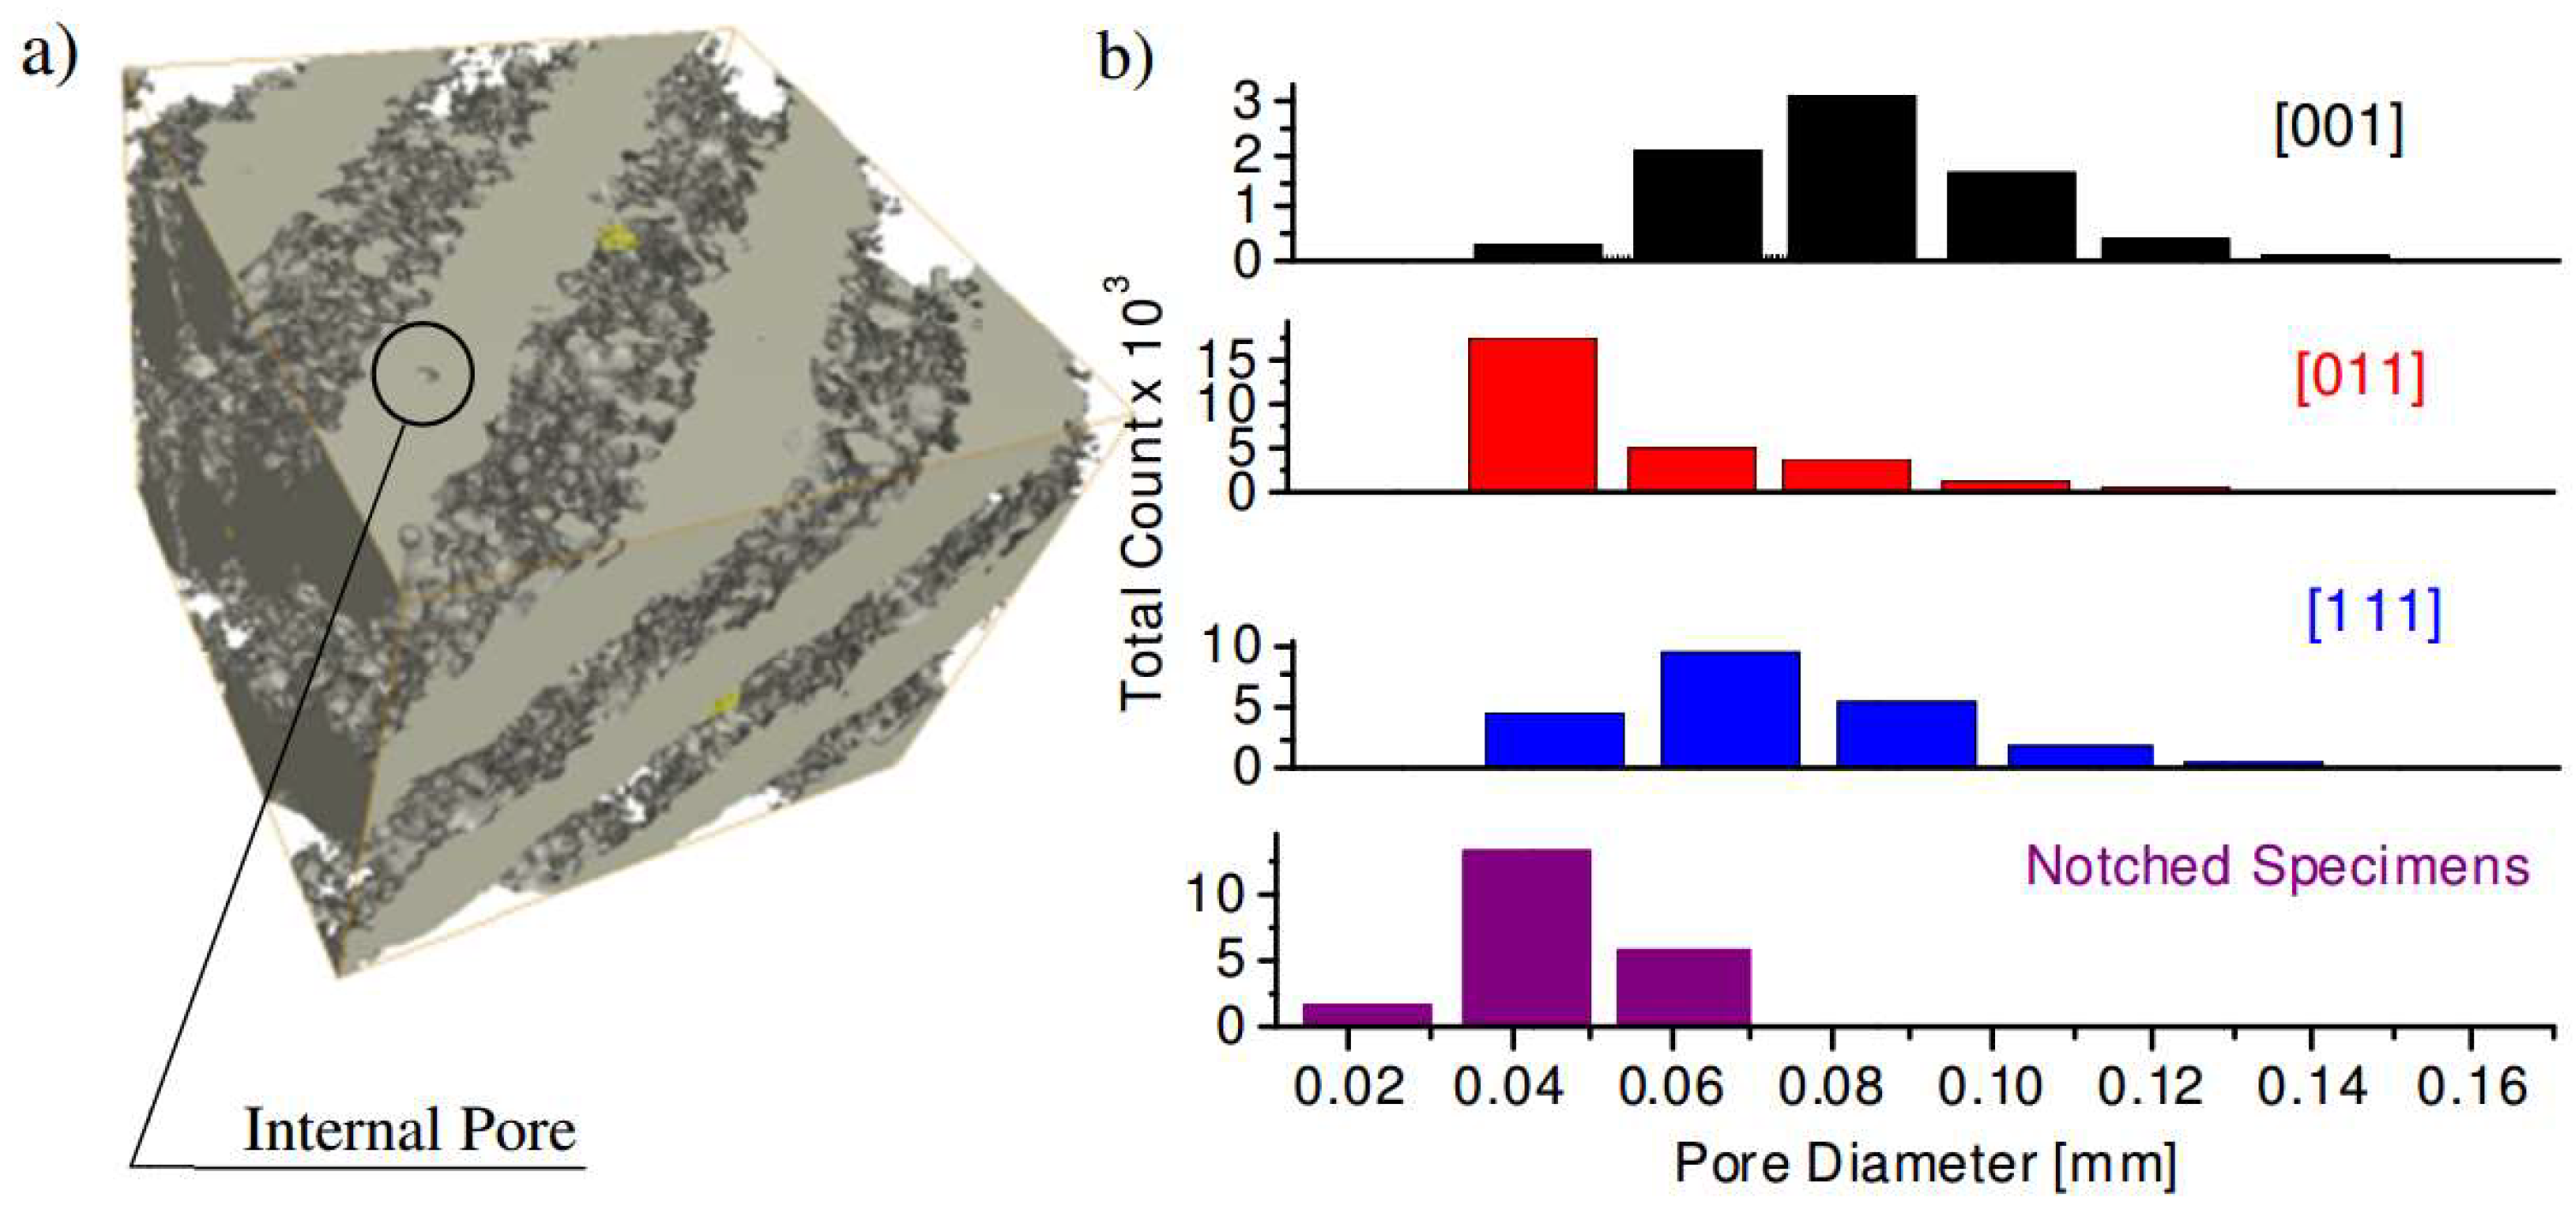
The CT analysis performed in
Section 2.5 indicated that the total volume of internal pores was kept below 0.24% for all the specimens of the study, the value that can be considered too low to impair the functional properties of L-PBF components [
36]. Moreover, since no significant differences in porosity levels of the differently oriented lattice structures were measured, we believe that in our study the struts orientation did not significantly impact the defects distribution as was observed by Delroisse et al. [
22]. That said, a special investigation must be carried out to assess the impact of such a process-induced porosity on the static and, especially, fatigue behavior of L-PBF AlSi10%Mg components. The same CT analysis showed that the cross sections of the manufactured specimens were systematically thinner than their CAD origins (the former representing a fraction of 0.81 to 0.925 of the latter).
Monotonic tensile testing of lattice specimens revealed a notable dependence of their mechanical properties on cell orientation. The ratio between the Young’s moduli of the [111] and the [001] orientations was 1.67, which, when compared with crystals with cubic symmetry, corresponds to a significant degree of elastic anisotropy [
42]. It must, however, be mentioned that no agreement exists on the degree of the diamond cell anisotropy. In some works, this cell is assumed isotropic [
33], while the contrary is suggested in other works [
43,
44]. The second position seems to be more convincing, since it is well accepted that the elastic properties of crystals with diamond geometry exhibit directional dependence [
42,
45]. Regarding the mechanical strength, the corresponding values for [001]-oriented specimens were almost 20% higher than that for [111]-oriented specimens. The ductility and the energy to fracture were higher in [001]-oriented specimens than in [011]-oriented specimens, with both quantities being dramatically reduced for [111]-oriented specimens. These results are consistent with the fact that the fracture surface areas associated with each orientation decrease in the same order: [001], [011], and [111] (see the illustrations of fracture surfaces in
Figure 12).
By comparing the fatigue resistance of the lattice structures in terms of the applied stresses, it can be concluded that the [001] orientation is the most favorable, resulting in fatigue lives that are ~30% higher than for the other orientations (
Figure 17b). Additionally, [001]-oriented specimens showed the highest resistance to ratcheting, being almost 1.5 orders of magnitude more resistant than [011]-oriented specimens, within the tested stress range. With respect to the final fracture, both the [001]- and [011]-oriented specimens exhibited a well-defined third stage of deformation, with a notable increase in the rate of ratcheting, in contrast with [111]-oriented specimens, which presented an abrupt final fracture. This brittle-like behavior of [111]-oriented specimens during their cyclic testing is in line with the corresponding results of monotonic testing, and prevents the possibility of predicting an imminent fracture of such lattice structures by observing an accumulation of their plastic deformation during cycling.
The results obtained in this work do not allow a determination of whether the cell orientation dependence is mainly related to the intrinsic anisotropy of the diamond cell or that it has mainly to do with the manufacturing aspects. Note, however, that the differences in the levels of internal porosity or surface roughness among the three studied orientations were not sufficiently significant to explain such a systematic difference in the fatigue lives. A detailed microstructural analysis is however mandatory to clarify this aspect.
Plotting the fatigue lives as functions of the normalized maximum stresses (
σmax/
σUTS) allows a comparison of specimens with different densities, cell geometries, and materials. The compressive fatigue properties of porous materials are frequently reported using such a representation, normalizing the applied stress by the so-called plateau stress (see e.g. [
27,
46,
47]). Following this approach, it was found that [001]-oriented specimens performs even better than the plain specimens, while the S-N data of [011]- and [111]-oriented specimens lie in-between those of their plain and notched counterparts. The data reported here can eventually be incorporated into an extended study involving other densities, cells geometries, and materials. It is worth pointing out that this comparison is made relatively to the ultimate strength, which is measured independently for each kind of the specimens and under pseudostatic conditions. Therefore, from this comparison, it is not possible to conclude on how some particular aspects, such as the surface roughness or the stress concentrations, affect the fatigue behavior of each kind of specimens.
A rough estimation of the stress concentrations related to the geometrical characteristics of each specimen and of their impact on the fatigue resistance can be made by comparing the S-N diagrams, where S represents the level of acting effective stresses (
Figure 18). A similar procedure was used by Huynh et al. [
29] to compare the fatigue lives of lattice and dense specimens. The calculations of the fatigue stress concentration factors
Kf from these fatigue lives, assuming the plain specimens as the reference, indicate that, for [111]-oriented specimens, local peak stresses corresponding to mean effective stresses are lower than those for [001]- and [011]-oriented specimens. The local stresses calculated here should not be confused with those obtained using the local stress approach of Hooreweder et al. [
48], by which the maximum tensile stresses acting on individual struts were calculated as a direct combination of stresses resulted from normal forces and bending moments. Such an approach cannot be applied in the case of small strut length-to-thickness ratios as those studied in this work.
Although stress concentration factors are conceived to study simple geometries with stress risers like holes or notches, the evolution of local stresses in lattice structures can be a result of a combination of different loading modes, such as bending and tension in struts, which make up these structures. A further study of the same lattice specimens under compression would be useful for distinguishing between the two effects, since, while bending moments would cause equal tensile stresses, the normal component of the force would change to compression stresses.
Notched specimens deserve particular mention; the calculated static stress concentration factor
Ke = 2.33 (
Figure 10a) is significantly higher than the corresponding fatigue stress concentration factor
Kf = 1.6. This misfit is related to the fact that the
Ke calculations do not take into account all the phenomena arising during fatigue testing, which may attenuate the ratio between the peak stresses generated in the notched and the plain specimens. For example, for the
Ke evaluation, the stress redistribution due to plasticity during monotonic loading can differ from that produced during the cyclic loading. Additionally, the influence of the surface roughness, which may affect the fatigue resistance of the plain and the notched specimens differently, cannot be simulated by such numerical calculations.
5. Conclusions
This work provides experimental data on the mechanical behavior, and more specifically the fatigue resistance under tension of ~44–45% of relatively dense diamond cell lattice structures made of AlSiMg alloy, using laser powder bed metal fusion. The results are reported together with information obtained from fully dense plain and notched tensile specimens made of the same material using the same manufacturing technology.
A significant dependence on the orientation of diamond cells was found for the mechanical properties measured under both monotonic and cyclic loading conditions. The ultimate strength for the [001] orientation came up almost 20% higher than for the other orientations. Specimens with the [111] orientation showed a notably lower ductility.
The fatigue lives of specimens with the [001] orientation were ~30% higher than those of [011]- and [111]-oriented specimens with the same level of applied stresses. In the same vein, [001]-oriented specimens exhibited ratcheting rates almost 1.5 orders of magnitude lower than [011]-oriented specimens.
The stress concentration factors evaluated in terms of effective stresses range from highest to lowest as follows: [011], [001], and [111]. Only [111]-oriented specimens showed a fatigue concentration factor lower than that obtained for the dense notched specimen.


