Article

Microstructural and Microhardness Evolution from Homogenization and Hot Isostatic Pressing on Selective Laser Melted Inconel 718: Structure, Texture, and Phases

1
Chemical Engineering Department, Khalifa University of Science and Technology, Masdar Institute, Masdar City, Abu Dhabi P.O. Box 54224, UAE
2
Department of Mechanical Engineering, Tafila Technical University, Tafila 66110, Jordan
3
Department of Mechanical Engineering, École de Technologie Supérieure, 1100 Notre-Dame Street West, Montreal, QC H3C 1K3, Canada
4
Mechanical Engineering Department, Concordia University, 15151 rue Sainte Catherine Ouest, Montreal, QC H3G 2W1, Canada
*
Author to whom correspondence should be addressed.
J. Manuf. Mater. Process. 2018, 2(2), 30; https://doi.org/10.3390/jmmp2020030
Submission received: 11 April 2018 / Revised: 8 May 2018 / Accepted: 9 May 2018 / Published: 16 May 2018
(This article belongs to the Special Issue Additive Manufacturing)

Abstract

:
In this work, the microstructure, texture, phases, and microhardness of 45° printed (with respect to the build direction) homogenized, and hot isostatically pressed (HIP) cylindrical IN718 specimens are investigated. Phase morphology, grain size, microhardness, and crystallographic texture at the bottom of each specimen differ from those of the top due to changes in cooling rate. High cooling rates during the printing process generated a columnar grain structure parallel to the building direction in the as-printed condition with a texture transition from (001) orientation at the bottom of the specimen to (111) orientation towards the specimen top based on EBSD analysis. A mixed columnar and equiaxed grain structure associated with about a 15% reduction in texture is achieved after homogenization treatment. HIP treatment caused significant grain coarsening, and engendered equiaxed grains with an average diameter of 154.8 µm. These treatments promoted the growth of δ-phase (Ni3Nb) and MC-type brittle (Ti, Nb)C carbides at grain boundaries. Laves phase (Fe2Nb) was also observed in the as-printed and homogenized specimens. Ostwald ripening of (Ti, Nb)C carbides caused excessive grain growth at the bottom of the HIPed IN718 specimens, while smaller grains were observed at their top. Microhardness in the as-fabricated specimens was 236.9 HV and increased in the homogenized specimens by 19.3% to 282.6 HV due to more even distribution of secondary precipitates, and the nucleation of smaller grains. A 36.1% reduction in microhardness to 180.5 HV was found in the HIPed condition due to   γ phase dissolution and differences in grain morphology.

1. Introduction

Inconel 718 (IN718) is widely used primarily due to its excellent mechanical properties and corrosion resistance at high temperatures [1]. The alloying elements of Inconel 718 include iron (Fe), chromium (Cr), niobium (Nb), and molybdenum (Mo), as well as small amounts of titanium (Ti), aluminum (Al), and carbon (C) [2,3,4]. IN718 has found its way into high temperature applications such as engine components, pressurized water reactors, nuclear reactors, and turbine blades. It is also used in highly-corrosive room temperature oilfield applications, like fasteners, valves, drill tools, and completion equipment [5].
Difficulties in machining finished products made from Inconel 718 arise due to its high hardness and low thermal conductivity, which can result in excessive tool wear [1,6]. Additive manufacturing (AM) techniques build objects in successive layers using information encoded into a digital 3D model [7]. Laser-based AM has received significant attention due to its ability to produce robust metallic structures directly from metallic powders. Selective laser melting (SLM) is able to produce complex geometries using significantly less materials and requiring no tooling compared to traditional subtractive methods of manufacturing. This method allows the production of objects with shapes that were previously difficult or impossible to make, while also enabling more efficient low-volume production due to the absence of costly tooling [8,9].
Selective laser melting results in mechanical properties comparable to those of conventional cast manufacturing techniques [1]. However, SLM yields microstructures that are highly anisotropic due to columnar grain growth parallel to the building direction that is caused by a steep thermal gradient [4,10,11,12,13,14]. Crystallographic texture in Ni-based superalloys has been shown to have a strong anisotropic influence on the material properties, such as fatigue life and creep performance [15,16]. Materials produced by SLM require post-printing treatments in order to be suitable for use in applications requiring isotropic characteristics. For instance, Popovich et al. [17] found significant improvement in the creep and thermomechanical fatigue properties of SLM IN718 after annealing (850 °C for 2 h, then air cooling) and aging (720 °C for 8 h, then furnace cooled to 621 °C and held for 8 h, then air cooled).
Variations in processing parameters, such as laser energy density and scanning strategy, have been shown to have considerable effects on the microstructure and mechanical properties of IN718 [2,10,18]. Parimi et al. [18] determined that higher laser power resulted in stronger texture formation. The study found Laves phase-(Ni, Cr, Fe)2 (Nb, Mo, Ti), carbides, and orthorhombic δ-(Ni3Nb) phase precipitates in all specimens, however, larger Laves phase precipitates formed with increased laser power [18]. Zhang et al. [19] observed Laves phase and carbide precipitates in the inter-dendritic regions of as-printed specimens. Maximal density and hardness values were obtained by Jia and Gu [2] at a laser energy density of 330 J/m.
Post-manufacturing processes on SLM IN718 are currently undergoing intense investigation. Wang et al. [4] reported that γ (Ni3(Ti, Al)) and γ (Ni3Nb) disseminated and precipitated in the γ matrix, strengthening the alloy, after solution treatment (980 °C for one hour then air cooled) and subsequent double aging (710 °C for 8 h, then furnace cooled at 620 °C for 8 h, then air cooled). Nb-rich inter-dendritic regions of as-printed specimens were reported to dissolve into the matrix [4]. The growth of needle-like δ phase precipitates was also observed after these treatments [4]. Zhang et al. [19] compared the microstructure and mechanical properties of as-printed Inconel 718 after solution treatment and double aging with the properties of homogenization treatment (1180 °C for 1.5 h, then air cooling), solution treatment, and double aging. The study described the replacement of dendrites with recrystallized grains and the dissolution of Laves phase, allowing   γ , γ , and δ to precipitate along grain boundaries [19]. They reported an improvement in the ultimate tensile strength of the solution treated, and homogenized, then solution treated specimens (both 1371 MPa) compared to as-fabricated specimens (1126 MPa) [19]. However, they found that elongation of as-printed specimens was higher compared to their heat treated counterparts (22.8% in as-printed compared to 10.1% in solution treated, and to 12.3% in homogenized specimens) [19].
Amato et al. [11] revealed the effects of hot isostatic pressing (HIP, 1163 °C for 4 h at 0.1 GPa) and annealing (1160 °C for 4 h) on as-printed specimens separately. HIP treatment was determined to produce more pronounced [200] columnar γ , and partially recrystallized grains [11]. Annealing induced 50% recrystallization and the formation of spheroidal γ precipitates in fine γ dense regions [11]. Mostafa et al. [13] described the effects of homogenization and homogenization with HIP treatment on IN718 specimens SLM-printed perpendicular to the building direction. The study found that post-manufacturing treatments reorganized the {002} dominant columnar grain structure into equiaxed grains with a {111} dominant orientation [13]. (Nb0.78Ti0.22)C carbides and δ-phase precipitates were also reported to form due to the diffusion of constituent elements and the high temperature treatment which led to dissolution of   γ [13].
Tucho et al. [20] reported differences in microhardness between the top and bottom of SLM IN718 printed vertically (with respect to the building direction). The cause of these discrepancies was not verified in the study [20]. The aim of this study is to analyze and quantify the local differences in microstructure and microhardness that occur due to the build orientation of 3D printed IN718 using SLM, as well as to determine the effects of building strategy on the microstructure and localized mechanical properties after heat treatment. Additional investigation into the effects of building strategy and heat treatments on the microstructure, texture, and phase evolution of laser melted IN718 is required to generate a full understanding of these processes. This added knowledge will be useful in optimizing the microstructural and mechanical properties of SLM manufactured parts.

2. Materials and Methods

The material used to manufacture SLM specimens was gas-atomized Inconel 718 powder provided by EOS-GmbH (Krailling, Germany) [21]. Composition of the powder was determined by Mostafa et al. [13].
Cylindrical specimens were printed using an EOSINT® M280 400 W Yb:YAG fiber laser and parameter set Inconel 718_Performance 1.0 (285 W laser power, 0.11 mm hatching distance, 40 µm layer thickness, 100 µm laser beam diameter, and 960 mm/s scanning speed). The platform was preheated to 80 °C and held at this temperature to reduce the thermal gradient between fabricated parts and the platform [11,22]. The cylinders were 12 mm in diameter and 20 mm in length, and were printed at a 45° with respect to the building direction as shown in Figure 1a. The representation of x, y, and z axes in the figure will be used as a reference in this paper. The laser scanning strategy consisted of bidirectional laser tracks and a hatch angle of 67° in each consecutive layer as illustrated in Figure 1b [13]. The cylinders underwent homogenization (as-printed specimens heated to 1100 °C for an hour, then furnace cooled), and hot isostatic pressing (homogenized specimens were heated to 1160 °C under 100 MPa of pressure for 4 h, then furnace cooled) treatments.
Specimens were cut into horizontal and vertical cross-sections with respect to the cylinder axis, shown in Figure 2, using a diamond-bladed slow cutter in a mineral oil bath to prevent sample heating and for lubrication. Specimens were polished down to 0.25 µm using glycol-based diamond suspension and etched for metallographic investigation using Kalling’s Solution No. 2 (5 g CuCl2, 100 mL HCl, 100 mL ethanol).
Optical microscopy (OM) was carried out using an Olympus BX51M (Tokyo, Japan) equipped with a digital camera. The optical micrographs were processed using Image J® software (National Institutes of Health, Bethesda, MD, USA) [23] in order to determine the porosity percentage and melt pool dimensions. Scanning electron microscopy (SEM) was performed with an FEI Quanta 250 field emission gun (Hillsboro, OR, USA) equipped with an energy dispersive X-ray spectrometer (EDS, EDAX Inc., Mahwah, NJ, USA). SEM and EDS experiments were carried out at 20 KV and factory preset spot size number 5. An HKL electron backscattered diffraction detector (EBSD, EDAX Inc., Mahwah, NJ, USA) was used to obtain crystallographic orientations and grain size and shape distributions. EBSD images were retrieved with a step size of 0.8 µm and a resolution of 1024 × 800 pixels. EBSD image post-processing consisted of grain confidence index standardization (angle: 5°, size: 2), neighbor confidence index correlation (≥0.1), neighbor orientation correlation, and grain dilation. Specimens were prepared for EBSD analysis by grinding and polishing down to 0.05 µm without etching. X-ray diffraction (XRD) analysis was performed using a PANalytical Empyrean XRD (Spectris plc, Almelo, The Netherlands) to retrieve crystallographic information and phase quantities in bulk specimens. Experimental XRD patterns were refined using Rietveld analysis in the PANalytical X’pert Highscore software (Version 3.0.2, Almelo, The Netherlands) [24] and compared with standard patterns obtained from Pearson’s crystal database [25].
Microindentation hardness tests were performed with a 50 g load using a Vickers HIGHWOOD hardness tester (TTS Unlimited Inc., Kita-Ku, Osaka, Japan). A minimum of seven (HV) tests were conducted along evenly-spaced 1 mm intervals at each of the vertical and horizontal cross-sections of as-printed, homogenized, and homogenized followed by HIP specimens with the exception of the bottom as-printed horizontal cross-section. Only two (HV) tests were possible on the bottom as-printed horizontal cross-section due to the deep surface inclination of the specimen. The data presented correspond to an average hardness observed at each location.

3. Results and Discussion

3.1. Microstructural Characterization

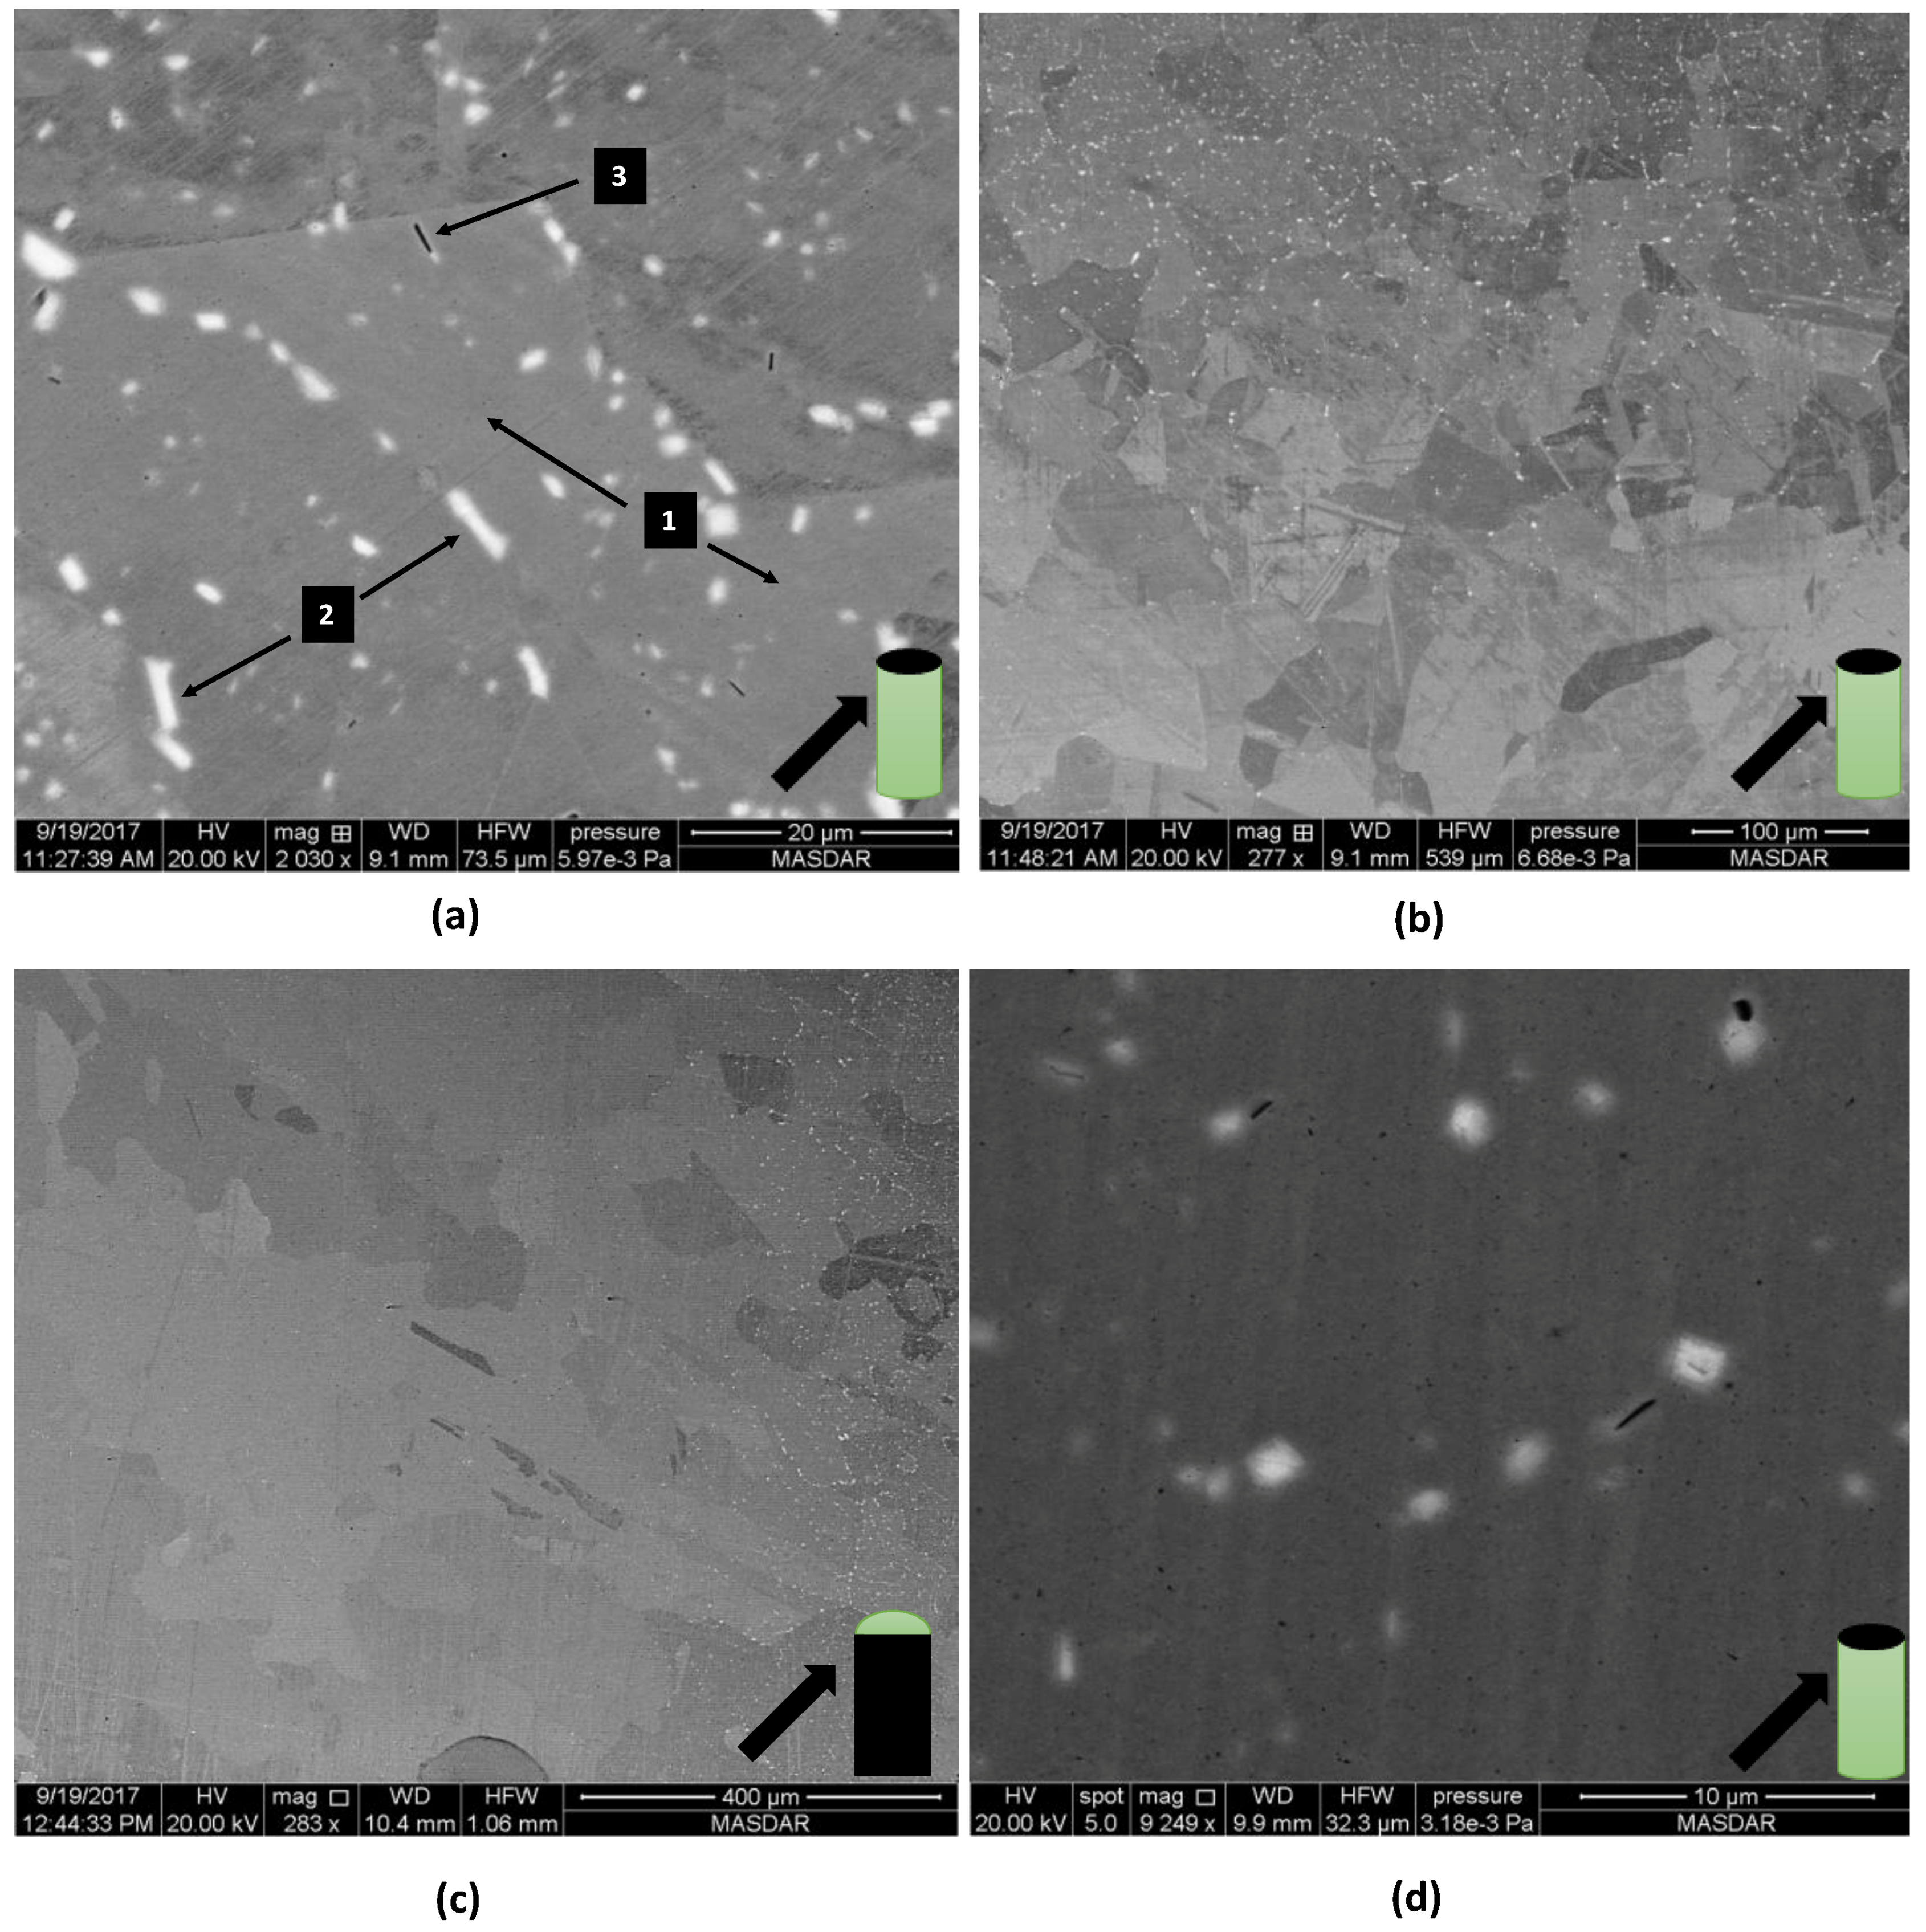
3.1.1. Microstructure of the As-Printed Inconel 718

Due to the unique printing strategy at 45° with respect to the building direction, microstructural properties of the cylindrical Inconel 718 specimen are highly location dependent. These locations can be divided into roughly three sections, the top (1), middle (2), and bottom (3) sections labeled in Figure 3a. The melt pool morphology at each location in the vertical section is displayed in Figure 3b. The images displayed in Figure 3b were taken from the top corner of the specimen (1), the center of the specimen (2), and the bottom corner of the specimen (3). In order to accurately compare the specimens, the micrographs of other conditions are taken at the same positions. The dotted lines illustrated in Figure 3a mark the transitions in melt pool morphology observed in optical micrographs of the cylinder. Morphological variations in these sections can be attributed to the large thermal gradient between older and newer deposited layers during the SLM process [10,13].
The contour layer of the as-printed specimen can be seen at location 1 of Figure 3b. A higher average concentration of porosity is observed to have developed in the contour layer (~0.7%) compared to the interior of the specimen (~0.04%) due to a higher energy density used for contouring. Lower scanning speeds and smaller hatching distances and, therefore, higher energy densities, are used for contouring with the objective of improving surface roughness [26]. During exposure to laser power with a relatively high energy density, a higher concentration of pores with high sphericity form during printing due to gas entrapped in the powder particles [27]. Differences in the morphology at each location in Figure 3 can be explained by a process of vertical and horizontal melt pool interactions [13]. Melt pools in location 3 appear to be relatively shallow and have an average depth of 51.1 ± 18.3 µm. The significant difference in temperature between the building platform and the melted powder causes a large temperature gradient and high cooling rates at the beginning of the 3D printing process [28,29]. Rapid cooling towards the bottom of the specimen causes melted powder to solidify and cool quickly. This cooled material requires more energy to remelt, which reduces the penetration depth of the laser.
A more typical semicircular melt pool morphology is observed at location 2. The average melt pool depth at this location (56.5 ± 19.1 µm) is larger than the value found at location 3, yet smaller than the depth at location 1 (72.8 ± 25.0 µm). Every layer added to the specimen gives additional heat to the matrix. New layers at location 2 are deposited on previous layers which are at relatively higher temperatures than those at location 3. It, therefore, takes less energy to remelt the previously-deposited layers at location 2 than it does at location 3, allowing the laser to penetrate further into the previous layer. Relatively low cooling rates and a reduction in the path that the laser travels at the top corner of the specimen cause this region to have the deepest melt pools. The decreased laser path accelerates the deposition of new layers, reducing the amount of time for previous layers to cool. Figure 4 displays SEM images of melt pool boundaries and inter-dendritic grain structures in both etched and non-etched specimens. These images were taken at locations 1, 2, and 3 of the vertical cross-section of the specimen displayed in Figure 3. Melt pool boundaries are clearly visible in both the etched and non-etched SEM images. The average diameter of melt pools at location 3 is 175.1 ± 83.1 µm. These relatively wide and shallow melt pools appear to be flat layered boundaries in the SEM images at location 3 in Figure 4. Average melt pool diameters at locations 2 and 1 are 108.0 ± 26.6 µm and 130.44 ± 38.1 µm, respectively. Visible melt pool lines were reported to disappear in the upper layers of horizontally-printed specimens (with respect to the building direction) [13]. In comparison, this study finds that the melt pool boundaries at location 1 are still visible.
Long and thin columnar grains demonstrating epitaxial growth over multiple layers of melt pool boundaries in the building direction and faint remnants of micro-dendritic structures can be observed at location 3 in Figure 4. Grain growth over melt pool boundaries is due to the remelting of previous layers at the bottom of the specimen [30]. Columnar grains crossing over melt pool boundaries are also observed in locations 1 and 2 of Figure 4. However, the grains at these locations appear to have less elongated and relatively more equiaxed structures. Regions (a) and (b) indicated in the non-etched image at location 2 in Figure 4 exhibit differences in primary dendrite arm spacing (PDAS) within the melt pool structures, corresponding to the changing cooling rates. Region (a) contains dendrites with an average PDAS of ~0.37 µm, whereas the dendrites in region (b) have undergone partial dissolution and have an average arm spacing of ~0.2 µm. Region (a) is located within an area of the previous layer that has been re-melted. Due to this vertical melt pool overlap, region (a) is expected to have had a larger heat content than region (b). These overlapping melt pool boundaries have been reported to act as nucleation sites for new grains in the successive printed layers [13]. Dendritic structures form due to rapid cooling rates in the laser melting process [10], which were estimated to be between 10 5 10 8 °C/s [31,32]. Micro-dendrites appear to have almost vanished in the bottom layers (location 3) of the specimen. This is due to the increased interaction between the horizontal and vertical melt pools in this region [13].
Figure 5a displays a non-etched SEM image of the top horizontal cross-section, indicated by the black surface in the bottom right corner. Skewed melt pools can be seen at the horizontal cross-section of the cylinder, outlined by yellow dotted lines. As the laser scans the powder bed, the melt pool exits and enters the horizontal cross-section at a 45° angle, which creates the appearance of distorted melt pool boundaries along the cross-section, illustrated in Figure 5b.

3.1.2. Microstructural Development of Heat Treated Inconel 718

After the initial homogenization treatment, melt pool boundaries are no longer visible. Inter-dendritic regions seen in as-printed specimens have mostly dissolved into the γ matrix, however, faint remnants are still discernable. Precipitate phases along grain boundaries have replaced Nb-rich white inter-dendritic regions within the matrix after homogenization of the as-printed specimens. Observable precipitated phases distributed throughout the specimen include the needle-like δ phase, globular MC-type carbide phase, and a white plate-like phase that is most likely a Laves phase. The γ phase that existed in the interdendritic regions has disseminated and precipitated more evenly into the matrix, similarly to what was reported in the literature [4]. Phases   γ ,   γ , δ, MC-carbide, and Laves phase are shown in Figure 6 and labeled 1 to 5, respectively. A semi-quantitative EDS analysis of these phases is covered in Section 3.2. Grain size and aspect ratio comparisons obtained by EBSD analysis are discussed in Section 3.3.2.
Specimens that undergo hot isostatic pressing after homogenization contain the γ matrix phase, as well as larger MC-carbide and δ phase precipitates labeled 1, 2, and 3 in Figure 7a, respectively. The Laves phase has dissolved completely and γ is not visible in the SEM images, as shown in Figure 7d. It is possible that γ particles are not visible in HIP-treated specimens due to their small size, which can be as small as 20 nm [4,33]. Unlike homogenized specimens, MC-carbides are not evenly distributed across the HIPed specimens. Dense regions of these globular precipitates can be seen in a ring about ~175 µm thick around the edges of horizontal cross-sections of the sample and also around the outer edges of vertical cross-sections, displayed in Figure 8b,c. The area percentage of these carbides is calculated from SEM images of vertical and horizontal cross-sections using image analysis, as summarized in Figure 8.
The   γ   and δ phases dissolve at temperatures above 1032 °C [34]. Dissolution of γ   stimulates the growth of MC-carbides during HIP treatment [13]. Carbides with the composition NbC were reported in homogenized and HIPed SLM IN718 printed horizontally with respect to the building direction [13]. NbC carbides have a solvus temperature between 1040–1093 °C [34]. Rao et al. [35] observed Nb- and Ti-rich MC-carbides along grain boundaries in powder compaction-sintering specimens of IN718 fabricated by HIP (1200 °C at 120 MPa for 3 h), a subsequent heat treatment (955 °C for one hour, then quenched), and double aging (720 °C for 8 h and furnace cooled followed by 620 °C for 8 h, then air cooled). They reported that the dissolution of these MC-carbides occurred during solution treatment of the specimens at 1150 °C for 1 h [35]. Lower percentages of carbides in the middle of the specimen can be attributed to differences in cooling rates between the surface and interior of the specimen, stimulating carbide dissolution during HIP treatment. Although furnace cooling occurs at a rate of around 2 × 10 3   ° C /s [13], specimen outer layers cool at a higher rate than the interior. Due to comparatively slower cooling, carbide dissolution occurs for a longer period of time in the interior. Area fractions calculated in Figure 8 indicate larger percentages of MC-carbides residing at the top horizontal cross-section of the HIPed specimen as compared to the bottom. This is verified by Rietveld analysis of XRD data in Section 3.3.1. Segregation of C and Nb during non-equilibrium solidification is the driving force for carbide formation [36]. This occurs during homogenization and HIP treatments due to Nb-rich γ dissolution, as mentioned earlier. However, as relative amounts of γ decrease during HIP treatment, carbide formation slows and the phase begins to dissolve through Ostwald ripening [34].
Due to the higher percentage of γ segregated within interdendritic regions at the top of SLM specimen, discussed further in Section 3.3.1, the region undergoes more carbide growth. Dissolution of the carbide phase through Ostwald ripening is linked with rapid grain growth in wrought IN718 [34]. This excessive grain growth did not occur alongside NbC dissolution in heat-treated compacted powder specimens due to the presence of prior particle boundaries (PPB) restricting the growth of grains [35]. However, SLM-manufactured IN718 specimens are free of PPBs [37]. Without PPBs inhibiting grain growth, Ostwald ripening of NbC precipitates is expected to lead to excessive grain coarsening in heat treated SLM specimens. This is evident through the presence of larger grains in the bottom horizontal cross-section of the HIPed cylinder compared to the top, which is discussed in Section 3.3.2.

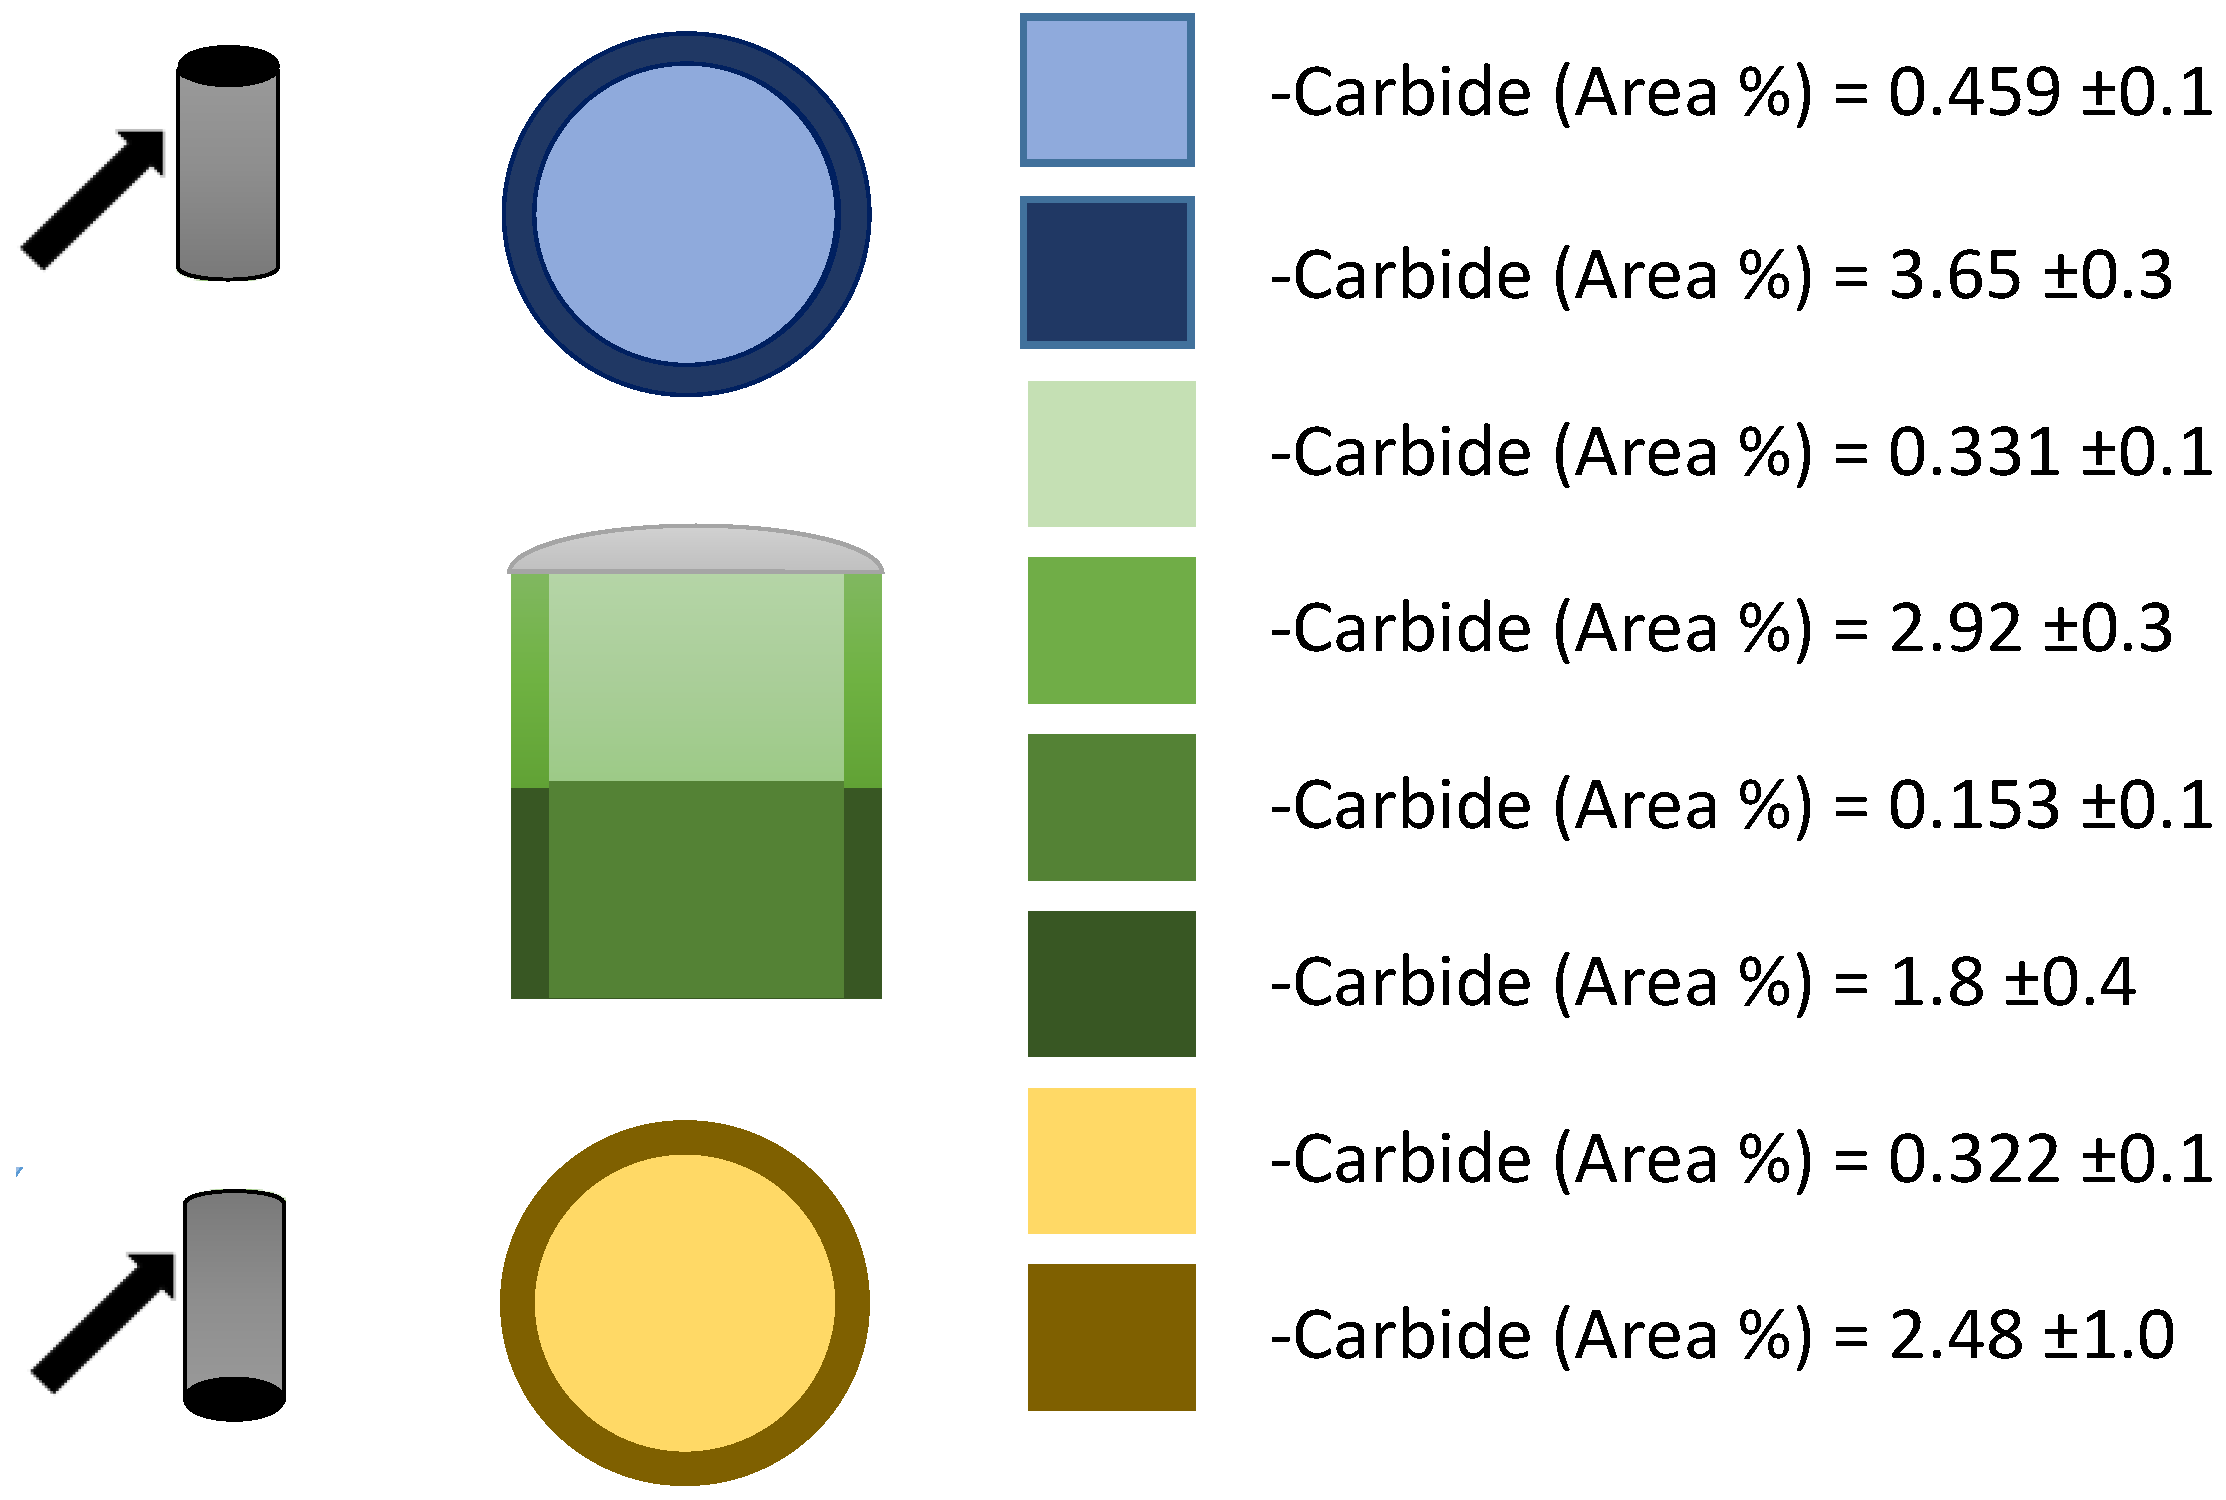
3.2. Phase Analysis of Heat-Treated Inconel 718

Energy dispersive spectroscopy (EDS) was used in combination with XRD to identify and compare observed phases with results reported in the literature. Table 1 summarizes the results of EDS spot analysis on the matrix and precipitates in homogenized specimens. δ and Laves phase precipitates are associated with larger experimental error due to their small size and the volumetric interaction of the electron beam with neighboring phases.
Inter-dendritic regions of as-printed specimens have been observed to contain the γ strengthening phase [11,13,38,39]. MC-type carbides and Laves phase have also been reported to exist in these regions [12,18,19,20]. The Laves phase ((Fe, Ni, Cr)2(Nb, Ti)) precipitates as a plate-like phase and forms in inter-dendritic regions due to the segregation of Nb and Ti [40,41]. The Laves phase with the composition (Fe2Nb) was detected in fusion zones of Inconel 718 welds [41,42]. EDS analysis showed that the atomic ratio of Fe:Nb in the white plate-like phase observed in homogenized specimens (Spot 5 in Figure 6) is 2.5:1. Although the plate-like phase could not be detected by X-ray diffraction due to a relatively small amount of precipitates, its morphology and composition are comparable with the Laves phase reported in the literature [3,19]. Qi et al. [3] reported the partial dissolution of the Laves phase during solution treatment at 980 ° C of laser net shape manufactured specimens. Zhang et al. [19] similarly observed incomplete dissolution of Laves phase in SLM specimens after solution treatment at 980 ° C and double aging at 720 ° C . The instability of the Laves phase at homogenization temperatures leads to the assumption that it precipitated during SLM, concurrently with γ , within the Nb-rich inter-dendritic spaces, and began to dissolve during heat treatment.
The γ -phase matrix composition is consistent with the literature [4,13,30]. Wang et al. [4] detected a needle-like δ phase with a rhombic crystal structure and (Ni3Nb) atomic formula in solution-treated SLM Inconel 718 followed by double aging. The atomic ratio of Ni:Nb reported in the literature was found to be 1:1.77 (19.10 at % Nb and 33.86 at % Ni) [4], 1:2.85 (17.3 at % Nb and 49.4 at % Ni) [43], and 1:4.17 (8.75 at % Nb and 36.5 at % Ni) [13]. This study found a ratio of 1:2.84 (11.22 at % Nb and 31.82 at % Ni) which is close to the theoretical stoichiometric composition (Ni3Nb) of δ phase and in agreement with the findings of other investigations [4,13,43].
Formation of δ phase in heat-treated SLM IN718 is due to segregation of Nb throughout inter-dendritic regions in the as-printed condition. These inter-dendritic regions contain γ identified using XRD and EDS analysis, and the Laves phase identified by EDS analysis. Idell et al. [44] found that the concentration of Nb in interdendritic spaces of direct metal laser sintered (DMLS) ATI 718 Plus® resulted in the formation of a δ phase during solution treatment. Body-centered tetragonal γ undergoes a phase transformation to orthorhombic δ during long-term exposure to high temperatures (100 h at 700   ° C and 50 h at 750 ° C ) [45]. Zhang et al. [19] and Qi et al. [3] reported the growth of the δ phase after partial Laves phase dissolution during solution treatment. Observations of homogenized specimens in this study show the dissemination and precipitation of γ more evenly into the matrix, the partial dissolution of the Laves phase, and the growth of ~1-0 µm long and ~0.20-µm thick δ phase precipitates. HIP treatment resulted in the dissolution of Laves and γ phases, allowing δ precipitates to grow ~1.9 µm long and ~0.25 µm thick.
Carbide formation due to the dissolution of Nb-rich γ was discussed for HIP treatment in Section 3.1.2 and is applicable to the formation of carbides after homogenization of laser melted specimens. Reports of the observed MC-carbide stoichiometry in the literature include (Nb0.78Ti0.22)C [13] and (Nb0.9Ti0.1)C [46]. This study reports a (Nb0.76Ti0.24)C carbide stoichiometry which is comparable to the aforementioned observations. Figure 9 displays EDS spectra of the   γ , MC-type carbide, δ, and Laves phases.

3.3. Evolution of Structure, Phases, and Texture

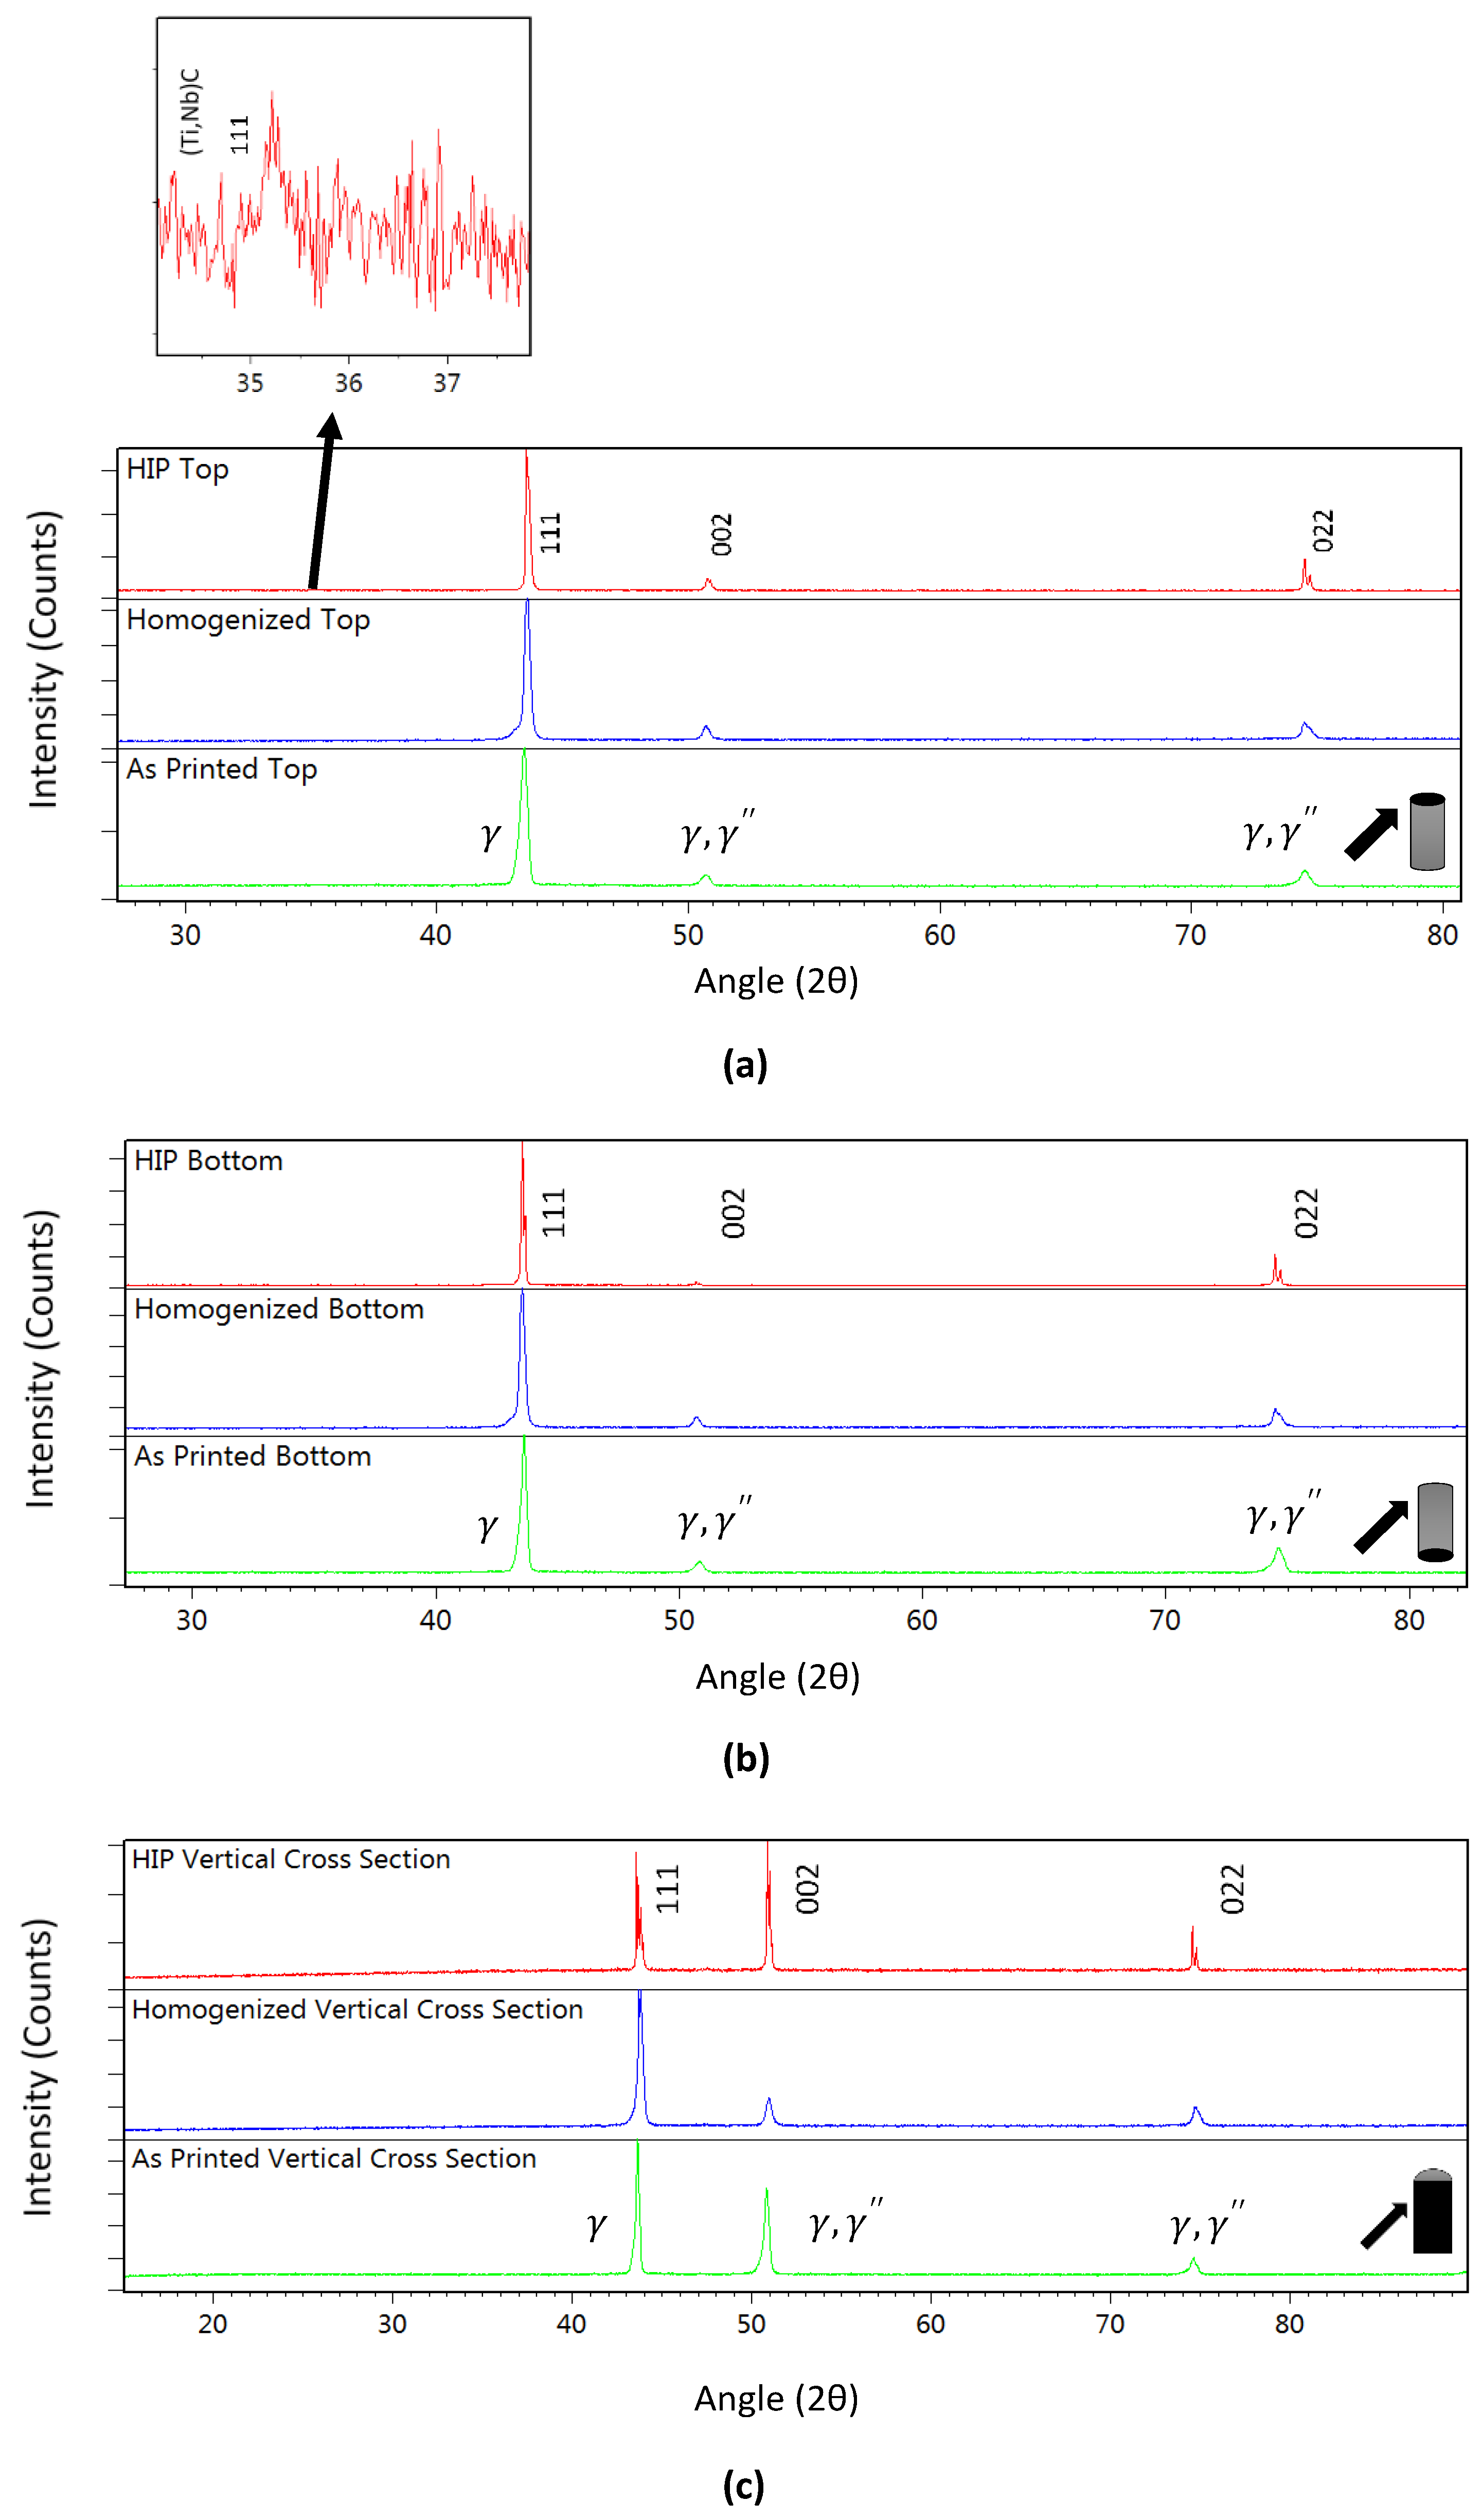
3.3.1. XRD Analysis of Structure and Phases

Figure 10 displays the XRD spectra of the top and bottom horizontal cross-sections and the vertical cross-section of the as-printed, homogenized, and HIP-treated specimens. Table 2 lists the phase quantification of the horizontal cross-sections from Rietveld analysis of the XRD data. The γ -matrix and γ phase were identified in all specimens, however, the volume fraction of γ in heat-treated specimens is listed to be 0%. This could mean that γ is too small to be quantified by Rietveld analysis but exists in enough relative amounts to be detected by the XRD. The (002) and (022) γ XRD peaks overlap with those of   γ , demonstrating that the precipitates formed in a columnar microstructure parallel to the matrix. This phenomenon has been reported in the literature [11,13]. Small γ precipitates were observed in SEM images of homogenized specimens as discussed in Section 3.1.2. However, γ has been reported to dissolve into the γ -matrix after HIP treatment at 1120   ° C [38] for 4 h. A larger volume fraction (3.7%) of γ was detected in the top horizontal cross-section of as-printed specimens compared to the bottom cross-section (2.3%).
Melt pool overlap promotes the dissolution of the white interdendritic regions containing the γ precipitate, as mentioned in Section 3.1.1. If γ dissolution occurred in the bottom of the as-printed specimens at a greater rate than in the top, microhardness would be expected to decrease in the lower layers of the specimens. However, a greater microhardness is observed in the bottom of the as-printed specimens and is discussed in Section 3.4. Increased melt pool overlap in the bottom section of as-printed specimens creates local reheating cycles that could act similarly to heat treatments observed in the literature [4,11,19], causing the dispersion and precipitation of small γ precipitates more evenly into the lower layers of the specimens. This would be consistent with the observations of an increased hardness in the region. Since the segregated γ is disseminated more evenly as smaller particles in the matrix, lower quantities are detected by XRD in the lower layers.
MC-type carbide, δ, and Laves phases were not detected by XRD analysis of homogenized specimens due to their low quantities. However, (Ti, Nb)C carbides were identified in HIP-treated specimen, indicating an overall increase in carbide volume. XRD analysis confirms that greater volumes of (Ti, Nb)C carbides reside at the top (0.2%) of HIP specimens compared to the bottom (0.1%). The top to bottom ratio of γ in the as-printed specimen quantified by Rietveld analysis is 1.6:1, which is very close to the 2:1 top-to-bottom ratio of MC-carbides in the HIPed specimen. Since γ is more segregated within interdendritic regions in the upper layers of the specimens, more MC-carbide formation occurs.
A strong (002) texture with weaker (111) and (022) peaks was reported in cross-sections parallel to the printing direction of SLM specimens fabricated horizontally with respect to the building direction [13]. Amato et al. [11] observed a more dominant (002) and (111) texture with a smaller (022) peak in a vertical cross-section of as-fabricated SLM specimens built in the vertical direction (with respect to the building direction). Horizontal cross-sections retained the prominent (002) and (111) texture, but not (022) [11].
This work identifies a strong (111) texture in all three cross-sections of the as-printed specimen with a strong (002) texture observed in the vertical cross-section. The peaks indicating the (002) and (022) planes in the top and bottom horizontal cross-sections of the as-printed specimens are small. Significant growth in the (111) direction during homogenization and homogenization followed by HIP treatments was reported for SLM specimens printed horizontally with respect to the building direction [13]. Similarly, XRD analysis of the vertical cross-sections revealed that the (111) orientation remains prominent throughout both the heat treatments in this work. A reduction in the peak of the (002) orientation is observed after homogenization treatment. In contrast, grains oriented in the (002) direction grow significantly during HIP treatment and it becomes the dominant orientation in the specimen. A reduction in the (002) orientation after HIP treatment is evident in the bottom horizontal cross-section. Peak splitting is observed in the (111), (002), and (022) diffraction peaks of HIPed specimens at every cross-section, most notably in the (022) plane. This splitting could be due to the phase transformation of γ” to a lower symmetry phase: from (bct-Ni3Nb) to orthorhombic δ-(Ni3Nb). Evidence of this is indicated by the higher relative amount of δ phase in the HIPed specimens, as compared to other conditions determined by phase analysis.

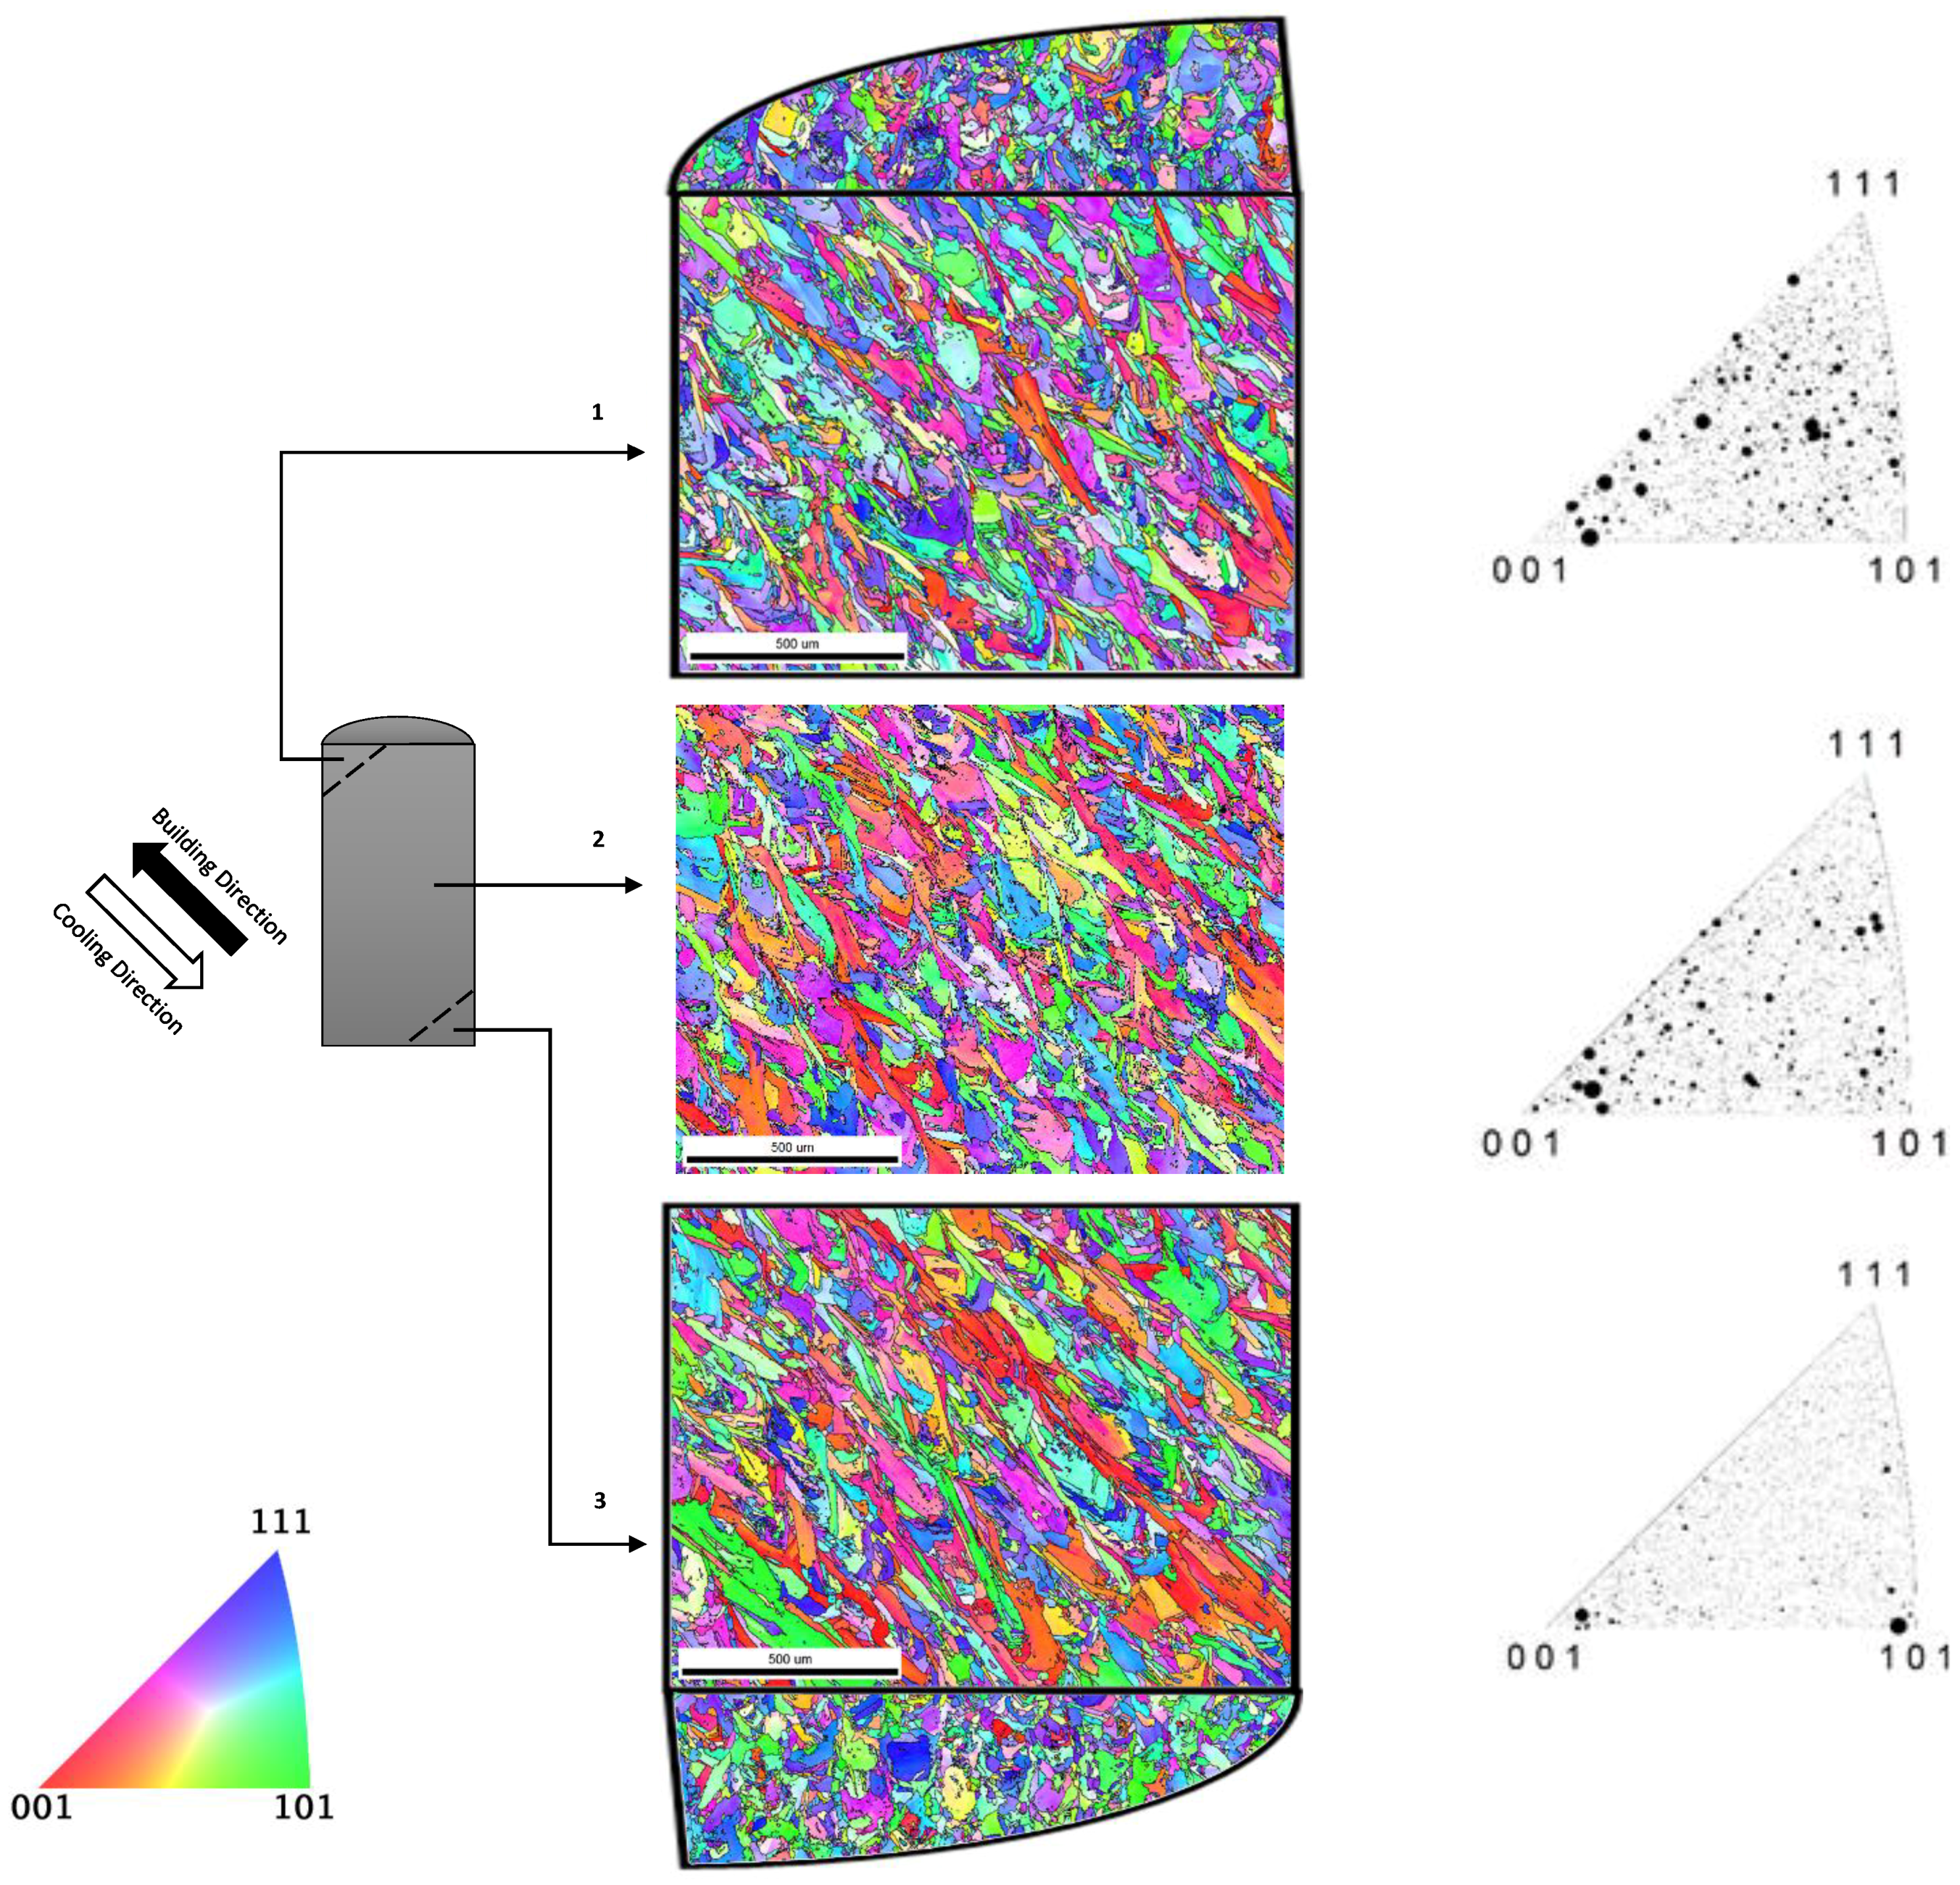
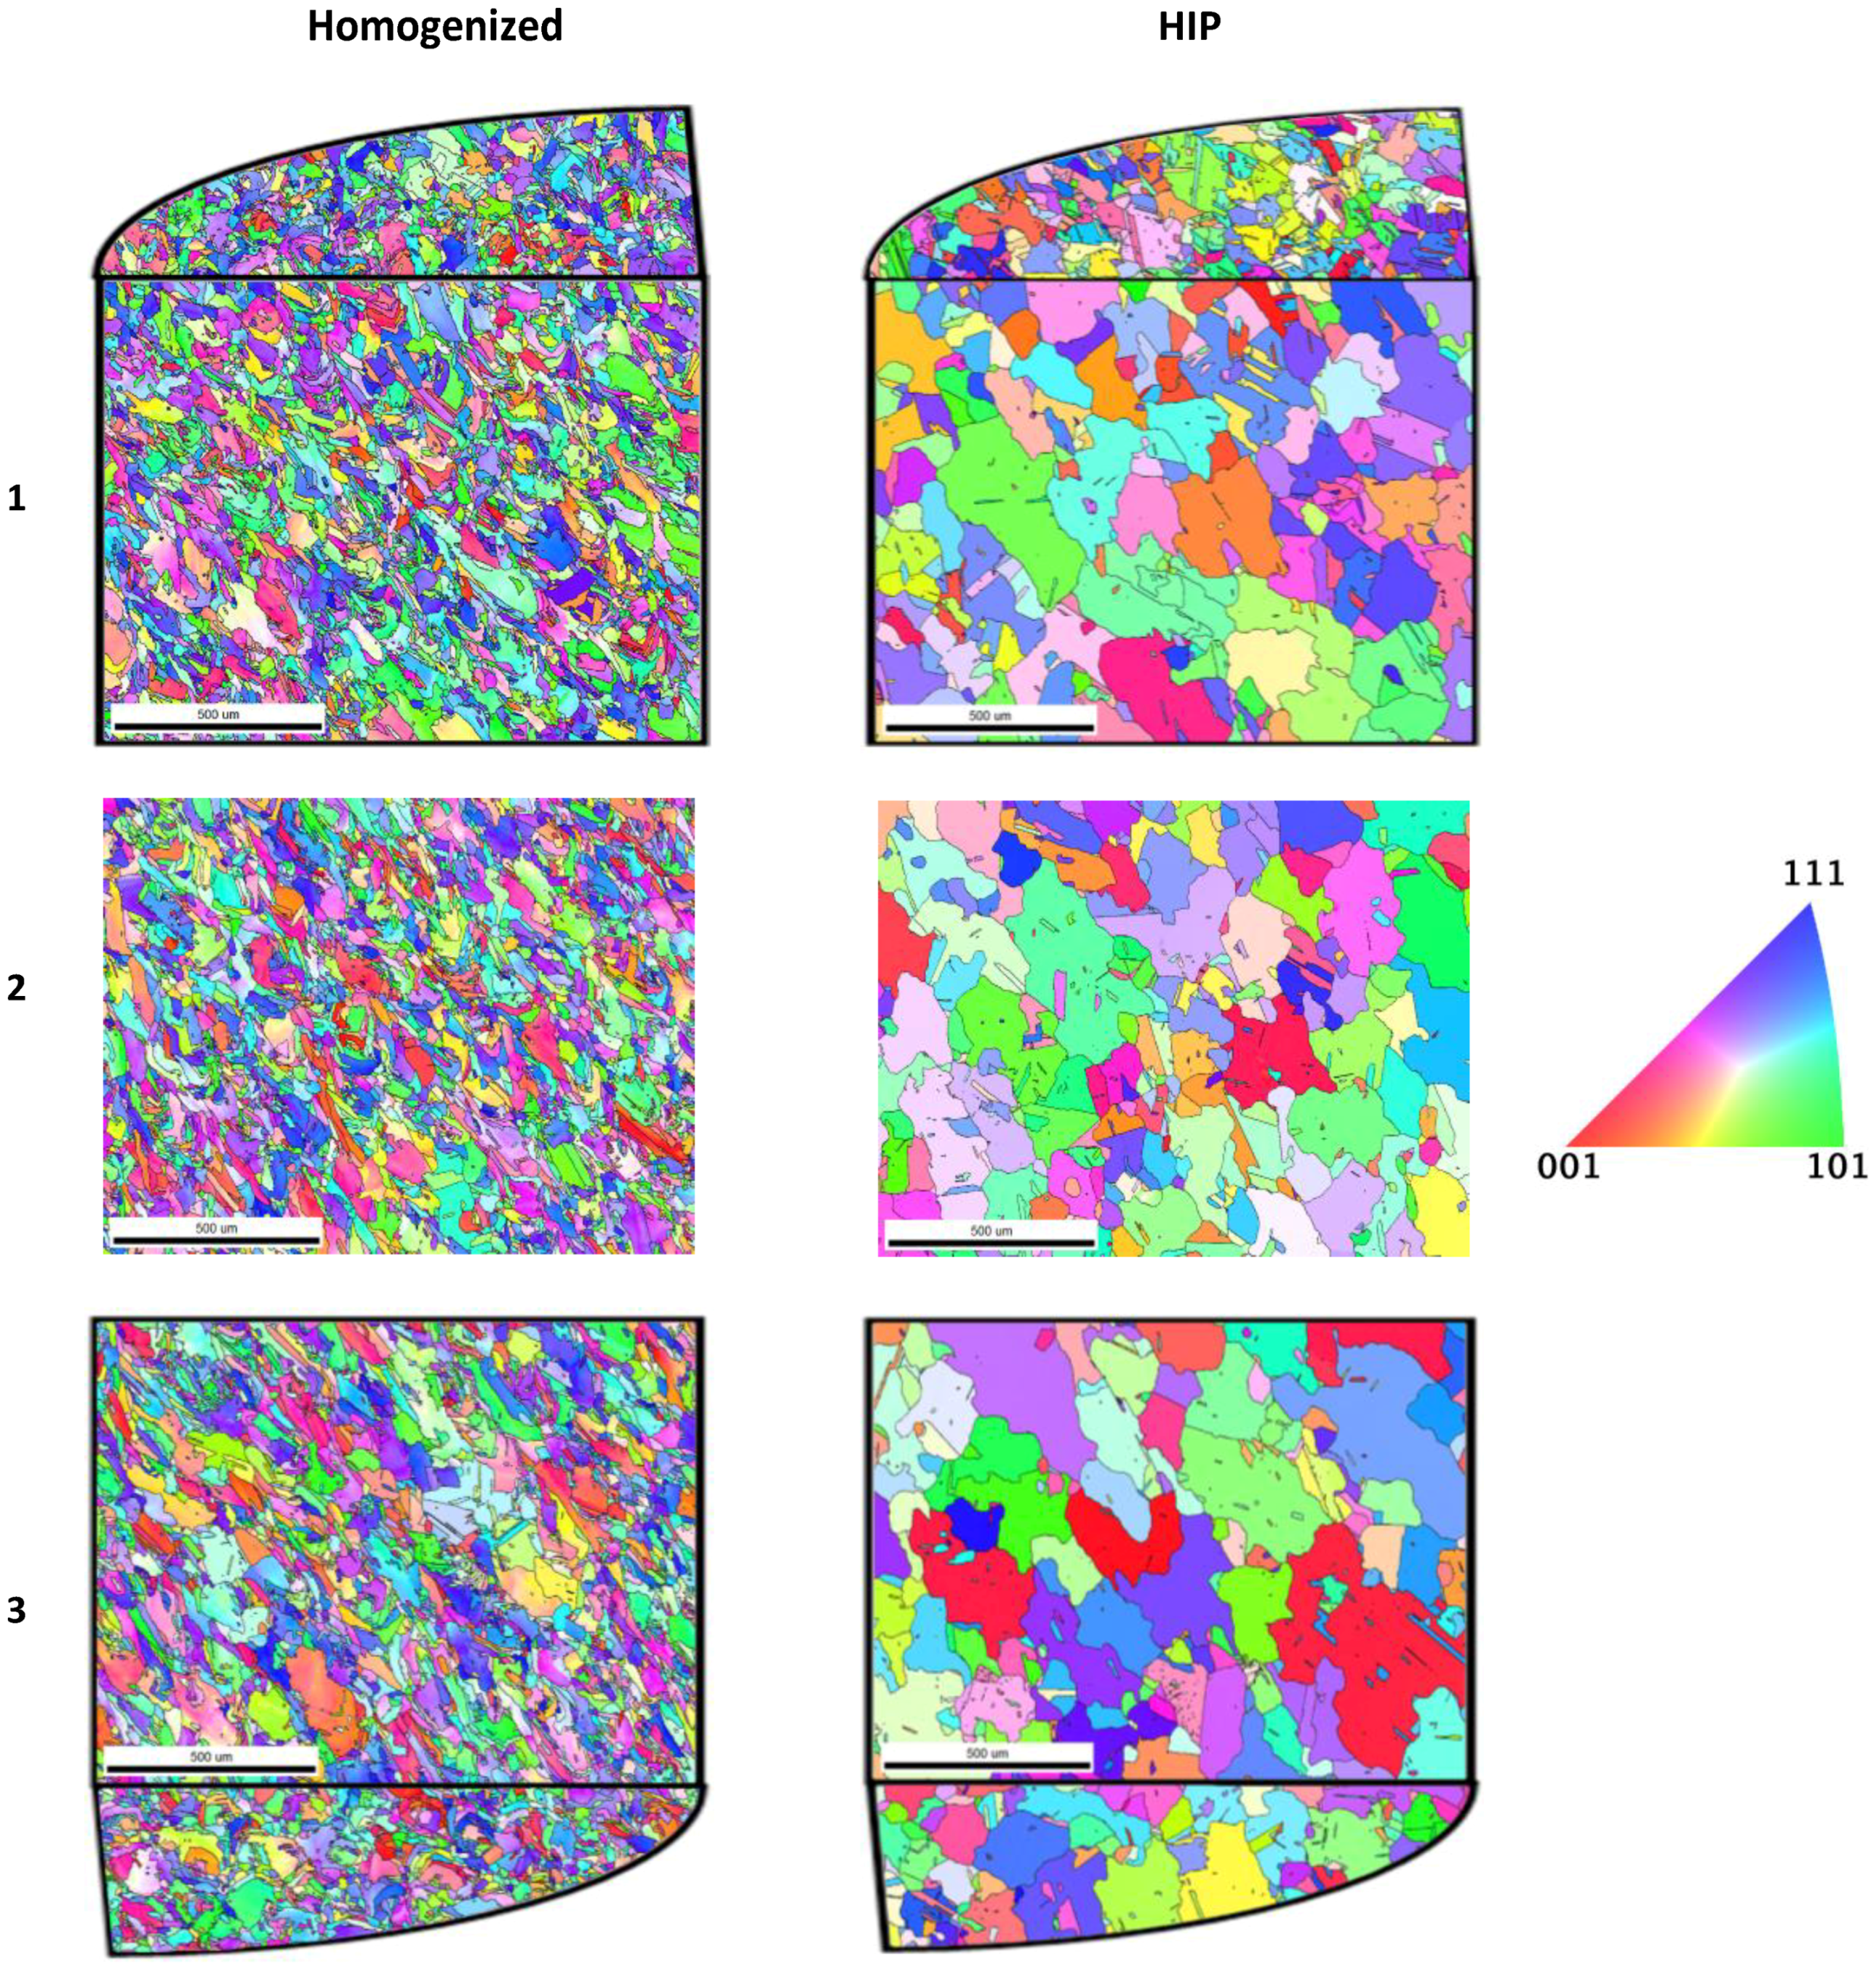
3.3.2. Evolution of Structure and Texture

EBSD mapping was used to determine the evolution in structure and texture of as-printed and heat treated Inconel 718. 1450 µm × 1100 µm maps were taken from both the top and bottom horizontal cross-sections and from the vertical cross-section at the locations illustrated in Figure 3. These maps reveal grain size, grain shape, and crystallographic texture at each of the listed locations. Figure 11 displays EBSD maps of the as-printed specimen.
The evolution of orientation in vertical cross-sections of the as-printed specimen from the mainly (001) and (101) directions at the bottom to a (001) dominant orientation with some (111) and (101) oriented grains at the top, as can be seen in Figure 11. Average grain sizes and morphologies also differ dramatically between the top and bottom, as can be seen in Table 3. Long, thin grains are visible at the bottom of the vertical cross-section. This is quantified by the aspect ratios at the locations 3 (0.253), 2 (0.275), and 1 (0.277) with the bottom having the smallest aspect ratio and the top having the largest. Deviation in grain size and shape is also larger at location 3 in the vertical section, indicating a mixture of large and small columnar and equiaxed grains. Due to the high relative cooling rates at the bottom of the vertical cross-section, grains are stretched towards the cooling direction. Average equivalent grain diameter is larger at the bottom of the vertical section (65 µm) than at the middle (56 µm) which is close to the top (55 µm). Both the bottom and top horizontal cross-sections show that the tops of the columnar grains have a more equiaxed shape with aspect ratios of (0.392) at location 3 and (0.371) at location 1 in Figure 11. The top horizontal section displays larger average grain sizes and a larger aspect ratio in the corresponding vertical section than the bottom due to lower cooling rates.
Figure 12 displays EBSD maps of homogenized and HIP-treated IN718 at the locations indicated in Figure 11. The breakdown of columnar grains and formation of smaller equiaxed grains after heat treatment of SLM as-printed specimens has been termed recrystallization in the literature [11,19]. Recrystallization during homogenization causes average grain sizes to decrease due to the disintegration of columnar structures [13]. Aspect ratios in vertical sections of homogenized specimens have increased, but remnant grains from the printing process are still visible. Location 3 in the vertical cross-section of the homogenized specimen contains larger (54 µm) and more columnar grains (0.333 aspect ratio) with greater deviation in comparison to the other locations. Homogenized horizontal cross-sections are more equiaxed than those of as-printed specimens. Significant grain coarsening occurs during HIP treatment of the homogenized specimens. Grains in the HIPed specimens are also more equiaxed, columnar grains are no longer observable. HIPed specimens have significantly larger grains at the bottom (153 µm) horizontal cross-section compared to the top (70 µm). This can be attributed to the lesser amounts of segregated γ prior to HIP treatment to feed carbide formation, leading to Ostwald ripening of MC-type carbides mentioned in Section 3.1.2. The larger carbide content at the top of the HIPed cylinders has the effect of pinning down moving grain boundaries, contributing to the grain size disparity [12]. HIP-treated specimens contain an equiaxed (0.399–0.419 aspect ratio) grain structure. Location 3 in the vertical cross-sections of homogenized and HIP specimens are observed to retain a more (001) orientation than the other locations.

3.4. Vickers Microhardness Measurements

Popovich et al. [30] reported that SLM IN718 specimens fabricated at lower laser power (250 W) had a higher average hardness of 320 HV compared to 287 HV for those fabricated at higher laser power (900 W) while volumetric energy density was held constant. The observed difference in mechanical properties was attributed to a strong (001) texture and the coarser grains in the specimens fabricated by higher laser power [30]. The average Vickers hardness measurements are displayed in Table 4. As-printed hardness values are lower than those printed at lower laser power and scanning speeds in the literature: 365 HV printed with a 170 W laser and 417 mm/s scanning speed [4], 305 HV printed (horizontally with respect to the building direction) with a 175 W laser and 619 mm/s scanning speed [20], and 319 HV (x-z plane) printed with a 100 W laser and 85.7 mm/s scanning speed [12].
Homogenization resulted in a 19.3% (282.6 HV from 236.9 HV in the vertical cross-section) increase in microhardness. This increase in hardness is due to the dispersion and more even distribution of γ precipitates, reported in the literature [4,11,19], and the partial recrystallization observed and discussed in Section 3.3.2. Recrystallization resulted in the nucleation and growth of smaller and more equiaxed grains, increasing the hardness of the specimen. The formation of new grains also allowed for the possibility of γ and γ formation along grain boundaries [19]. Chlebus et al. [12] reported a microhardness increase of 48% (312 HV to 463 HV) in the as-fabricated Inconel 718 after solution treatment at 1100 °C for 1 h. HIP treatment reduced the microhardness of the homogenized condition by 36.1% (180.5 HV from 282.6 HV in the vertical cross-section). A combination of the coarse grains and γ dissolution caused by HIP resulted in the reduction of hardness.
A comparison between the bottom and top horizontal cross-sections in the as-printed condition reveals a greater hardness value (211.3 HV ± 12.6 compared to 204.9 HV ± 21.0) at the bottom cross-section. Tucho et al. [20] observed a similar increased hardness at the bottom (301 HV compared to 288 HV) of vertically (with respect to the building direction)-printed Inconel 718. They reported that the phenomenon could be caused by the precipitation of small γ and γ particles due to local reheating cycles, though these particles were not observed in the study [20]. This work, similarly, has not detected the precipitation of γ in the as-fabricated specimen, however, γ is observed to disseminate through the matrix in lower layers of the specimen as determined in Section 3.3.1. The increased hardness in this area is likely due to the more even distribution of γ , and the differences in grain size and morphology between the two locations discussed in Section 3.3.2. Longer and thinner columnar grains parallel to the building direction result in greater hardness values at the bottom of the as-printed cylinder compared to the top. Maity et al. [47] reported local differences in the mechanical properties of SLM Al-12Si specimens, observed after micro- and nanoindentation. However, they found that the tensile properties were not significantly affected by these variations [47]. Mechanical properties from bulk specimens of SLM IN718 must be measured in future work in order to determine the effects of the local microstructure on mechanical properties. The homogenized condition also shows a discrepancy (11.2% difference) between the top (260.0 HV) and bottom (289.1 HV) cross-sections. This is due to the thin columnar grains left over by the printing process at the bottom of the homogenized cylinder. The HIPed condition displayed equiaxed grains and has similar (only a 3% difference) hardness values at the top (175.7 HV) and bottom (181.1 HV) horizontal cross-sections.

4. Conclusions

The microstructural evolution of 45° printed (with respect to building direction) selective laser-melted Inconel 718 after homogenization and HIP treatments is reported in this study. Laves phase was determined to exist in the as-printed condition. Increased melt pool interactions in the bottom layers of the SLM caused the dispersal of   γ into the matrix. This dissemination resulted in more segregation of γ in the upper layers of as-printed cylinders compared to the lower layers. Higher cooling rates at the bottom of the as-fabricated cylinder promoted the growth of long thin grains. Columnar grain morphologies were also observed in the other locations of the as-printed cylinders. However, grains located towards the upper layers of the specimen had greater aspect ratios due to lower cooling rates.
Homogenization treatment partially dissolved the interdendritic regions containing the γ and Laves phases, and caused partial recrystallization of the columnar grains. Smaller and more equiaxed grains were observed in the homogenized condition compared to the as-fabricated cylinders. Long and thin columnar grains left over after the printing process still remained in the homogenized condition, particularly at the bottom of the cylinder. Homogenization promoted the nucleation and growth of MC-type carbide and δ phase precipitates, as well as the dissemination of small γ precipitates into the matrix.
A ~175-µm thick ring with higher carbide content was observed around the edges of the HIP condition. Lower carbide content was observed towards the interior of the HIPed cylinders due to slower cooling rates. The relative amount of MC-type carbides increased during HIP treatment. However, Ostwald ripening of carbides also occurred. Excessive grain growth towards the bottom of the cylinder during HIP treatment occurred as a result of Ostwald ripening of (Ti, Nb)C carbides, and a lower relative amount of grain-pinning carbide precipitates in the region.
The texture of all cross-sections in the as-printed condition is characterized by a strong (111) orientation. The (111) orientation remains prominent in the vertical cross-sections throughout both homogenization and HIP treatments. A reduction in the (002) peak was observed after homogenization treatment. The (002) peak grew significantly during HIP treatment and became the dominant orientation.
Vickers microhardness in the vertical cross-section was 236.9 HV for the as-fabricated material, 282.6 HV for the homogenized material, and 180.5 HV for the HIPed material. The bottom cross-section of as-printed and homogenized conditions had greater hardness values than their respective top cross-sections due to increased γ dispersion and differences in grain morphology that occurred as a result of the printing direction.

Author Contributions

M.M., V.B., and M.J. conceived and designed the SLM experiments and the microscopic analysis; R.S. and A.M. performed the experiments; R.S., A.M., and M.M. analyzed the data; V.B. and M.J. provided the 3D printing tools and post-treatments facilities; R.S. wrote the paper; and A.M., V.B., M.J., and M.M. revised the paper.

Acknowledgments

V.B. and M.J. acknowledge the funds received from NSERC Discovery Grants to partially support this work. V.B. acknowledges the funds he received from ÉTS Research Chair for Additive Manufacturing Process Engineering, Materials and Structures. M.M. acknowledges the funds received from the Masdar Institute to carry out this research.

Conflicts of Interest

The authors declare no conflict of interest.

References

  1. Wang, X.; Gong, X.; Chou, K. Review on Powder-Bed Laser Additive Manufacturing of Inconel 718 Parts. Proc. Inst. Mech. Eng. Part B J. Eng. Manuf. 2017, 231. [Google Scholar] [CrossRef]
  2. Jia, Q.; Gu, D. Selective laser melting additive manufacturing of Inconel 718 superalloy parts: Densification, microstructure and properties. J. Alloy. Compd. 2014, 585, 713–721. [Google Scholar] [CrossRef]
  3. Qi, H.; Azer, M.; Ritter, A. Studies of standard heat treatment effects on microstructure and mechanical properties of laser net shape manufactured INCONEL 718. Metall. Mater. Trans. A Phys. Metall. Mater. Sci. 2009, 40, 2410–2422. [Google Scholar] [CrossRef]
  4. Wang, Z.; Guan, K.; Gao, M.; Li, X.; Chen, X.; Zeng, X. The microstructure and mechanical properties of deposited-IN718 by selective laser melting. J. Alloy. Compd. 2012, 513, 518–523. [Google Scholar] [CrossRef]
  5. Debarbadillo, J.J.; Mannan, S.K. Alloy 718 for oilfield applications. JOM 2012, 64, 265–270. [Google Scholar] [CrossRef]
  6. Izquierdo, B.; Plaza, S.; Sánchez, J.A.; Pombo, I.; Ortega, N. Numerical prediction of heat affected layer in the EDM of aeronautical alloys. Appl. Surf. Sci. 2012, 259, 780–790. [Google Scholar] [CrossRef]
  7. Yap, C.Y.; Chua, C.K.; Dong, Z.L.; Liu, Z.H.; Zhang, D.Q.; Loh, L.E.; Sing, S.L. Review of selective laser melting: Materials and applications. Appl. Phys. Rev. 2015, 2. [Google Scholar] [CrossRef]
  8. Hague, R.; Campbell, I.; Dickens, P. Implications on design of rapid manufacturing. Proc. Inst. Mech. Eng. Part C J. Mech. Eng. Sci. 2003, 217, 25–30. [Google Scholar] [CrossRef] [Green Version]
  9. Campbell, R.I.; Hague, R.J.; Sener, B.; Wormald, P.W. The Potential for the Bespoke Industrial Designer. Des. J. 2003, 6, 24–34. [Google Scholar] [CrossRef]
  10. Choi, J.P.; Shin, G.H.; Yang, S.; Yang, D.Y.; Lee, J.S.; Brochu, M.; Yu, J.H. Densification and microstructural investigation of Inconel 718 parts fabricated by selective laser melting. Powder Technol. 2017, 310, 60–66. [Google Scholar] [CrossRef]
  11. Amato, K.N.; Gaytan, S.M.; Murr, L.E.; Martinez, E.; Shindo, P.W.; Hernandez, J.; Collins, S.; Medina, F. Microstructures and mechanical behavior of Inconel 718 fabricated by selective laser melting. Acta Mater. 2012, 60, 2229–2239. [Google Scholar] [CrossRef]
  12. Chlebus, E.; Gruber, K.; Kuźnicka, B.; Kurzac, J.; Kurzynowski, T. Effect of heat treatment on the microstructure and mechanical properties of Inconel 718 processed by selective laser melting. Mater. Sci. Eng. A 2015, 639, 647–655. [Google Scholar] [CrossRef]
  13. Mostafa, A.; Rubio, I.P.; Brailovski, V.; Jahazi, M.; Medraj, M. Structure, texture and phases in 3D printed IN718 alloy subjected to homogenization and HIP treatments. Metals 2017, 7, 196. [Google Scholar] [CrossRef]
  14. Thijs, L.; Sistiaga, M.L.M.; Wauthle, R.; Xie, Q.; Kruth, J.P.; van Humbeeck, J. Strong morphological and crystallographic texture and resulting yield strength anisotropy in selective laser melted tantalum. Acta Mater. 2013, 61, 4657–4668. [Google Scholar] [CrossRef]
  15. Segersäll, M.; Moverare, J.J. Crystallographic orientation influence on the serrated yielding behavior of a single-crystal superalloy. Materials 2013, 6, 437–444. [Google Scholar] [CrossRef] [PubMed]
  16. Segersäll, M.; Moverare, J.J.; Simonsson, K.; Johansson, S. Deformation and damage mechanisms during thermomechanical fatigue of a single-crystal superalloy in the and directions. Superalloys 2012, 215–223. [Google Scholar] [CrossRef]
  17. Popovich, V.A.; Borisov, E.V.; Heurtebise, V.; Riemslag, T.; Popovich, A.A.; Sufiiarov, V.S. Creep and Thermomechanical Fatigue of Functionally Graded Inconel 718 Produced by Additive Manufacturing. In TMS 2018 147th Annual Meeting & Exhibition Supplemental Proceedings; Springer: Berlin/Heidelberg, Germany, 2018; pp. 85–97. [Google Scholar]
  18. Parimi, L.L.; Ravi, G.; Clark, D.; Attallah, M.M. Microstructural and texture development in direct laser fabricated IN718. Mater. Charact. 2014, 89, 102–111. [Google Scholar] [CrossRef]
  19. Zhang, D.; Niu, W.; Cao, X.; Liu, Z. Effect of standard heat treatment on the microstructure and mechanical properties of selective laser melting manufactured Inconel 718 superalloy. Mater. Sci. Eng. A 2015, 644, 32–40. [Google Scholar] [CrossRef]
  20. Tucho, W.M.; Cuvillier, P.; Sjolyst-Kverneland, A.; Hansen, V. Microstructure and hardness studies of Inconel 718 manufactured by selective laser melting before and after solution heat treatment. Mater. Sci. Eng. A 2017, 689, 220–232. [Google Scholar] [CrossRef]
  21. EOS Gmbh Electro Optical Systems. EOS Nickelalloy Inconel 718 Datasheet; EOS Gmbh: Krailling, Germany, 2014. [Google Scholar]
  22. Smith, D.H.; Bicknell, J.; Jorgensen, L.; Patterson, B.M.; Cordes, N.L.; Tsukrov, I.; Knezevic, M. Microstructure and mechanical behavior of direct metal laser sintered Inconel alloy 718. Mater. Charact. 2016, 113, 1–9. [Google Scholar] [CrossRef]
  23. Rasband, W.S. ImageJ; U. S. National Institutes of Health: Bethesda, MD, USA, 2012. Available online: https://imagej.nih.gov/ij/ (accessed on 16 May 2018).
  24. Degen, T.; Sadki, M.; Bron, E.; König, U.; Nénert, G. The HighScore suite. Powder Diffr. 2014, 29, S13–S18. [Google Scholar] [CrossRef]
  25. Pierre, V. Pearson’s Crystal Data, Crystal Structure Database for Inorganic Compounds (on CD-ROM); ASM International: Materials Park, OH, USA, 2010. [Google Scholar]
  26. Campanelli, S.L.; Casalino, G.; Contuzzi, N.; Ludovico, A.D. Taguchi optimization of the surface finish obtained by laser ablation on selective laser molten steel parts. Procedia CIRP 2013, 12, 462–467. [Google Scholar] [CrossRef]
  27. Kasperovich, G.; Haubrich, J.; Gussone, J.; Requena, G. Correlation between porosity and processing parameters in TiAl6V4 produced by selective laser melting. Mater. Des. 2016, 105, 160–170. [Google Scholar] [CrossRef]
  28. Ali, H.; Ma, L.; Ghadbeigi, H.; Mumtaz, K. In-situ residual stress reduction, martensitic decomposition and mechanical properties enhancement through high temperature powder bed pre-heating of Selective Laser Melted Ti6Al4V. Mater. Sci. Eng. A 2017, 695, 211–220. [Google Scholar] [CrossRef]
  29. Agius, D.; Kourousis, K.; Wallbrink, C. A Review of the As-Built SLM Ti-6Al-4V Mechanical Properties towards Achieving Fatigue Resistant Designs. Metals 2018, 8, 75. [Google Scholar] [CrossRef]
  30. Popovich, V.A.; Borisov, E.V.; Popovich, A.A.; Sufiiarov, V.S.; Masaylo, D.V.; Alzina, L. Functionally graded Inconel 718 processed by additive manufacturing: Crystallographic texture, anisotropy of microstructure and mechanical properties. Mater. Des. 2017, 114, 441–449. [Google Scholar] [CrossRef]
  31. Zheng, L.; Liu, Y.; Sun, S.; Zhang, H. Selective laser melting of Al-8.5Fe-1.3V-1.7Si alloy: Investigation on the resultant microstructure and hardness. Chin. J. Aeronaut. 2015, 28, 564–569. [Google Scholar] [CrossRef]
  32. Zhou, X.; Li, K.; Zhang, D.; Liu, X.; Ma, J.; Liu, W.; Shen, Z. Textures formed in a CoCrMo alloy by selective laser melting. J. Alloy. Compd. 2015, 631, 153–164. [Google Scholar] [CrossRef]
  33. Liu, L.; Zhai, C.; Lu, C.; Ding, W.; Hirose, A.; Kobayashi, K.F. Study of the effect of Delta phase on hydrogen embrittlement of Inconel 718 by notch tensile tests. Corros. Sci. 2005, 47, 355–367. [Google Scholar] [CrossRef]
  34. Koul, A.K.; Au, P.; Bellinger, N.; Thamburaj, R.; Wallace, W.; Immarigeon, J.P. Development of a Damage Tolerant Microstructure for Inconel 718 Turbine Disc Material. Superalloys 1988, 3–10. [Google Scholar] [CrossRef]
  35. Rao, G.A.; Kumar, M.; Srinivas, M.; Sarma, D.S. Effect of solution treatment temperature on microstructure and mechanical properties of hot isostatically pressed superalloy Inconel 718. Mater. Sci. Technol. 2004, 20, 1161–1170. [Google Scholar] [CrossRef]
  36. Mitchell, A.; Schmalz, A.J.; Schvezov, C.; Cockcroft, S.L. The Precipitation of Primary Carbides in Alloy 718. Superalloys 1994, 65–78. [Google Scholar] [CrossRef]
  37. Kuo, Y.-L.; Kakehi, K. Influence of Powder Surface Contamination in the Ni-Based Superalloy Alloy718 Fabricated by Selective Laser Melting and Hot Isostatic Pressing. Metals 2017, 7, 367. [Google Scholar] [CrossRef]
  38. Murr, L.E.; Martinez, E.; Gaytan, S.M.; Ramirez, D.A.; MacHado, B.I.; Shindo, P.W.; Martinez, J.L.; Medina, F.; Wooten, J.; Ciscel, D.; et al. Microstructural architecture, microstructures, and mechanical properties for a nickel-base superalloy fabricated by electron beam melting. Metall. Mater. Trans. A Phys. Metall. Mater. Sci. 2011, 42, 3491–3508. [Google Scholar] [CrossRef]
  39. Murr, L.E.; Martinez, E.; Amato, K.N.; Gaytan, S.M.; Hernandez, J.; Ramirez, D.A.; Shindo, P.W.; Medina, F.; Wicker, R.B. Fabrication of metal and alloy components by additive manufacturing: Examples of 3D materials science. J. Mater. Res. Technol. 2012, 1, 42–54. [Google Scholar] [CrossRef]
  40. Donachie, M.J.; Donachie, S.J. Superalloys: A Technical Guide, 2nd ed.; ASM International: Geauga County, OH, USA, 2002. [Google Scholar]
  41. Muralidharan, B.G.; Shankar, V. Weldability of Inconel 718—A Review; Indira Gandhi Centre for Atomic Research: Tamil Nadu, India, 1996; pp. 1–30. [Google Scholar]
  42. Manikandan, S.G.K.; Sivakumar, D.; Rao, K.P.; Kamaraj, M. Laves phase in alloy 718 fusion zone—Microscopic and calorimetric studies. Mater. Charact. 2015, 100, 192–206. [Google Scholar] [CrossRef]
  43. Azadian, S.; Wei, L.Y.; Warren, R. Delta phase precipitation in inconel 718. Mater. Charact. 2004, 53, 7–16. [Google Scholar] [CrossRef]
  44. Idell, Y.; Levine, L.E.; Allen, A.J.; Zhang, F.; Campbell, C.E.; Olson, G.B.; Gong, J.; Snyder, D.R.; Deutchman, H.Z. Unexpected δ-phase formation in additive-manufactured Ni-based superalloy. JOM 2016, 68, 950–959. [Google Scholar] [CrossRef]
  45. Jouiad, M.; Marin, E.; Devarapalli, R.S.; Cormier, J.; Ravaux, F.; le Gall, C.; Franchet, J.M. Microstructure and mechanical properties evolutions of alloy 718 during isothermal and thermal cycling over-aging. Mater. Des. 2016, 102, 284–296. [Google Scholar] [CrossRef]
  46. Sjoberg, G.; Ingesten, N.G.; Carlson, R.G. Grain Boundary δ-phase Morphologies. Carbides and Notch Rupture Sensitivity of Cast Alloy 718. Superalloys 1991. [Google Scholar] [CrossRef]
  47. Maity, T.; Chawake, N.; Kim, J.T.; Eckert, J.; Prashanth, K.G. Anisotropy in local microstructure—Does it affect the tensile properties of the SLM samples? Manuf. Lett. 2018, 15, 33–37. [Google Scholar] [CrossRef]
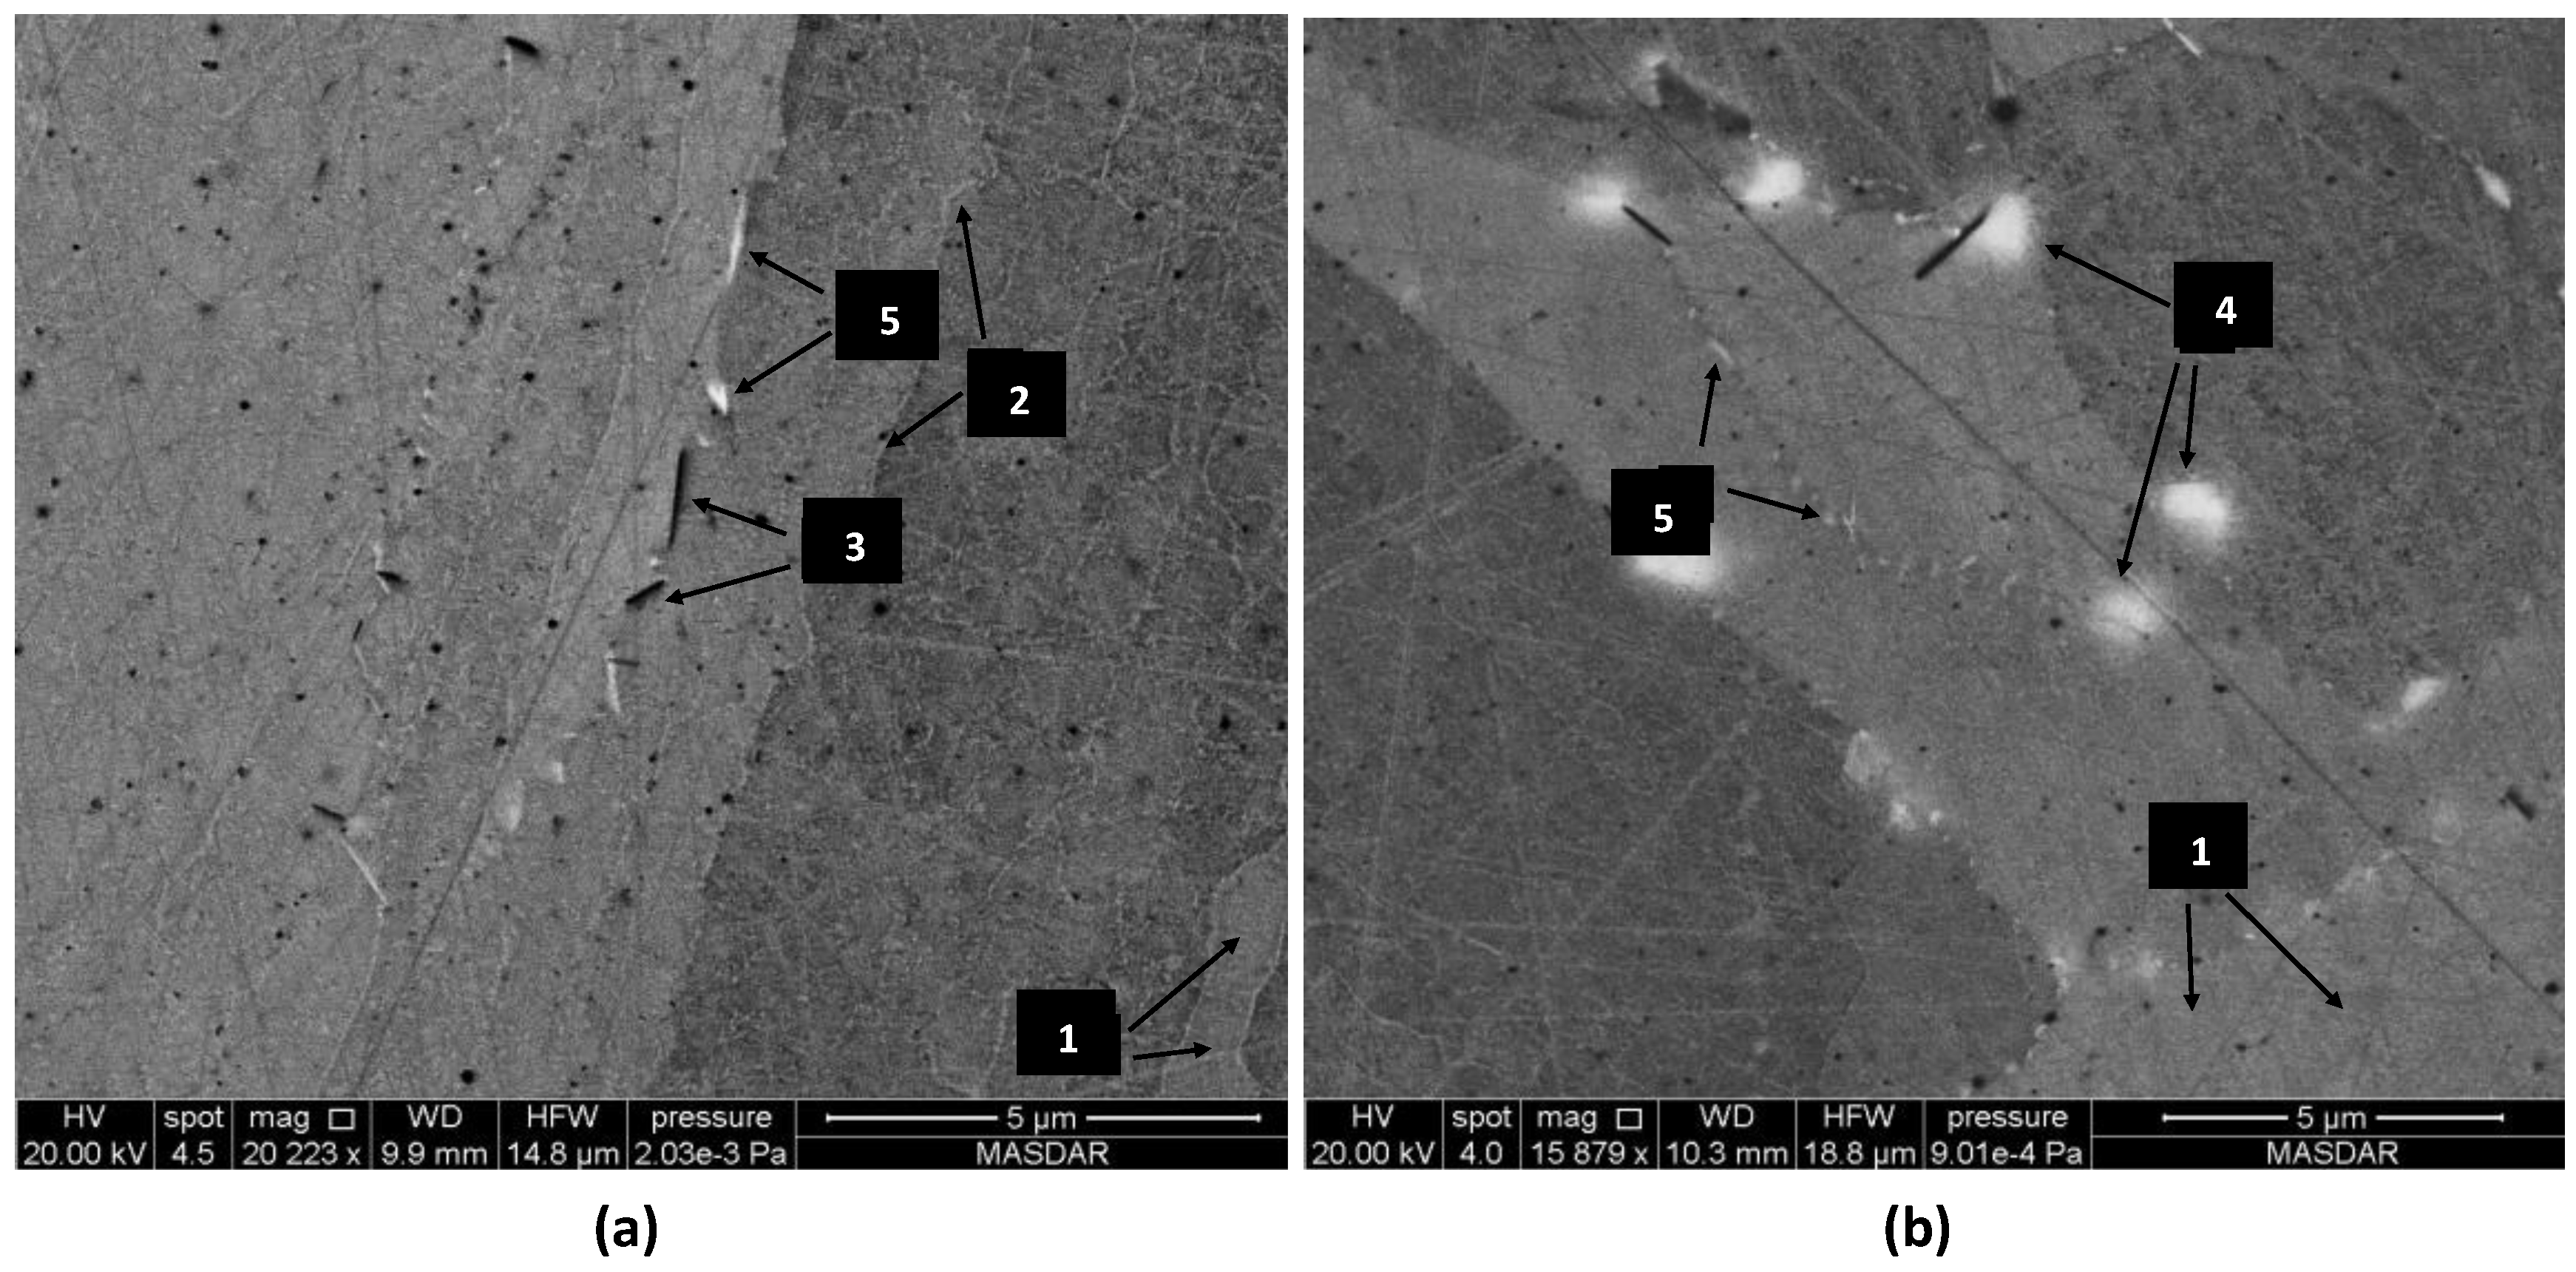
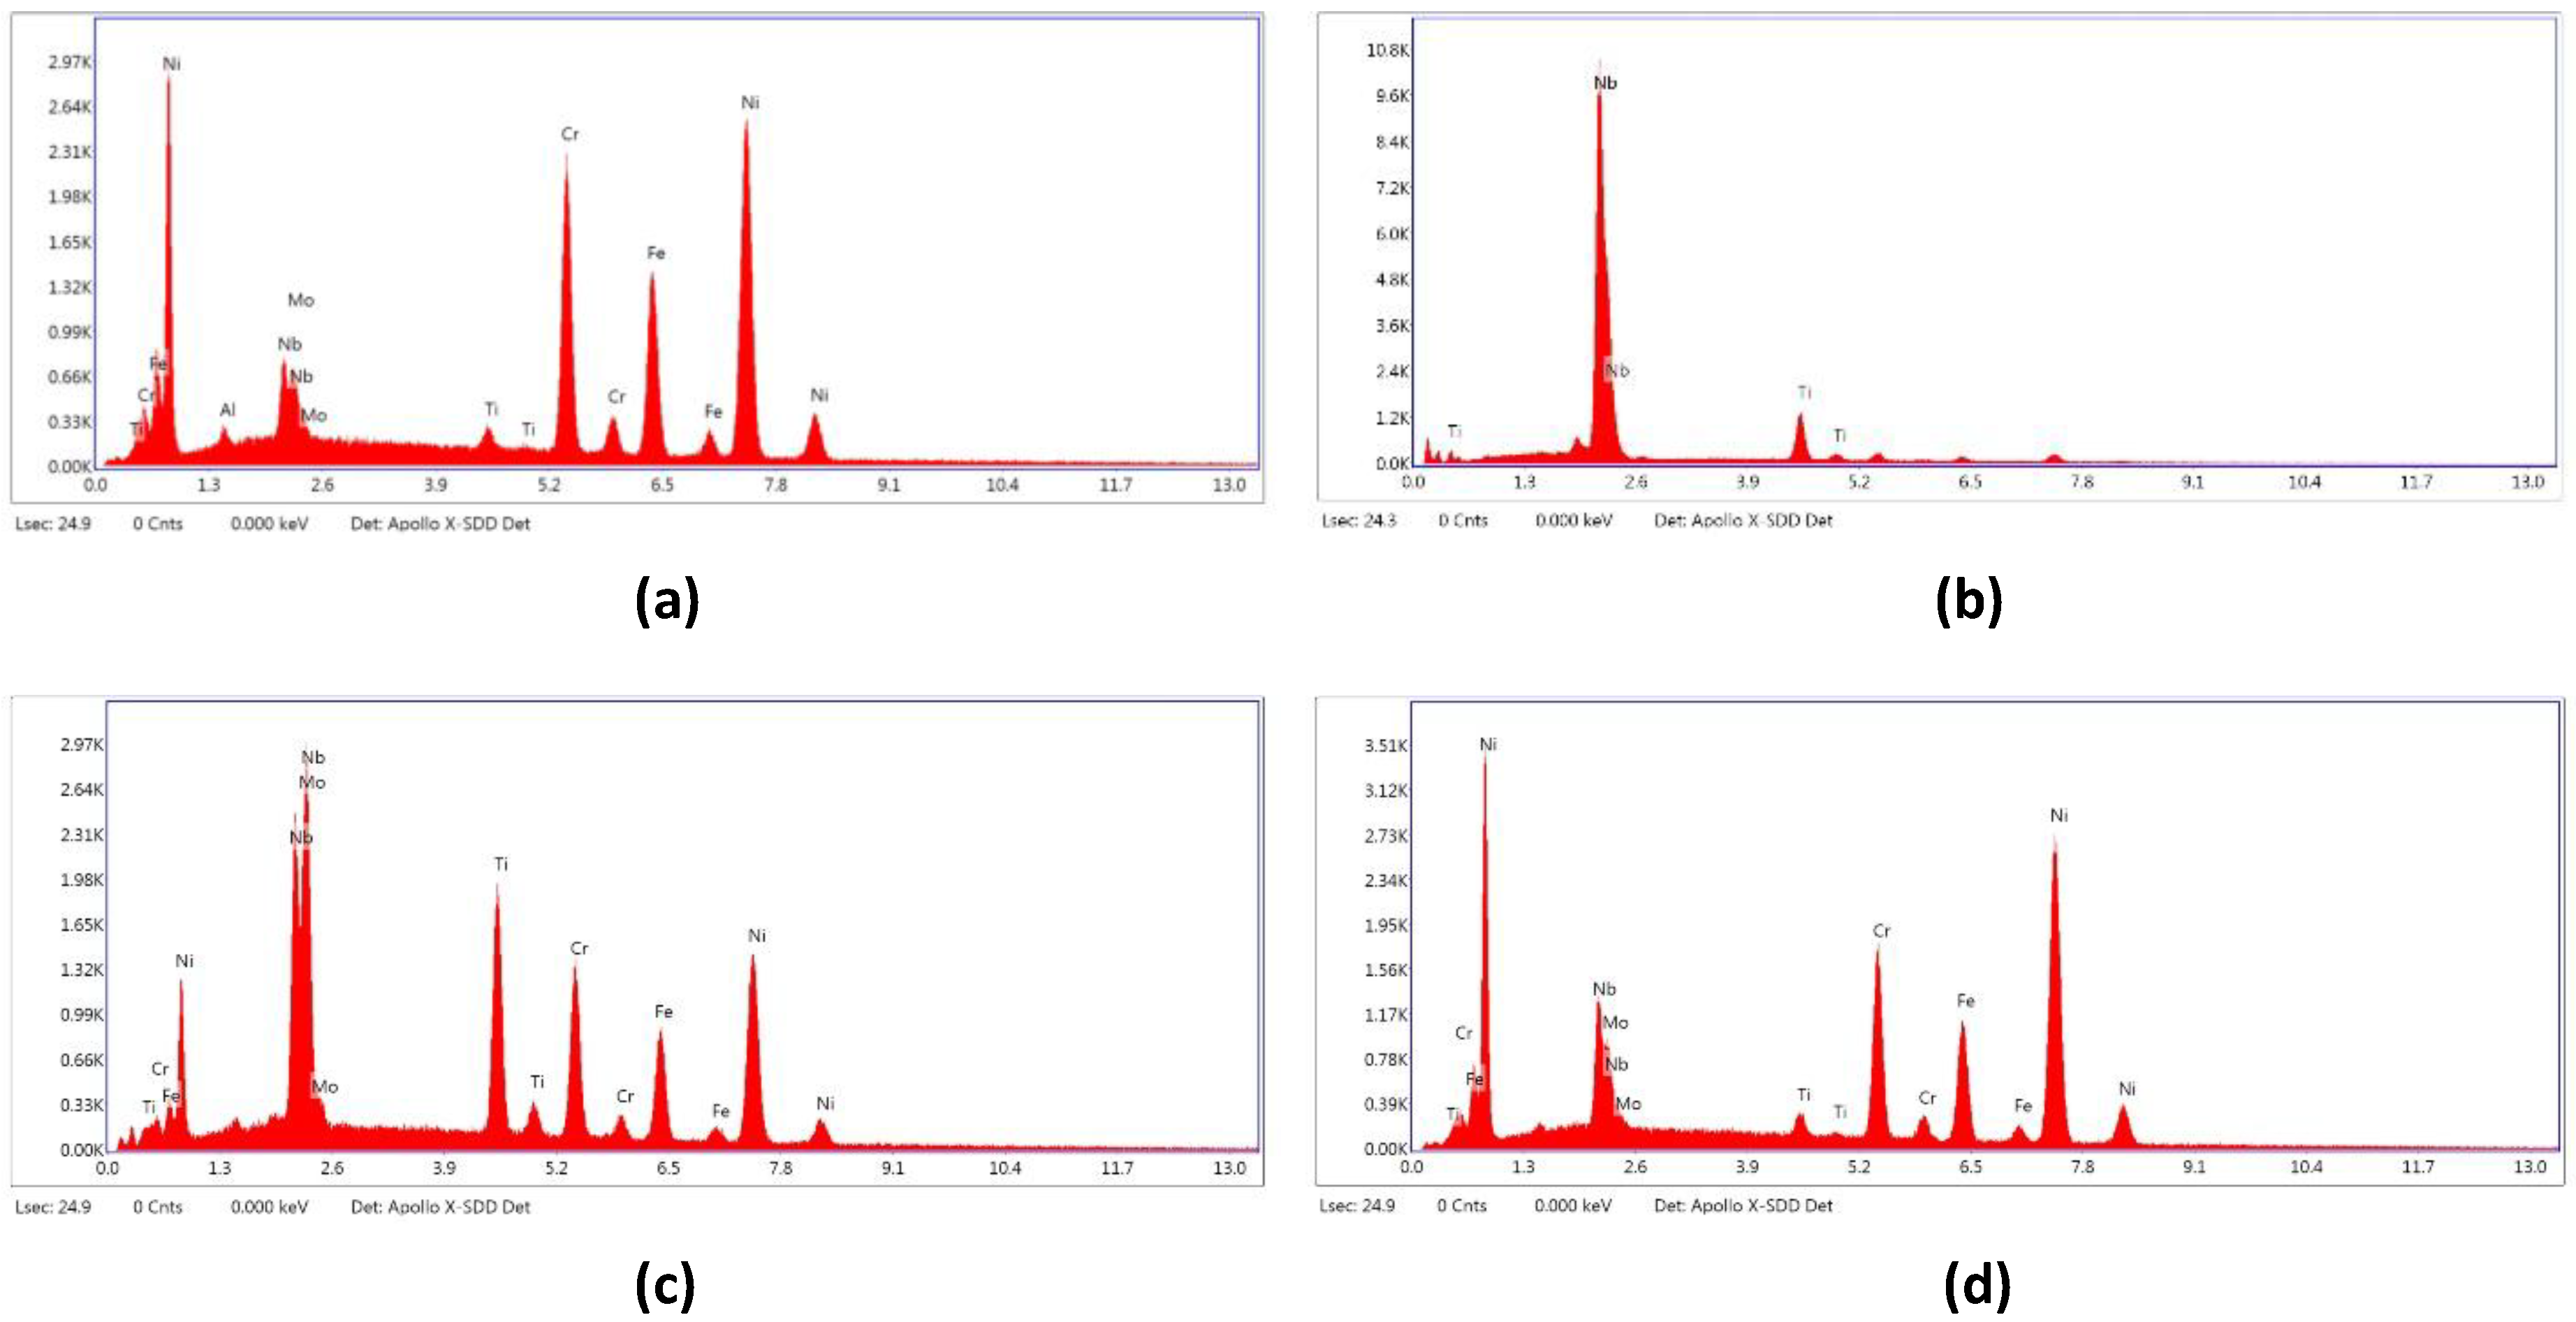
Figure 1. (a) Illustration of the cylindrical specimen manufactured in the 45° direction with respect to the building direction; (b) Schematic illustration of the scanning strategy [13].
Jmmp 02 00030 g001
Figure 2. Illustration of horizontal and vertical cross-sections with respect to the 45° printed cylinder axes.
Jmmp 02 00030 g002
Figure 3. (a) Illustration of the 45° printed cylinder displaying three locations separated by dotted lines. (b) Melt pool morphology in locations 1, 2, and 3 taken from the vertical cross-section of the cylinder.
Jmmp 02 00030 g003
Figure 4. Etched and non-etched SEM images of melt pool boundaries and inter-dendritic structures in the vertical cross-section of the as-printed specimen at the locations indicated in Figure 3.
Jmmp 02 00030 g004
Figure 5. (a) Non-etched SEM image of melt pool boundaries and inter-dendritic structures of the as-printed specimen. Yellow dotted lines outline the melt pools in the image. (b) Illustration of melt pool distortion due to the 45° tilt (with respect to building direction) of the horizontal cross-section.
Jmmp 02 00030 g005
Figure 6. SEM images of homogenized SLM Inconel 718 showing phases   γ ,   γ , δ, MC-carbide, and Laves phases labeled 1–5, respectively. Images (a,b) were both taken from the bottom horizontal cross-section.
Jmmp 02 00030 g006
Figure 7. (a) SEM image of the γ matrix, MC-carbide precipitate, and δ precipitate phases in the HIP specimen labeled 1, 2, and 3, respectively; (b) SEM image of dense regions of carbide phases along the edge (located at the top of the image) of the horizontal cross-section of the HIP specimen and their rapid dispersal away from the edges; (c) SEM image of dense regions of carbide phases along the edge (located at the right side of the image) of the vertical cross-section of the HIP specimen and their rapid dispersal away from the edges; (d) High-magnification SEM image showing the disappearance of the Laves phase and   γ .
Jmmp 02 00030 g007
Figure 8. Carbide area percentage by region observed in both top and bottom horizontal cross-sections and the vertical cross-section of the HIPed specimen.
Jmmp 02 00030 g008
Figure 9. EDS spectra for the (a)   γ , (b) MC-type carbide, (c) δ, and (d) Laves phases.
Jmmp 02 00030 g009
Figure 10. XRD spectra of the (a) top horizontal cross-section, (b) bottom horizontal cross-section, and (c) vertical cross-section of the as-printed, homogenized, and HIP-treated specimens.
Jmmp 02 00030 g010
Figure 11. EBSD inverse pole maps at the (1) top, (2) middle, and (3) bottom of the as-printed specimen. Inverse pole figures to the right of the maps represent the vertical cross-sections.
Jmmp 02 00030 g011
Figure 12. EBSD maps at the (1) top, (2) middle, and (3) bottom locations (illustrated in Figure 11) of the homogenized and HIP-treated specimens.
Jmmp 02 00030 g012
Table 1. EDS spot analysis (in at %) of phases 1–5 illustrated in Figure 6.
Reference #’s (Figure 6)PhaseNbMoTiCrFeNi
1γ-phase4.562.61.0819.7718.3352.99
2γ″-phaseBelow detection limits
3δ-phase11.229.4118.1516.4112.9931.82
4MC-type carbide76.22-23.78---
5Laves6.051.541.818.2915.1257.21
EDS Error (%)6.59.18.63.84.52.8
Table 2. Volume % of phases obtained by Rietveld analysis on XRD spectra from the top and bottom horizontal cross-sections of as-printed, homogenized, and HIPed specimens.
PhasesAs-PrintedHomogenizedHIP
TopBottomTopBottomTopBottom
γ (CrNi)96.3%97.7%100%100%99.8%99.9%
γ″ (Ni3Nb)3.7%2.3%0.0%0.0%0.0%0.0%
(Ti, Nb)C----0.2%0.1%
Table 3. Average grain shape and diameter obtained from EBSD maps calculated by EDAX’s OIM EBSD analysis software. Horizontal cross-section data was averaged from three locations on each section.
Horizontal Cross-SectionVertical Cross-Section
(3) Bottom(1) Top(3) Bottom(2) Middle(1) Top
As-printed
Diameter (µm):39.441.565.256.155.2
Standard Deviation:2.42.554.836.136.7
Grain Aspect Ratio:0.3920.3710.2530.2750.277
Standard Deviation:0.1150.1210.1320.1240.121
Homogenized
Diameter (µm):38.540.454.243.744.7
Standard Deviation:2.22.536.425.728.0
Grain Aspect Ratio:0.3970.4090.3330.3390.348
Standard Deviation:0.1220.1180.1280.1230.127
HIP
Diameter (µm):153.569.9200.7154.8153.2
Standard Deviation:14.34.9111.074.177.1
Grain Aspect Ratio:0.4360.4040.4190.3990.415
Standard Deviation:0.1090.1190.1020.1130.105
Table 4. Average values of Vickers hardness of the as-printed and heat treated Inconel 718.
Horizontal Cross-SectionVertical Cross-Section
BottomTop
As-printed
Hardness (HV):211.3 ± 12.6204.9 ± 21.0236.9 ± 11.2
Homogenized
Hardness (HV):289.1 ± 15.9260.0 ± 41.4282.6 ± 16.6
HIP
Hardness (HV):181.1 ± 13.8175.7 ± 5.2180.5 ± 7.0

