

Multi-Target Optimization Strategy for Unmanned Aerial Vehicle Formation in Forest Fire Monitoring Based on Deep Q-Network Algorithm

1
School of Mechanical Engineering, Shandong University of Technology, No. 266 West Xincun Road, Zibo 255049, China
2
School of Mechanical and Aerospace Engineering, Gyeongsang National University, 501 Jinju-daero, Jinju-si 52828, Republic of Korea
3
School of Transportation and Vehicle Engineering, Shandong University of Technology, No. 266 West Xincun Road, Zibo 255000, China
*
Author to whom correspondence should be addressed.
†
These authors contributed equally to this work.
Drones 2024, 8(5), 201; https://doi.org/10.3390/drones8050201
Submission received: 24 March 2024
/
Revised: 10 May 2024
/
Accepted: 14 May 2024
/
Published: 15 May 2024
(This article belongs to the Topic Application of Remote Sensing in Forest Fire)
Abstract
:Forest fires often pose serious hazards, and the timely monitoring and extinguishing of residual forest fires using unmanned aerial vehicles (UAVs) can prevent re-ignition and mitigate the damage caused. Due to the urgency of forest fires, drones need to respond quickly during firefighting operations, while traditional drone formation deployment requires a significant amount of time. This paper proposes a pure azimuth passive positioning strategy for circular UAV formations and utilizes the Deep Q-Network (DQN) algorithm to effectively adjust the formation within a short timeframe. Initially, a passive positioning model for UAVs based on the relationships between the sides and angles of a triangle is established, with the closest point to the ideal position being selected as the position for the UAV to be located. Subsequently, a multi-target optimization model is developed, considering 10 UAVs as an example, with the objective of minimizing the number of adjustments while minimizing the deviation between the ideal and adjusted UAV positions. The DQN algorithm is employed to solve and design experiments for validation, demonstrating that the deviation between the UAV positions and the ideal positions, as well as the number of adjustments, are within acceptable ranges. In comparison to genetic algorithms, it saves approximately 120 s.
1. Introduction
Forest fires are natural disasters that pose serious hazards [1,2,3], characterized by rapid spread, difficult control, and strong destructive power. Once a forest fire occurs, it can cause damage to the ecological environment [4], reduce biodiversity [5,6], and cause economic losses and casualties [7].
Currently, widely used methods for monitoring residual fires in forests mainly include ground patrols, lookout tower surveillance, aerial patrols, and satellite remote sensing [8,9,10]. Reliance on human-powered ground patrols and lookout tower surveillance methods not only incurs high personnel and equipment costs but is also heavily influenced by terrain. Additionally, there are significant limitations in monitoring processes due to visual blind spots. Aerial patrol methods involve using aircraft to patrol forests. However, these patrols are constrained by flight routes and timing. Moreover, the fixed cost of aircraft patrol is USD 300 per hour, making it expensive and impractical for large-scale use [11]. Satellite remote sensing utilizes satellites to monitor forest fires. However, limitations in operational cycles and the resolution of digital data prevent real-time monitoring. Compared to the aforementioned forest fire monitoring methods, small unmanned aerial vehicles (UAVs) have the advantages of longer flight times, higher speeds, and lower costs [12,13]. They offer high real-time monitoring capabilities and are not constrained by terrain during patrols, with wide-ranging visibility.
Compared to the aforementioned methods for forest fire monitoring, small UAVs have the advantages of longer flight times, higher speeds, and lower costs [14]. They offer high real-time monitoring capabilities and are not constrained by terrain during patrols, with wide-ranging visibility [15]. In comparison to traditional aerial forest patrols, UAVs are mainly suitable for low-altitude patrols in small areas. In mountainous canyon forest areas, significant variations in microclimates, vegetation, and fire risk levels exist across different regions [16]. Fire behavior can change unpredictably over time and space. When a fire occurs, UAVs can be utilized to monitor fire behavior in real-time, providing reference and basis for fire prevention, thereby making firefighting more purposeful and targeted. In areas with steep cliffs and other complex terrains that firefighting personnel have difficulty accessing, UAVs can be used due to their high hover accuracy [17]. They can be equipped with suitable firefighting projectiles to extinguish fires. Currently, residual fire clearance primarily relies on firefighting personnel or patrols by the public. However, with this approach, residual fires can only be discovered when they have spread to a certain extent or produce visible flames [18]. Often, by the time flames are spotted, a forest fire has already reignited. By using UAVs equipped with infrared monitoring or sensor systems, fires can be monitored from the air based on their characteristics. Analyzing temperature or light data overlaid with topographic maps of the fire scene can visually indicate the distribution of heat in the fire area, marking out areas more prone to reignition and providing direction for residual fire clearance.
It is impossible to completely prevent residual fires from reigniting. However, in areas with good signal coverage and easier detection [19], such as high mountain canyons and cliffs, the use of drones can effectively enhance the efficiency of residual fire clearance, reduce the rate of residual fire reignition, and alleviate the difficulty of residual fire clearance [20]. Drones are widely used in the field of forest firefighting, covering various aspects of wildfire prevention. In addition to monitoring residual fires, they play important roles in forest fire early warning monitoring, assisting in firefighting during fire outbreaks, and post-disaster loss assessment. There is also a certain correlation between monitoring residual fires and other outdoor fire detections. The monitoring scope should include both the burning area of the fire and the surrounding potential spread areas of fire points. Depending on the size and severity of the fire, adjustments can be made to the formation range and the number of drones deployed [21].
Considering the urgency and real-time nature of fire incidents, it is crucial to adjust the formation of drone teams for post-fire monitoring [22]. Therefore, performing formation-only passive localization is of great importance [23,24]. Passive localization for UAVs refers to a technique that utilizes sensors and equipment carried by the UAVs themselves to receive signals from external sources, enabling the determination of the drone’s position and location [25,26,27]. Passive localization, compared to active localization, does not require actively transmitting signals, thus conserving energy and extending the drone’s flight time and endurance [28]. This allows UAVs to have longer working hours for monitoring and extinguishing fire remnants. Passive localization exhibits certain resistance to interference and blockage from external signal sources, which can be mitigated through signal processing and filtering, making it suitable for mountainous and forest environments [29]. In contrast, active localization is more susceptible to interference and commonly relies on satellite systems like GPS for outdoor positioning. In summary, timely adjustments of UAV formations based on passive localization technology can improve the efficiency and safety of monitoring and firefighting operations [30].
Traditional methods for adjusting formations include branch and bound [31], branch and price [32], and interior point methods [33]. Branch and bound divides the formation adjustment problem into a series of subproblems and defines an objective function or evaluation criterion for each subproblem. It then searches the solution space and gradually eliminates branches that do not satisfy the criterion, ultimately finding the optimal formation adjustment solution [34]. Branch and price generates constraints and variables gradually during the search process to find the optimal solution that satisfies the constraints. It expands the search space by dynamically generating constraints and variables [35]. Interior point methods can directly search the interior of the feasible domain without considering the boundaries, quickly finding the optimal path [36]. These methods can achieve precise optimal solutions. However, when the number of formations is large, the computational time becomes lengthy, making it infeasible to find the optimal solution within a reasonable time. This is not suitable for the urgent scenarios of forest firefighting. Evolutionary algorithms are commonly employed for solving such problems, including genetic algorithms, particle swarm optimization, and ant colony optimization [37,38,39]. Genetic algorithms possess strong global search capabilities, enabling them to identify relatively optimal solutions within the search space. Through crossover and mutation operations, they maintain population diversity, facilitating the exploration of the solution space. Nevertheless, genetic algorithms are computationally expensive, particularly for complex problem domains. The iterative nature of the algorithm, involving numerous genetic operations and fitness evaluations, results in slow convergence and performance that heavily relies on parameter settings [40]. Particle swarm optimization, on the other hand, exhibits faster convergence, enabling it to find solutions near the optimal solution in shorter durations. However, in complex high-dimensional problems, it may encounter challenges associated with local optima, as particle movement is influenced by historical best positions [41]. Ant colony optimization demonstrates adaptability and robustness, enabling it to adjust path selection strategies dynamically by adjusting pheromone levels in response to varying circumstances and requirements. However, similar to other methods, it also faces limitations in escaping local optima when tackling complex problems and requires longer computation times [42]. The development of artificial intelligence has introduced deep reinforcement learning techniques. Deep reinforcement learning can autonomously learn optimal formation adjustment strategies through interaction with the environment [43]. It can extract features from raw input data and optimize based on feedback from reward signals, gradually improving the performance of formation adjustment. Once the model learns effective formation adjustment strategies in one environment, it can typically generalize to similar environments and produce good results. By using deep neural networks as function approximators, it can handle large amounts of input data and high-dimensional state spaces, enabling more complex formation adjustment strategies [44].
Considering the need for rapid response and real-time decision-making in forest fire monitoring and firefighting, traditional evolutionary algorithms, which require extensive testing time, are no longer suitable for such scenarios. Therefore, this work proposes a fleet adjustment strategy based on the Deep Q Network (DQN). As a form of deep reinforcement learning, DQN can quickly obtain specific strategies within a short time after training the model and can formulate online policies [45,46,47]. In this work, the fleet’s passive localization must satisfy two criteria: minimizing the number of adjustments required and minimizing the positional error between each unmanned aerial vehicle’s adjusted position and the ideal position. Given that unmanned aerial vehicles need to generate specific adjustment strategies (selection of unmanned aerial vehicles that emit signals) in real time, the strategy formulation time in this work should be as short as possible (minimizing the execution time of the program).
2. System Model
2.1. Pure Azimuth Passive Localization
The pure azimuth passive localization scheme for UAVs primarily involves one UAV in the fleet transmitting signals while other UAVs receive them. The receiving UAVs mainly receive the angle between any two transmitting UAVs, as illustrated in Figure 1. UAV01, UAV02, and UAV03 are the transmitting UAVs, while UAV04 is the receiving UAV. UAV04 can receive the angles between UAV02 and UAV03, UAV01 and UAV02, and UAV01 and UAV03, denoted as α1, α2 and α3, respectively. Pure azimuth passive localization utilizes this angle information to determine the position of the receiving UAV.
2.2. Passive Localization Model of UAV Based on Relationships among Triangle Sides and Angles
To achieve the goal of quickly and in real-time adjusting the UAV formation through passive localization technology for forest fire monitoring and suppression, it is necessary to establish a passive localization model for the receiving UAV. Based on this relationship, it is possible to solve for the distances between the three transmitting UAVs and the receiving UAV. This is achieved by considering the geometric properties of the triangle formed by the transmitting UAVs and the receiving UAVs. Before establishing the localization model, some basic assumptions are made to ensure the rationality of the subsequent model construction:
- (a)
- The passive receiving UAV knows which signal comes from which transmitting UAV.
- (b)
- The relative positions of the UAVs remain unchanged during the operation.
- (c)
- The positions of the transmitting UAVs have no bias.
- (d)
- The transmitting UAVs cannot receive signals simultaneously.
- (e)
- The transmitted signals are accurate and unaffected by external factors.
- (f)
- The UAVs are not affected by external interference during their flight.
Assuming that the three transmitting UAVs are labeled as UAV, UAV-1, and UAV-2, and the last two UAVs are any two UAVs selected from UAV01 to UAV09. Since the passive receiving UAV knows the specific labels of the transmitting UAVs, assume that the angle between UAV00 and UAV-1 is α1, the angle between UAV00 and UAV-2 is α2, and the angle between UAV-1 and UAV-2 is α3. The geometric relationship between the passive receiving UAV and the three transmitting UAVs can be divided into the following two cases. (In practice, the positions of the four UAVs are unknown, and this analysis is conducted to derive a general localization model).
The positions of the four UAVs in case 1 can be specifically classified into the two scenarios shown in the following Figure 2.
Where UAV represents the unmanned aerial vehicle to be positioned, represents the distance between UAV and UAV00, represents the distance between UAV and UAV-1, represents the distance between UAV and UAV-2, represents the distance between UAV-1 and UAV-2, and since the specific identifiers to the drones are known, this distance is determined, represents the radius of the circular formation.
Figure 2a shows a UAV with two non-central emitting UAVs on the same side. Figure 2b shows UAV with two non-central emitting UAVs not on the same side. Both positioning scenarios have the same positioning model. The four UAVs form triangle UAV00, UAV-1, UAV, triangle UAV00, UAV-2, UAV, and triangle UAV00, UAV-1, UAV-2. These three triangles have one known angle, so the relationship model between the sides can be represented as:
These three models can be applied to both Figure 2a,b.
Case 2 can be divided into two specific scenarios, as shown in Figure 3. Figure 3a represents . Figure 3b represents .
The two positioning scenarios mentioned above also share the same localization model, formed by four UAVs composing the triangle UAV00, UAV-1, UAV, triangle UAV00, UAV-2, UAV, and triangle UAV00, UAV-1, UAV-2. These three triangles have one known angle each, allowing the relationship model between the sides to be represented as follows:
The same three models can also apply to both scenarios depicted in Figure 3a,b.
In summary, considering the four relationships formed by the four drones in Case 1 and Case 2, the distance models between the passive receiving signal drone (UAV) and the three transmitting signal drones can be represented as follows:
The model is a system of three quadratic equations, and there are three equations in total, which can solve for the variables , , and (the distances). In the case of quadratic equations, there may be more than one solution, and the analysis for such cases will be provided in the following text.
Based on the distances between the receiving drone and the three transmitting drones, the specific position of the receiving drone can be calculated. The Cartesian coordinates of the receiving drone’s position are denoted as . The coordinates of UAV00, UAV-1, and UAV-2 are denoted as , , and , respectively. Therefore, the positioning model for the passive receiving signal drone can be represented as follows:
The model can be considered as three circles with the receiving drone as the center and the distances between the receiving drone and each transmitter drone as the radius. The position of the receiving drone corresponds to the intersection points of these three circles.
When solving the system of three quadratic equations, multiple real solutions can arise. Moreover, accounting for slight positional deviations in the drones, the solution for the positioning model can be determined by selecting the point that is closest to the circular formation.
2.3. Simulation Verification of Circular Formation
To validate the accuracy of the positioning model for the passive receiving drone, simulations are conducted. In this work, a circular formation was utilized, as shown in Figure 4. The circular formation offers more uniform coverage, ensuring effective monitoring and suppression of the entire fire area while reducing monitoring gaps and blind spots. The communication paths between the UAVs are relatively short, enabling quick transmission of information and instructions, and facilitating better coordination among the UAVs. This is particularly crucial for forest fire suppression tasks where UAVs need to share fire-related information and coordinate their suppression actions. The circular formation, with its symmetry and even distribution, promotes stability throughout the formation, minimizing the risk of flight instability or disintegration of the formation due to individual UAV anomalies.
The parameters for the simulation experiment are set as follows: a formation consisting of 10 UAVs is created to form a circular formation, as shown in Figure 4. Among them, nine UAVs (UAV01–UAV09) are evenly distributed along a circular path, while another UAV (UAV00) is positioned at the center of the circle. The fire points in Figure 4 refer to lingering forest fire points. Lingering forest fire points are those burning spots or hot spots that persist within a forest area after a forest fire has been controlled or extinguished. Their intensity can vary from low residual heat to sustained high burning temperatures. Within the fire area, these hot spots may be widely distributed and unevenly dense, with some exhibiting noticeable smoke or flames while others may only represent concealed underground burning. They are typically not single points but rather a small burning area. The UAVs maintain a constant altitude based on their own height perception. The radius of the circular formation is set to 100 m. Due to the known identification of the transmitting UAVs, and the selection of the two transmitting drones not affecting the experimental results, UAV00, UAV01, and UAV02 are chosen as the transmitting drones. Random positions are generated around the remaining seven standard positions. By using the coordinates of these seven points, the angles between UAV00, UAV01, and UAV02 are calculated. Based on these angles, the inferred coordinates of these points are derived using the established positioning model mentioned above. The accuracy of the positioning model is validated by comparing the inferred coordinates with the actual coordinates. In the experiment, the actual coordinates of UAV03-UAV09 and the computed coordinates based on the positioning model are presented in Table 1 and shown in Figure 5. It can be observed that the computed coordinates from the positioning model are identical to the actual coordinates up to three decimal places, indicating a high level of accuracy in the positioning model.
3. Problem Formulation
For the solution in Chapter 2, the positioning of other UAVs can be achieved with only three known drone positions. Assuming negligible adjustment time for the UAV positions, it is assumed that UAV00 and the other two drones are set as the transmitting drones each time. The initial position of No. 1 UAV is always located on the circumference of a circle with a radius of 100 m and with No. 0 UAV as the center. Therefore, No. 0 and No. 1 UAVs are selected as the launch signal drones each time.
Each UAV is unaware of the positions of the other drones, so when a receiving drone receives a signal, it assumes the transmitting UAV is in an ideal position for positioning adjustments. However, since only two drones are in ideal positions, it is difficult to adjust each UAV to the exact ideal position within a limited number of iterations. Therefore, the adjustment plan represents a multi-objective optimization challenge. Specifically, within a finite number of adjustment cycles, the goal is to bring the 10 UAVs as close as possible to their ideal positions.
A single-step adjustment for a receiving UAV can be defined as follows: assuming the three transmitting drones are in ideal positions→calculating the adjusted angle information→adjusting the receiving UAV based on the target angle information→calculating the coordinates of the receiving UAV based on the actual positions of the transmitting UAVs. To address this adjustment process, the following mathematical programming model is established.
The decision variables are defined as follows:
: The number of adjustments;
: Whether the i-th UAV serves as the transmitting drone in the j-th adjustment.
The objective functions are defined as follows:
Objective function 1: minimize the deviation of the 10 UAVs from their ideal positions over u adjustments, which can be expressed as
where represents the horizontal coordinate of the i-th UAV after the j-th adjustment, represents the vertical coordinate of the i-th UAV after the j-th adjustment, u represents the finite number of adjustments, represents the ideal position of the i-th UAV. Objective function 2: minimize the number of adjustments, which can be expressed as follows:
Subject to:
The constraint (15) ensures that the UAVs with the numbers 0 and 1 always act as emitting drones. The constraint (16) ensures that the number of emitting UAVs selected for adjustment on each occasion does not exceed 3, and since the adjustment time is negligible, three emitting UAVs are sufficient to locate one receiving UAV. Therefore, the constraint is that the number of emitting UAVs selected for adjustment on each occasion does not exceed 2 from those positioned on the circumference. Constraint (17) ensures that the emitting UAVs are defined for ease of representation in the model. Apart from UAV 0 and UAV 1, the is used to represent the other emitting drone. Constraints (18), (19), and (20) denote that the receiving UAV assumes that the three emitting drones are in their ideal positions and adjusts its own position based on the received signal direction. Constraints (21) and (22) ensure that the passive receiving drone adjusts its position according to the perceived correct angles. The adjusted angles for each UAV satisfy the equation , , and , so the adjusted coordinates are known. First, the distances between the adjusted position and the three emitting UAVs are calculated based on these angles, and then the adjusted position is determined using these three distances.
In summary, the mathematical programming model for achieving the closest proximity to the ideal positions for the 10 UAVs within a limited number of adjustment rounds can be stated as follows:
4. Algorithm
4.1. The Mechanism of the DQN Algorithm
The DQN algorithm is a deep learning method used for reinforcement learning, initially proposed by DeepMind in 2013. It is a technique that combines deep neural networks with Q-learning, aiming to train agents to learn optimal strategies from the environment. The DQN algorithm is an improvement over the Q-learning algorithm, specifically by using a neural network to approximate the value function for different state–action pairs. It allows for accurate prediction of the value function for unseen state–action pairs. In Q-learning, the agent takes an action in the current state, and the resulting impact on future outcomes is represented by the Q-value. The Q-value is updated through the continuous interaction between the agent and the environment. Once the Q-values are updated, the agent selects actions based on the maximum Q-value. The calculation formula for the Q-value is as follows:
where represents the reward function, measuring the subsequent effects of action performed under state . is the sum of future reward functions. The specific calculation process is as follows:
where γ represents the discount factor of the reward function. The purpose of introducing this parameter is to make rewards that are further in the future have a smaller impact on the current return function.
For DQN, it incorporates neural networks into reinforcement learning, where the Q-values are computed by the parameters of the neural network. The training of the Deep Q-network involves converting the Q-value table into training the deep network model, which is achieved by:
The network structure of the DQN algorithm is shown in Figure 6. The parameter settings of the DQN algorithm are shown in Table 2.
In DQN, two important mechanisms are included: the target network and experience replay. The target network aims to copy the Q-values and its parameters are updated at a lower frequency to preserve the recent optimal Q-values. It serves as the target values for the Q-value network to compute the loss function.
where represents the loss function, and represents the parameters of the target network.
The experience replay mechanism defines a replay buffer that serves as a dataset for training the Q-values. This buffer stores the experiences and outcomes of the interactions between the agent and the environment, such as states, actions, rewards, etc. During each training iteration, a subset of data is sampled from the replay buffer to calculate the loss function and update the parameters.
4.2. Algorithm Framework
In the problem of pure azimuth passive localization of drones, the objective is to achieve the ideal formation of drones with as few adjustment steps as possible. In reinforcement learning, this problem is modeled as a Markov decision process. That is, given the current state, the Q-network is used to select the most suitable action (which drone to choose as the emitting drone), and then the state is updated, and a reward is obtained. The structure diagram for using DQN to adjust drone formation is shown in Figure 7. The algorithm consists of two main components: the reinforcement learning part and the deep learning part, which work together. The reinforcement learning part is primarily responsible for interacting with the environment to obtain data for deep learning. The reinforcement learning part is mainly to interact with the environment to obtain data for deep learning, while the deep learning part mainly uses the experience replay mechanism and target network to train the Q network and perfect the strategy parameters θ for adjusting the formation of drone formation.
According to the above description, the pseudo-code for the DQN algorithm of f-solving is shown in Algorithm 1.
| Algorithm 1: Deep Q-learning (DQN) |
| Initialize replay memory D to capacity N Initialize action-value function Q with random weights θ Initialize target action-value function Q̂ with weights θ^- = θ for episode = 1, M do Initialize sequence s_1 = {x_1} and preprocessed sequence φ_1 = φ(s_1) for t = 1, u do With probability ε select a random action a_t (The action refers to selecting which UAV to be the signal-emitting UAV.) otherwise select a_t = argmax_a Q(φ(s_t), a; θ) Execute action a_t in emulator and observe reward r_t (The reward, denoted as r_t, represents the discrepancy between the adjusted position and the ideal position. Since the goal of DRL is to maximize the reward, the objective of this task is to minimize the discrepancy. Therefore, the reward is defined as the negative value of the discrepancy: reward = -discrepancy and image x_(t + 1) Set s_(t + 1) = s_t, a_t, x_(t + 1) and preprocess φ_(t+1) = φ(s_(t + 1)) Store transition (φ_t, a_t, r_t, φ_(t + 1)) in D Sample random minibatch of transitions (φ_j, a_j, r_j, φ_(j+1)) from D Set y_j = r_j for terminal φ_(j+1) r_j + γ * max_a′ Q̂(φ_(j + 1), a′; θ^-) for non-terminal φ_(j + 1) Perform a gradient descent step on (y_j - Q(φ_j, a_j; θ))^2 according to equation with respect to the network parameters θ Every C steps reset Q̂ = Q end for end for |
5. Experiment
5.1. Experimental Background and Environment
The initial positions of the drones are shown in Algorithm 1. According to the formation requirements, one drone is located at the center, and the other nine UAVs are evenly distributed on a circular path with a radius of 100 m. When the initial positions of the drones have slight deviations, multiple adjustments are made. In each adjustment, the UAV with the identifier UAV00 and up to three drones on the circular path are selected to transmit signals. The remaining UAVs adjust their positions based on the received directional information, aiming to achieve the ideal formation where all nine UAVs are evenly distributed on a circular path. Table 3 presents the polar coordinate data of the UAVs. The ideal positions are uniformly distributed around a circle with a radius of 100 m, as shown in Table 4.
5.2. Setting of Environmental Parameters
5.3. Experimental Result Analysis
The strategy for launching drones during drone formation adjustments is developed using the DQN algorithm. Under different numbers of adjustments, the average difference between the adjusted coordinates of all drones and the ideal drone formation coordinates can be obtained, and the Pareto frontier curve between the number of adjustments in DQN and the actual difference can be obtained. As shown in Figure 8, as the number of adjustments increases, the actual positions of the drones become closer to the ideal positions. It is observed that after five adjustments, the difference between the actual and ideal positions of the drones is within an acceptable range, and the number of adjustments is also acceptable.
In this work, the runtime comparison between the DQN algorithm and the GA is presented in Table 6. The DQN algorithm took 2.7 s to complete the testing on the market, while the genetic algorithm required 127.9 s for the same testing. It can be observed that DQN significantly saves time compared to GA in terms of testing duration. Additionally, DQN demonstrates the ability to converge quickly on new datasets.
According to Figure 9, it can be observed that during the 5 adjustment iterations, there is a noticeable trend between the reward function and the number of iterations. It is found that the model tends to stabilize around 20 iterations, and the DQN algorithm also shows fast convergence.
The specific adjustment strategies are shown in Table 7.
6. Conclusions
This paper proposes a multi-objective optimization model based on the DQN algorithm, which is suitable for the formation adjustment strategy of drones in monitoring and extinguishing forest residual fires. The following conclusions can be drawn from the mathematical model and experimental results:
- (a)
- Based on the equivalence relationship between the three sides and angles, the distances between the three emitting UAVs and the receiving UAVs can be solved. Then, using each of the three emitting UAVs as the center, circles are drawn with the distance to the receiving UAV as the radius. The intersection points of the three circles are the positions of the receiving UAVs to be located. Since the system of three quadratic equations has multiple suitable real number solutions, the point closest to the ideal position is selected as the position of the receiving UAV to be located.
- (b)
- If it is required to evenly arrange UAVs 1–9 on the circumference with a radius of 100 and centered at UAV 0, due to only UAV 1 having an unbiased position, it is not possible to position all UAVs in an exact unbiased position within a limited number of adjustments. Therefore, the optimization goal is to minimize the deviation from the ideal position and minimize the number of adjustments. Thus, a mathematical programming model is established with the decision variables being the emitting UAVs selected for each adjustment, aiming to minimize the sum of squared errors between the final adjusted UAV coordinates and the ideal position coordinates, as well as the number of adjustments.
- (c)
- Due to environmental constraints and other factors, all experiments conducted in this study are simulated experiments. Therefore, the influence of external factors on drones is not considered.
- (d)
- The process of the DQN algorithm first involves generating many instances to train the DQN algorithm. After obtaining a well-trained DQN model, this model is then used to test given examples. This demonstrates the effectiveness of the algorithm and the model. For the same example, the results of the DQN algorithm are consistent.
- (e)
- In the 5th adjustment round, the DQN algorithm yielded a sum of squared errors between the actual and ideal positions of 9.985 × 10⁻⁸, indicating no deviation between the actual and ideal positions at this stage.
- (f)
- The testing time of the DQN algorithm is 2.7 s, while that of the genetic algorithm is 127.9 s. The DQN algorithm has a significantly lower testing time than the genetic algorithm, making it more responsive to the rapid nature of drone operations in monitoring and extinguishing forest residual fires.
- (g)
- In the 5th adjustment round, the DQN algorithm’s model tended to stabilize after the 20th iteration, indicating convergence of results.
Author Contributions
Conceptualization, S.-K.L. and W.L.; methodology, Z.Q.; software, W.L.; validation, Y.-T.W., Z.Q. and T.L.; formal analysis, W.L.; investigation, S.-K.L.; resources, Y.-T.W.; data curation, Z.Q. and S.-K.L.; writing—original draft preparation, W.L. and S.-K.L.; writing—review and editing, Y.-T.W.; visualization, T.L.; supervision, Z.Q.; project administration, Z.Q.; funding acquisition, Z.Q. and S.-K.L. All authors have read and agreed to the published version of the manuscript.
Funding
This work was supported by the Natural Science Foundation of Shandong Province under Grant ZR2022QE085, the Regional Leading Research Center of NRF and MOCIE (NRF-2019R1A5A8083201) and the Basic Science Research Program through the NRF of Korea funded by the MEST (NRF-2023R1A2C1003691).
Data Availability Statement
Data are contained within the article.
Conflicts of Interest
The authors declare no conflict of interest.
References
- Turco, M.; Bedia, J.; Di Liberto, F.; Fiorucci, P.; von Hardenberg, J.; Koutsias, N.; Llasat, M.; Xystrakis, F.; Provenzale, A. Decreasing Fires in Mediterranean Europe. PLoS ONE 2016, 11, e150663. [Google Scholar] [CrossRef] [PubMed]
- San-Miguel-Ayanz, J.; Moreno, J.M.; Camia, A. Analysis of large fires in European Mediterranean landscapes: Lessons learned and perspectives. For. Ecol. Manag. 2013, 294, 11–22. [Google Scholar] [CrossRef]
- Radford, I.J.; Gibson, L.A.; Corey, B.; Carnes, K.; Fairman, R. Influence of Fire Mosaics, Habitat Characteristics and Cattle Disturbance on Mammals in Fire-Prone Savanna Landscapes of the Northern Kimberley. PLoS ONE 2015, 10, e130721. [Google Scholar] [CrossRef] [PubMed]
- Agbeshie, A.A.; Abugre, S.; Atta-Darkwa, T.; Awuah, R. A review of the effects of forest fire on soil properties. J. For. Res. 2022, 33, 1419–1441. [Google Scholar] [CrossRef]
- Ubeda, X.; Sarricolea, P. Wildfires in Chile: A review. Glob. Planet. Chang. 2016, 146, 152–161. [Google Scholar] [CrossRef]
- Thom, D.; Seidl, R. Natural disturbance impacts on ecosystem services and biodiversity in temperate and boreal forests. Biol. Rev. 2016, 91, 760–781. [Google Scholar] [CrossRef]
- Sharples, J.J.; Cary, G.J.; Fox-Hughes, P.; Mooney, S.; Evans, J.P.; Fletcher, M.S.; Fromm, M.; Grierson, P.F.; Mcrae, R.; Baker, P. Natural hazards in Australia: Extreme bushfire. Clim. Chang. 2016, 139, 85–99. [Google Scholar] [CrossRef]
- Madoui, A.; Gauthier, S.; Leduc, A.; Bergeron, Y.; Valeria, O. Monitoring Forest Recovery Following Wildfire and Harvest in Boreal Forests Using Satellite Imagery. Forests 2015, 6, 4105–4134. [Google Scholar] [CrossRef]
- Deligiannakis, G.; Pallikarakis, A.; Papanikolaou, I.; Alexiou, S.; Reicherter, K. Detecting and Monitoring Early Post-Fire Sliding Phenomena Using UAV–SfM Photogrammetry and t-LiDAR-Derived Point Clouds. Fire 2021, 4, 87. [Google Scholar] [CrossRef]
- Bao, S.; Xiao, N.; Lai, Z.; Zhang, H.; Kim, C. Optimizing watchtower locations for forest fire monitoring using location models. Fire Saf. J. 2015, 71, 100–109. [Google Scholar] [CrossRef]
- Kim, S.; Lee, W.; Park, Y.S.; Lee, H.W.; Lee, Y.T. Forest fire monitoring system based on aerial image. In Proceedings of the 2016 3rd International Conference on Information and Communication Technologies for Disaster Management (ICT-DM), Vienna, Austria, 13–15 December 2016; pp. 1–6. [Google Scholar]
- Torres, P.; Rodes-Blanco, M.; Viana-Soto, A.; Nieto, H.; García, M. The Role of Remote Sensing for the Assessment and Monitoring of Forest Health: A Systematic Evidence Synthesis. Forests 2021, 12, 1134. [Google Scholar] [CrossRef]
- Xu, R.; Lin, H.; Lu, K.; Cao, L.; Liu, Y. A Forest Fire Detection System Based on Ensemble Learning. Forests 2021, 12, 217. [Google Scholar] [CrossRef]
- Torresan, C.; Berton, A.; Carotenuto, F.; Di Gennaro, S.F.; Gioli, B.; Matese, A.; Miglietta, F.; Vagnoli, C.; Zaldei, A.; Wallace, L. Forestry applications of UAVs in Europe: A review. Int. J. Remote Sens. 2017, 38, 2427–2447. [Google Scholar] [CrossRef]
- Yuan, C.; Zhang, Y.; Liu, Z. A survey on technologies for automatic forest fire monitoring, detection, and fighting using unmanned aerial vehicles and remote sensing techniques. Can. J. For. Res. 2015, 45, 783–792. [Google Scholar] [CrossRef]
- Ivanova, S.; Prosekov, A.; Kaledin, A. A Survey on Monitoring of Wild Animals during Fires Using Drones. Fire 2022, 5, 60. [Google Scholar] [CrossRef]
- Penglase, K.; Lewis, T.; Srivastava, S.K. A New Approach to Estimate Fuel Budget and Wildfire Hazard Assessment in Commercial Plantations Using Drone-Based Photogrammetry and Image Analysis. Remote Sens. 2023, 15, 2621. [Google Scholar] [CrossRef]
- Harikumar, K.; Senthilnath, J.; Sundaram, S. Multi-UAV Oxyrrhis Marina-Inspired Search and Dynamic Formation Control for Forest Firefighting. IEEE Trans. Autom. Sci. Eng. 2019, 16, 863–873. [Google Scholar] [CrossRef]
- Sudhakar, S.; Vijayakumar, V.; Kumar, C.S.; Priya, V.; Ravi, L.; Subramaniyaswamy, V. Unmanned Aerial Vehicle (UAV) based Forest Fire Detection and monitoring for reducing false alarms in forest-fires. Comput. Commun. 2020, 149, 1–16. [Google Scholar] [CrossRef]
- Zhan, J.; Hu, Y.; Cai, W.; Zhou, G.; Li, L. A Small Target Detection Approach for Wildland Fire Smoke through Remote Sensing Images. Symmetry 2021, 13, 2260. [Google Scholar] [CrossRef]
- Georgiades, G.; Papageorgiou, X.S.; Loizou, S.G. Integrated Forest Monitoring System for Early Fire Detection and Assessment. In Proceedings of the 2019 6th International Conference on Control, Decision and Information Technologies (CODIT), Paris, France, 23–26 April 2019; pp. 1817–1822. [Google Scholar]
- Zhen, T.; Zhang, Y.M.; Xin, J.; Mu, L.X.; Yi, Y.M.; Liu, H.; Liu, D. A Deep Learning Based Forest Fire Detection Approach Using UAV and YOLOv3. In Proceedings of the 2019 1st International Conference on Industrial Artificial Intelligence (IAI), Shenyang, China, 23–27 July 2019; pp. 1–5. [Google Scholar]
- Jiang, H.; Liang, Y.Q. Online Path Pl, onomous UAVs for Bearing-Only Stand off Multi-Target Following in Threat Environment. IEEE Access 2018, 6, 22531–22544. [Google Scholar] [CrossRef]
- Yu, Z.Q.; Zhang, Y.M.; Jiang, B.; Fu, J.; Jin, Y. A review on fault-tolerant cooperative control of multiple unmanned aerial vehicles. Chin. J. Aeronaut. 2022, 35, 1–18. [Google Scholar] [CrossRef]
- Zhou, Y.K.; Gao, W.; Rao, B.; Ding, B.W.; Wang, W. Neighborhood Selection Synchronization Mechanism-Based Moving Source Localization Using UAV Swarm. Remote Sens. 2023, 15, 2313. [Google Scholar] [CrossRef]
- Zhou, Y.K.; Song, D.; Ding, B.W.; Rao, B.; Su, M.; Wang, W. Ant Colony Pheromone Mechanism-Based Passive Localization Using UAV Swarm. Remote Sens. 2022, 14, 2944. [Google Scholar] [CrossRef]
- Li, H.; Fan, X.Y.; Shi, M.H. Research on the Cooperative Passive Location of Moving Targets Based on Improved Particle Swarm Optimization. Drones 2023, 7, 264. [Google Scholar] [CrossRef]
- Guo, P.J.; Zhang, R.; Gao, G.G.; Xu, B. Cooperative Navigation of UAV Formation Based on Relative Velocity and Position Assistance. J. Shanghai Jiaotong Univ. 2022, 56, 1438–1446. [Google Scholar]
- Wang, R.; Du, J.N.; Xiong, Z.; Chen, X.; Liu, J.Y. Hierarchical Collaborative Navigation Method for UAV Swarm. J. Aerosp. Eng. 2021, 34, 4020097. [Google Scholar] [CrossRef]
- Li, C.Y.; Wang, J.A.; Liu, J.H.; Shan, J.Y. Cooperative Visual-Range-Inertial Navigation for Multiple Unmanned Aerial Vehicles. IEEE Trans. Aerosp. Electron. Syst. 2023, 59, 7851–7865. [Google Scholar] [CrossRef]
- Coelho, B.N.; Coelho, V.N.; Coelho, I.M.; Ochi, L.S.; Haghnazar, K.R.; Zuidema, D.; Lima, M.; Da Costa, A.R. A multi-objective green UAV routing problem. Comput. Oper. Res. 2017, 88, 306–315. [Google Scholar] [CrossRef]
- Alotaibi, K.A.; Rosenberger, J.M.; Mattingly, S.P.; Punugu, R.K.; Visoldilokpun, S. Unmanned aerial vehicle routing in the presence of threats. Comput. Ind. Eng. 2018, 115, 190–205. [Google Scholar] [CrossRef]
- Goodbody, T.; Coops, N.C.; Marshall, P.L.; Tompalski, P.; Crawford, P. Unmanned aerial systems for precision forest inventory purposes: A review and case study. For. Chron. 2017, 93, 71–81. [Google Scholar] [CrossRef]
- Masroor, R.; Naeem, M.; Ejaz, W. Efficient deployment of UAVs for disaster management: A multi-criterion optimization approach. Comput. Commun. 2021, 177, 185–194. [Google Scholar] [CrossRef]
- Park, Y.; Nielsen, P.; Moon, I. Unmanned aerial vehicle set covering problem considering fixed-radius coverage constraint. Comput. Oper. Res. 2020, 119, 104936. [Google Scholar] [CrossRef]
- Alonzo, M.; Andersen, H.E.; Morton, D.C.; Cook, B.D. Quantifying Boreal Forest Structure and Composition Using UAV Structure from Motion. Forests 2018, 9, 119. [Google Scholar] [CrossRef]
- Martin, J.G.; Frejo, J.; García, R.A.; Camacho, E.F. Multi-robot task allocation problem with multiple nonlinear criteria using branch and bound and genetic algorithms. Intell. Serv. Robot. 2021, 14, 707–727. [Google Scholar] [CrossRef]
- Phung, M.D.; Ha, Q.P. Safety-enhanced UAV path planning with spherical vector-based particle swarm optimization. Appl. Soft Comput. 2021, 107, 107376. [Google Scholar] [CrossRef]
- Chen, J.C.; Ling, F.Y.; Zhang, Y.; You, T.; Liu, Y.F.; Du, X.Y. Coverage path planning of heterogeneous unmanned aerial vehicles based on ant colony system. Swarm Evol. Comput. 2022, 69, 101005. [Google Scholar] [CrossRef]
- Liu, X.; Liu, Y.W.; Chen, Y. Reinforcement Learning in Multiple-UAV Networks: Deployment and Movement Design. IEEE Trans. Veh. Technol. 2019, 68, 8036–8049. [Google Scholar] [CrossRef]
- Zhang, J.; Cui, Y.N.; Ren, J. Dynamic Mission Planning Algorithm for UAV Formation in Battlefield Environment. IEEE Trans. Aerosp. Electron. Syst. 2023, 59, 3750–3765. [Google Scholar] [CrossRef]
- Tang, J.; Chen, X.; Zhu, X.M.; Zhu, F. Dynamic Reallocation Model of Multiple Unmanned Aerial Vehicle Tasks in Emergent Adjustment Scenarios. IEEE Trans. Aerosp. Electron. Syst. 2023, 59, 1139–1155. [Google Scholar] [CrossRef]
- Hu, J.W.; Wang, L.H.; Hu, T.M.; Guo, C.B.; Wang, Y.X. Autonomous Maneuver Decision Making of Dual-UAV Cooperative Air Combat Based on Deep Reinforcement Learning. Electronics 2022, 11, 467. [Google Scholar] [CrossRef]
- Luong, N.C.; Hoang, D.T.; Gong, S.M.; Niyato, D.; Wang, P.; Liang, Y.C.; Kim, D.I. Applications of Deep Reinforcement Learning in Communications and Networking: A Survey. IEEE Commun. Surv. Tutor. 2019, 21, 3133–3174. [Google Scholar] [CrossRef]
- Khalili, A.; Monfared, E.M.; Zargari, S.; Javan, M.R.; Yamchi, N.M.; Jorswieck, E.A. Resource Management for Transmit Power Minimization in UAV-Assisted RIS HetNets Supported by Dual Connectivity. IEEE Trans. Wirel. Commun. 2022, 21, 1806–1822. [Google Scholar] [CrossRef]
- Liu, X.; Liu, Y.W.; Chen, Y. Machine Learning Empowered Trajectory and Passive Beamforming Design in UAV-RIS Wireless Networks. IEEE J. Sel. Areas Commun. 2021, 39, 2042–2055. [Google Scholar] [CrossRef]
- Zhou, W.Q.; Fan, L.S.; Zhou, F.S.; Li, F.; Lei, X.F.; Xu, W.; Nallanathan, A. Priority-Aware Resource Scheduling for UAV-Mounted Mobile Edge Computing Networks. IEEE Trans. Veh. Technol. 2023, 72, 9682–9687. [Google Scholar] [CrossRef]
Figure 1.
Explanation of the received angle signals.
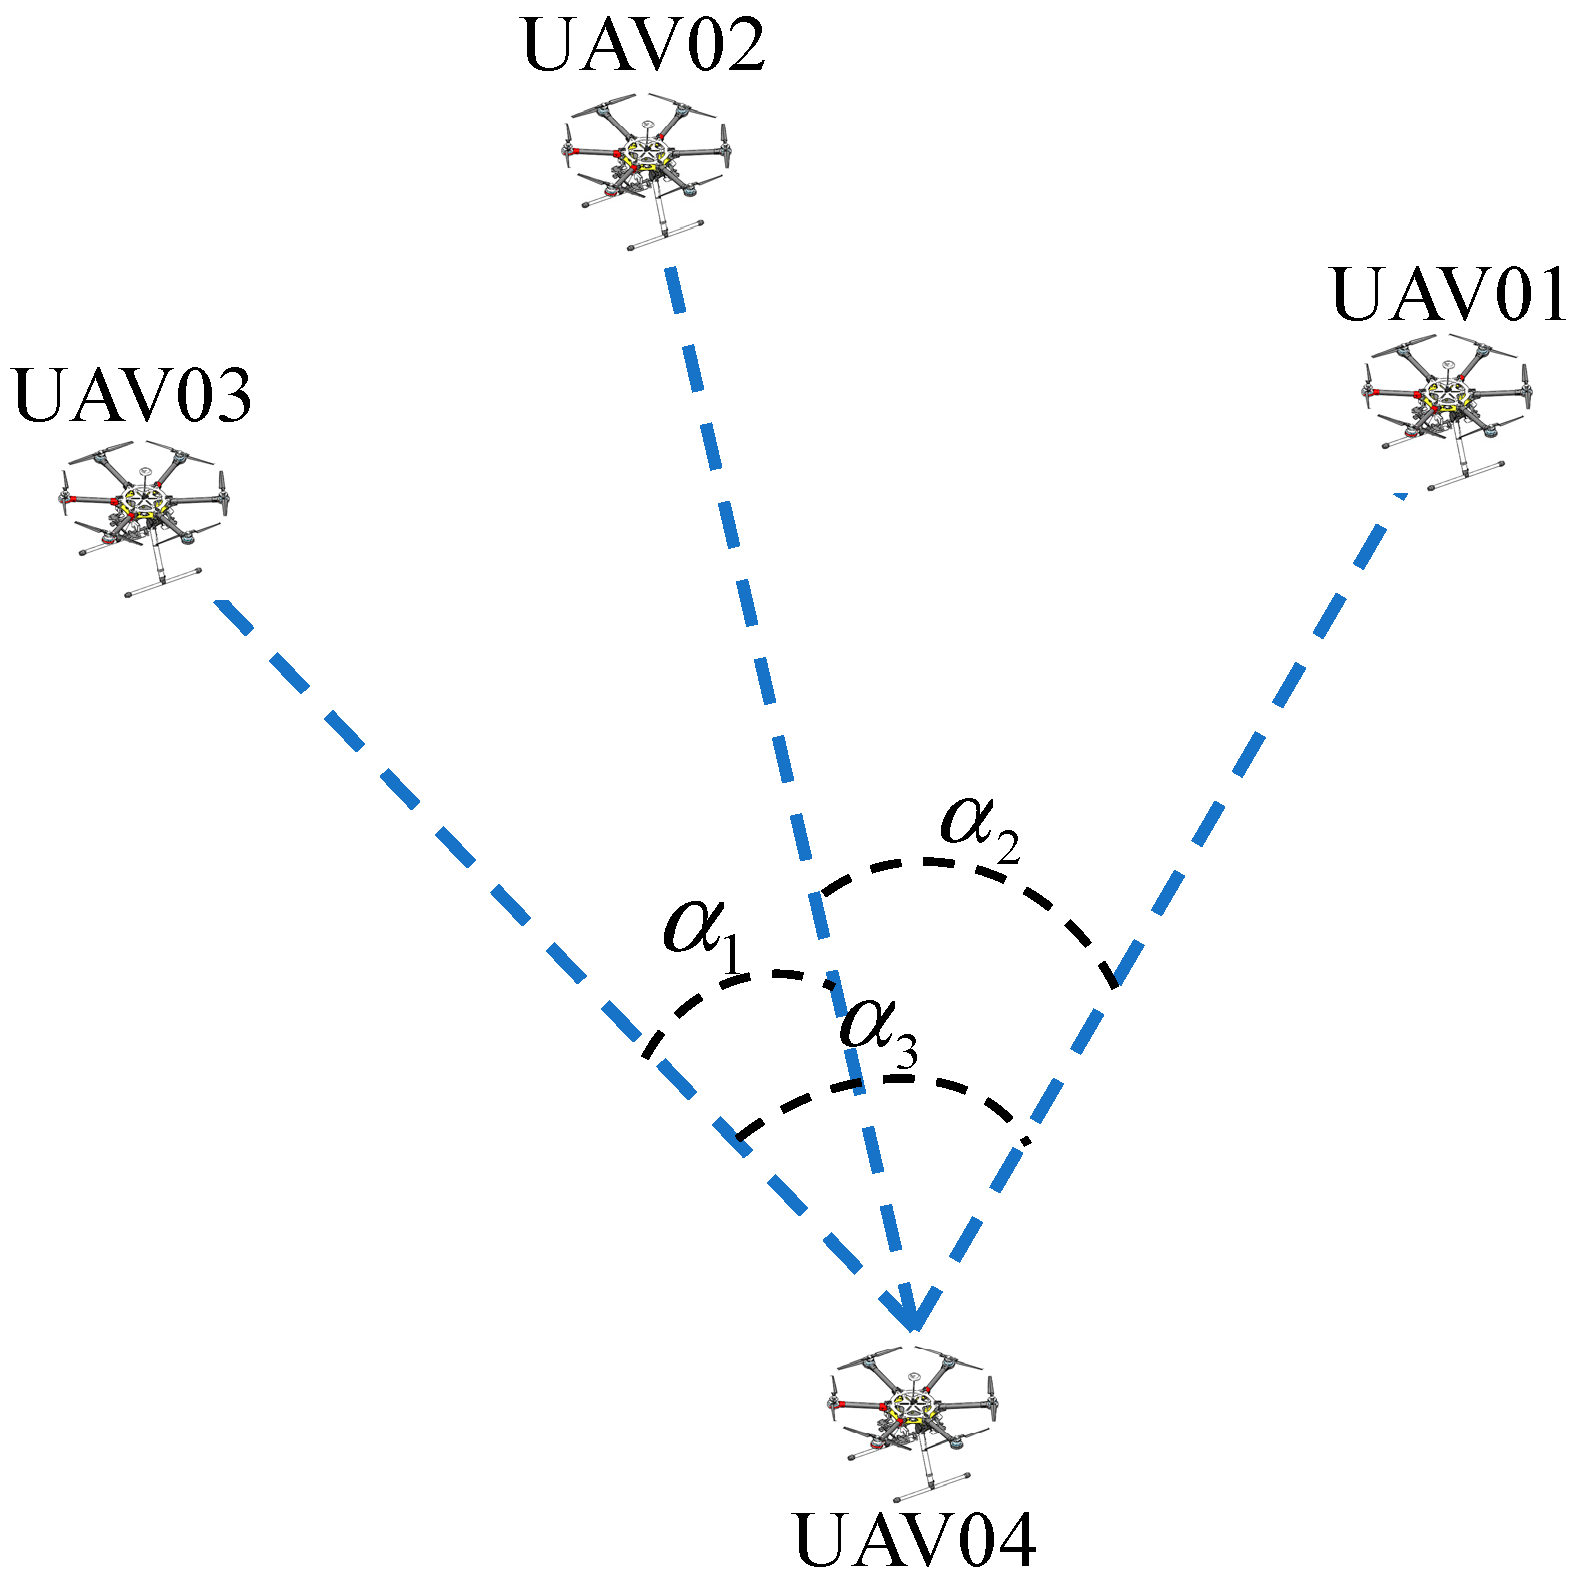
Figure 2.
Two scenarios of case 1: (a) UAV with two non-central emitting UAVs on the same side; (b) UAV with two non-central emitting UAVs not on the same side.
Figure 2.
Two scenarios of case 1: (a) UAV with two non-central emitting UAVs on the same side; (b) UAV with two non-central emitting UAVs not on the same side.

Figure 3.
Two scenarios of case 2: (a) Scenario of ; (b) Scenario of .
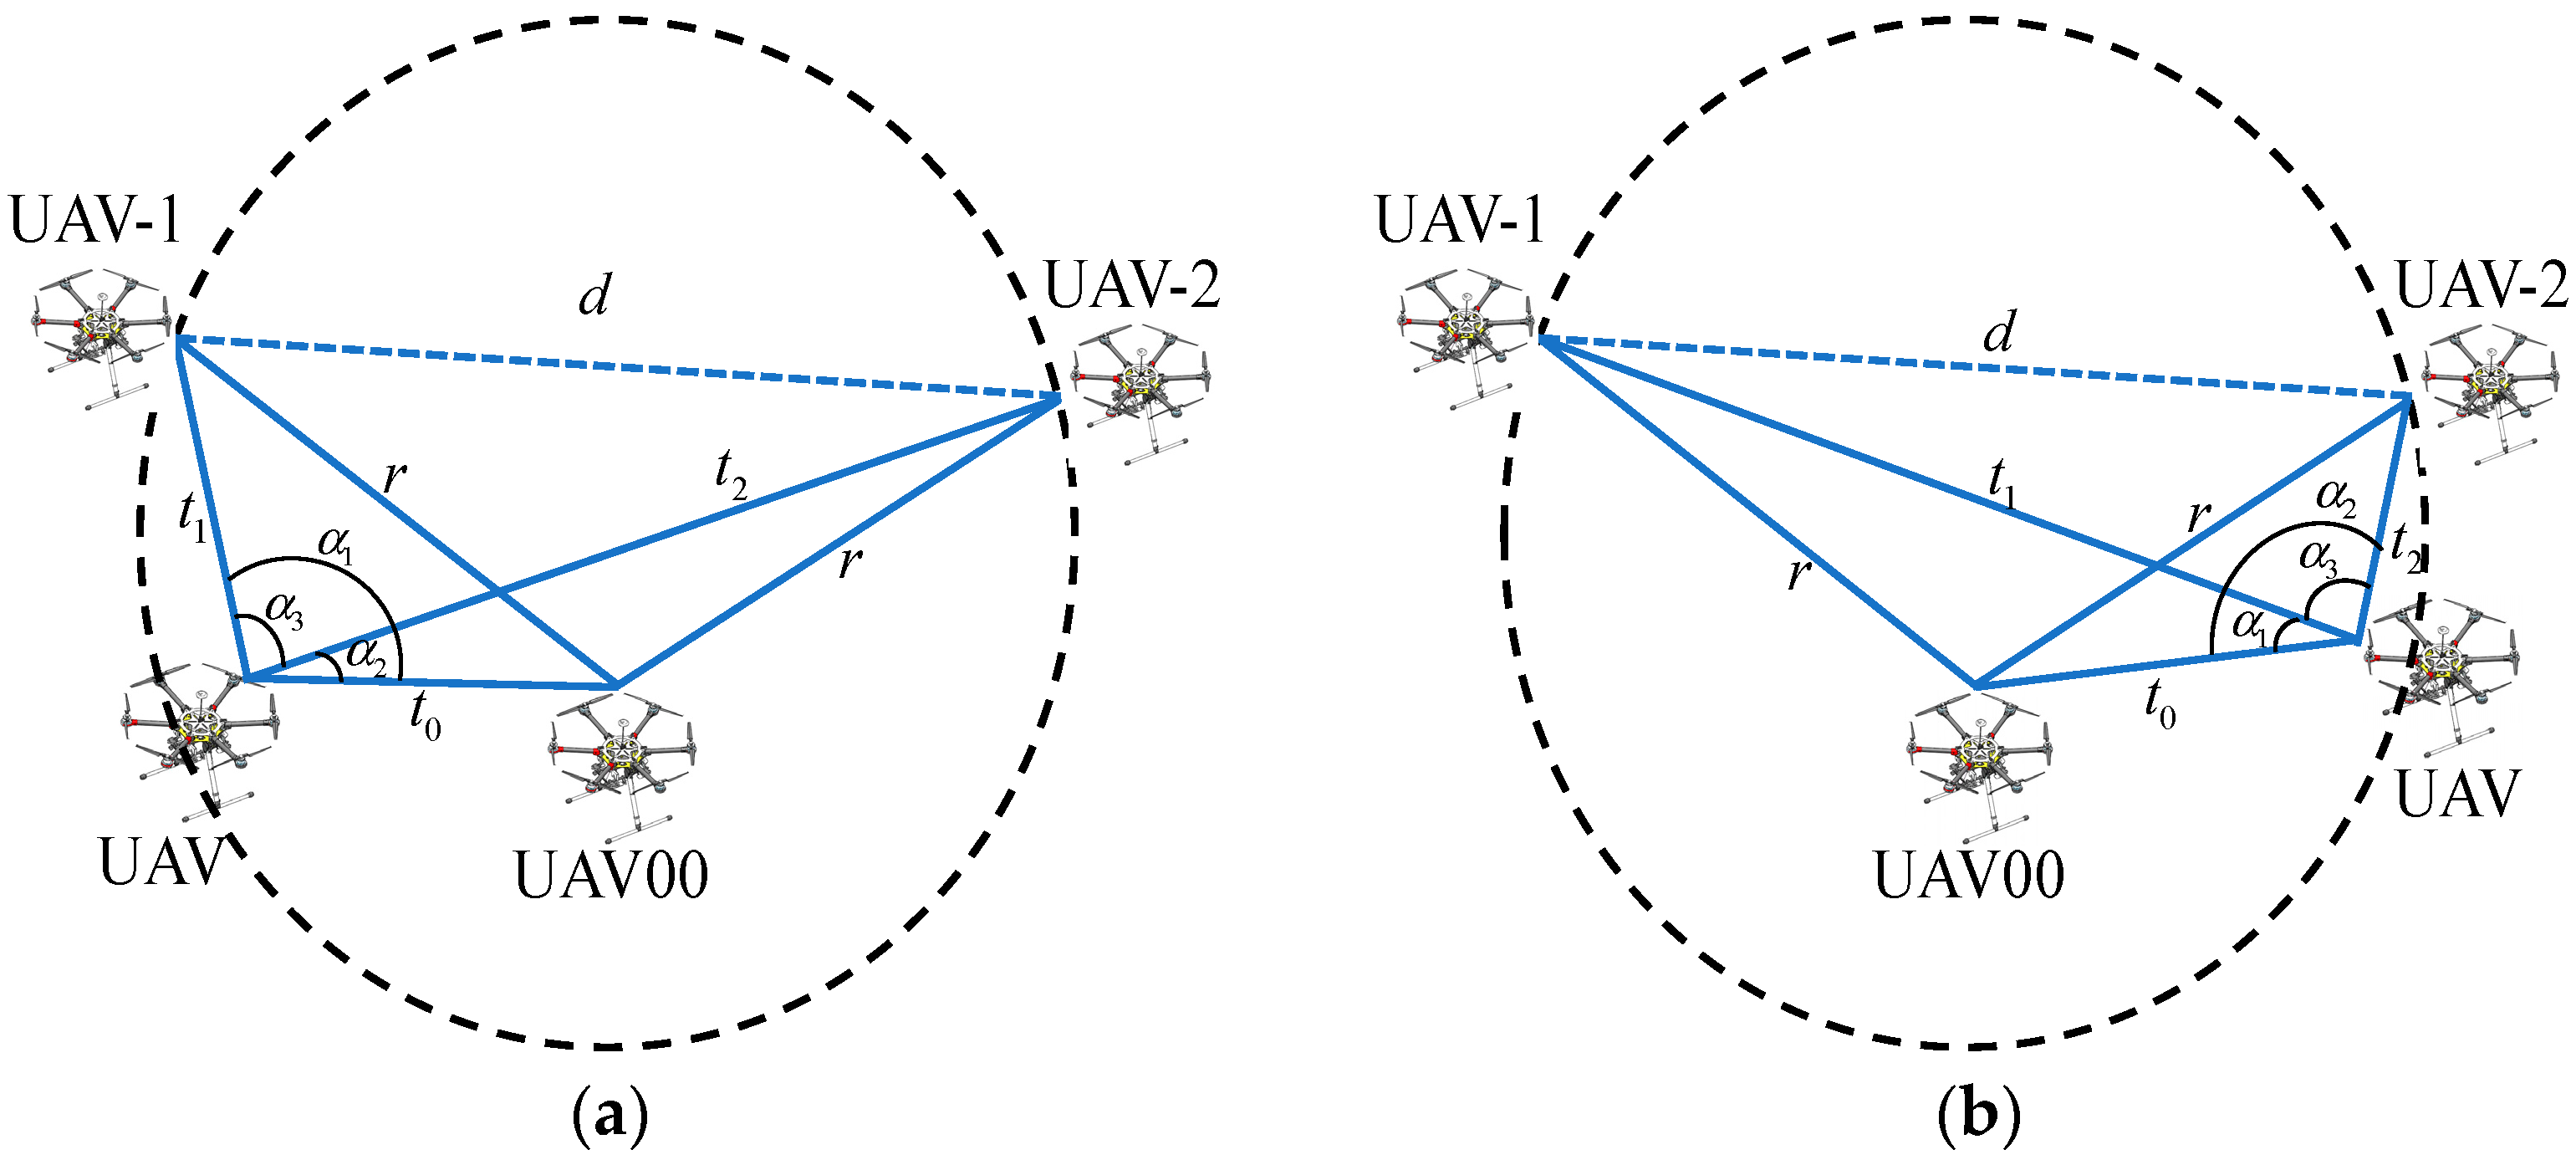
Figure 4.
Circular formation.
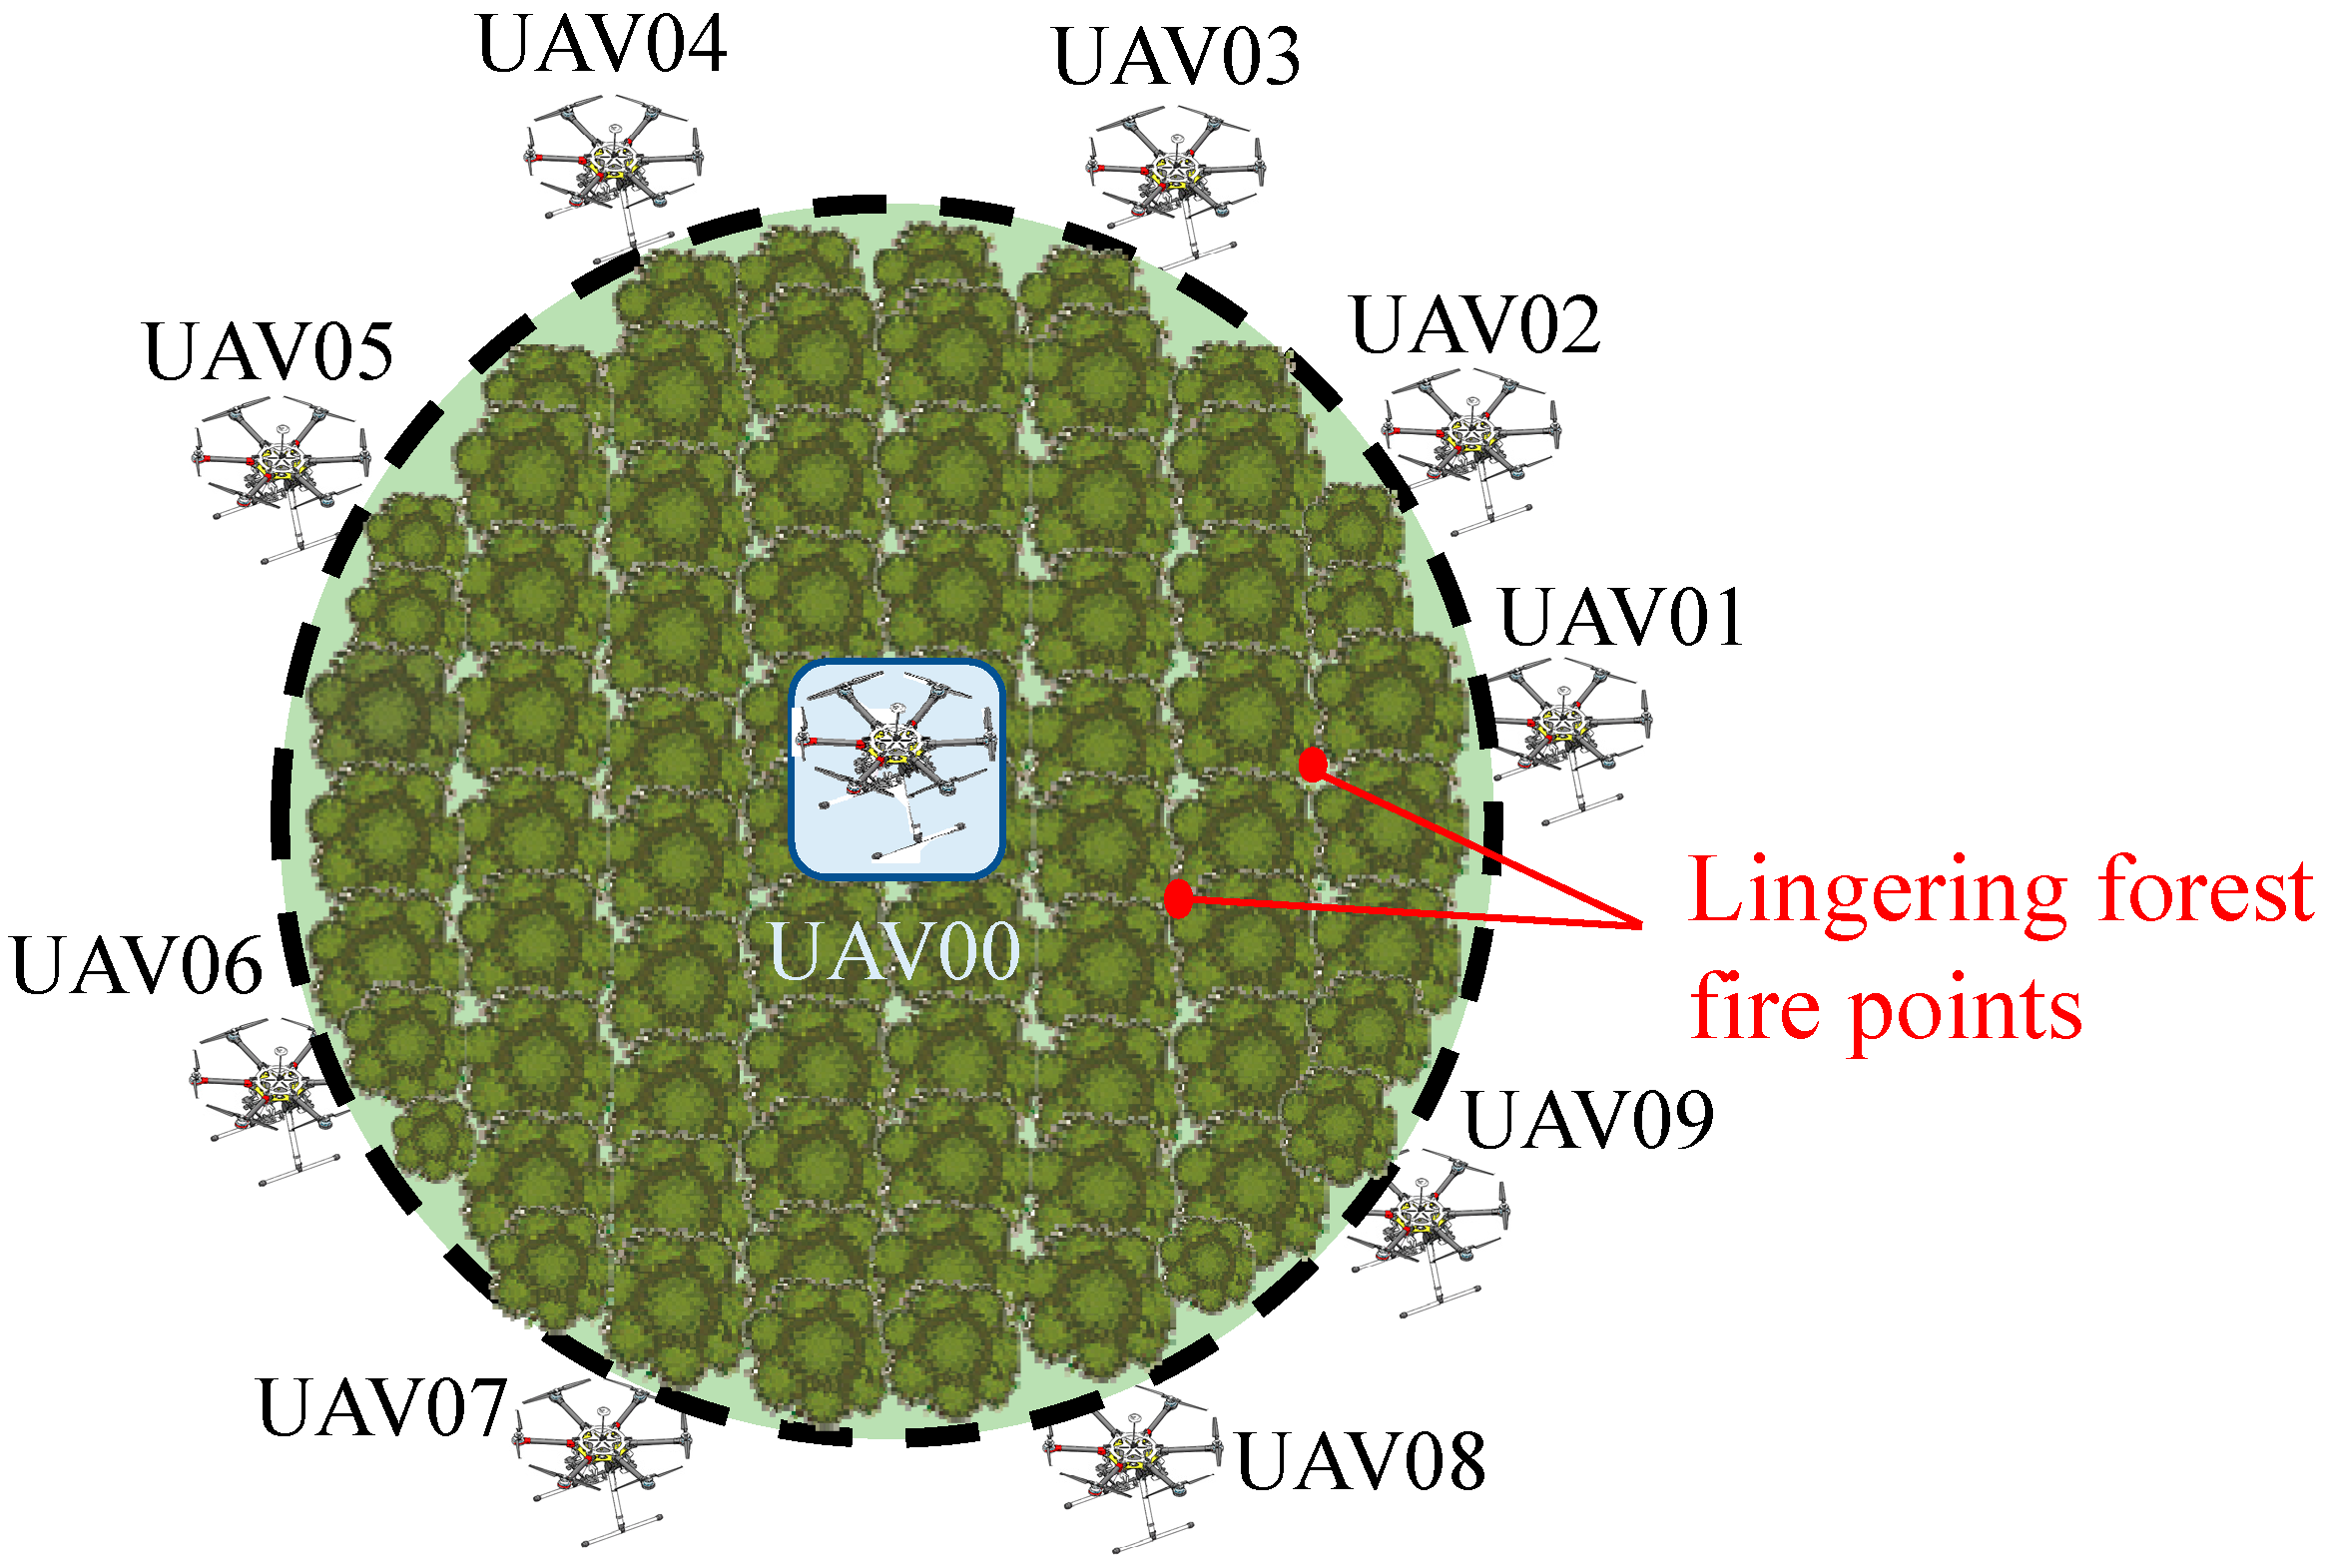
Figure 5.
Representation of real coordinates and estimated coordinates in the simulation. * represents the position coordinates of the signal-transmitting UAV. * represents the position coordinates of the signal-receiving UAV.
Figure 5.
Representation of real coordinates and estimated coordinates in the simulation. * represents the position coordinates of the signal-transmitting UAV. * represents the position coordinates of the signal-receiving UAV.

Figure 6.
Network structure diagram of the DQN algorithm.
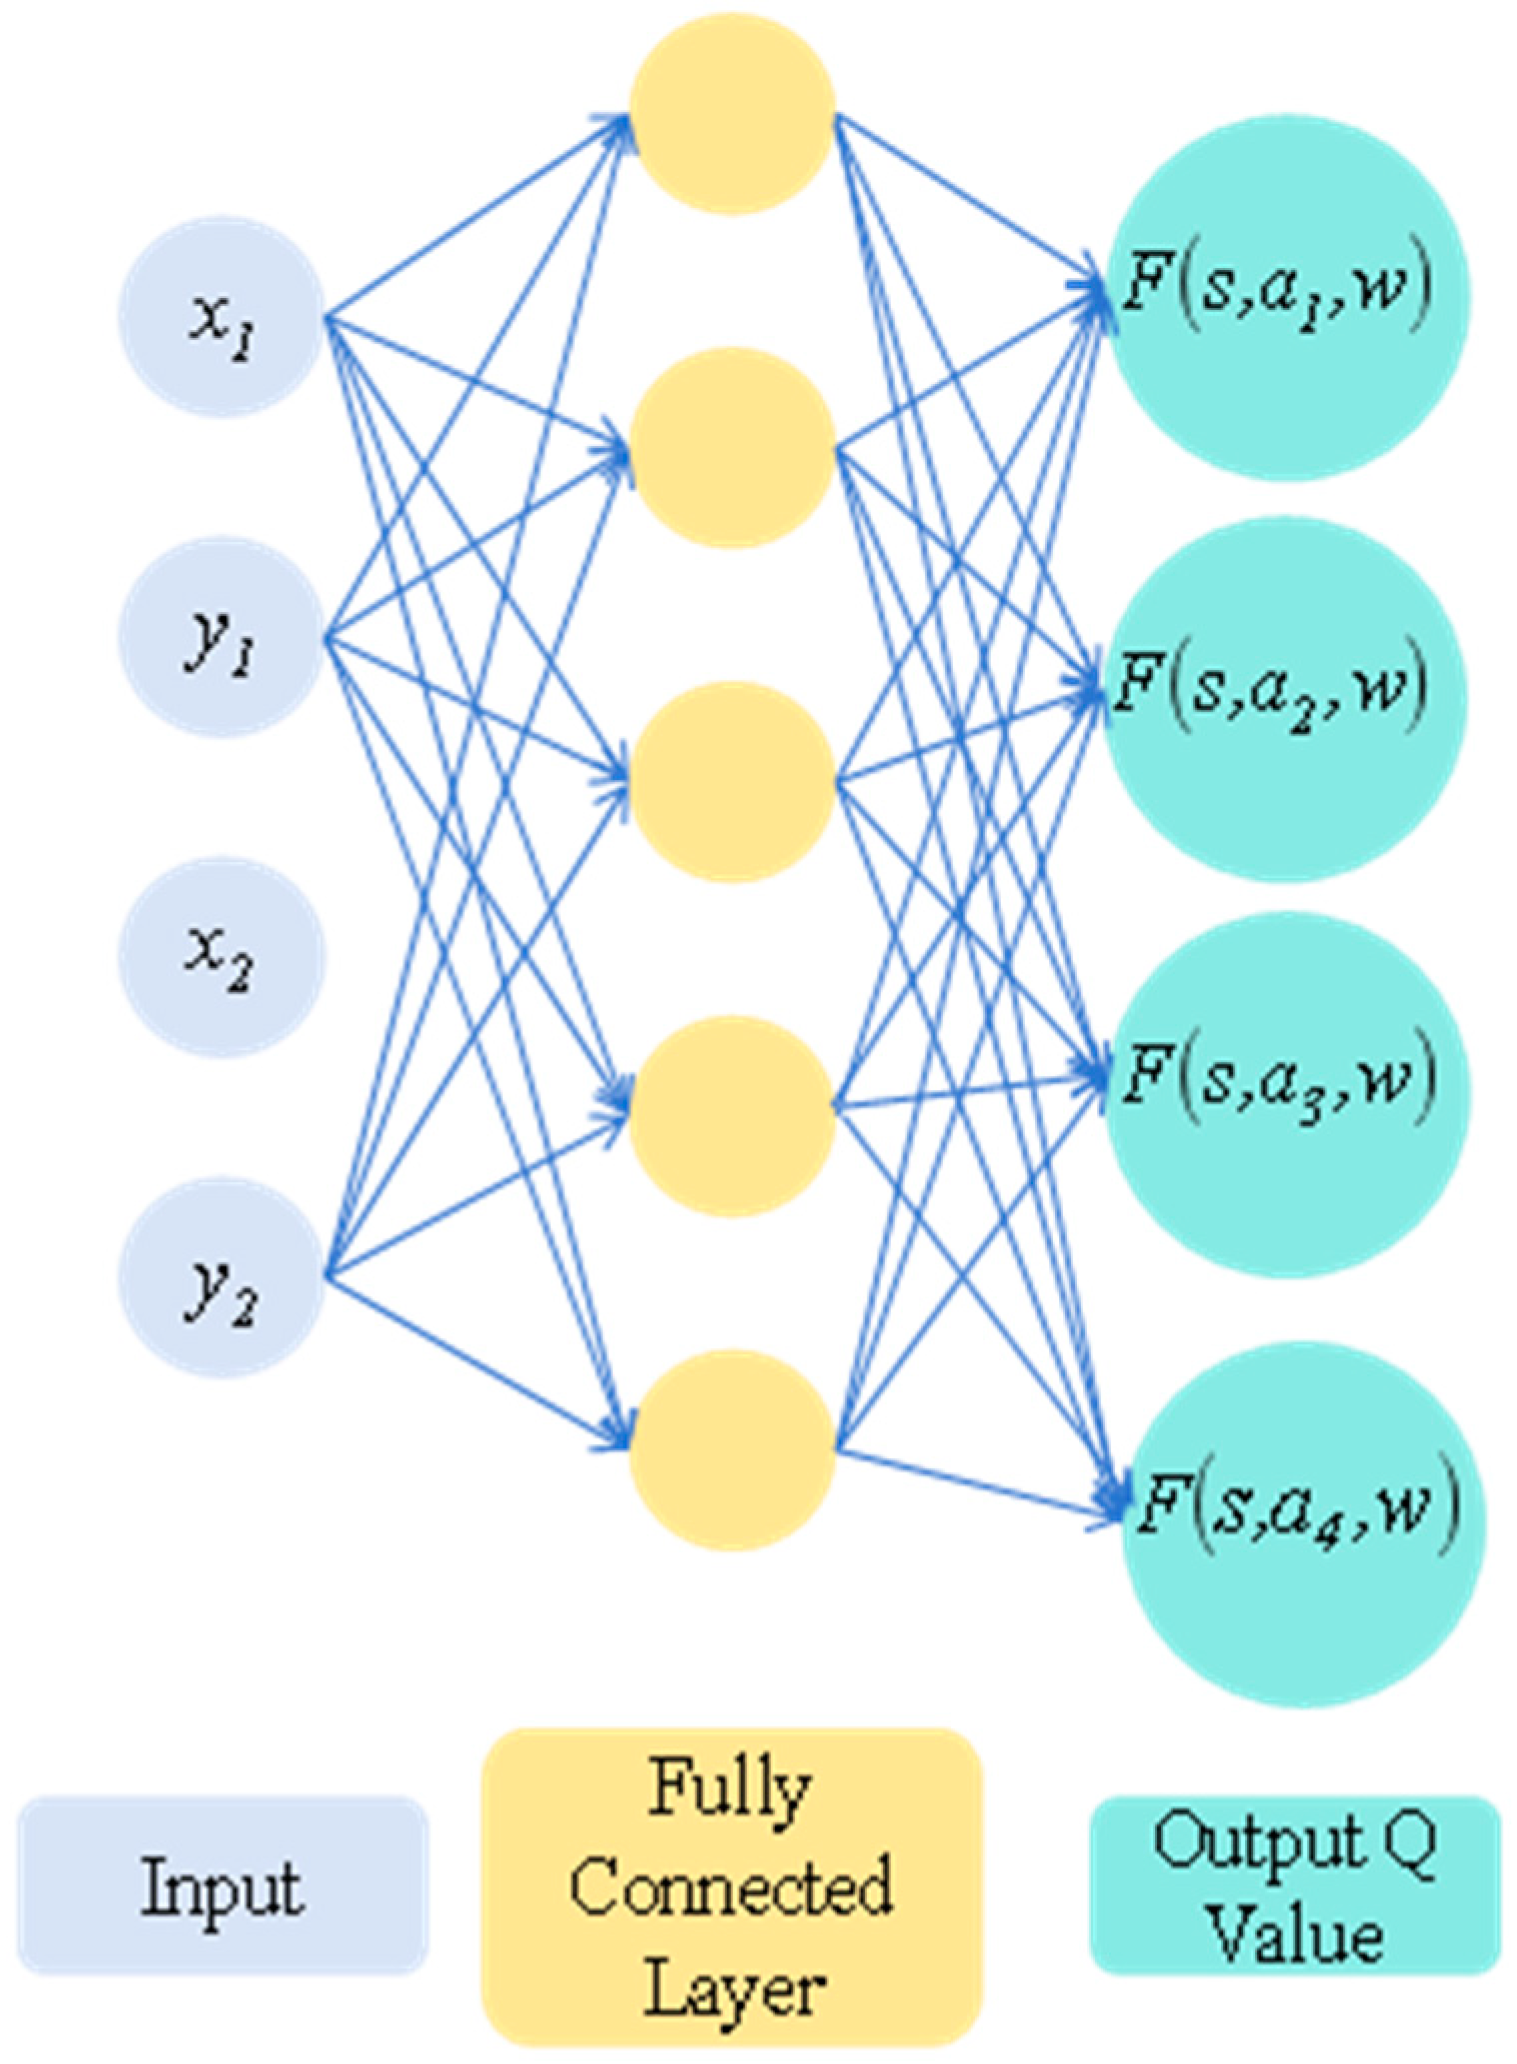
Figure 7.
DQN algorithm structure diagram.
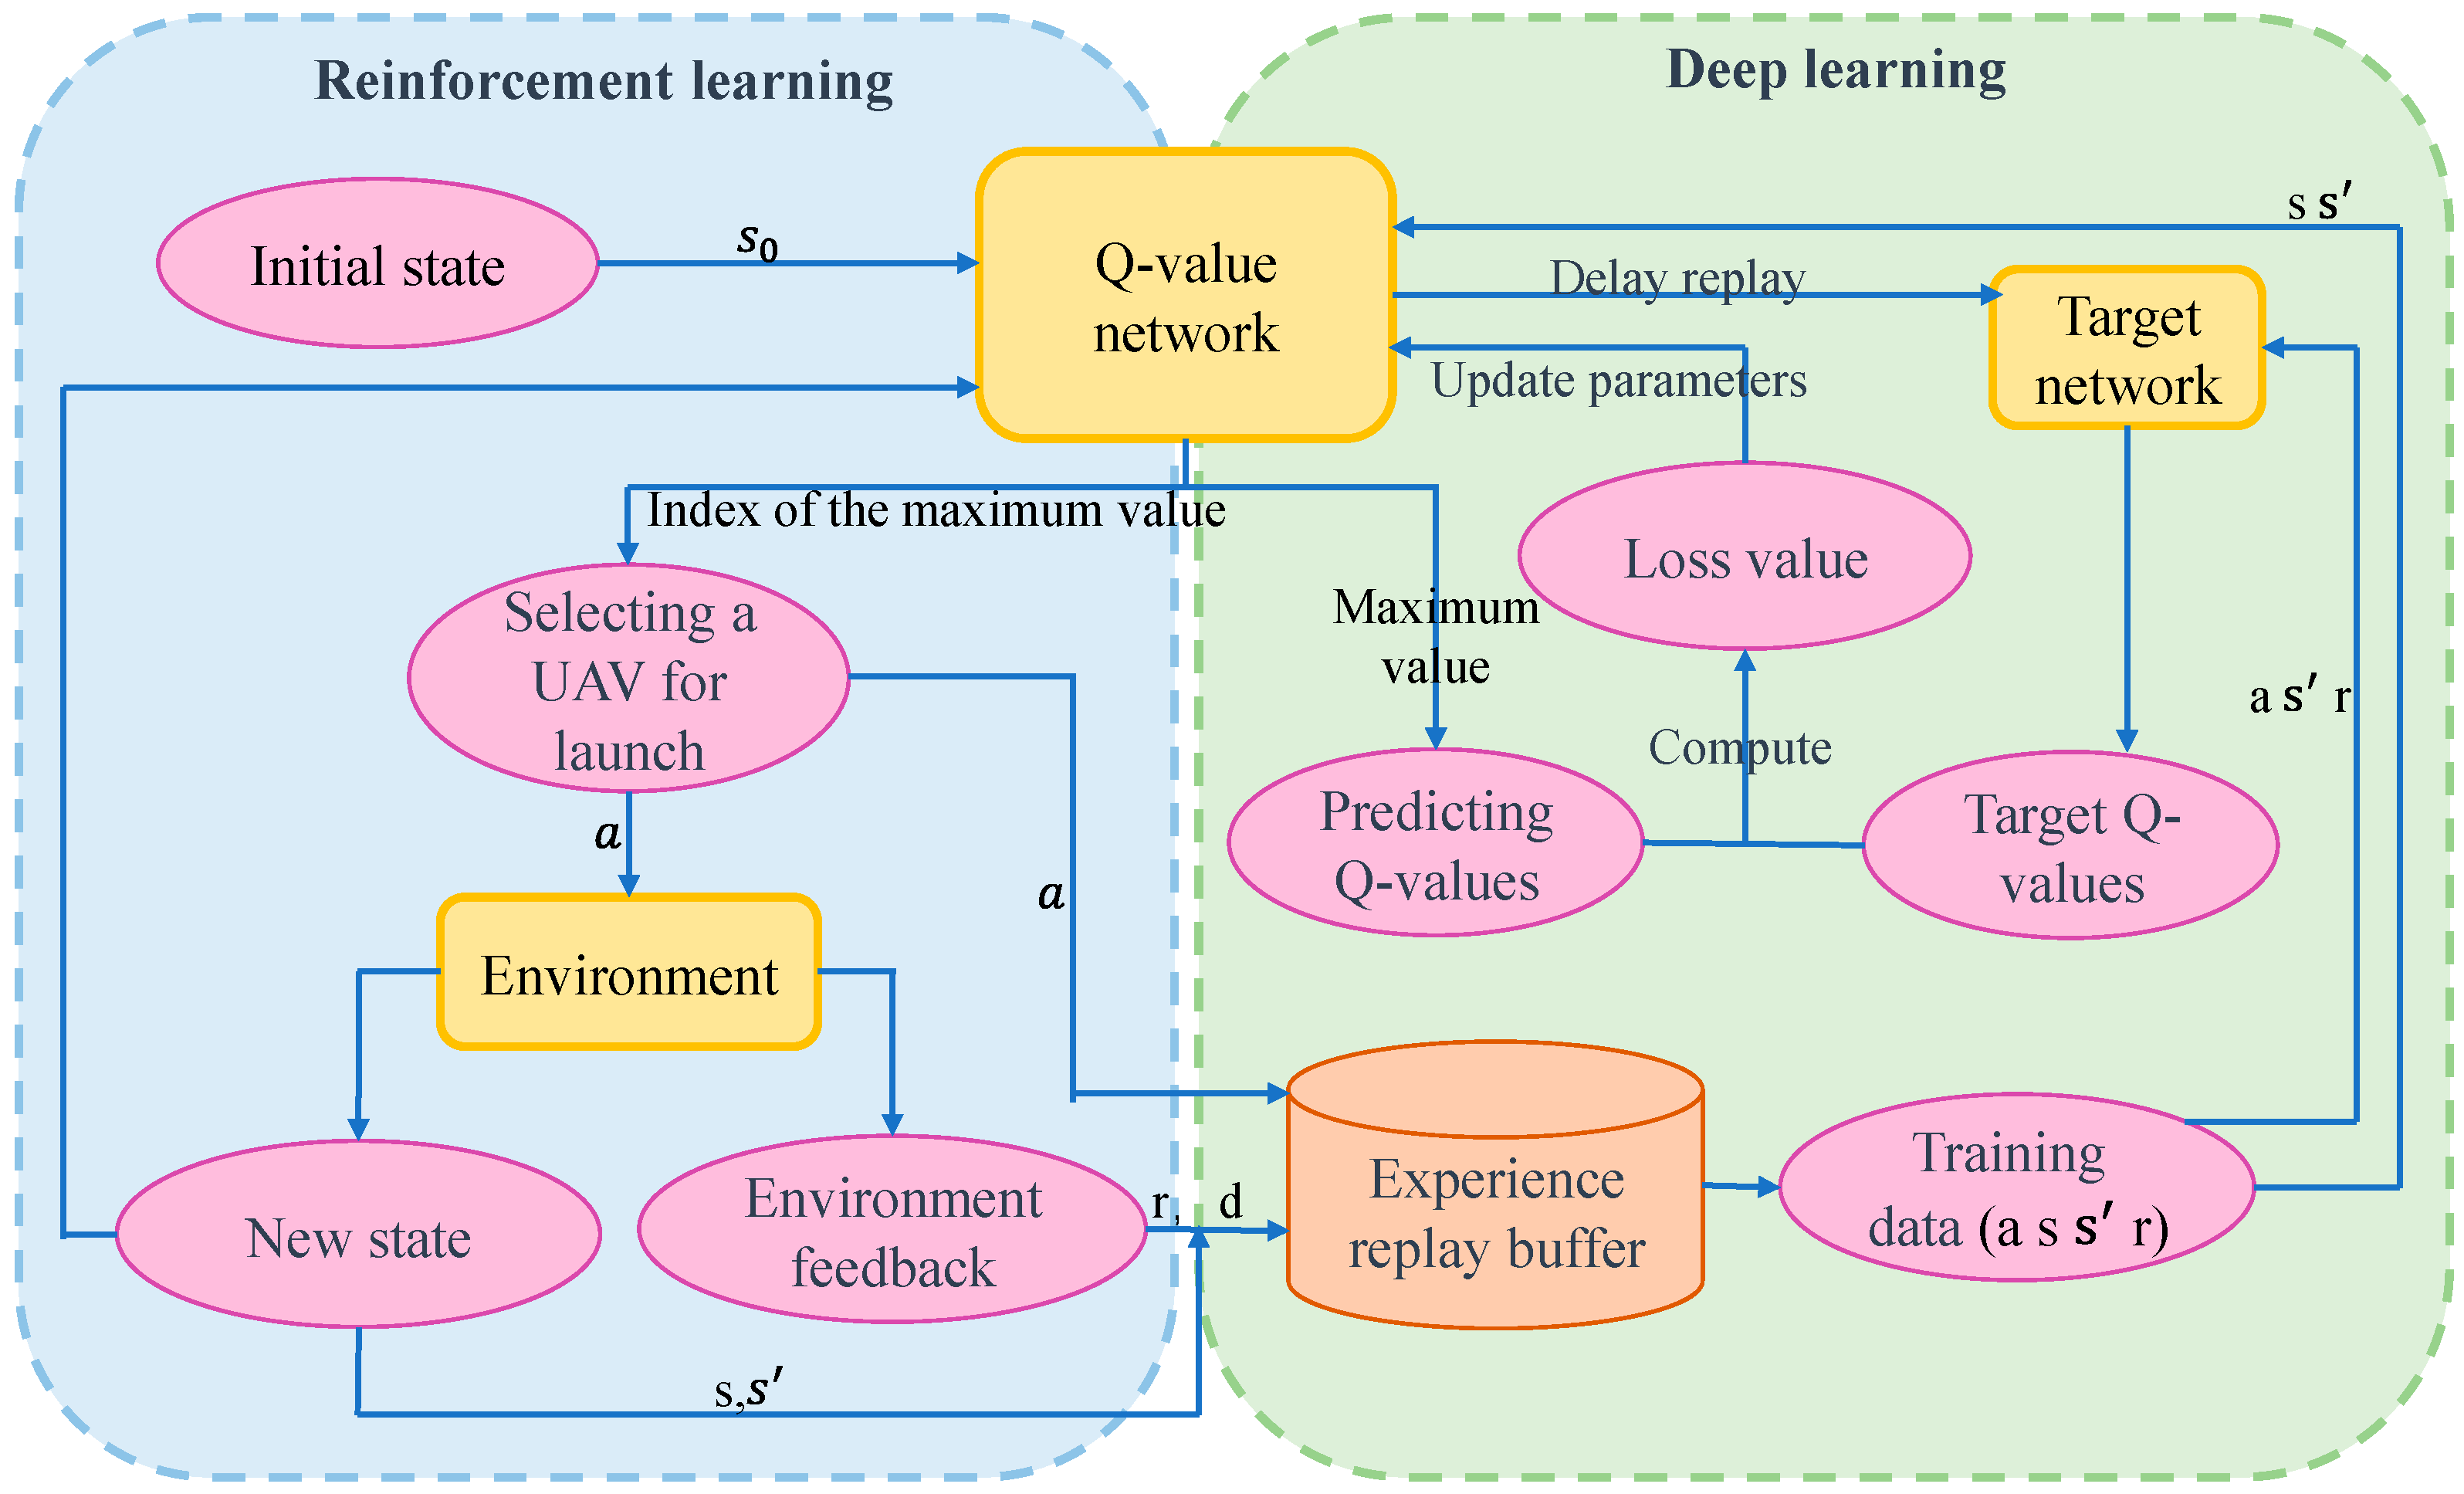
Figure 8.
Pareto frontier curve.
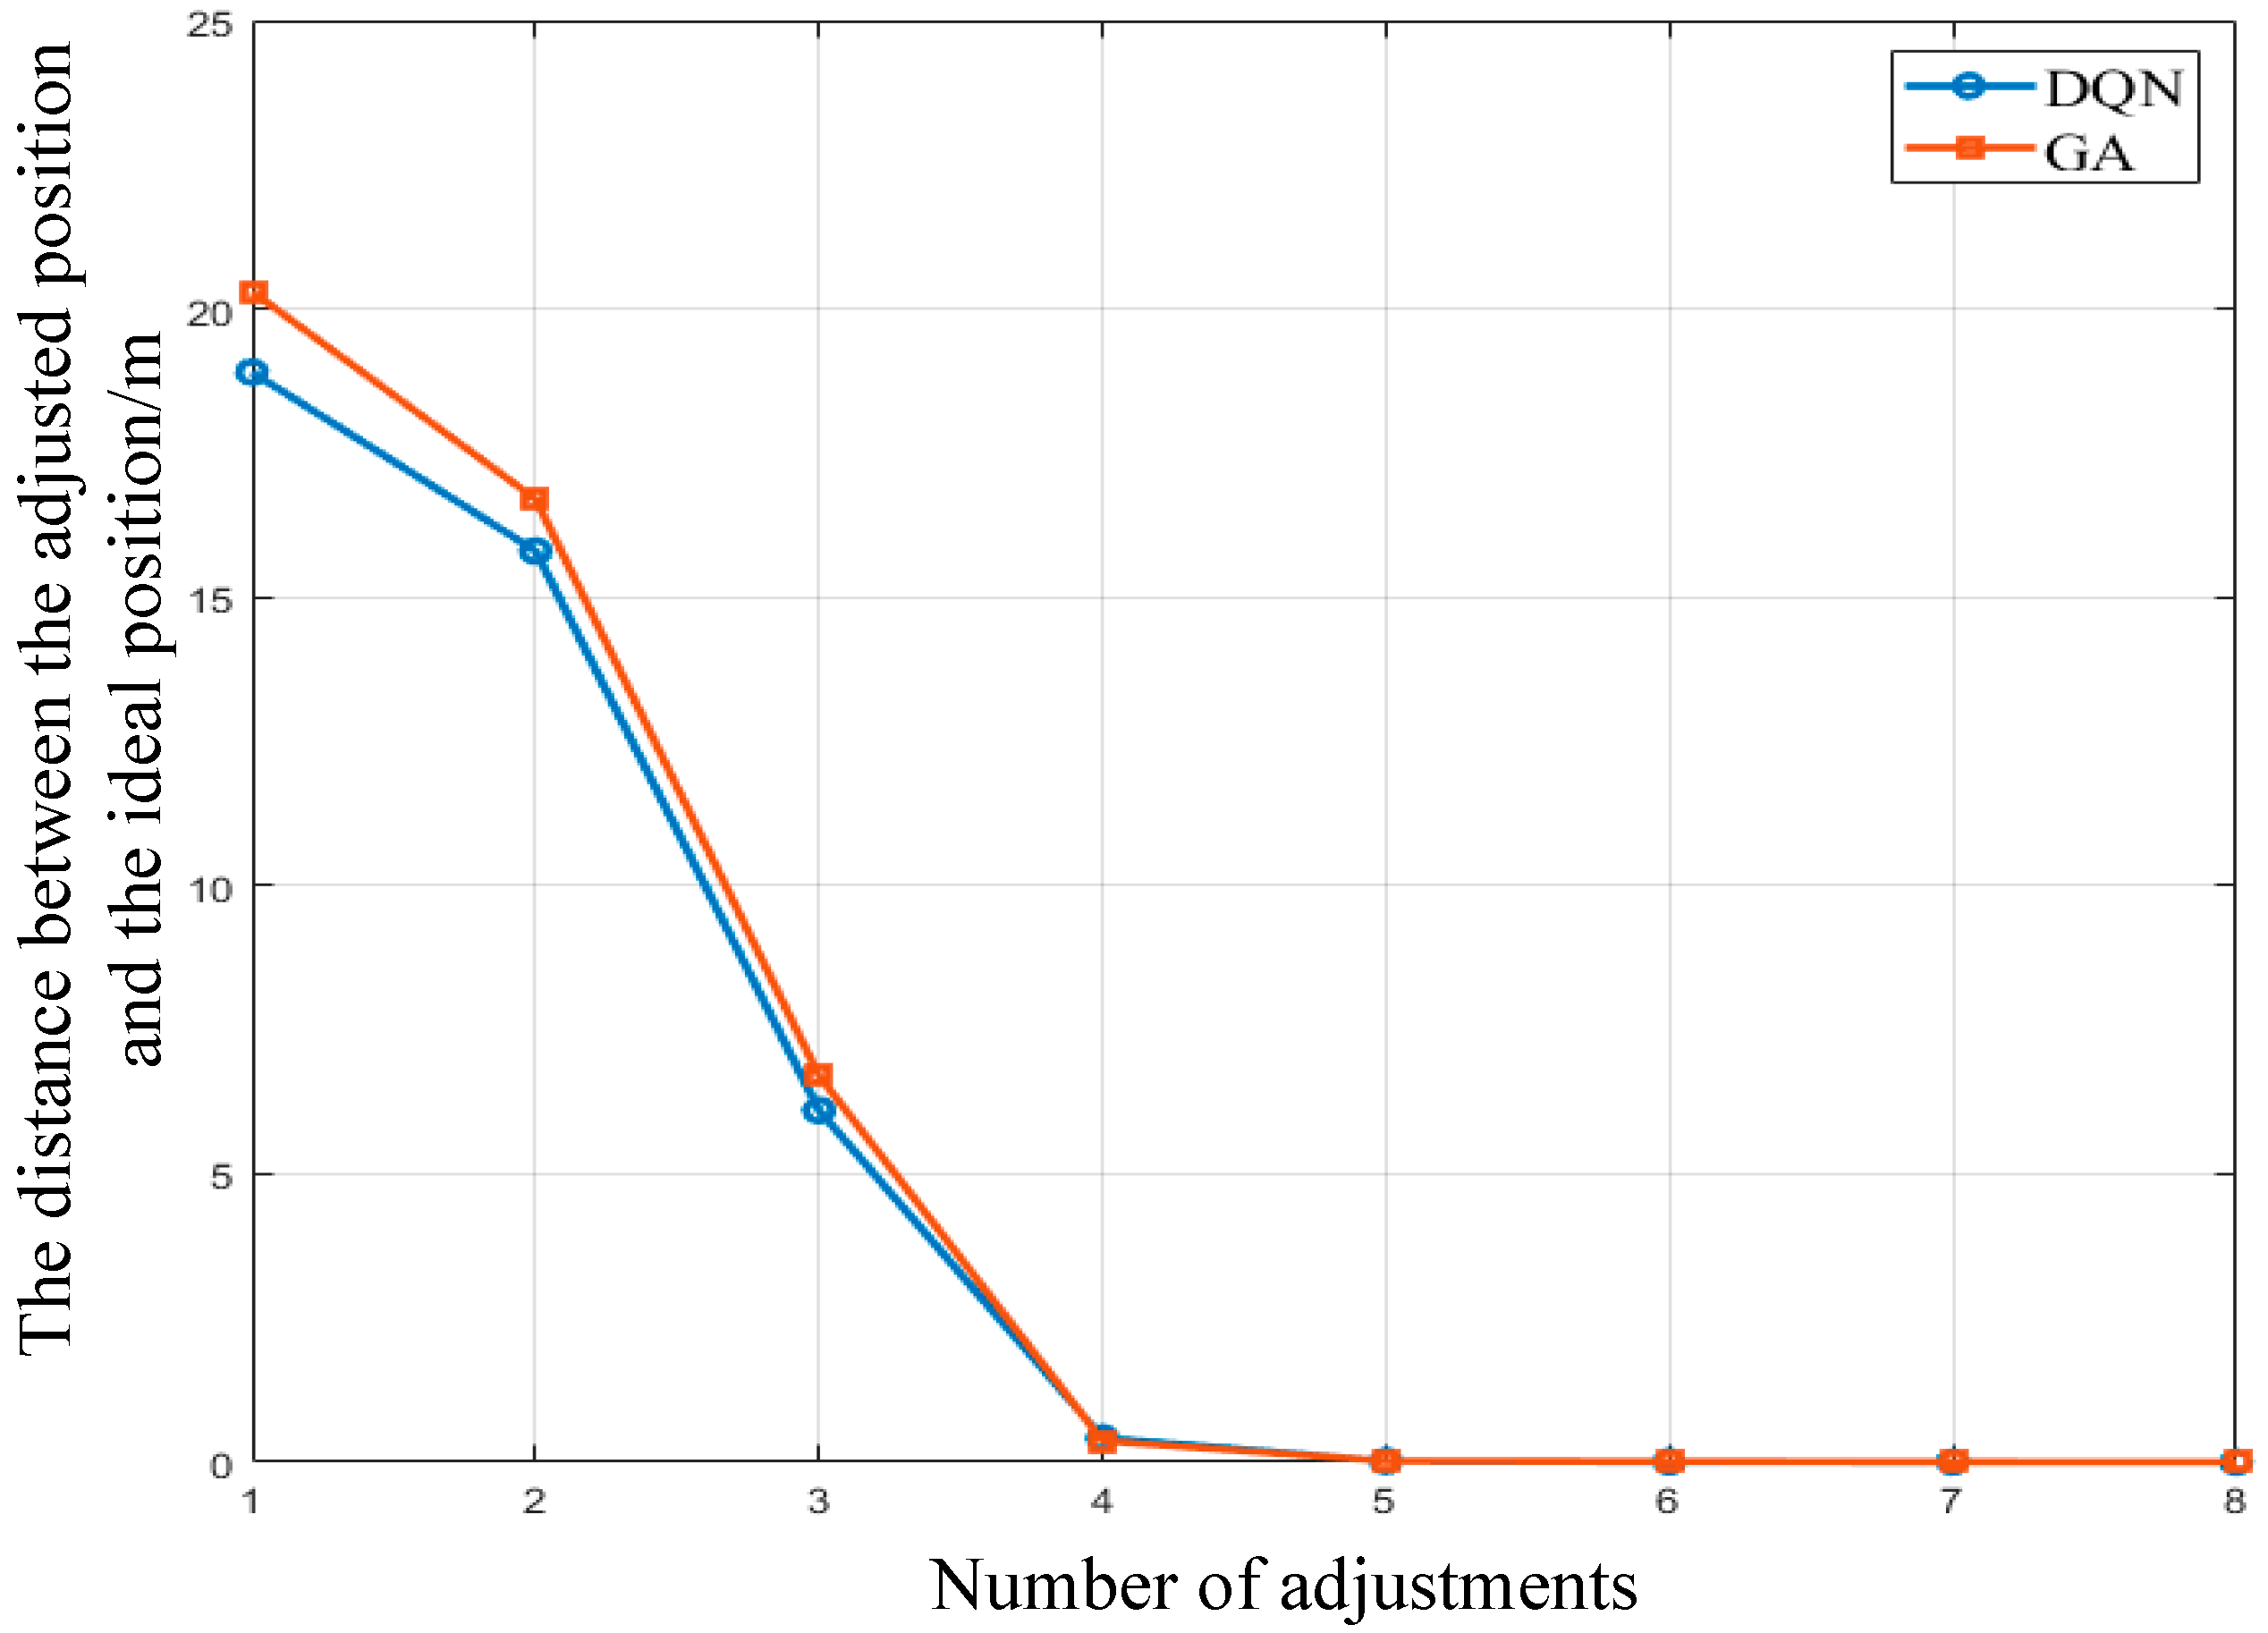
Figure 9.
Iteration curve adjusted for 5 rounds.


Table 1.
Comparison of real coordinates and estimated coordinates in the simulation.
| Number | Actual Coordinates | Estimated Coordinates |
|---|---|---|
| UAV 03 | (8.637, 96.572) | (8.637, 96.572) |
| UAV 04 | (−51.033, 83.919) | (−51.033, 83.919) |
| UAV 05 | (−88.699, 36.76) | (−88.699, 36.76) |
| UAV 06 | (−88.53, −25.545) | (−88.53, −25.545) |
| UAV 07 | (−40.545, −92.762) | (−40.545, −92.762) |
| UAV 08 | (10.142, −94.555) | (10.142, −94.555) |
| UAV 09 | (68.481, −63.771) | (68.481, −63.771) |
Table 2.
The parameter settings for the DQN algorithm.
| Parameter | Parameter Configuration |
|---|---|
| Learning rate | 0.001 |
| Batch size | 512 |
| Discount factor | 0.95 |
| Maximum capacity of the experience replay | 10,000 |
| Exploration factor | Exploration factor |
| Optimizer | Adam |
Table 3.
The initial positions of the drones.
| The Number of UAVs | The Initial Position is in Polar Coordinates (m,°) |
|---|---|
| 0 | (0, 0) |
| 1 | (100, 0) |
| 2 | (98, 40.10) |
| 3 | (112, 80.21) |
| 4 | (105, 119.75) |
| 5 | (98, 159.86) |
| 6 | (112, 119.96) |
| 7 | (105, 240.07) |
| 8 | (98, 280.17) |
| 9 | (112, 320.28) |
Table 4.
The ideal positions of the drones.
| The Number of UAVs | The Ideal Position is in Polar Coordinates (m,°) |
|---|---|
| 0 | (0, 0) |
| 1 | (100, 0) |
| 2 | (76.6, 64.2) |
| 3 | (17.3, 98.4) |
| 4 | (−50, 86.6) |
| 5 | (−93.9, 34.2) |
| 6 | (−93.9, −34.2) |
| 7 | (−50, −86.6) |
| 8 | (17.3, −98.4) |
| 9 | (76.6, −64.2) |
Table 5.
The settings of software and hardware parameters.
| Experimental Environment | Parameter Configuration |
|---|---|
| Cpu | Intel core i7 12700k |
| Gpu | Nvidia GeForce RTX3060 |
| RAM | 32 G |
| Hard disk | 1 TB |
| Programming environment | Python 3.9 |
| Version of Torch | 1.11.0 |
Table 6.
The comparison of time used.
| Types of Algorithms | CPU Time |
|---|---|
| DQN | 2.7 s |
| GA | 127.9 s |
Table 7.
The adjustment plan when the number of adjustment rounds is set to 5.
| Adjustment Round | 1 | 2 | 3 | 4 | 5 |
|---|---|---|---|---|---|
| Transmitting drones | [0, 1, 2] | [0, 1, 3] | [0, 1, 5] | [0, 1, 8] | [0, 1, 6] |
| Adjusted position of item 1. | (100, 0) | (100, 0) | (100, 0) | (100, 0) | (100, 0) |
| Adjusted position of item 2. | (74.9, 63.1) | (74.9, 63.1) | (76.4, 64.3) | (76.4, 64.3) | (76.6, 64.2) |
| Adjusted position of item 3. | (12.9, 95.6) | (12.9, 95.6) | (17.1, 98.3) | (17.1, 98.3) | (17.3, 98.4) |
| Adjusted position of item 4. | (−49.9, 82.5) | (−49.9, 83.3) | (−49.9, 86.2) | (−49.9, 86.7) | (−50, 86.6) |
| Adjusted position of item 5. | (−92.0, 33.7) | (−93.6, 34.0) | (−93.6, 34.0) | (−94.0, 34.2) | (−93.9, 34.2) |
| Adjusted position of item 6. | (−93.5, −33.9) | (−93.5, −33.9) | (−93.7, −34.0) | (−93.9, −34.2) | (−93.9, −34.2) |
| Adjusted position of item 7. | (−52.3, −90.9) | (−49.8, −91.7) | (−49.9, −86.3) | (−50, −86.5) | (−50, −86.6) |
| Adjusted position of item 8. | (17.3, −96.4) | (17.3, −96.4) | (17.2, −98.4) | (17.2, −98.4) | (17.3, −98.4) |
| Adjusted position of item 9. | (86.1, −71.5) | (86.1, −71.5) | (76.6, −64.2) | (76.6, −64.2) | (76.6, −64.2) |
Disclaimer/Publisher’s Note: The statements, opinions and data contained in all publications are solely those of the individual author(s) and contributor(s) and not of MDPI and/or the editor(s). MDPI and/or the editor(s) disclaim responsibility for any injury to people or property resulting from any ideas, methods, instructions or products referred to in the content. |
© 2024 by the authors. Licensee MDPI, Basel, Switzerland. This article is an open access article distributed under the terms and conditions of the Creative Commons Attribution (CC BY) license (https://creativecommons.org/licenses/by/4.0/).
Share and Cite
MDPI and ACS Style
Liu, W.; Lyu, S.-K.; Liu, T.; Wu, Y.-T.; Qin, Z. Multi-Target Optimization Strategy for Unmanned Aerial Vehicle Formation in Forest Fire Monitoring Based on Deep Q-Network Algorithm. Drones 2024, 8, 201. https://doi.org/10.3390/drones8050201
AMA Style
Liu W, Lyu S-K, Liu T, Wu Y-T, Qin Z. Multi-Target Optimization Strategy for Unmanned Aerial Vehicle Formation in Forest Fire Monitoring Based on Deep Q-Network Algorithm. Drones. 2024; 8(5):201. https://doi.org/10.3390/drones8050201
Chicago/Turabian StyleLiu, Wenjia, Sung-Ki Lyu, Tao Liu, Yu-Ting Wu, and Zhen Qin. 2024. "Multi-Target Optimization Strategy for Unmanned Aerial Vehicle Formation in Forest Fire Monitoring Based on Deep Q-Network Algorithm" Drones 8, no. 5: 201. https://doi.org/10.3390/drones8050201