
Measuring Surface Deformation of Asphalt Pavement via Airborne LiDAR: A Pilot Study

School of Transportation, Southeast University, Nanjing 211189, China
*
Author to whom correspondence should be addressed.
Drones 2023, 7(9), 570; https://doi.org/10.3390/drones7090570
Submission received: 2 August 2023
/
Revised: 27 August 2023
/
Accepted: 1 September 2023
/
Published: 5 September 2023
(This article belongs to the Special Issue Intelligent Processing and Application of UAV Remote Sensing Image Data)
Abstract
:Measuring the surface deformation of asphalt pavement and acquiring the rutting condition is of great importance to transportation agencies. This paper proposes a rutting measuring method based on an unmanned aerial vehicle (UAV) mounted with Light Detection and Ranging (LiDAR). Firstly, an airborne LiDAR system is assembled and the data acquisition method is presented. Then, the method for point cloud processing and rut depth computation is presented and the results of field testing are discussed. Thirdly, to investigate error factors, the laser footprint positioning model is established and sensitivity analysis is conducted. Factors including flight height, LiDAR instantaneous angel, and ground inclination angle are discussed. The model was then implemented to obtain the virtual rut depth and to verify the accuracy of the field test results. The main conclusions include that the measurement error increases with the flight height, instantaneous angle, and angular resolution of the LiDAR. The inclination angle of the pavement surface has adverse impact on the measuring accuracy. The field test results show that the assembled airborne LiDAR system is more accurate when the rut depth is significant. The findings of this study pave the way for future exploration of rutting measurement with airborne LiDAR.
1. Introduction
Rutting is one of the most concerning asphalt pavement distresses as it not only causes further damage to the performance of the pavement, but also directly affects driving safety and comfort [1,2,3,4]. Fast and accurate inspection of rutting is an important prerequisite for transportation agencies to make appropriate road maintenance decisions [5,6]. The development of rutting measurement techniques has therefore attracted many attentions from researchers and transportation agencies.
Automatic rutting detection technology mainly includes laser detection technology, digital image detection technology, automated close-range photogrammetry, and ultrasonic detection technology [7,8,9,10]. Tomasz Garbowskia and Tomasz Gajewski used a semi-automatic inspection tool for pavement conditions to conduct three-dimensional profile scanning [11]. Scholars proposed the method of combining a vehicle-mounted stereo camera and laser for pavement rutting detection, which eliminates the influence of external light [12]. Ultrasonic rutting detection technology was based on the principle of acoustic reflection to transmit acoustic waves to the road surface, achieving the rut depth according to the time difference in echo signal, which was easily affected by environmental noise [9].
The combination of unmanned aerial vehicle (UAV) and LiDAR technology provides the possibility of obtaining pavement information, which can save cost, im-prove detection efficiency, and realize multi-lane detection [13,14,15,16]. Zhong proposed a technical framework for automatic pavement crack detection based on point cloud data of mobile LiDAR MLS (mobile laser scanning), and used a precision measurement method to sample and check the experimental road section. It was found that the accuracy of transverse, longitudinal, and oblique cracks correctly extracted from the test data reached 96.55%, 87.09%, and 81.48%, respectively [17]. Hui selected 10 representative transverse profiles from 1100 actual transverse profiles that were acquired using a 13-point laser bar to simulate the impact of five different degrees of vehicle wandering on rut depth measurement accuracy [1]. A study by Gezero Luis and Antunes Carlos showed that the cross-sections based on averaged point cloud sensor profile aggregation was revealed to be the most suitable strategy to measure rut depth [18]. Li et al. explored the feasibility of pavement distress identification using low-altitude UAV with LiDAR and random forest classification (RFC) for a section of an asphalt road, which achieved an overall accuracy of 95.86%.
In order to improve the efficiency and accuracy of testing, and reduce the cost in time and money, contactless, real-time, and efficient pavement surface measurement approaches have become a necessary trend in future. Current research shows that it is feasible to use LiDAR for pavement detection, but few studies have proposed the application of airborne LiDAR in rutting detection. This paper presents a new road detection method based on UAV and LiDAR technology, and proposes a rut depth simulation method based on MATLAB to verify the rut depth result. This paper presents a pilot study of measuring asphalt pavement rutting via airborne LiDAR. The motivation for this study is to establish a fast and accurate rutting measurement technique that works for certain scenarios, such as localized pavement inspection or forensic investigation of pavement distresses. An airborne LiDAR system is firstly assembled and the data acquisition method is presented. Then, the method for point cloud processing and rut depth computation is presented and the field-testing result is discussed. Thirdly, the error factors are analyzed with the laser footprint positioning model.
2. Equipment and Data Acquisition
2.1. Airborne LiDAR System Assembly
The airborne LiDAR system was designed and assembled to obtain the altitude of the pavement surface based on the UAV platform. The system is composed of a six-rotor UAV, a 2D LiDAR sensor, a micro control unit (MCU) and data connecting cables. The assembled system is shown in Figure 1.
It is worth mentioning that to reduce the vibration effect on the 2D LiDAR sensor, vibration absorbers were installed on the mounting brackets. The 2D LiDAR power is supplied by the UAV batteries. The onboard MCU controls the data acquisition of the 2D LiDAR. The circuit diagram of the system is presented in Figure 2.
To monitor the position of the scanning line of the 2D LiDAR, a pair of laser pointers were installed under both sides of the wings. The positioning of the laser pointers was calibrated indoors, so that the red laser point emitted by the laser pointer was located on the intersection line between the scanning plane of the LiDAR and the surface of the scanned object.
2.2. Data Acquisition
A city road in the Jiangning District of Nanjing was selected as the test section. The selected road has severe rutting distress due to the heavy truck traffic passing through from a nearby industrial area. The assembled airborne LiDAR system was used for surface deformation data acquisition. Basic parameters of the system are shown in Table 1.
The assembled system was tested on the selected section with the UAV hovering above the pavement surface at a height of 10 m. A total of 15 transverse sections were marked and the actual rut depths were measured with the straightedge bar. The actual rut depths of the 15 sections are distributed between 0 and 50 mm. Figure 3 shows the marked test sections.
3. Method
This section describes the steps of processing point cloud data and computation of rut depth. The main steps include point cloud pre-processing, cross-sectional profiling, computation of rut depth, and correction. The data processing was completed on MATLAB.
3.1. Point Cloud Pre-Processing
The 2D LiDAR acquired point cloud data by line scanning the asphalt pavement surface with an internal laser sensor at 50 Hz. The collected point clouds were stored in frames and each frame contains point clouds in the scanning angle range of 190°. The collected data contain thousands of frames, and each frame consists of 3000 to 4000 cloud data points. Each point cloud data point contains an angle value and a distance value, which were stored in polar coordinates. The point clouds were pre-processed firstly for computation of rut depth.
3.1.1. Decimal and Coordinate Conversion
The raw point clouds are stored in hexadecimal and in polar coordinates. The first step in processing the data is to convert the data to decimal and Cartesian coordinates to facilitate subsequent data processing. The conversion of coordinates is achieved by following Equations (1) and (2), as shown in Figure 4.
where is the value of the data point in the direction of the x-axis in Cartesian coordinates; is the value of the data point in the direction of the y-axis in Cartesian coordinates; is the distance value; and is the angle value.
3.1.2. Denoising and Segmentation
The collected point clouds inevitably contain a large number of non-pavement points, which are noisy data for rut depth computation. Moreover, the obtained pavement surface elevation data points contain some anomalies, which need to be removed. Therefore, it is necessary to segment the pavement surface elevation data points and reduce noisy data.
Pavement Segmentation. Data points of the pavement are extracted by setting thresholds of the elevation to the flight altitude H. Data points with elevation value of H ± 0.1 m are kept for pavement rut computation. The non-pavement data points are removed, such as trees or pavement shoulders.
Noise Reduction. Further noise reduction is completed by setting the thresholds of the elevation to remove anomalies. The average elevation of the pavement is first computed. If the elevation is greater than 3 times the standard deviation, it is considered as an anomaly and is thereby removed.
The remaining data points are used for rut depth computation and the transverse profile of the asphalt pavement is then obtained. The selected test section has three lanes in one direction, and the elevation values of the target lane are obtained by extracting the data points within the width in the x direction.
3.1.3. Transverse Profile
The obtained discrete transverse data points are then fitted using the Smoothing Spline method. The principle of Smoothing Spline is to find the minimum Residual Sum of Squares (RSS), among which the fitting function f(x) among all functions where second-order continuous derivatives exist [19]. The governing equation of RSS is presented in Equation (3).
where is the error term; is the number of data points; and is the fitting function; is smoothing parameter.
The Smoothing Spline function in MATLAB employs a cost function similar to Equation (3), which is shown in Equation (4).
where is the weight (1 by default); is a parameter ranging from 0 to 1. The fitting curve is smoother as is smaller; the fitting curve tends to go through all data points as is greater.
To obtain the optimum fitting curve that fits the actual road surface profile, the value was tuned. It was found that the optimal range of value is 9 × 10⁻⁵ to 15 × 10−5. Figure 5 shows the illustration of the fitted curve.
3.2. Computation of Rut Depth
3.2.1. Selection of Computation Methods
After obtaining the transverse elevation profile of the asphalt pavement surface, the next step is to compute the rut depth. Commonly used methods for rut depth computation include the virtual straightedge method and virtual envelope method.
The virtual straightedge method, which simulates a straightedge on the lane cross-section profile, records the maximum vertical distance value between the road surface profile and the straightedge as the rut depth, as shown in Figure 6a; the virtual envelope line method, which simulates an envelope line on the lane cross-section profile, records the maximum vertical distance value between the road surface profile and the envelope line as the rut depth, as shown in Figure 6b.
These two methods lead to different rut depths on some occasions. Previous studies have shown that the difference between the two methods increases as the actual rut depth increases, where the straightedge method is closer to the actual rut depth [7]. The straightedge method is also recommended for automatic rut depth computation in the Specifications of Automated Pavement Condition Survey (JTG/T E61-2014) of China. Therefore, the virtual straightedge method was selected in this study.
3.2.2. Implementation of Virtual Straightedge Method
The automatic computation of rut depth using the straightedge method is implemented in MATLAB [20]. The computation algorithm is presented in Table 2. The following section gives a brief description of the procedures.
Firstly, the crest and trough of the transverse profile are determined by using the findpeaks function. The crest points and trough points are then arranged according to their corresponding ordinal numbers in the original data sequence from smallest to largest to obtain the crest point set and the trough point set , and let the two vectors contain m and n elements, respectively.
Secondly, the virtual straightedge is determined. If the value of the first crest point set is smaller than the value of the first trough point set , the first and the second crest points are connected to obtain the virtual straightedge R1, the second and the third crest points are connected to obtain the virtual ruler R2.
Finally, the vertical distance between each trough point and its corresponding virtual straightedge is then calculated and saved in the vector rut depth. Algorithm 1 illustrates the computation process using the virtual straightedge method.
| Algorithm 1: Rut depth computation | |||
| Input: the point set of road cross-section | |||
| Output: the rut depth of road cross-section | |||
| 1 | Fit with a spline curve ; | ||
| 2 | Find the crest point set of with findpeaks(); | ||
| 3 | Find the trough point set of with findpeaks(); | ||
| 4 | if then | ||
| 5 | Remove from ; | ||
| 6 | End | ||
| 7 | for each point in do | ||
| 8 | if < < then | ||
| 9 | Fit a linear equation with and ; | ||
| 10 | Compute the distance of and and record as in depth set ; | ||
| end | |||
| 11 | Find out the maximum point in as left rut depth; | ||
| 12 | Find out the second maximum point in as right rut depth. | ||
3.2.3. Correction of Pitch Angle
During the flight, the UAV was maintained on the course along the test road centerline. However, the UAV was subjected to different degrees of deviation from the planned course, reflected by the pitch, roll and yaw angles. The accuracy of the point cloud acquisition is consequently affected and requires correction. Among the three angles, yaw is assumed to remain constant, and pitch and roll angels require correction for rut depth computation.
When the roll angle is not zero, the road profile scanned by the LiDAR will tilt to a certain extent, and the method of correction is the same as that of correcting the transverse slope of the road arch. The principle of the angle rotation method is as follows: Firstly, all laser points on the rutted cross section are moved in the vertical direction by the same distance perpendicular to the X-axis until the endpoint closer to the X-axis falls on the X-axis to obtain the solid black line (Figure 7); at this time, the leftmost endpoint 1 of the rutted cross section is located on the X-axis and the rightmost endpoint is located above the X-axis. By connecting the endpoints on both sides of the rutted cross section, there is an angle between the line and the X-axis. And all the laser points on the rut curve are rotated clockwise by an angle with as the origin to obtain the new rutting pattern, as shown in the black dashed line (Figure 7). The corrected coordinates are calculated according to Equations (5)–(7).
where, (,) is the coordinates by the correction of roll angel; (,) is the original coordinates; (,0) is the coordinates of leftmost endpoint; (,) is the coordinates of rightmost endpoint; and α is the rotation angle.
The mounted 2D LiDAR is faced perpendicularly to the ground when the UAV is flying horizontally. Assuming the pitch angle of α, the actual rut depth of Dr and measured rut depth D can be described by Equation (8). The corrected surface profile is shown in Figure 8.
where, is the pitch angle of UAV; is the measured rut depth; is the actual rut depth.
4. Field Test Results
The 15 sections were measured with the airborne LiDAR system and the rut depths were computed using the virtual straightedge method. The measured and actual values are shown in Figure 9.
The accuracy of the measured rut depth is reflected by the degree to which the point deviates from the 45-degree straight line in Figure 9. As shown in Figure 9, the measured rut depths generally match the actual rut depths but are slightly higher. Possible explanations include the vibration of the UAV and the measurement error of the LiDAR. Although the pitch angle has been corrected, further errors still exist. A detailed error analysis was conducted and is presented in the next section.
This paper evaluated the detection accuracy by the coefficient of variation and relative error, according to Equations (9)–(11).
where is the standard deviation; is relative error; is the coefficient of variation; is the test result for each section; is the average of 10 calculations using the virtual ruler algorithm for each section; and is the manual measurement result.
The difference between the measured and actual values is more significant when the actual rut depths are smaller. The average difference between the measured and actual values is 25.1% in the range of 0 to 10 mm, while the difference is 6.6% in the range of 40 to 50 mm. This can be explained by the built-in range detection accuracy of the 2D LiDAR, which is 4 mm. When the rut depth is greater than 10mm, the value of is less than 4%, which meets the requirements of national standards. The built-in error is more significant when the rut depth is smaller. This shows that the airborne LiDAR system for rut depth measurement is feasible when the rut depth is significant, but not applicable for small rut depth measurements.
5. Analysis
The rut depth measurement accuracy of the assembled airborne LiDAR system is mainly composed of systematic error and random error, with systematic error being dominant. The sources of the systematic error include GPS positioning error, IMU (inertial measurement unit) error, laser footprint positioning error as well as errors caused by hardware systems, such as vibration of the UAV [21,22]. In this section, an error analysis is presented to investigate the measurement error of the system via MATLAB.
5.1. Laser Footprint Positioning Model
5.1.1. Model Description
The laser footprint positioning model of the airborne LiDAR was first established as shown in Figure 10 [23,24]. Point G (XG, YG, ZG) represents the LiDAR sensor and point P (XP, YP, ZP) represents the laser footprint. The distance between the sensor G and laser point P is denoted as S, and the distance between the sensor and the adjacent laser point Q (XQ, YQ, ZQ) is denoted as l. The distance between the two adjacent laser points is denoted as d, which is the point cloud spacing. The angle between GQ and z-axis is denoted as φ, and the angle between GP and GQ is denoted as θ. The yaw, roll, and pitch angles of the system are denoted as κ, α and ω, respectively.
The three-dimensional errors of any laser footprint P on a surface are given by Equation (12), based on the trigonometric relations and partial differential calculations.
where , , and are GPS location errors; , , and are attitude angle errors; and , , and are the laser footprint errors in x-, y-, and z-directions, respectively.
In addition, and are given by Equation (13).
where, is the laser ranging error; is the scanning angle error; and .
The above equations present the three-dimensional laser footprint positioning model on an even surface. In this study, the three-dimensional error analysis was simplified to two-dimensional with only x- and z-direction errors being considered. For the rut depth measurement, the surface is not even. Assuming the surface of the pavement has a slope with inclination angle of β, the laser footprint coordinates in the x- and z-direction change accordingly. The two-dimensional laser footprint positioning model can be derived by triangular transformation, as shown in Equation (14). Factors affecting the precision of the airborne system include laser measurement, scanning angle, UAV flight angle, altitude, and surface dip angle.
where is the ground inclination angle; is the instantaneous scanning angle; and and are the errors of laser footprint coordinates in x-direction and z-direction of uneven terrain, respectively.
5.1.2. Sensitivity Analysis
Sensitivity analysis was then conducted in MATLAB for the UAV flight height, LiDAR angular resolution, and ground inclination angle. The laser ranging error is 0.004 m. The attitude angle is 1° and the error is 0.005°. The GPS error is selected to be 0 in this case. Figure 11 presents the sensitivity analysis results.
Figure 11a shows that the positioning error increases as the flight altitude increases, since the distance from the sensor to the surface increases. When the flight height changes from 5 m to 20 m, measurement error in the x-direction is 4.2 times higher, whereas measurement error in the z-direction is only 2.7 times higher. It is indicated that the measurement error in the x-direction, which is in the scanning plane of the laser, is more susceptible to changes in the flight height, whereas the measurement error in the z-direction is less susceptible.
Figure 11b shows that the x-direction positioning error increases as the instantaneous angle increases, whereas the z-direction positioning error does not change with the instantaneous angle. When the instantaneous angle increases, the return laser pulse broadening increases and the positioning error increases as a result. The positioning error is smallest when the instantaneous angle is zero, as the return laser pulse broadening is zero.
Figure 11c shows that the positioning error increases with the ground inclination angle. The positioning error of uphill (mx-up, mz-up) ground surface is higher than downhill (mx-down, z-down). As the laser pulse is blocked by the slope, the signal-to-noise ratio decreases and therefore the positioning error increases.
5.2. Simulation of Surface Profile Measurement
5.2.1. 2D Model Assembly
Each lane section is composed of a large number of laser foot points, so the positioning error of a single laser foot point cannot fully describe the accuracy of LiDAR for rut depth. Based on the laser footprint positioning model, this section simulated the lane section fitting and rut depth calculation under different test conditions to verify the accuracy of the simulation model.
The airborne LiDAR system was simulated in MATLAB to further investigate the error factors. The sensor was simulated as a point with radial lines crossing the point, representing the laser pulses emitted by the LiDAR at the resolution of 0.167°. The pavement surface is created from actual surface elevation measurements with a width of 3.5 m, as shown in green lines in Figure 12. The distance from the Point A to pavement surface, representing the flight height, is set to be 5 m. The intersection of each laser beam and pavement surface is computed to represent the ideal laser footprints, as indicated by blue markers in Figure 12.
5.2.2. Creation of Virtual Laser Footprints
The coordinates obtained from the above steps are the laser foot point coordinates under ideal conditions, without considering the amplification effect of attitude angle error, laser ranging error, scanning angle error, instantaneous scanning angle size, UAV vibration, and UAV flight altitude [23], etc. The laser footprint positioning model is then implemented to obtain the error band of each laser beam to simulate the actual laser measurement condition. The scanning angle resolution and pavement surface inclination angle are the primary factors in this study, as they both affect the laser echo pulse width significantly when the airborne LiDAR is scanning the pavement surface [25,26].
The measurement errors in the x-direction and z-direction of each laser footprint are then obtained. The parameters used for computation with the laser footprint positioning model are presented in Table 2. The obtained errors in the x-direction and z-direction are then integrated on the original footprint in the rectangular error bands, as shown in Figure 13. The width and length of the rectangle are twice the error in the x-direction and z-direction, respectively, with the center being the original laser footprint.
The actual laser footprint coordinates are highly random because the coordinates are affected by UAV platform vibration, equipment integration error, and external environmental factors. The error of virtual laser footprints is controlled in 4 mm. The virtual laser footprint points are then created randomly within the error band rectangle as indicated by star markers in Figure 13.
5.2.3. Rut Depth Computation
The virtual laser footprints are then fitted and plugged in to the virtual straightedge method for rut depth computation. The final virtual transverse profile is indicated by the black line and the reference profile is indicated by the red line in Figure 14.
5.3. Parametric Analysis
5.3.1. UAV Flight Altitude
The collected surface elevation profiles on the test sections are plugged in to the virtual laser positioning model to generate the virtual laser footprints. Two sections are selected for this analysis with measured rut depths of 13.0 mm (left), 13.6 mm (right), 15.6 mm (left), and 23.0 mm (right), respectively. The parameters used for the model are presented in Table 2. Different flight altitudes were applied in the model, which are 5 m, 10 m, 15 m, 20 m, 25 m, and 30 m. Accuracy is calculated based on relative error as in Equation (15).
where, is relative error; and A is the accuracy. According to the Specification for Urban Road Detection Technology (DB50/T 395-2011) in China, the detection accuracy rate of automated testing equipment should not be less than 90%. The parameters of airborne LiDAR can be adjusted to meet the required accuracy.
The obtained rut depth measurement and virtual rut depth accuracies are presented in Figure 15 and Figure 16.
Figure 15 and Figure 16 show that as the UAV flight altitude increases, the measured and predicted rut depth measurement accuracies decrease. The predicted rut depth measurement results show the same trend with the actual measurement, indicating that the laser footprint positioning model is highly accurate. This can be explained by the laser footprint positioning model that, as the height of the sensor increases, the length and width of the laser foot point error area gradually increase, indicating that the location error of each laser foot point in the X and Y directions gradually becomes larger. On the other hand, the angular resolution of the LiDAR always remains the same when the flight altitude increases, which leads to a gradual decrease in the number of laser foot points falling on the target lane section [27,28].
For the two selected sections, it was found that for the heavily rutted section, the accuracy range of the predicted value was about 72.0–99.1%, and the accuracy range of the measured results was about 73.9–98.2%. For the lightly rutted section, the predicted value varies in the range of 64.7–97.1%, and the measured value varies in the range of 53.1–92.1%. The results show that the assembled airborne LiDAR system is more accurate when the actual rut depth is greater.
5.3.2. LiDAR Angular Resolution
LiDAR angular resolution refers to the pointing accuracy of the radar laser beam. When its internal laser rotation transmitting and receiving modules work, the angle between the laser beams in one scanning cycle is the angular resolution. The angular resolution determines the accuracy of the surface contour of the object scanned by the LiDAR. The smaller the angular resolution, the more point clouds are contained in each frame, when other parameters are kept constant.
In this section, the parameters of the original model are adjusted to simulate test accuracy in different angular resolutions from the MATLAB platform. During the test, the angular resolution of the LiDAR was continuously adjusted, within the range of 0.167~0.667°. The simulation model results were compared and analyzed with the actual field measurement data to further elucidate the relationship between rutting simulation accuracy and LiDAR angular resolution. The results are presented in Figure 17.
The simulation results in Figure 17 show that the accuracy of rut depth gradually decreases as the angular resolution of the LiDAR increases. The main reason is that the angular resolution determines the distribution density of the laser point cloud data, higher density leads to a better fitted actual lane cross section curve.
For the left rut, when the LiDAR angular resolution was 0.167°, the accuracy of both the output of the simulation model and the LiDAR measurement were above 90%; when the LiDAR angular resolution was increased to 0.517°, the accuracy of both the simulation model results and the LiDAR measurement were below 80%.
For the right rut, when the LiDAR angular resolution was between 0.167° and 0.417°, the accuracy of both the simulation model results and the LiDAR measurement were both above 90%; when the LiDAR angular resolution was increased to 0.517°, the accuracy of both the simulation model results and the LiDAR measurement were both below 90%. Compared with the left rut, the test accuracy of the right rut decreases more slowly with the increase of LiDAR angular resolution, mainly due to the fact that both the simulation model and the LiDAR measurement were more effective for heavy rutting.
6. Conclusions
The primary conclusion of this pilot study is that measuring surface deformation of asphalt pavement via airborne LiDAR is feasible but the accuracy needs improvement. There are many factors affecting the measurement accuracy of airborne LiDAR. The general sources of error come from three parts, which are the UAV flight attitude, the LiDAR itself, and the pavement surface condition. The measurement error increases with the flight height as less point clouds are detected. The measurement error increases with instantaneous angle and the angular resolution of the LiDAR. The inclination angle of the pavement surface has an adverse impact on the measurement accuracy. The field test results show that the assembled airborne LiDAR system is more accurate when the rut depth is significant. For lighter rutting, the accuracy of this system is limited.
Several problems exist in this study that are worth exploring further. Firstly, the field data was acquired with the UAV hovering. The in-flight data acquisition is affected by the flight speed as well as flight control, etc. The motion errors need to be incorporated in the laser footprint positioning model. Secondly, the measurement accuracy is also affected by factors such as water gathered on the road surface or road surface texture. Further analysis of these factors is needed in future studies.
It is concluded that measuring asphalt pavement surface deformation with LiDAR is limited due to its own ranging resolution being about 4 mm, which is below typical automatic rutting measurement error tolerance. However, it does show several advantages over the traditional, vehicle-mounted laser measuring method, including high mobility, low cost, light weight, rapid detection, and simple equipment maintenance. LiDAR as a time-of-flight ranging technique is rapidly growing technique. It is expected that with improvements in LiDAR accuracy as well as UAV flight stability, airborne LiDAR pavement surface deformation detection will be more realistic.
Author Contributions
Conceptualization, J.Z.; data curation, Y.G. and S.J.; formal analysis, J.Z., Y.G., S.H. and T.B.; investigation, Y.G. and T.B.; methodology, J.Z. and Y.G.; writing—original draft, S.H.; writing—review and editing, J.Z. and T.B. All authors have read and agreed to the published version of the manuscript.
Funding
This research was funded by the National Key Research and Development Project of China, grant number 2021YFB2600603 and the National Natural Science Foundation of China, grant number 52208428.
Data Availability Statement
All data, models, and code generated or used during the study appear in the submitted article.
Conflicts of Interest
The authors declare no conflict of interest.
References
- Hui, B.; Tsai, M.; Guo, M.; Liu, X. Critical assessment of the impact of vehicle wandering on rut depth measurement accuracy using 13-point based lasers. Measurement 2018, 123, 246–253. [Google Scholar] [CrossRef]
- Dettenborn, T.; Hartikainen, A.; Korkiala-Tanttu, L. Pavement Maintenance Threshold Detection and Network-Level Rutting Prediction Model based on Finnish Road Data. J. Infrastruct. Syst. 2020, 26, 04020016. [Google Scholar] [CrossRef]
- Qiu, S.; Wang, K.C.P.; Zhang, A.; Li, Q.; Moravec, M.M. A comprehensive system for AASHTO PP69-10-based pavement rut evaluation using 1-mm 3D pavement surface model. Int. J. Pavement Eng. 2016, 19, 489–501. [Google Scholar] [CrossRef]
- Chen, J.; Huang, X.; Zheng, B.; Zhao, R.; Liu, X.; Cao, Q.; Zhu, S. Real-time identification system of asphalt pavement texture based on the close-range photogrammetry. Constr. Build. Mater. 2019, 226, 910–919. [Google Scholar] [CrossRef]
- Gao, R.; Zhang, X.; Sun, Q.; Sun, M.; Zhao, Q. Road pavement monitoring and roughness assessment based on UAV LiDAR data. J. Basic Sci. Eng. 2018, 26, 681–696. [Google Scholar]
- Zhu, J.; Zhong, J.; Ma, T.; Huang, X.; Zhang, W.; Zhou, Y. Pavement distress detection using convolutional neural networks with images captured via UAV. Autom. Constr. 2022, 133, 103991. [Google Scholar] [CrossRef]
- Ordonez, C.; Chuy, O.Y.; Collins, E.G.; Liu, X. Laser-based rut detection and following system for autonomous ground vehicles. J. Field Robot. 2011, 28, 158–179. [Google Scholar] [CrossRef]
- Serigos, P.A.; Prozzi, J.A.; de Dortier Smit, A.; Murphy, M.R. Evaluation of 3D Automated Systems for the Measurement of Pavement Surface Cracking. J. Transp. Eng. 2016, 142, 05016003. [Google Scholar] [CrossRef]
- Han, J.; Cui, L.; Shi, S. Road rut detection system with embedded multi-channel laser sensor. Int. J. Adv. Manuf. Technol. 2021, 122, 41–50. [Google Scholar] [CrossRef]
- Garbowski, T.; Pożarycki, A. Multi-level backcalculation algorithm for robust determination of pavement layers parameters. Inverse Probl. Sci. Eng. 2017, 25, 674–693. [Google Scholar] [CrossRef]
- Garbowski, T.; Gajewski, T. Semi-automatic inspection tool of pavement condition from three-dimensional profile scans. Procedia Eng. 2017, 172, 310–318. [Google Scholar] [CrossRef]
- Liu, X.; Wang, P.; Lu, Z.; Gao, K.; Wang, H.; Jiao, C.; Zhang, X. Damage Detection and Analysis of Urban Bridges Using Terrestrial Laser Scanning (TLS), Ground-Based Microwave Interferometry, and Permanent Scatterer Interferometry Synthetic Aperture Radar (PS-InSAR). Remote Sens. 2019, 11, 580. [Google Scholar] [CrossRef]
- Poorazimy, M.; Shataee, S.; McRoberts, R.E.; Mohammadi, J. Integrating airborne laser scanning data, space-borne radar data and digital aerial imagery to estimate aboveground carbon stock in Hyrcanian forests, Iran. Remote Sens. Environ. 2020, 240, 111669. [Google Scholar] [CrossRef]
- Cremonini, R.; Moisseev, D.; Chandrasekar, V. Airborne laser scan data: A valuable tool with which to infer weather radar partial beam blockage in urban environments. Atmos. Meas. Tech. 2016, 9, 5063–5075. [Google Scholar] [CrossRef]
- Bu, T.; Zhu, J.; Ma, T. A UAV photography-based detection method for defective road marking. J. Perform. Constr. Facil. 2022, 36, 04022035. [Google Scholar] [CrossRef]
- Zhu, C.; Zhu, J.; Bu, T.; Gao, X. Monitoring and identification of road construction safety factors via UAV. Sensors 2022, 22, 8797. [Google Scholar] [CrossRef]
- Zhong, M.; Sui, L.; Wang, Z.; Hu, D. Pavement Crack Detection from Mobile Laser Scanning Point Clouds Using a Time Grid. Sensors 2020, 20, 4198. [Google Scholar] [CrossRef]
- Gézero, L.; Antunes, C. Road Rutting Measurement Using Mobile LiDAR Systems Point Cloud. ISPRS Int. J. Geo-Inf. 2019, 8, 404. [Google Scholar] [CrossRef]
- Zhang, D.; Zou, Q.; Lin, H.; Xu, X.; He, L.; Gui, R. Automatic pavement defect detection using 3D laser profiling technology. Autom. Constr. 2018, 96, 350–365. [Google Scholar] [CrossRef]
- Xiao, Y.; Tang, L.; Xie, J. Calculation Method of Permanent Deformation of Asphalt Mixture Based on Interval Number. Materials 2021, 14, 2116. [Google Scholar] [CrossRef] [PubMed]
- Simpson, J.; Smith, T.; Wooster, M. Assessment of Errors Caused by Forest Vegetation Structure in Airborne LiDAR-Derived DTMs. Remote Sens. 2017, 9, 1101. [Google Scholar] [CrossRef]
- Guo, K.; Li, Q.; Mao, Q.; Wang, C.; Zhu, J.; Liu, Y.; Xu, W.; Zhang, D.; Wu, A. Errors of Airborne Bathymetry LiDAR Detection Caused by Ocean Waves and Dimension-Based Laser Incidence Correction. Remote Sens. 2021, 13, 1750. [Google Scholar] [CrossRef]
- Ren, H.; Yan, Q.; Liu, Z.; Zuo, Z.; Xu, Q.; Li, F.; Song, C. Study on analysis from sources of error for Airborne LIDAR. IOP Conf. Ser. Earth Environ. Sci. 2016, 46, 012030. [Google Scholar] [CrossRef]
- Peng, T.; Lan, T.; Ni, G. Motion error analysis of the 3D coordinates of airborne lidar for typical terrains. Meas. Sci. Technol. 2019, 24, 074018. [Google Scholar] [CrossRef]
- Wu, H.; Lan, T.; Zhang, X.; Liu, H.; Zhang, G. Effect of airborne LiDAR platform’s vibration on laser pointing accuracy. Chin. J. Lasers 2015, 42, s108001. [Google Scholar]
- Wang, D. Point-Based Laser Rut Detection Technology on Depth Algorithm Contrast and Offset Error Research. Ph.D. Thesis, Chang’an University, Xi’an, China, 2014. [Google Scholar]
- Ministry of Transport. Specifications of Automated Pavement Condition Survey; China Communications Press: Beijing, China, 2014. (In Chinese)
- Ma, H.; Wu, J. Analysis of positioning errors caused by platform vibration of airborne LiDAR system. In Proceedings of the 2012 8th IEEE International Symposium on Instrumentation and Control Technology (ISICT) Proceedings, London, UK, 11–13 July 2012; pp. 257–261. [Google Scholar] [CrossRef]
Figure 1.
Configuration of the airborne LiDAR system.
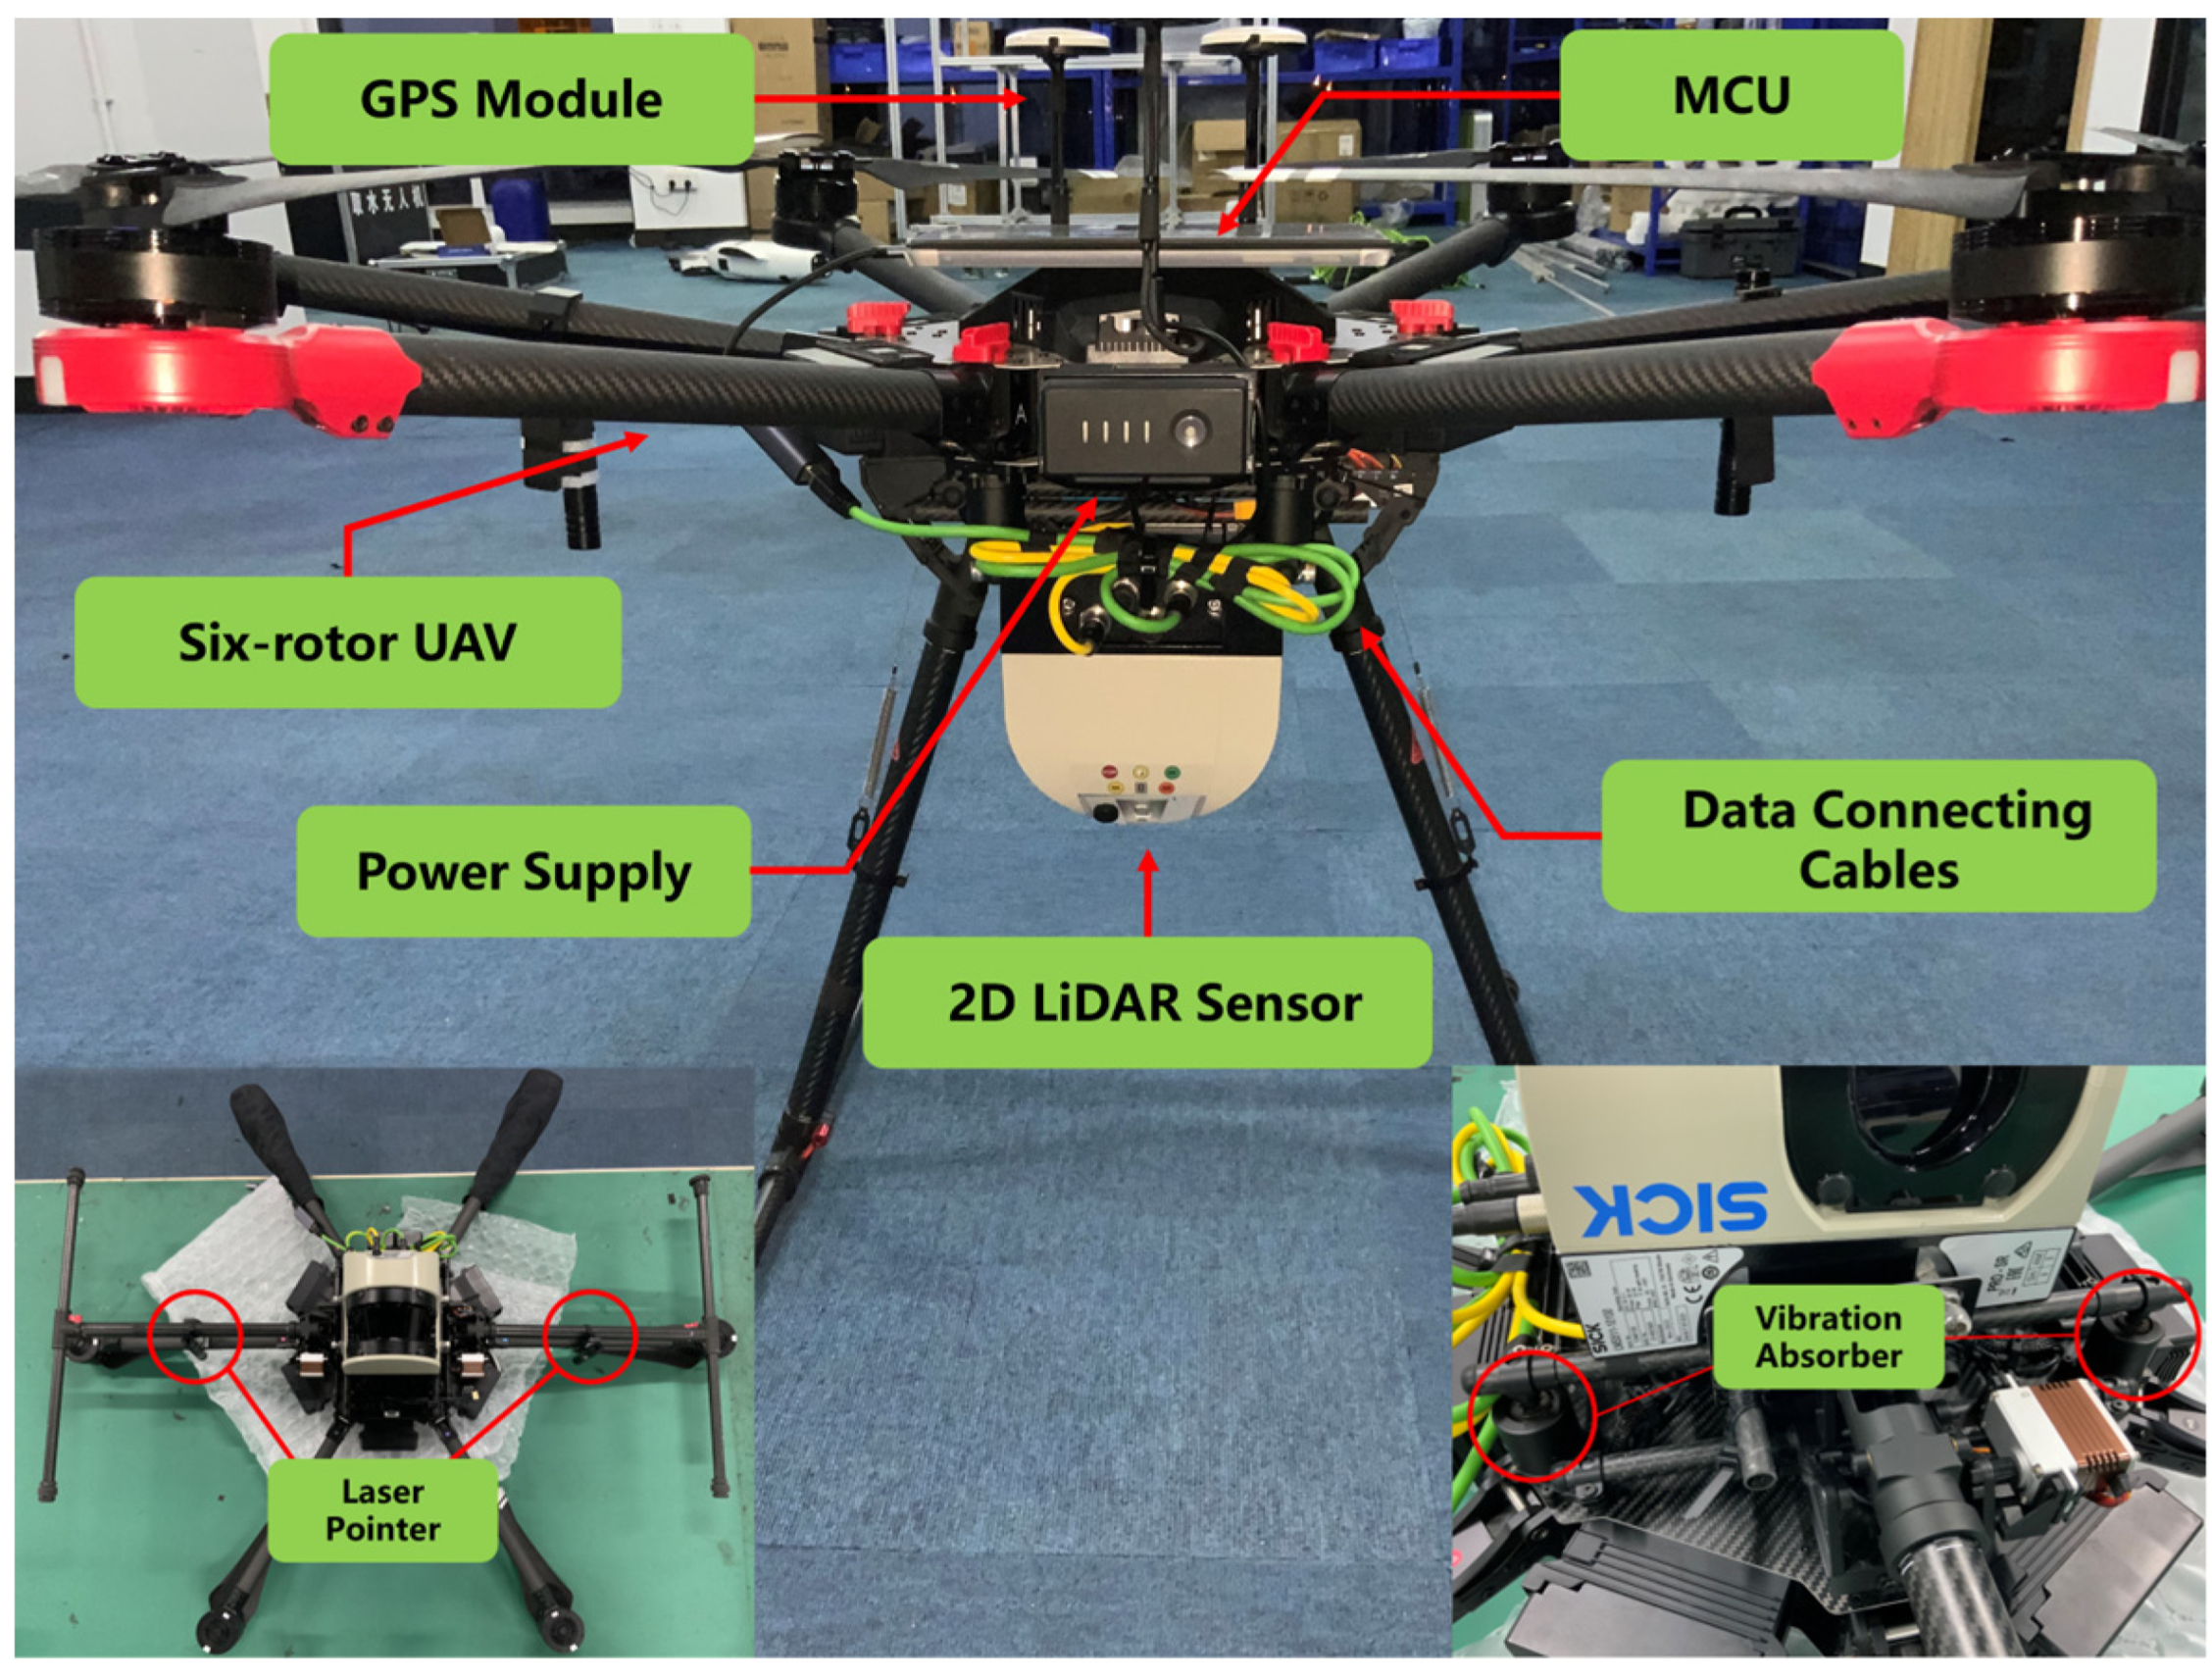
Figure 2.
Circuit diagram of the airborne LiDAR system.
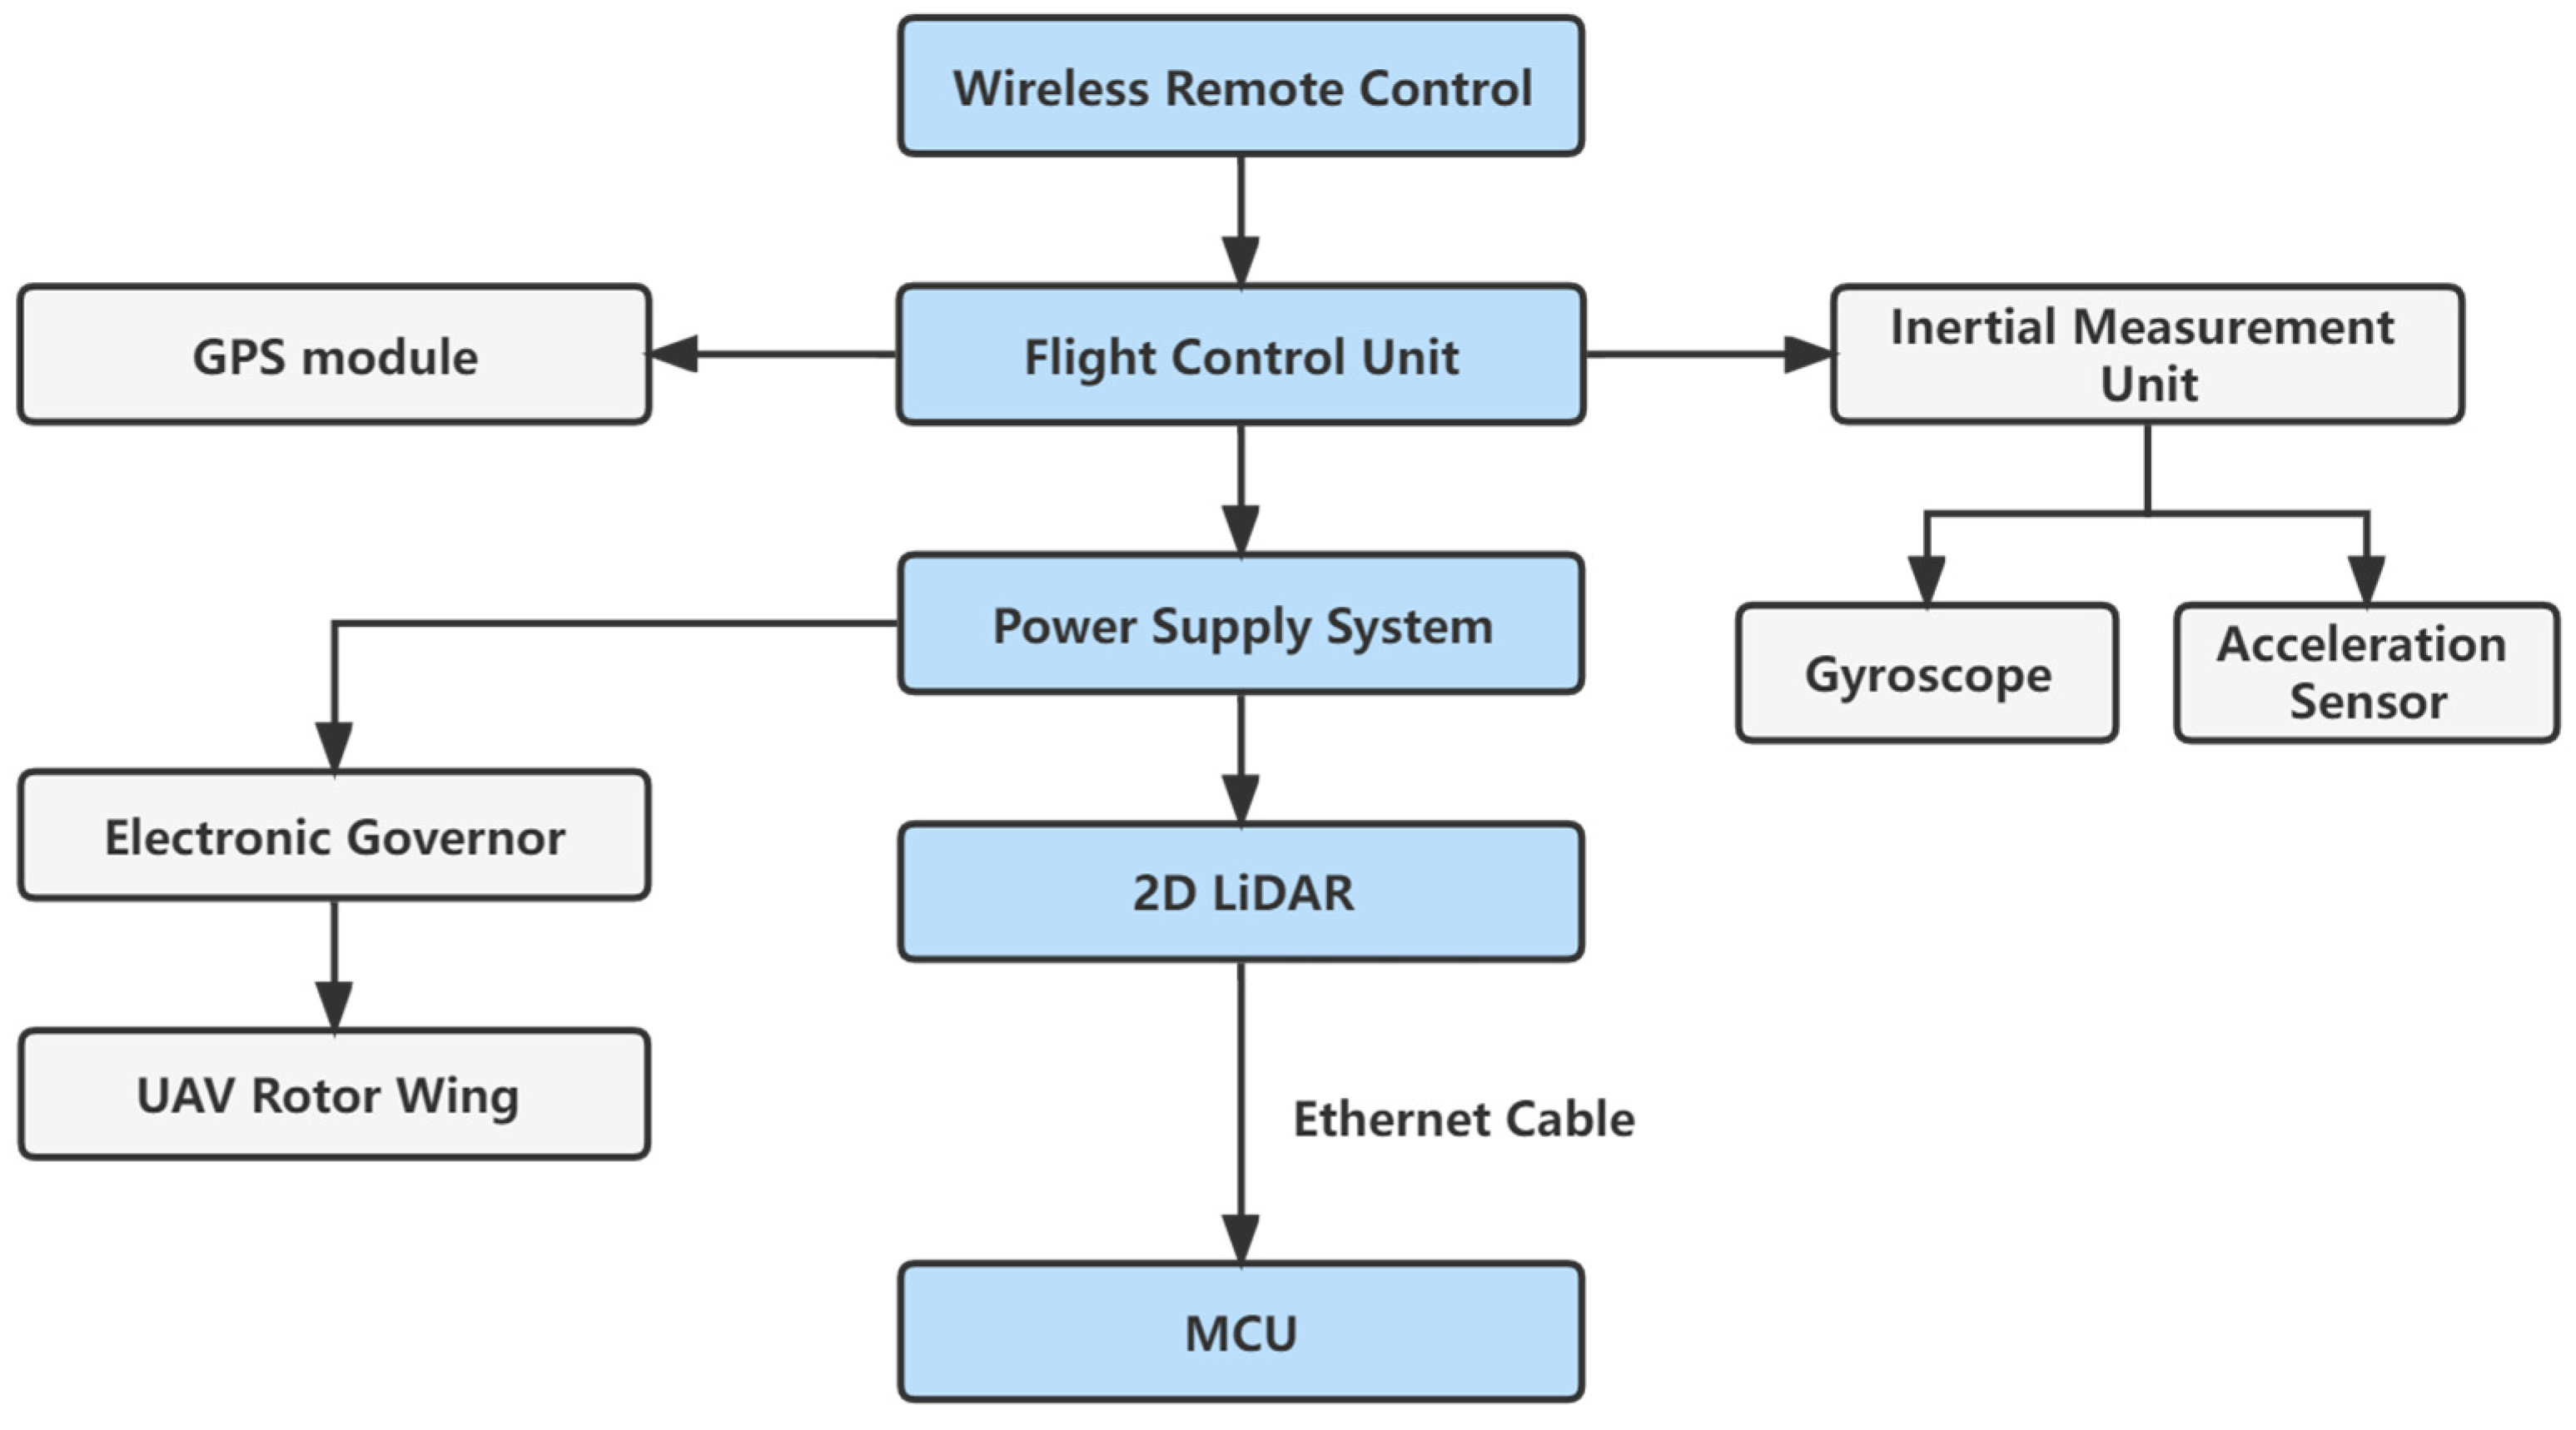
Figure 3.
Marked test sections.

Figure 4.
Sketch of coordinate conversion.
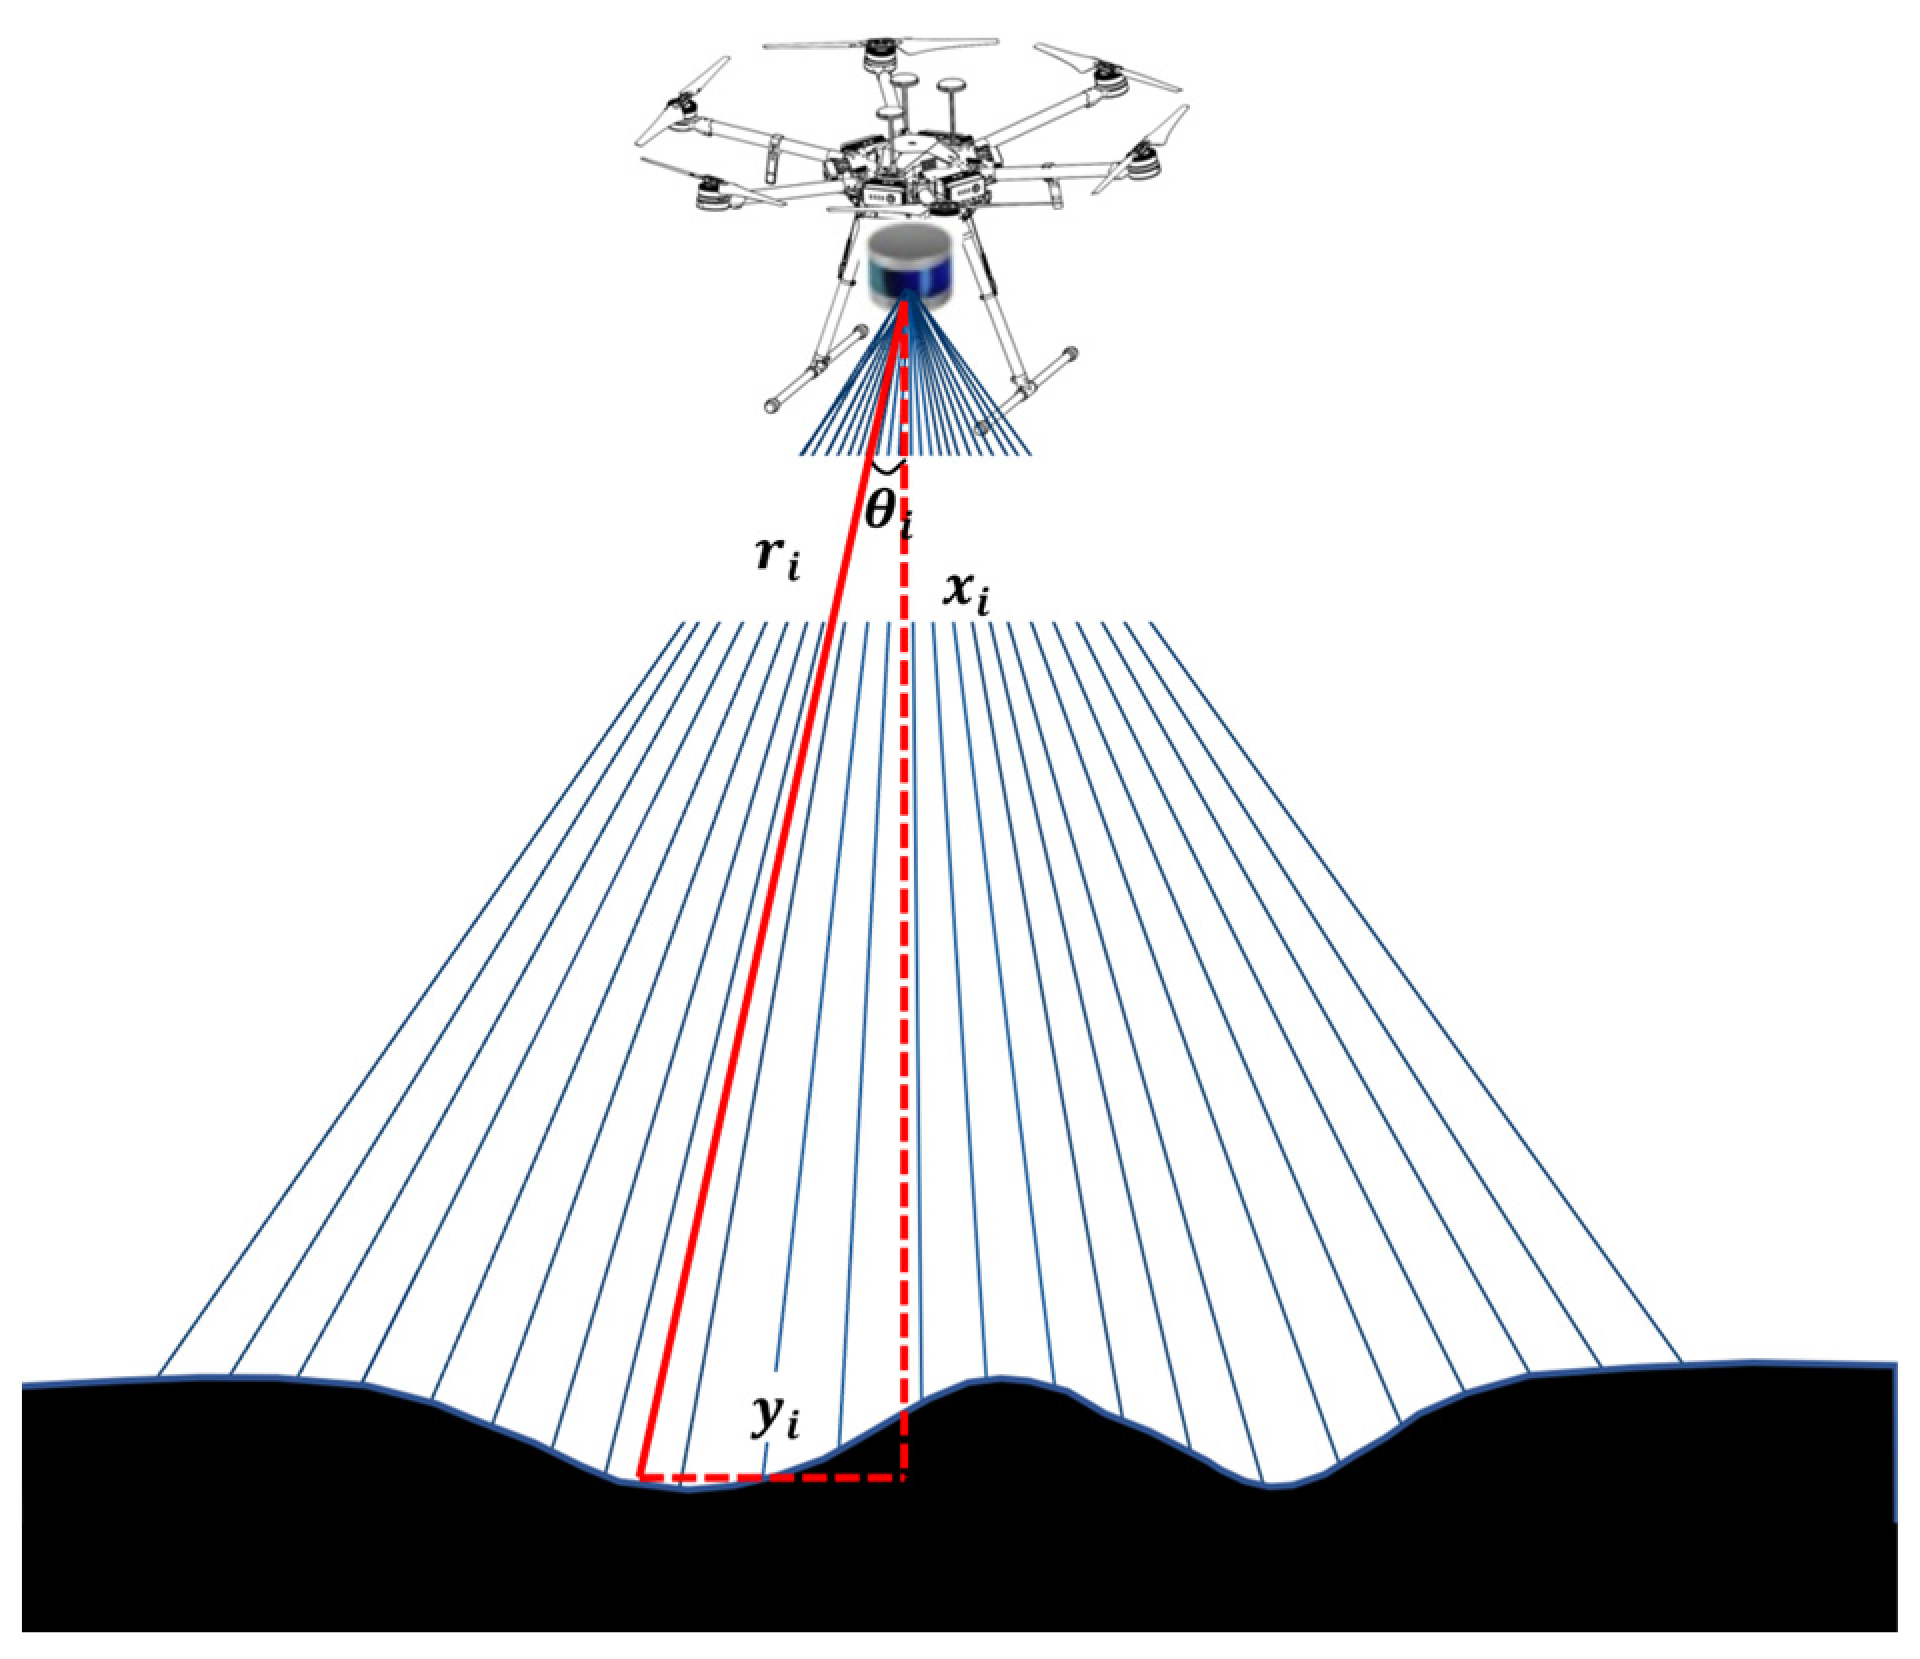
Figure 5.
Diagram of data point fitting.

Figure 6.
Rut depth computation methods. (a) Virtual straightedge method model; (b) Virtual envelope method model.
Figure 6.
Rut depth computation methods. (a) Virtual straightedge method model; (b) Virtual envelope method model.
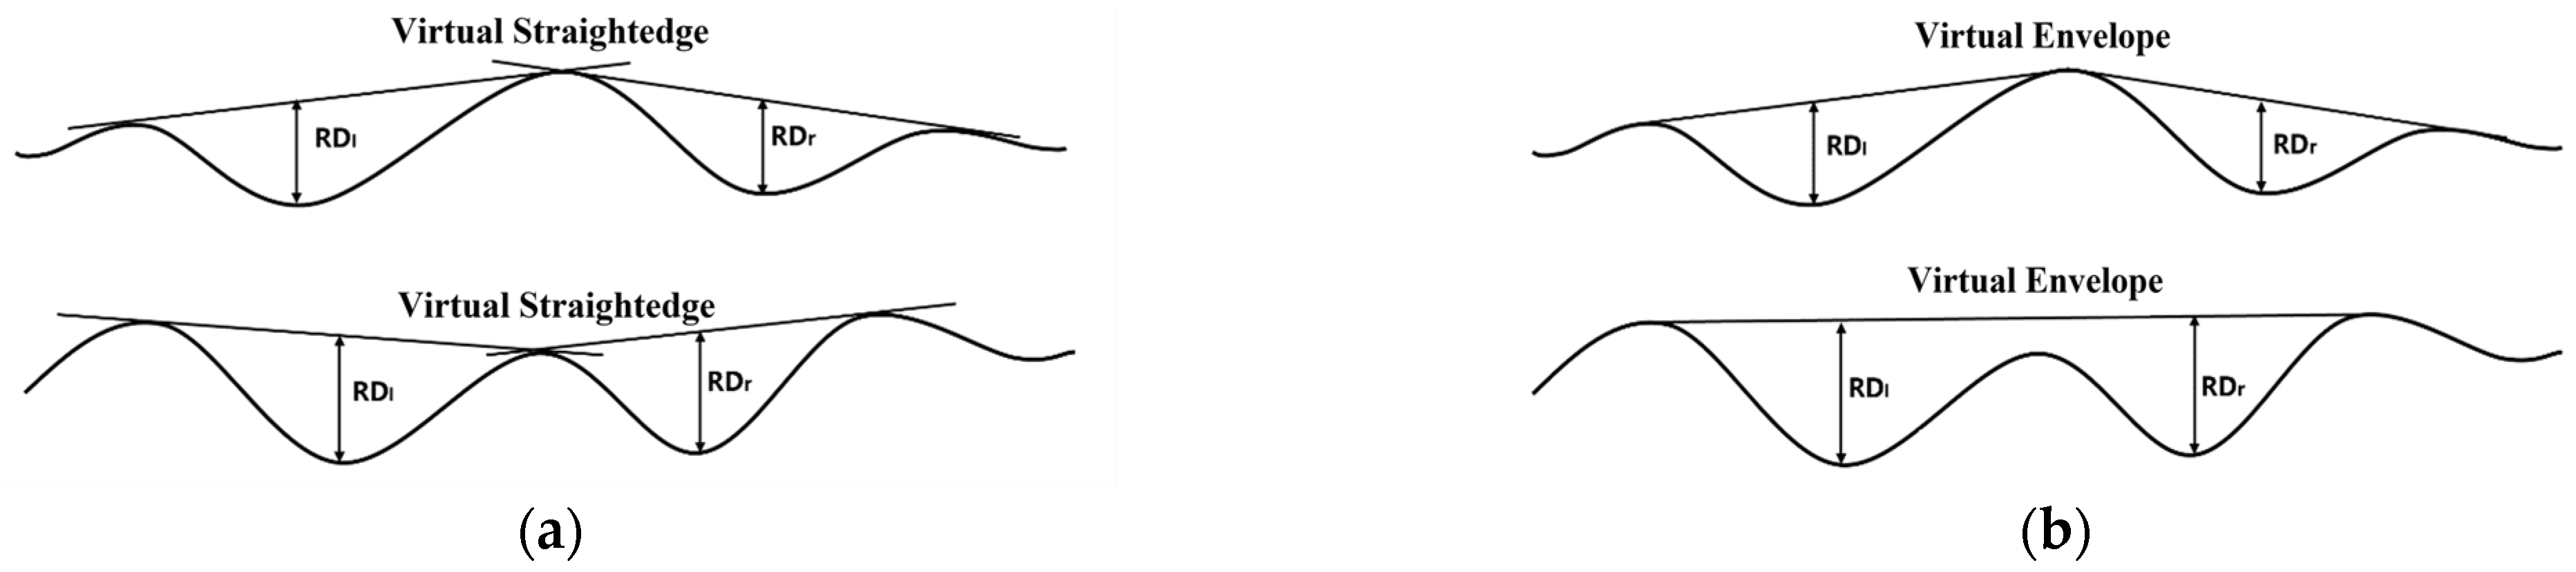
Figure 7.
Schematic diagram of the principle of angular rotation method.
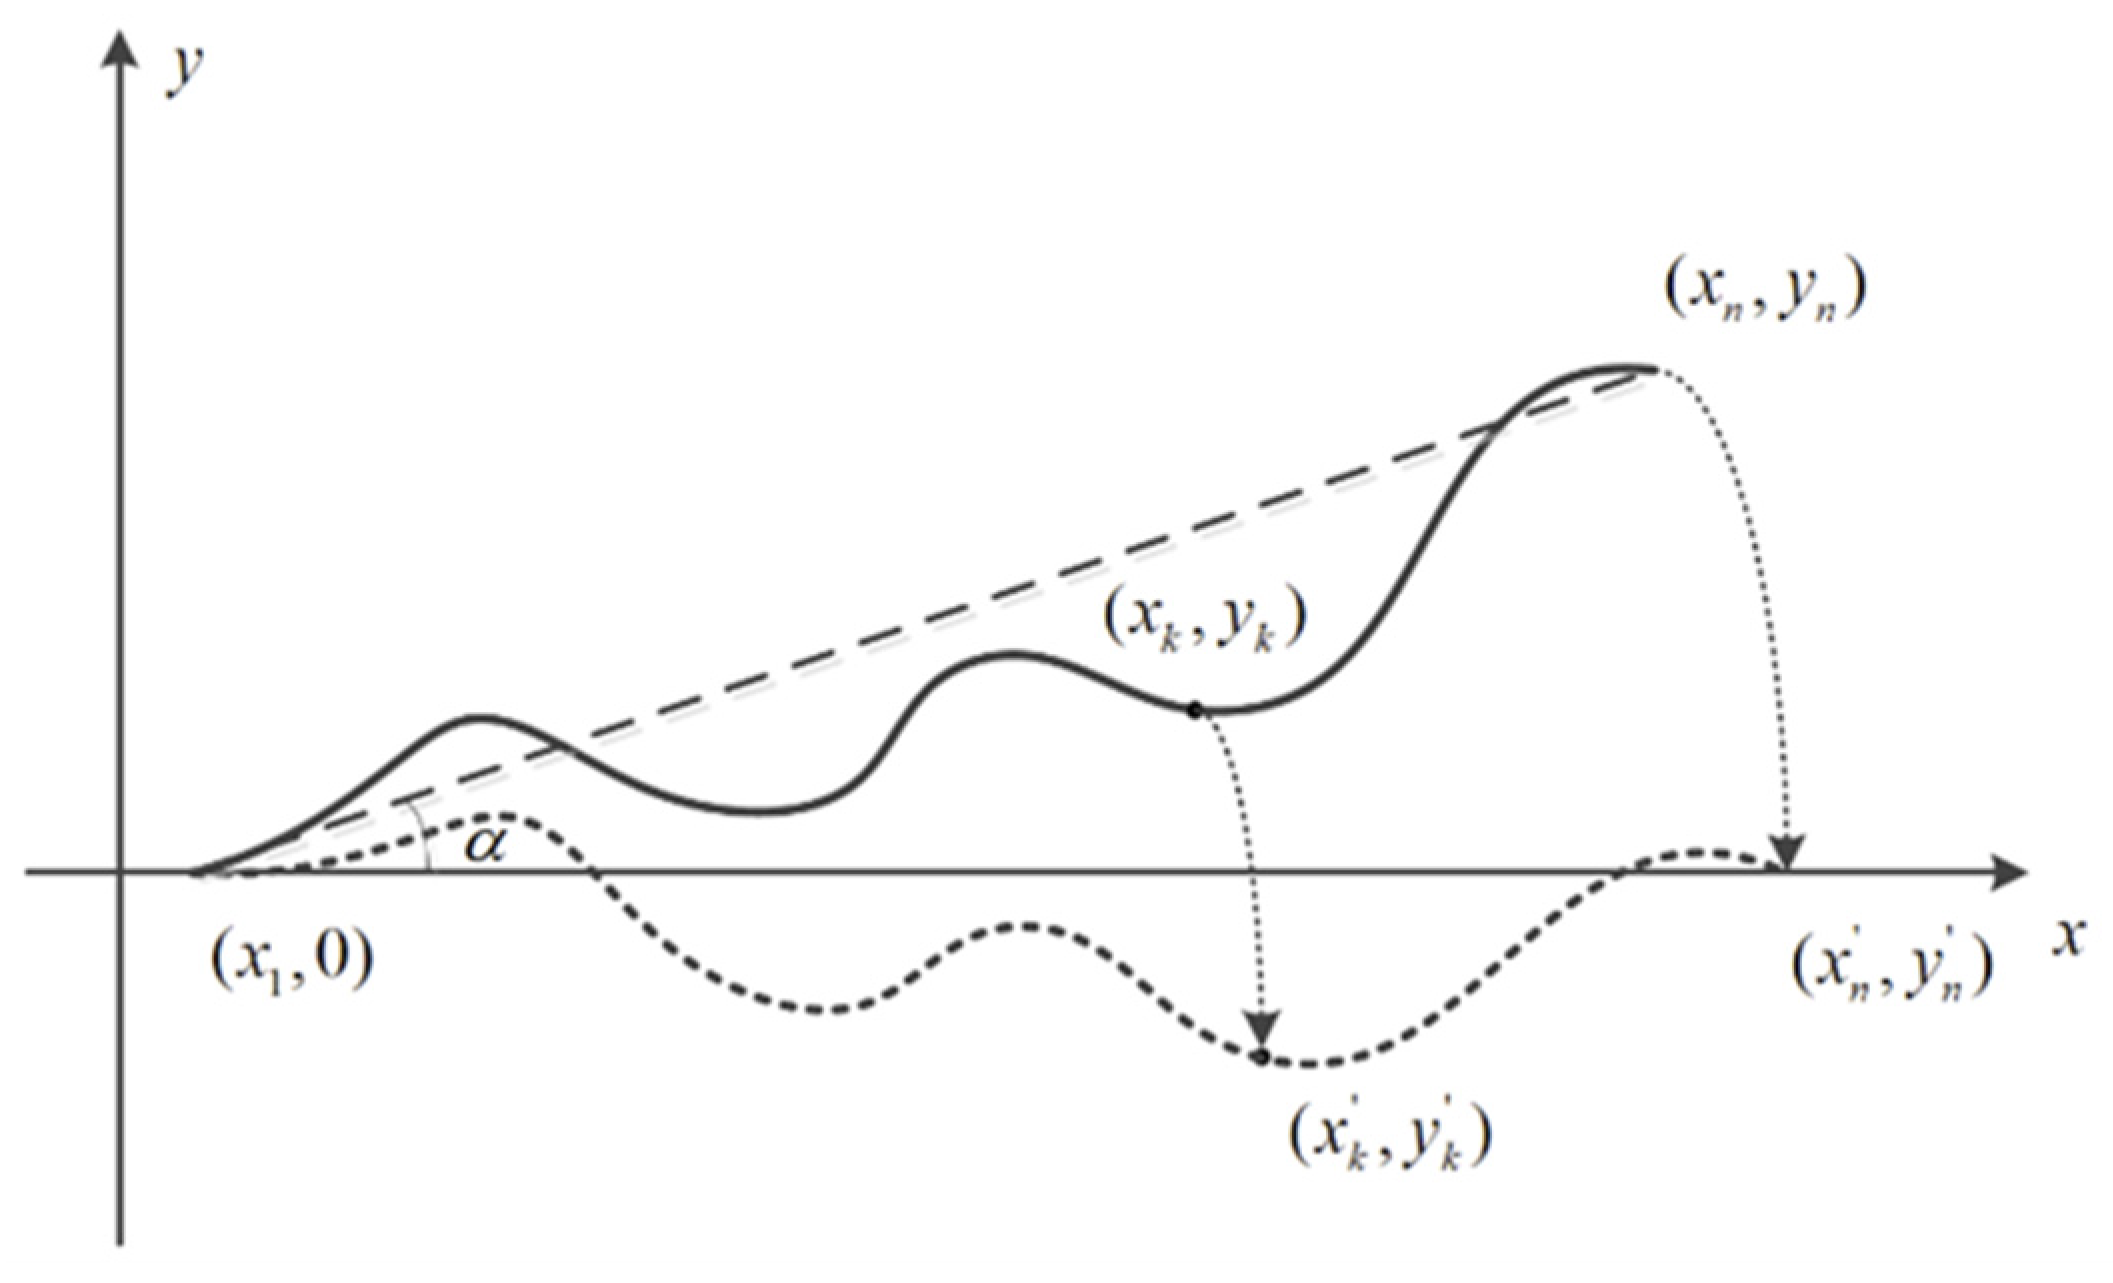
Figure 8.
Correction of pitch angle.
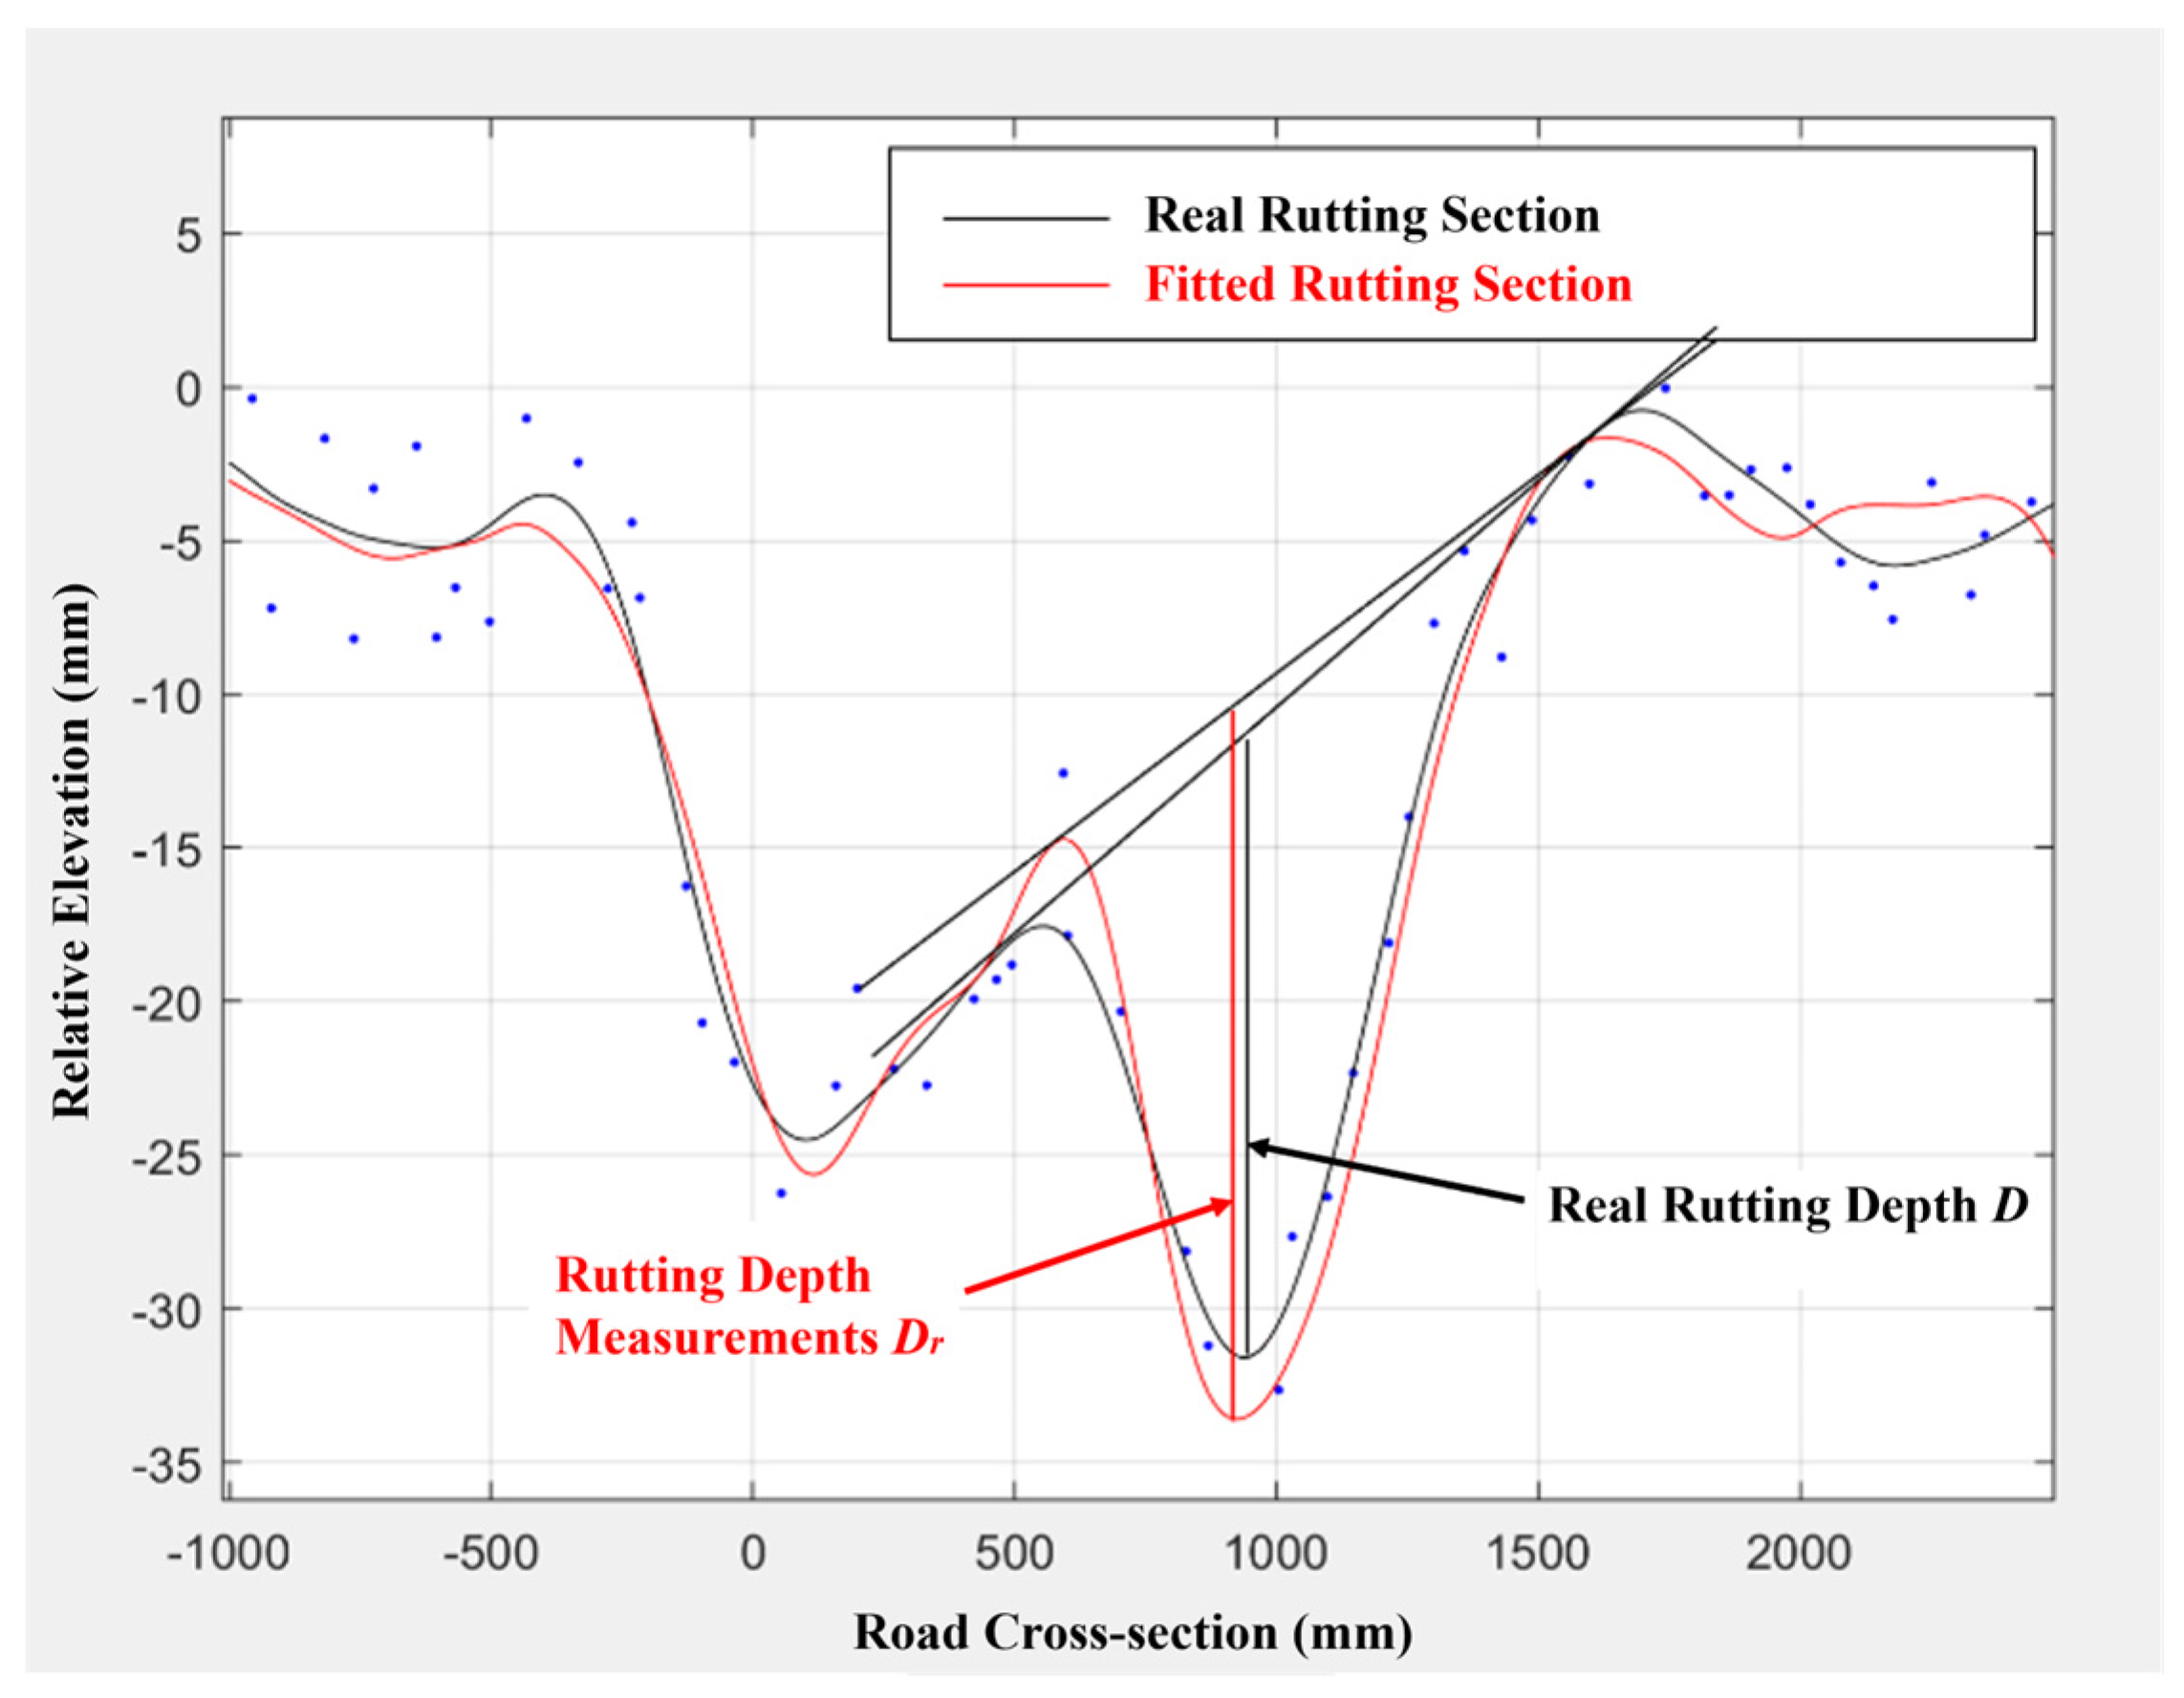
Figure 9.
Comparison between measured and actual rut depth.
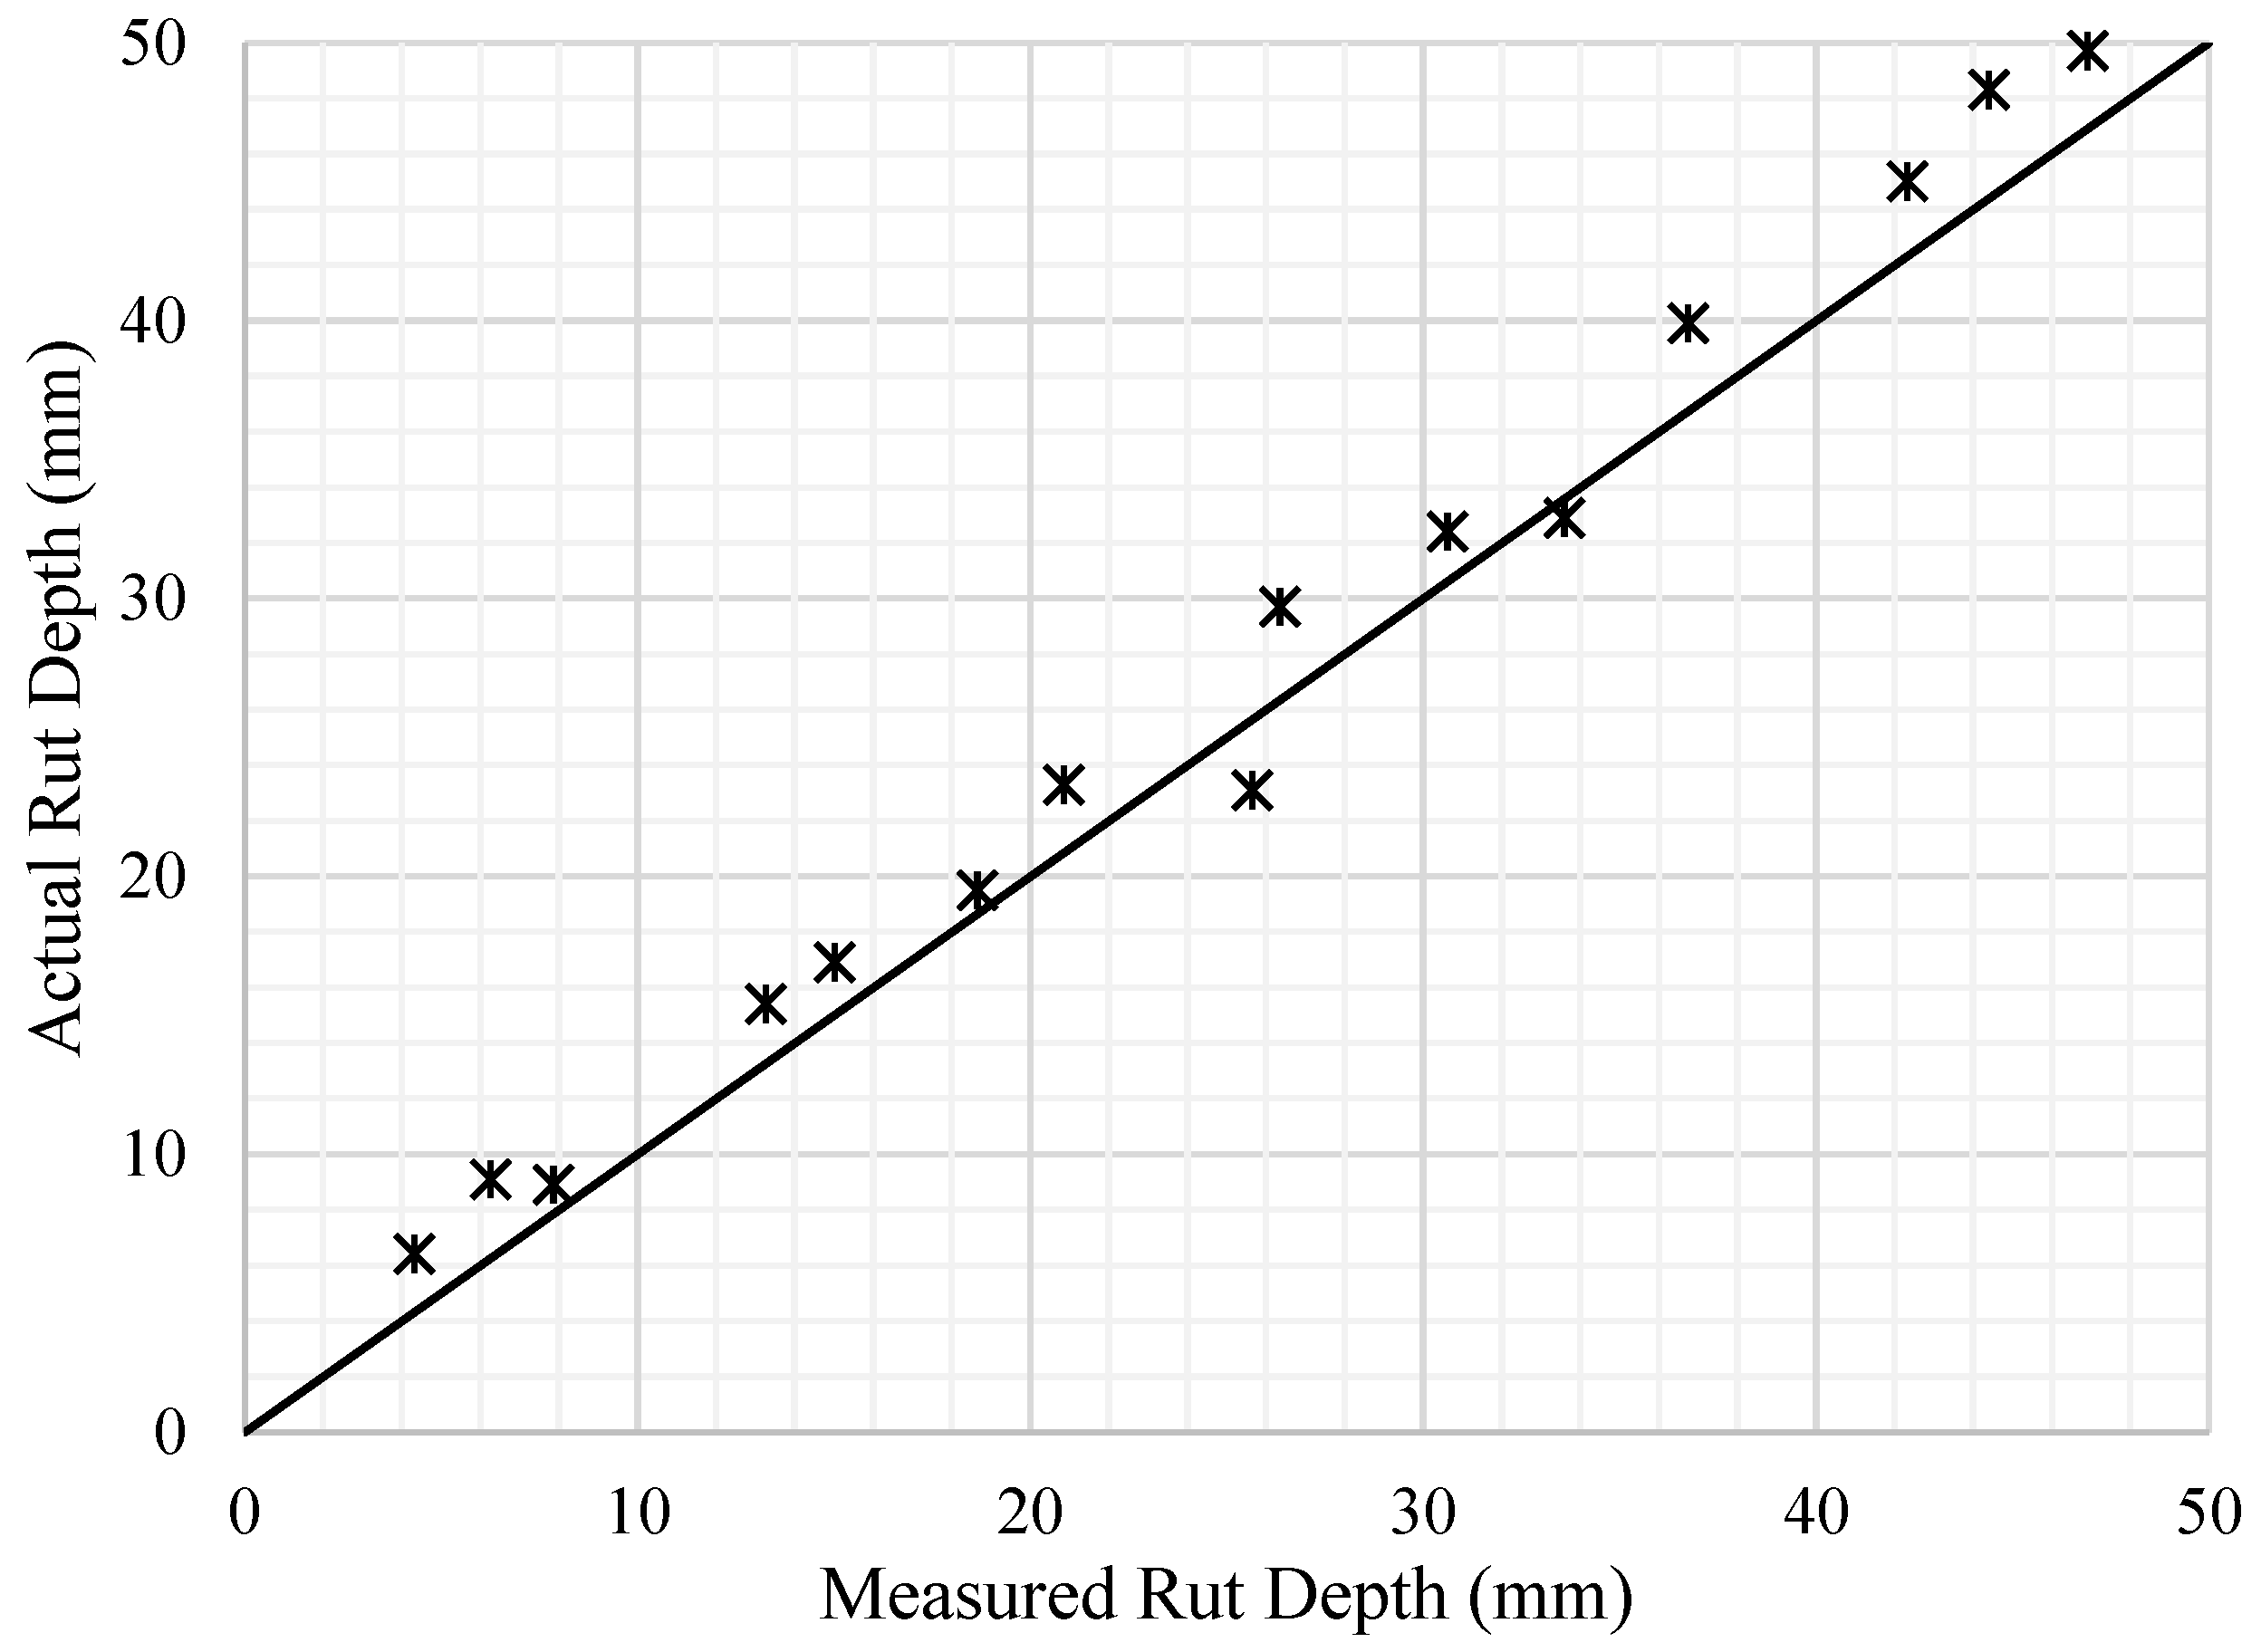
Figure 10.
Laser footprint positioning model.
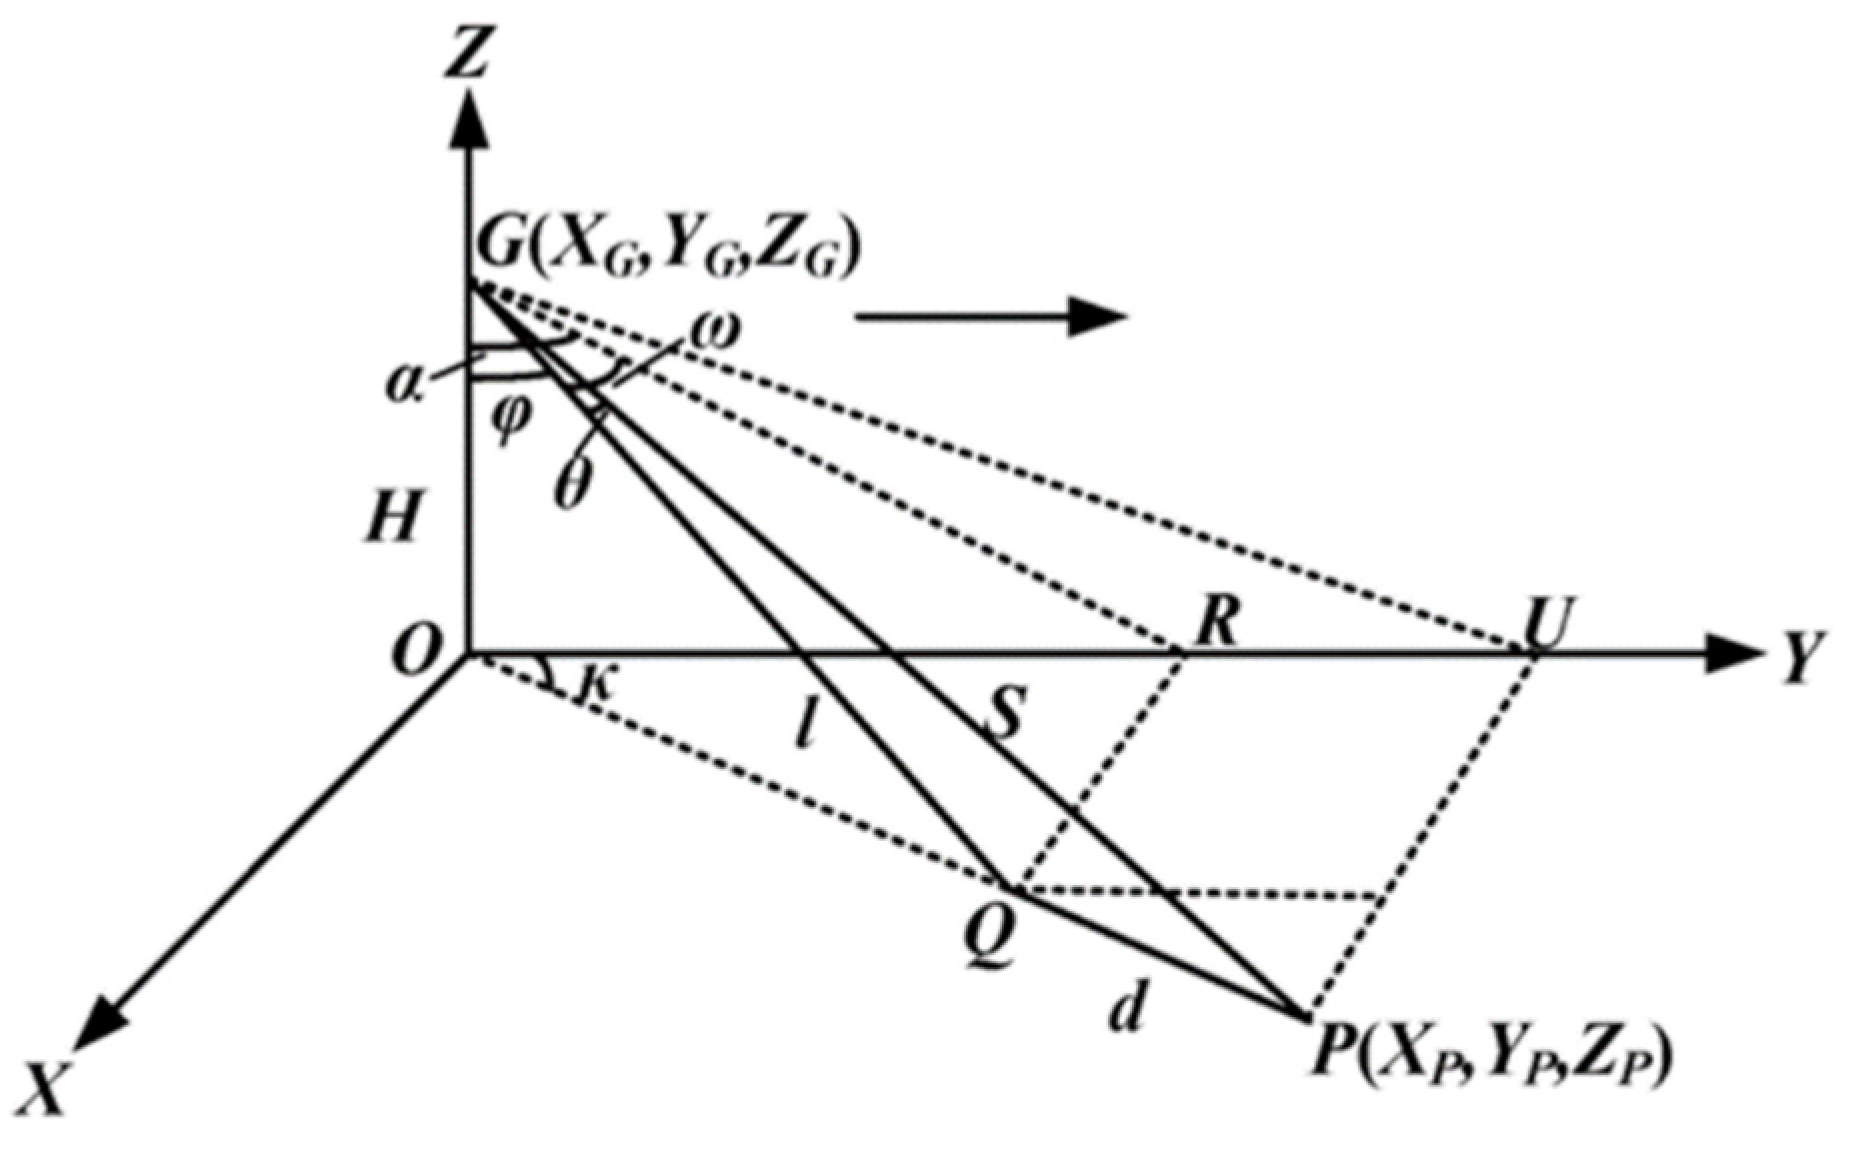
Figure 11.
Sensitivity analysis results. (a) Flight altitude H (φ = 30°, β = 0°); (b) LiDAR instantaneous angle φ (H = 20 m, β = 0°); (c) Pavement surface inclination angle β (H = 20 m, φ = 30°).
Figure 11.
Sensitivity analysis results. (a) Flight altitude H (φ = 30°, β = 0°); (b) LiDAR instantaneous angle φ (H = 20 m, β = 0°); (c) Pavement surface inclination angle β (H = 20 m, φ = 30°).

Figure 12.
Laser foot point location.
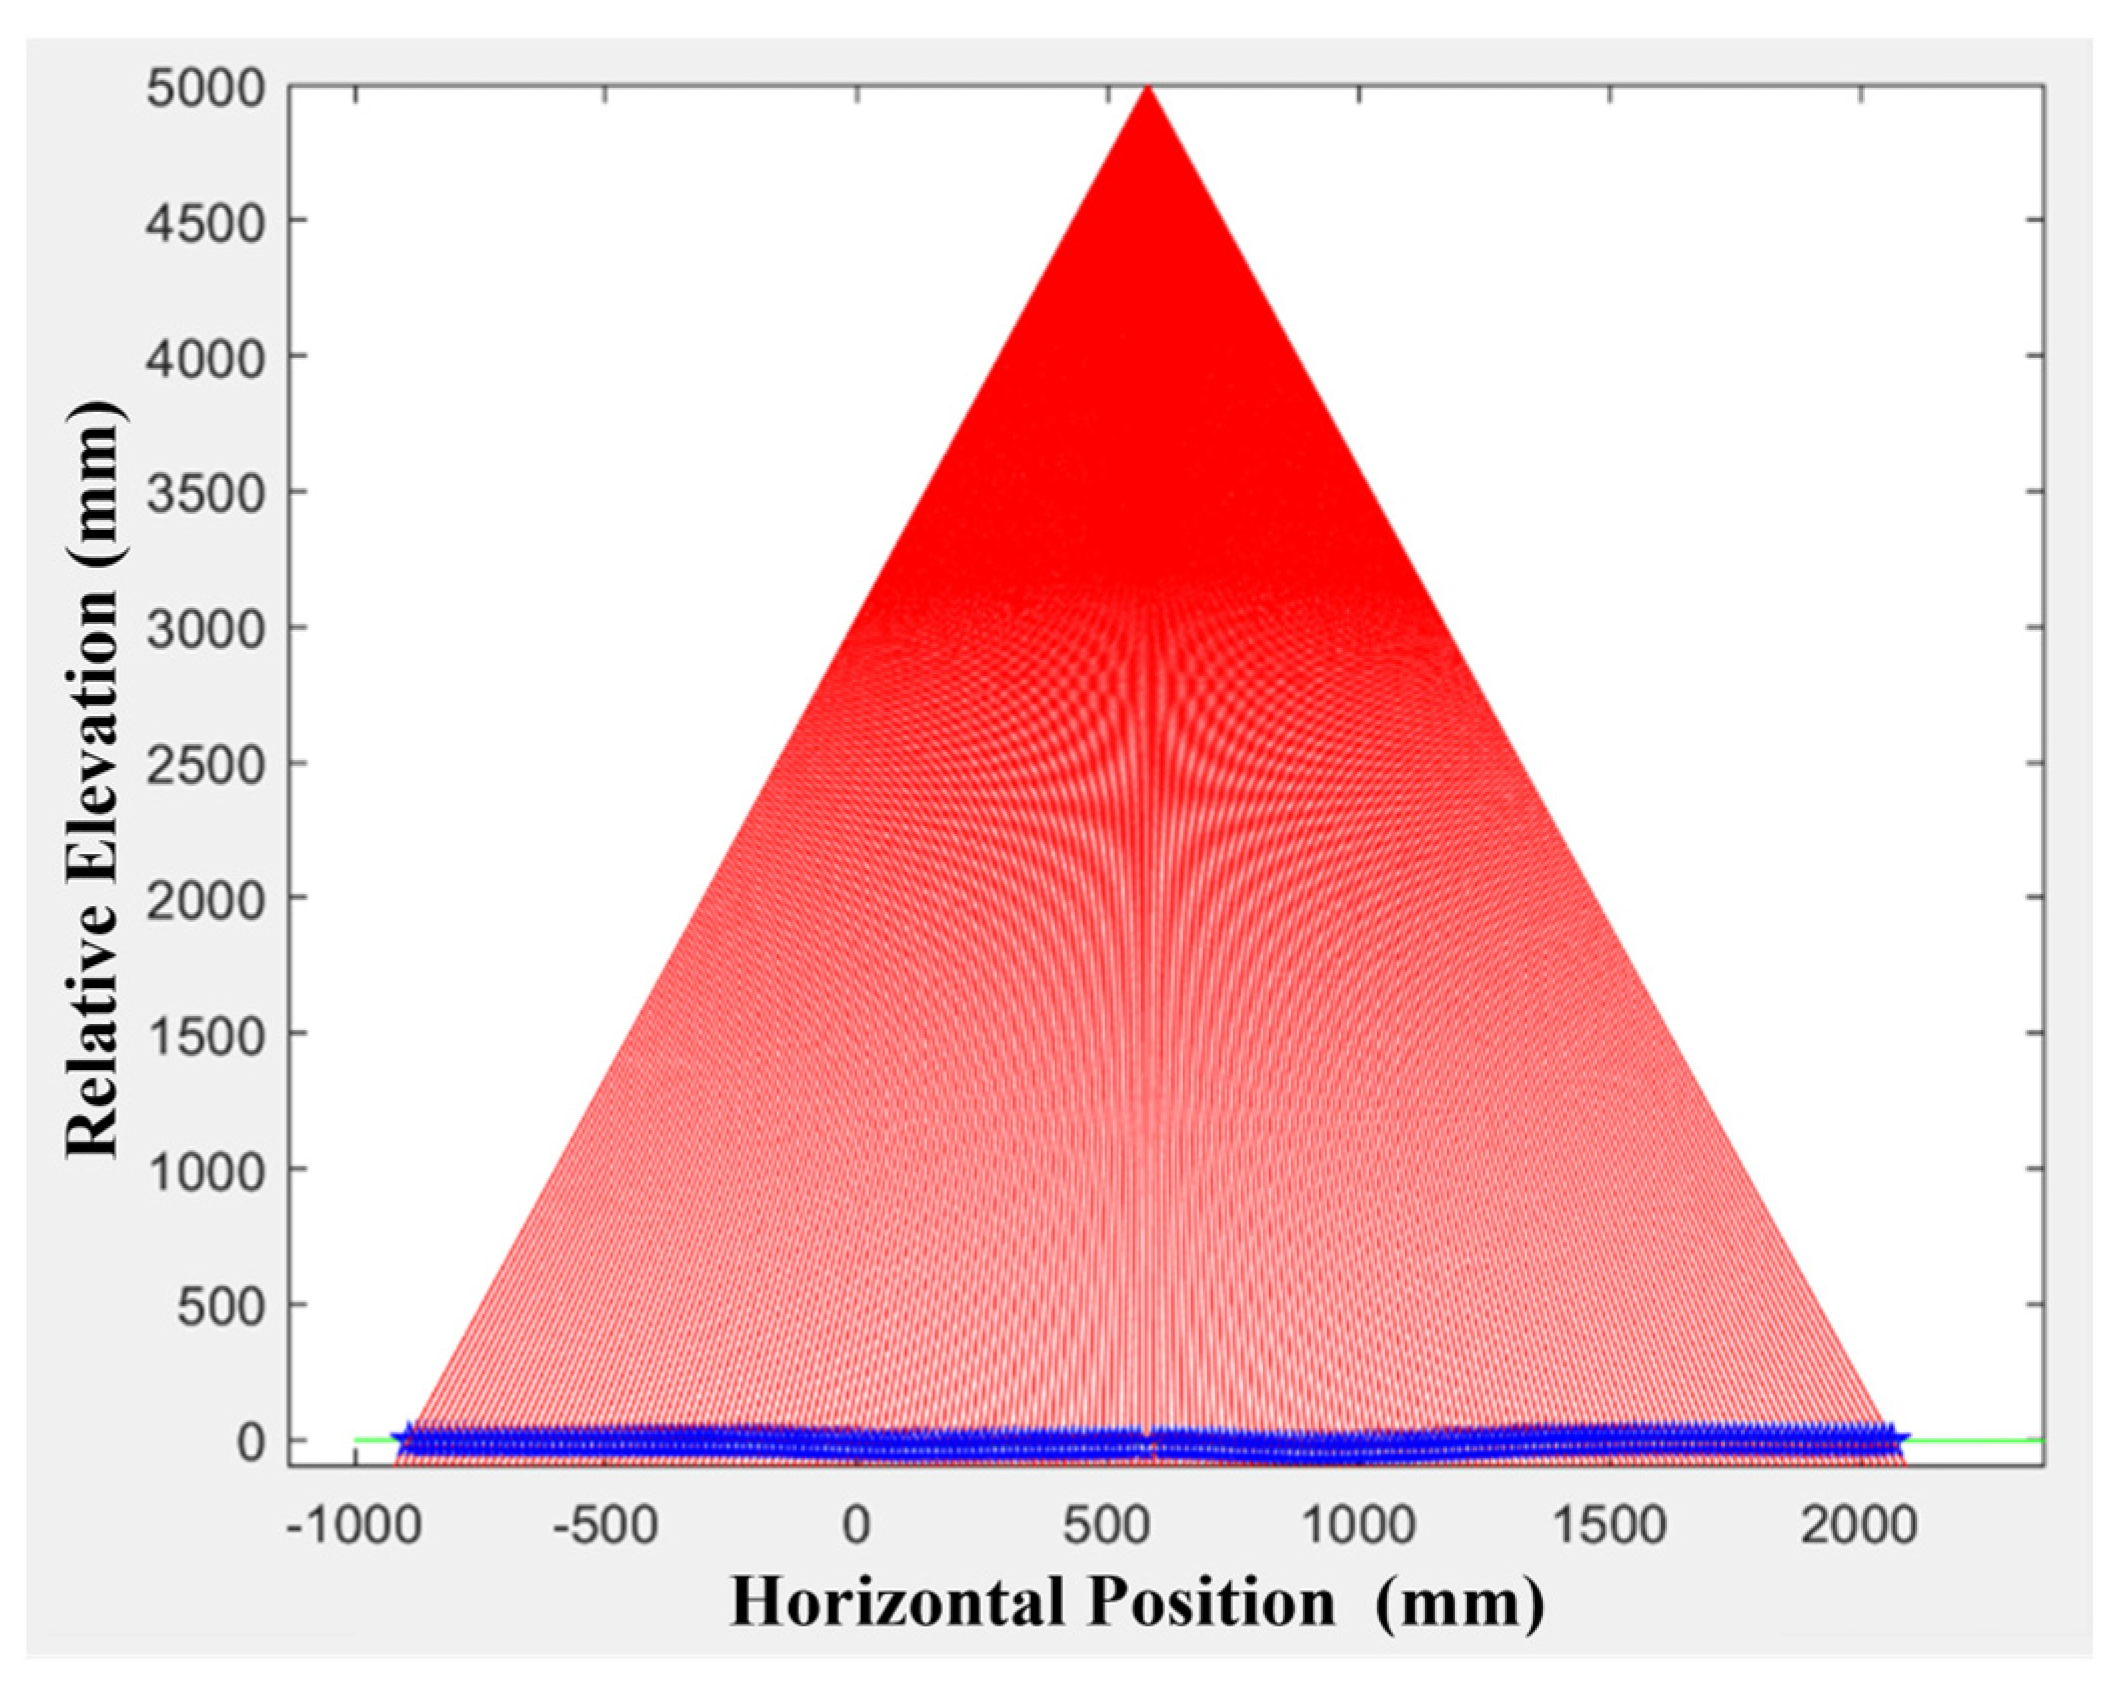
Figure 13.
Creation of virtual laser footprints.
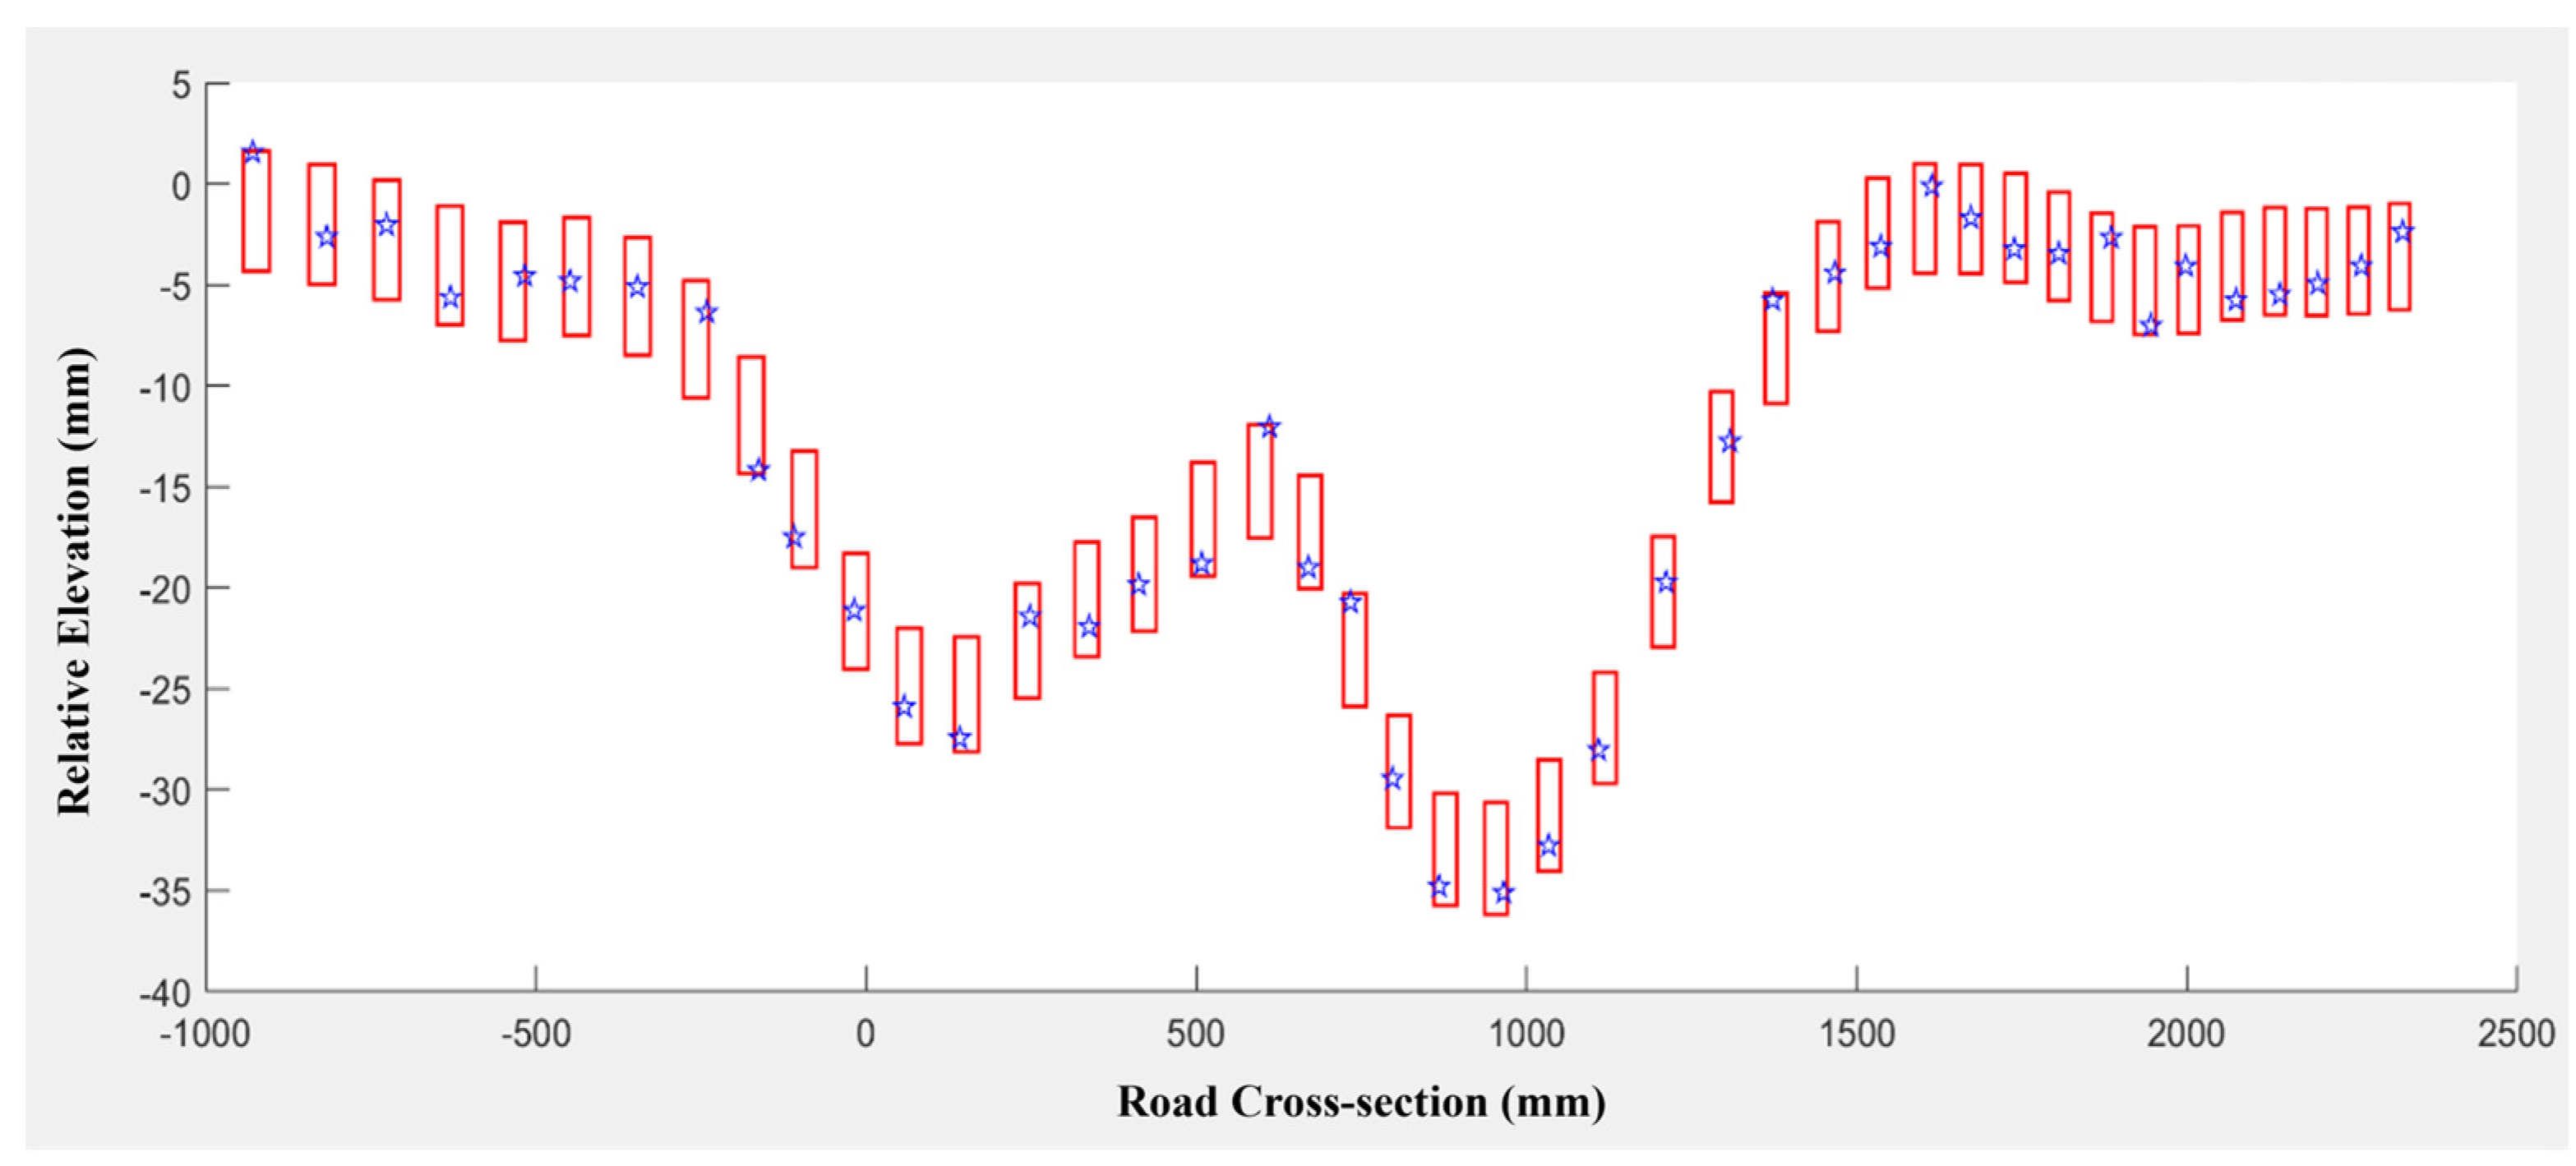
Figure 14.
Virtual vs. reference transverse profile.
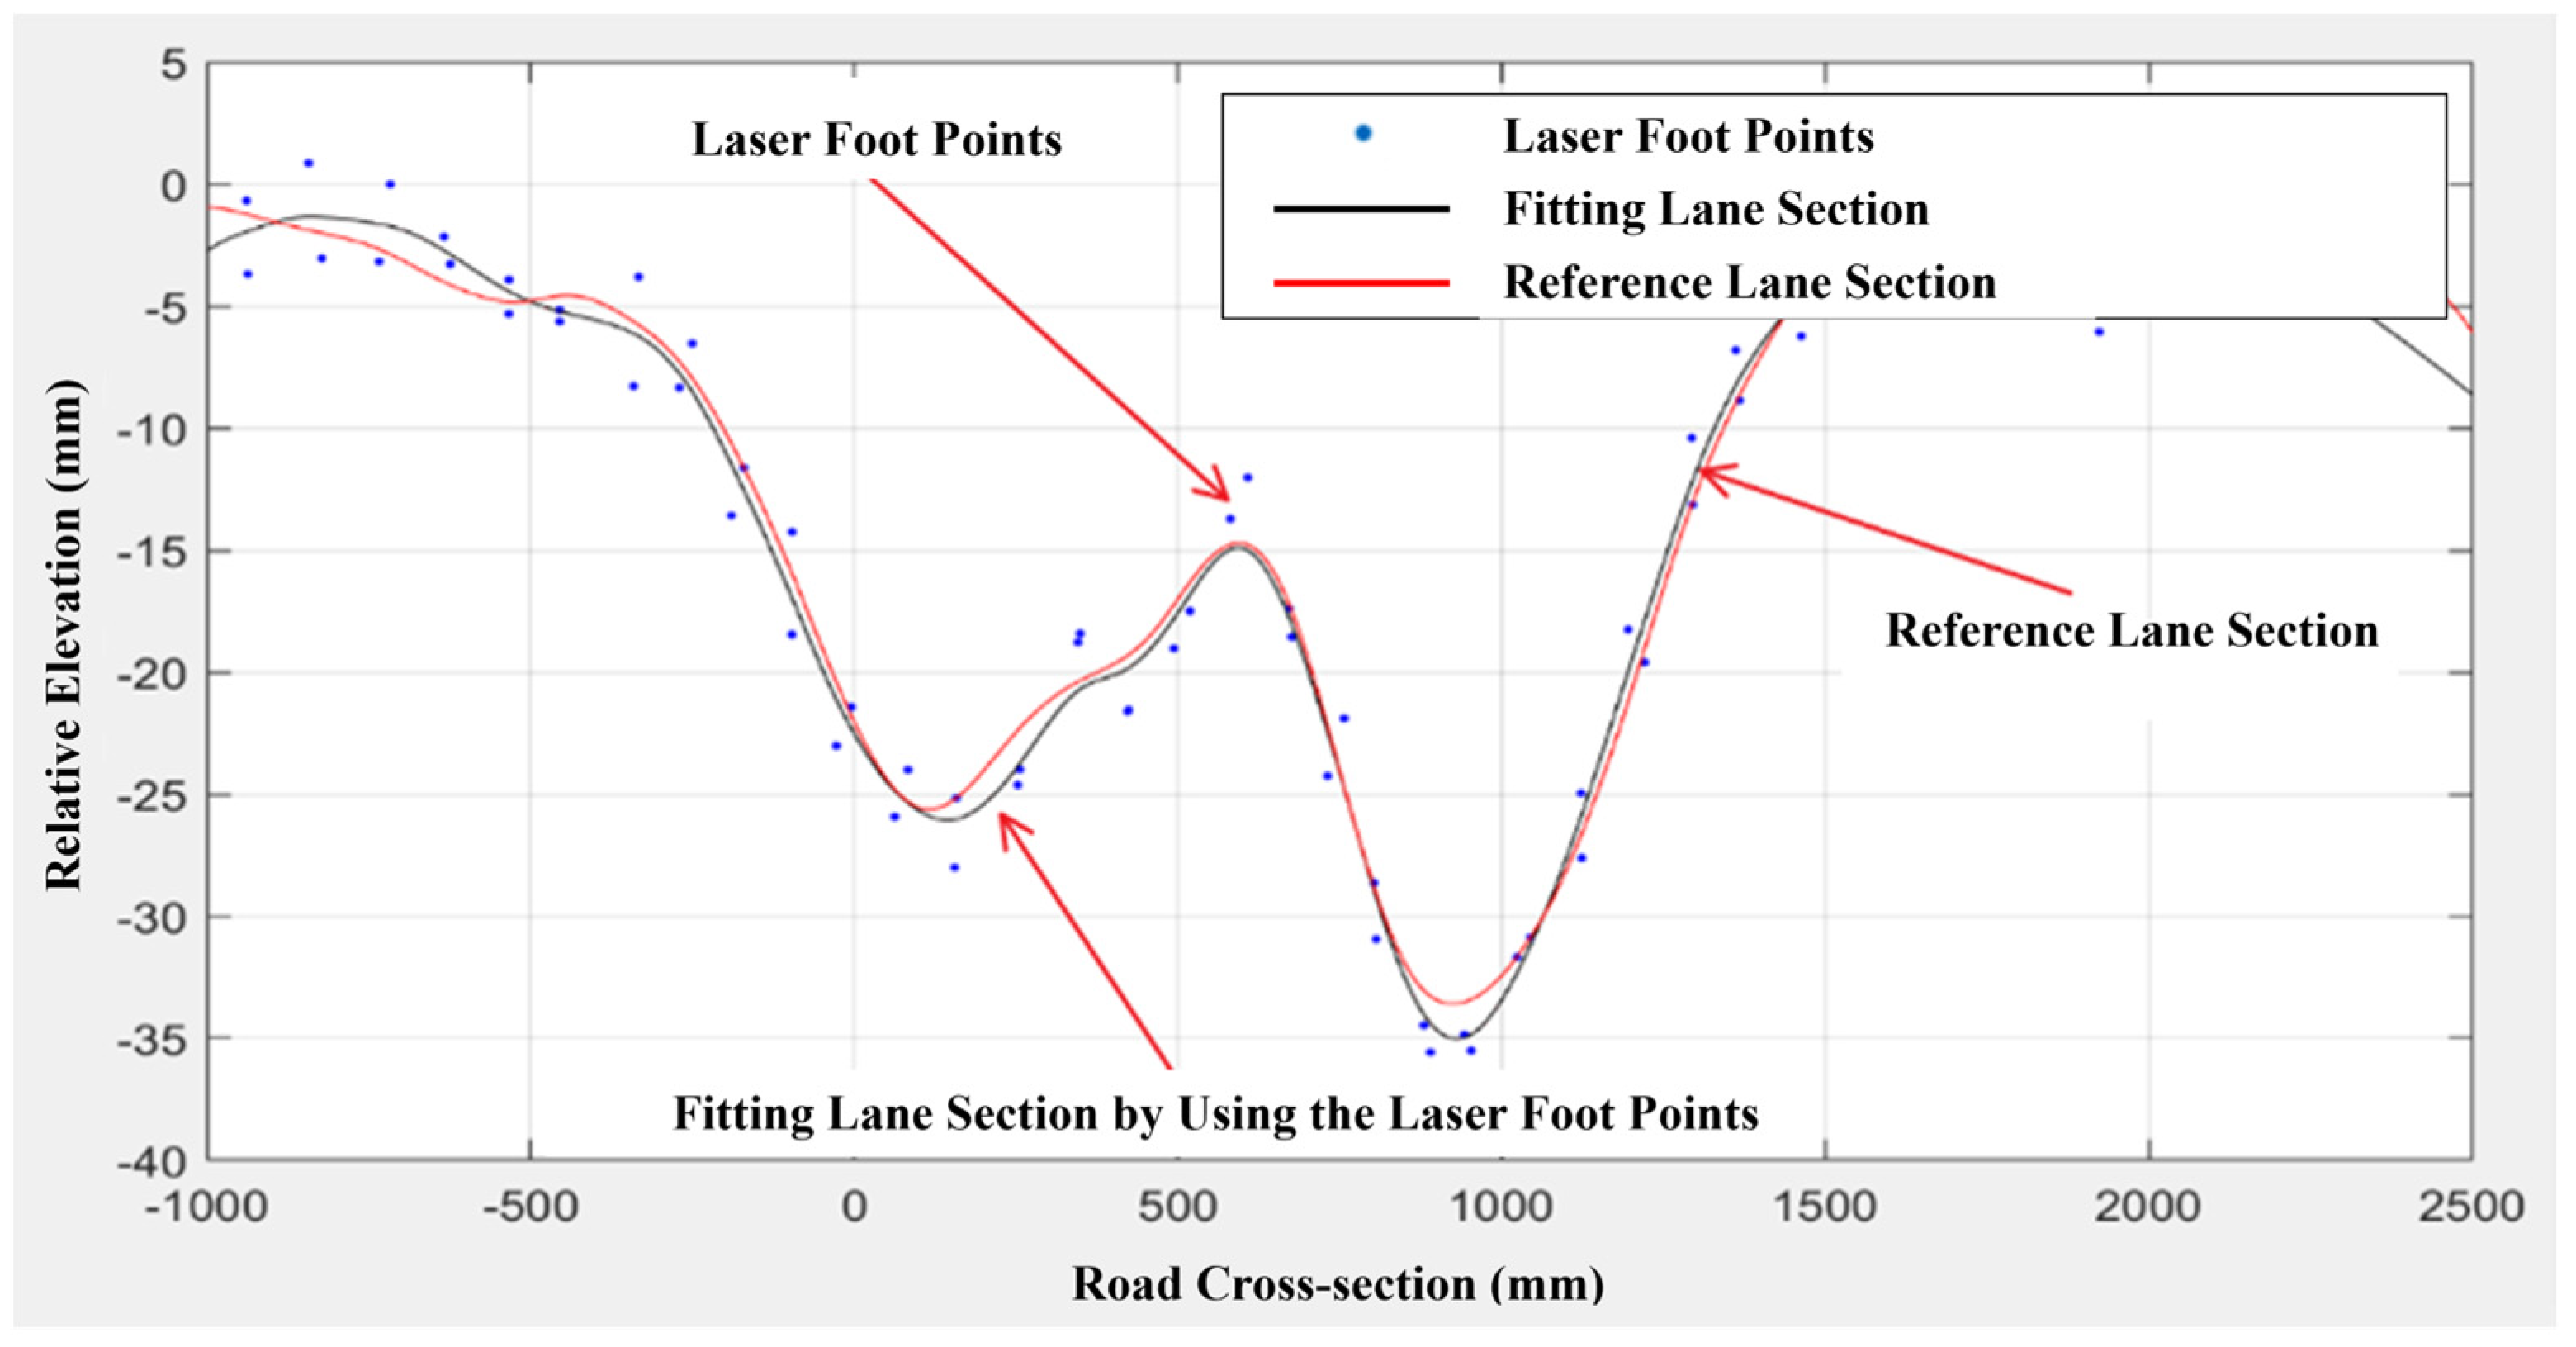
Figure 15.
Rutting test accuracy of heavy rutting at different UAV flight altitudes.
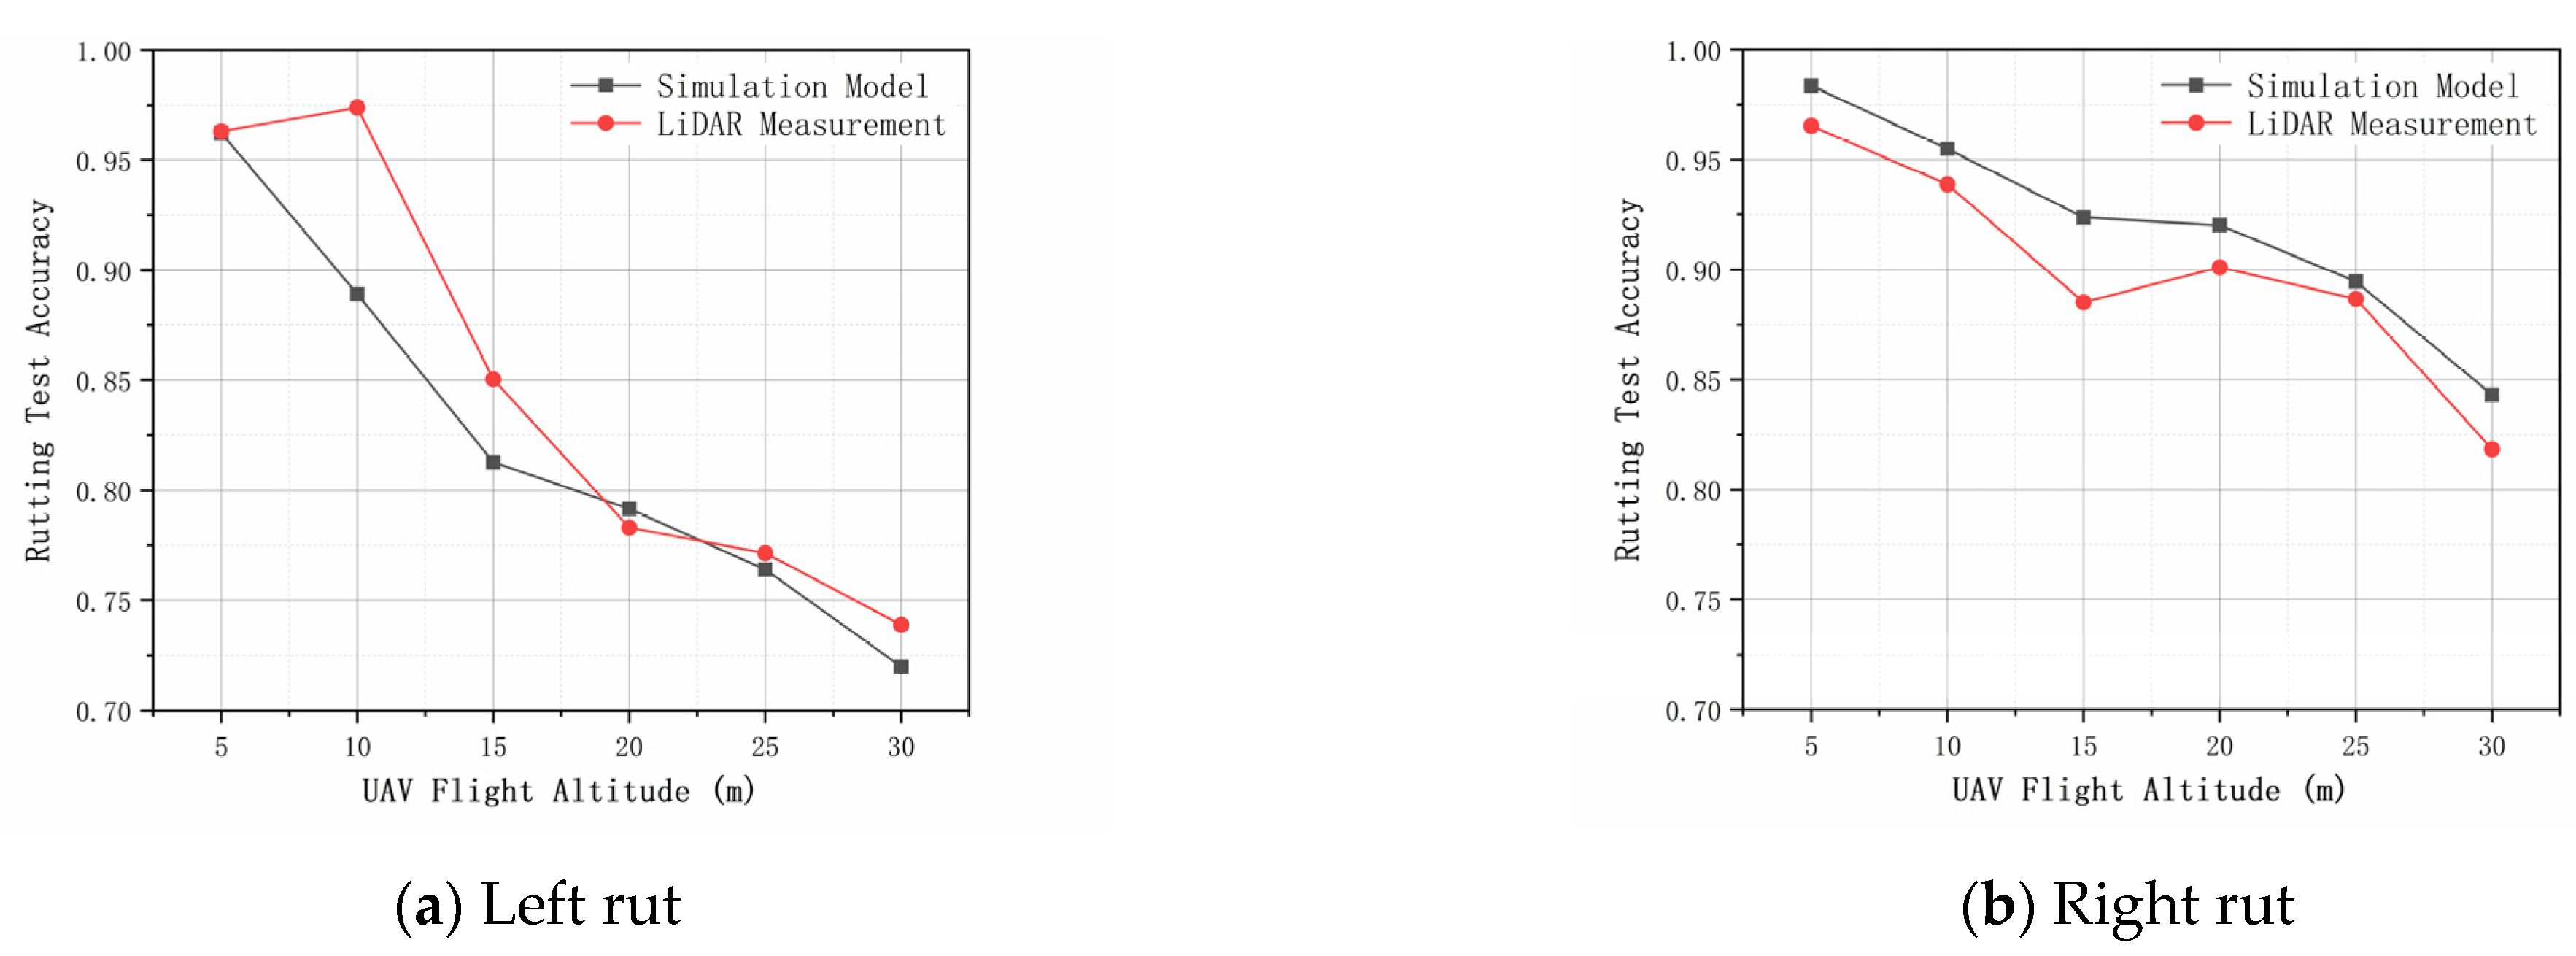
Figure 16.
Rutting test accuracy of light rutting at different UAV flight altitudes.
Figure 17.
Rutting test accuracy at different radar angular resolution.

Table 1.
Basic parameters of field test.
| Parameters | Value |
|---|---|
| Flight altitude of UAV | 10 m |
| Field angle | 30–150° |
| Flight speed of UAV | 3 m/s |
| Radar resolution | 0.167° |
| Scanning frequency | 50 Hz |
| Take-off weight | 13.5 kg |
| Scanning breadth | 27.7 m |
Table 2.
Parameters for the laser footprint positioning model.
| Parameters | Value |
|---|---|
| Flight height H (m) | —— |
| Instantaneous scanning Angle φ (°) | —— |
| Inclination angle β (°) | —— |
| Radar angular resolution (°) | 0.167° |
| Attitude angle ƙ, α, ω (°) | 1 |
| Attitude angle error mƙ, mα, mω (°) | 0.005 |
| Laser ranging error mS (m) | 0.002 |
| Scanning angle error mθ (°) | 0.008 |
| Flight accelerated velocity a (m s−2) | 0 |
| UAV vibrational frequency (Hz) | 10 |
| Fuselage maximum amplitude xmax, zmax (m) | 0.005 |
| Initial phase φx, φz (°) | 0 |
Disclaimer/Publisher’s Note: The statements, opinions and data contained in all publications are solely those of the individual author(s) and contributor(s) and not of MDPI and/or the editor(s). MDPI and/or the editor(s) disclaim responsibility for any injury to people or property resulting from any ideas, methods, instructions or products referred to in the content. |
© 2023 by the authors. Licensee MDPI, Basel, Switzerland. This article is an open access article distributed under the terms and conditions of the Creative Commons Attribution (CC BY) license (https://creativecommons.org/licenses/by/4.0/).
Share and Cite
MDPI and ACS Style
Zhu, J.; Gao, Y.; Huang, S.; Bu, T.; Jiang, S. Measuring Surface Deformation of Asphalt Pavement via Airborne LiDAR: A Pilot Study. Drones 2023, 7, 570. https://doi.org/10.3390/drones7090570
AMA Style
Zhu J, Gao Y, Huang S, Bu T, Jiang S. Measuring Surface Deformation of Asphalt Pavement via Airborne LiDAR: A Pilot Study. Drones. 2023; 7(9):570. https://doi.org/10.3390/drones7090570
Chicago/Turabian StyleZhu, Junqing, Yingda Gao, Siqi Huang, Tianxiang Bu, and Shun Jiang. 2023. "Measuring Surface Deformation of Asphalt Pavement via Airborne LiDAR: A Pilot Study" Drones 7, no. 9: 570. https://doi.org/10.3390/drones7090570