
Assessment of UAS Photogrammetry and Planet Imagery for Monitoring Water Levels around Railway Tracks

1
Aerospace Research Center, Flight Research Laboratory, National Research Council of Canada, 1920 Research Private, Ottawa, ON K1V-2B1, Canada
2
Applied Remote Sensing Lab., McGill University, Montreal, QC H3A 0B9, Canada
3
Automotive and Surface Transportation, National Research Council of Canada, 2320 Lester Rd, Gloucester, ON K1T 3T3, Canada
*
Author to whom correspondence should be addressed.
Drones 2023, 7(9), 553; https://doi.org/10.3390/drones7090553
Submission received: 25 July 2023
/
Revised: 21 August 2023
/
Accepted: 25 August 2023
/
Published: 27 August 2023
Abstract
:High water levels near railway tracks can be a major factor affecting the safety of train passage. Water conditions near the tracks are normally monitored through visual inspections. However, this method is limited in spatial coverage and may not provide comparable information over time. We evaluated the utility of satellite imagery (Planet Dove constellation at 3 m pixel size) at the landscape level to assess overall water surface area along railway tracks. Comparatively, we evaluated the use of Structure- from-Motion 3D point clouds and high spatial detail orthomosaics (3 cm) generated from a commercial off-the-shelf Unmanned Aerial System (UAS) (DJI M300 RTK) for measuring vertical water level changes and extent of surface water, respectively, within the right-of-way of a railway line in Ontario, Canada, in areas prone to high water level and flooding. Test sites of varied lengths (~180 m to 500 m), were assessed four times between June and October 2021. Our results indicate that the satellite imagery provides a large-scale overview regarding the extent of open water in wetlands at long distances from the railway tracks. Analysis of the UAS derived 3D point cloud indicates that changes in water level can be determined at the centimeter scale. Furthermore, the spatial error (horizontal and vertical alignments) between the multi-temporal UAS data collections between sites was less than 3 cm. Our research highlights the importance of using consistent UAS data collection protocols, and the significant potential of commercial off-the-shelf UAS systems for water level monitoring along railway tracks.
Keywords:
railway; flooding; remote sensing; photogrammetry; drones; UAS; satellite imagery; water surface change1. Introduction
With increasing global anthropogenic greenhouses gasses such as CO2 [1], extreme weather events are expected to become more frequent and severe, affecting transportation systems worldwide [2,3]. Climate model simulations suggest increasing temperatures [4], as well as changes in precipitation intensity and amount [5,6]. The combination of early snowmelts and increased rainfall during the winter–spring transition season can cause high water levels in streams and wetlands. The resultant water volume can surpass the capacity of culverts to drain the excess water safely away from railway tracks. Other significant effects of increasing temperatures can be related to the increase of intense storm systems (local to regional impacts) [7], which will directly impact the hydrological processes across different regions [1]. Railway infrastructure, as well as other transportation systems, are under high risk of damage (e.g., flooding, wildfires, landslides) given the intensity and frequency of climatic events [3]. The results of several interviews conducted by [8] suggest that railway operators have observed more water-related issues in recent years, an observation that is consistent with climate data. The interviewees also indicated that even though the current water inspection procedures are sufficient for safe railway operation, there is certainly room for improvement. Therefore, railways require novel inspection methodologies to assess water levels around railway tracks.
The level of water near a railway track is a major factor affecting the safety of train passage and cargo, and current monitoring techniques are limited in spatial and temporal coverage. Railway operators need to identify the development of problematic water levels in the area surrounding the track in a timely manner to avoid incidents that can potentially cost human life and damage the environment [9]. Current inspection methods in Canada, include visual observations by trained inspectors walking/driving along the track to identify indications of water problems. These inspections rely on the inspectors’ judgments, have a very limited range of coverage, and do not provide visibility of potential water issues in the areas that are out of visual range, but located close enough to affect the track. Several major water-related derailments that have occurred along Canada’s rail network have been attributed to the failure of beaver dams that were not visible to the track inspectors [10]. While mitigating the water-related problems requires more frequent inspections and track down time, the continuously increasing demand for rail transportation and the supply chain constraints require railway operators to increase the number of trains along their network which means there will be less available time for inspection. To solve this dilemma, railways are leveraging the use of technologies and automation to allow for more frequent inspections and increase their operational efficiencies.
Recent advances in commercial optical satellite-based remote sensing such as the Planet Dove constellation, provide imagery at both high spatial resolution (<5 m) with high revisit frequency (i.e., daily acquisition). The utility of such imagery has been demonstrated for mapping dynamic water bodies [11]. Automated lake surface water delineation from the Planet Dove imagery in an area of 625 km2 was possible with a geolocation accuracy greater than 10 m as compared to manual digitization of satellite imagery with pixel sizes of 0.3–0.5 m [12]. Moreover, [12] measured near-daily changes in lake surface area for 85,358 lakes in Northern Canada and Alaska for a 5-month period with imagery from the Planet Dove constellation.
Complementary to regional scale surface water monitoring, changes in fine scale water extent and vertical water level at local scales (i.e., next to railway tracks) can only be achieved with Unmanned Aerial Systems (UAS) or low altitude airborne data, however, the latter is expensive and more difficult to implement operationally. UAS based Structure-from-Motion (SfM) photogrammetry can generate products with centimeter accuracy, comparable or better to that generated by airborne LiDAR [13]. While new generation UAS LiDAR can also achieve centimeter accuracy, the final point cloud density in natural landscapes remains considerably higher from SfM photogrammetry. Thus, the 3D point clouds from an SfM workflow [13,14], are ideal for assessing changes in the vertical water level along railway tracks because the photographs capture the water surface (regardless of depth). Combined, the satellite imagery and UAS data can provide railway inspection managers and crews with new tools for monitoring water levels along railway tracks, as well as providing information for a rapid response to flood events.
Here we present a first demonstration on the use of Planet imagery with the objective of assessing water surface level changes at four time periods for four railway sections in Ontario, Canada. Our second objective was to assess vertical changes in water levels by implementing a UAS SfM photogrammetry approach aiming to produce repeatable, low error (<5 cm vertical) measurements. Using a commercial-off-the-shelf system (DJI Matrice 300 RTK) equipped with a camera capable of capturing fast nadir and oblique RGB photographs, we produced 3D point clouds and centimeter scale orthomosaics for the four time periods. Our innovative work highlights best data acquisition practices for monitoring the railway infrastructure, and a coherent workflow for data processing and analysis, which we expect can help stakeholders facing the new challenges imposed by climate change and its effect on their railway infrastructure.
2. Materials and Methods
2.1. Test Sites and Flight Plan Considerations
Four test sites along the railway line between the cities of Ottawa and Brockville (ON, Canada) were selected for acquiring UAS and satellite data (Figure 1). These sites were selected after a preliminary field visit in March 2021 taking accessibility, airspace, and previous water related issues into consideration. The data collection took place between June and October 2021. There was no more than a week difference between acquisitions for all sites in each sampling period (Table 1). Due to weather and scheduling conflicts (i.e., train schedules, high-rail truck track access), data were not acquired at all the sites on the same days with the exception of the October campaign. The first acquisition in June at sites 1A, 1B, and 2 enabled the determination of the most effective protocols for data acquisition for subsequent periods.
As the focus of the UAS data was to quantify the changes in surface water area and water level within the right-of-way on the four acquisition dates, the flight plan included a 50 m buffer on either side of the track. In addition, the area of interest was defined for each test site taking into consideration the UAS flight endurance, track region of interest, length and accessibility, environmental parameters (e.g., wind), airspace designation, and camera sensor characteristics (Figure 2). The areas of interest for the sites were 3.11 ha (1A), 1.44 ha (1B), 4.88 ha (2), and 1.79 ha (3A). At sites 1A, 1B, and 2, the tracks cross wetlands, while at site 3A the tracks cross a small creek. Once these areas of interest were developed in ArcGIS 10.7.1 (ESRI, Redlands, CA, USA), a shapefile was created and exported as a KML by a Python conversion tool [15] that allows the files to be imported by the DJI Pilot 2 flight control application as KML files generated by GIS software (such as ArcGIS and QGIS) cannot be read directly by DJI Pilot 2.
2.2. UAS and Sensors
We used a DJI Matrice 300 RTK (Real-time Kinematic Positioning)—hereafter referred to as M300, as the primary UAS for acquiring the photogrammetric data (Figure 3). The M300 is an enterprise grade commercial-off-the-shelf quadcopter, with a flight endurance of up to 55 min and advanced obstacle detection capabilities. An integrated circular scanning radar module further improved the detect-and-avoid capabilities of the M300 for fine objects such as power lines. In combination with a base station positioned at a known location (i.e., latitude, longitude, and altitude), and an integrated camera (described below), UAS generated RTK corrected photograph geotags minimized geolocation errors and resulted in repeatable multi-temporal measurements. In this case, we used a DJI D-RTK 2 Mobile Base Station combined with an Emlid RS2 multiband GNSS receiver. The RS2 was used to determine the precise position of the D-RTK 2 base station through incoming Networked Transport of RTCM (Radio Technical Commission for Maritime Services) via Internet Protocol (NTRIP) Individualized Master-Auxiliary (i-MAX) corrections from SmartNet North America. The accurate position determined by the RS2 for the D-RTK 2 base station was updated within the flight controller at each site prior to takeoff.
We used a DJI P1 camera with a DJI DL 35 mm F2.8 LS ASPH lens (FOV 84°) for acquiring the photographs with the M300. The P1 is full frame aerial survey camera acquiring 45-megapixel photographs (8192 × 5460 pixels, 4.4 μm pixel pitch). The camera is integrated on a 3-axis stabilized gimbal. Photographs were acquired in smart oblique capture mode. In this mode, in addition to nadir photographs, the P1 also acquires oblique photographs reducing the flight time considerably in comparison to conventional double grid nadir acquisition while increasing the amount of data available for photogrammetry.
For one of the dates (July 30th), we used a DJI Matrice 600 Pro (hereafter M600P) because the M300 was unavailable (Figure 3). The M600P is a six-rotor UAS, with a maximum takeoff weight of 21 kg (10.2 kg payload). It uses an A3 Pro flight controller with triple redundant GNSS, compass, and IMU units [16]. Following [17] the DJI D-RTK GNSS (dual-band, four-frequency receiver) module was integrated with the A3 Pro to improve navigation precision. We used DJI Ground Station Pro 2.0 v.2.0.16 for automated flight control and camera triggering (instead of Pilot 2). With the M600P we used a DJI Zenmuse X5 camera with a DJI MFT 15 mm F/1.7 ASPH lens (FOV 72°). The X5 has an M4/3 sensor (17.3 × 13.0 mm) and acquires 16-megapixel photographs (4608 × 3456 pixels, 3.8 μm pixel pitch). To achieve comparable results to the M300, the flight plan for the M600P used a double grid nadir acquisition with 85% front and side overlaps. Photographs were collected in a single flight at each of the sites with the M300RTK. With the M600P, two flights were required at site 1A for the July acquisition. Table 1 shows the survey dates, acquisition mode, altitude, and base station used for the different flights with the M300 and the M600P.
2.3. UAS Structure-from-Motion Multiview Stereo Photogrammetry
To assess the temporal changes in the water surface area and water level, we generated orthomosaics and 3D point clouds from the RGB photographs using a well-established Structure-from-Motion Multiview Stereo workflow (SfM-MVS). Both products were generated in Pix4D Mapper v4.6.4 [13,14,17] (Figure 4). Fundamentally, the SfM-MVS process reconstructs a 3D surface from a set of overlapping 2D photographs [18]. The Pix4D workflow allows for the automatic detection of internal (i.e., focal length, coordinates of principal point, radial distortion parameters, and tangential distortion parameters) and external (i.e., omega, phi and kappa rotations, latitude, longitude, altitude) camera parameters. While SfM does not require geopositional information [14], for repeat mapping and measurement of change, as is the case for our application, accurate horizontal and vertical position geotags are important. The initial SfM step in Pix4D utilizes a modified scale-invariant feature transform (SIFT) algorithm to generate a sparse 3D point cloud [13] followed by densification through MVS photogrammetry [19]. The dense 3D point clouds were examined in CloudCompare v2.11.3 and the Statistical Outlier Filter was used to remove points that are farther than the average plus one standard deviation distance of each point to its six nearest neighbours. Over water with sunglint, the SfM-MVS process creates artifacts where the elevation of these points is incorrect (often higher than the water surface). To remove these artifacts, DSMs (0.5 m pixel size) were generated in Quick Terrain Modeler v8.4 and the areas with sunglint artifacts were smoothed whereby the area designated by a manually digitized polygon was interpolated based on the elevation of the perimeter of the water body resulting in a flat-water surface. The orthomosaics were generated in Pix4D Mapper using an inverse distance weighting (IDW) interpolation of the dense point cloud, which was then used to generate perspective distortion free mosaics from the photographs (Figure 4).
As shown by [14], the mean absolute error of SfM-MVS products from the M600P with the X5 camera is ~1 m (without ground control points) because the photograph geotags are not RTK corrected. Therefore, 3D ground control points (GCPs) were chosen from the October M300 products. These 3D-GCPs were used in Pix4D to align the M600P products (Sites 1A and 1B from the July data collection) to those generated by the M300. The final alignment achieved 3.5 cm, 2.5 cm, and 4.5 cm mean absolute errors in X, Y, and Z respectively. Checkpoints (from the October products) assessed the overall accuracy of the June, August, and September M300 products to be within 2 cm (X, Y, and Z). The final orthomosaics were resampled from an initial pixel size of 1.2 cm (M300) and 1.48 cm (M600) to a pixel size of 3 cm and clipped to the area of interest for each site.
2.4. Satellite Imagery
PlanetScope Dove classic (PS) satellite imagery was used for the classification of surface water and wetlands near the railway right-of-way over a larger area than captured by the UAS for sites 1A, 1B, and 2. With its approximately 200 U3 form factor satellites in orbit, PS provides daily acquisition at 3.7 m ground sampling distance [20], orthorectified to a 3 m pixel size with 4 or 8 spectral bands (blue, green, red, and near-infrared wavelength ranges). The frame detectors have 6600 columns × 4400 rows and use a Bayer pattern filter to separate the blue, green, and red bands. For each frame, the first 2200 rows are used for the RGB bands while the lower 2200 rows capture NIR data. Prior to distribution, the RGB rows are combined with NIR rows to produce the four-band multispectral scenes [20].
For this study, imagery was downloaded from the Planet Explorer website (www.planet.com/explorer) (accessed on 19 October 2021). Figure 5 shows the extent of the images used for the classification and compares it with the area covered by the UAS. The images were downloaded as ‘multispectral analytic surface reflectance’ products. Imagery was analyzed both as each image individually and as a multi-temporal stack (20 bands) (see Section 2.5.2).
2.5. Water Classification from UAS Orthomosaics and Satellite Imagery
In order to generate a water/non-water classification from both the UAS orthomosaics and the satellite imagery, we followed a Geographic Object Based Image Analysis (GEOBIA) approach [21]. The goal of GEOBIA is to replicate and improve human image analysis by taking into consideration the spatial context, patterns (e.g., linear features like roads), and recognition of objects (e.g., houses in an urban area), e.g., [22,23]. GEOBIA classification exploits the high spatial resolution of the UAS orthomosaics and satellite imagery using an image segmentation approach and incorporates ancillary data (i.e., elevation) [24]. Subsequently, the segments are classified based on their spectral (or colour), spatial and contextual information [24]. For this process, we used eCognition Developer v10.2 (Trimble Geospatial, Sunnyvale, CA, USA).
2.5.1. UAS Orthomosaic Classification
The UAS orthomosaics were first segmented using a multi-resolution segmentation algorithm, with scale = 30, shape = 0.1 and compactness = 0.5. Then, the segments were grouped into elevated and non-elevated objects depending on their mean height (from the DSM). The threshold was independently determined for each area. The non-elevated objects were classified as water and included the aquatic plant class (Figure 6). Water can be found with an exposed surface or with a considerable amount of floating or emergent aquatic vegetation. The thin leaves of these species are either connected by a stem to a rooted plant, or free floating and growing as an interconnected or loose-leaved carpet along the surface. For the purpose of determining the water coverage area, these leaves must also be considered within the water class, otherwise the water extent would be underestimated. The rooted plants with leaves floating on the surface belong to two species: ellipsoid leaves of 5–7 cm are long-lead pondweed (Potamogeton nodosus) and the heart shaped round leaves belong to the common water lily (Nymphea odorata). Floating plants covering the surface may be intermixed between duckweed (Lemna minor) or the rosettes of water lettuce (Pistia stratiotes).
The elevated objects were refined into classes representing trees, wetland grasses, gravel, metal (e.g., rails), wood (e.g., railway ties), and soil by selecting a representative set of training samples. We trained and applied a nearest neighbor or Bayes classifier based on object level mean and standard deviation values of the digital numbers (from the RGB orthomosaics) from each band following [25]. Finally, because the main objective was to compare surface water across sites and time periods, we simplified the detailed classes to produce three final classes: water (including aquatic vegetation), vegetation (not including aquatic species), and infrastructure/manmade structures.
We carried out an accuracy assessment of the GEOBIA classification by generating 144–160 points per site per date representing the three final classes through visual interpretation of the orthomosaics. Table 2 illustrates the confusion matrix for the September classification of the Site 1B orthomosaic as an example; the accuracies of all orthomosaics were comparable.
2.5.2. Satellite Image Classification
The individual images and the temporal layer stack were first segmented using a multi-resolution segmentation algorithm, with scale = 20, shape= 0.1, and compactness = 0.5. Points representing roads, agricultural crops, trees, wetland, and open water were chosen. We trained and applied a nearest neighbor or Bayes classifier based on object level mean and standard deviation values of reflectance from each band (Figure 7). For the multi-temporal stack, the final classification was simplified to wetland, open water, agriculture, and infrastructure classes. For the single date images, the classifications were simplified to open water and land classes.
Polygons representing wetlands were downloaded from the Ontario Ministry of Natural Resources and Forestry wetland database (https://geohub.lio.gov.on.ca/datasets/mnrf::wetlands/about (accessed on 10 March 2023)). Of the four wetland types in Canada, the one present in the study area is “swamp”. A swamp is defined as follows [26]:
“…wetlands where standing or gently moving waters occur seasonally or persist for long periods, leaving the subsurface continuously waterlogged. The water may also be present as a subsurface flow of mineralized water. The water table may drop seasonally below the rooting zone of the vegetation, creating aerated conditions at the surface. Their substrate consists of mixtures of mineral and organic materials, and peat deposited may be present. The vegetation may consist of dense coniferous or deciduous forest, or tall shrub thickets”.
To validate the wetland baseline classification from the satellite imagery, 157 random points were generated representing the wetland database’s verified polygons and areas outside the polygon boundaries. The random points were generated with a minimum distance constraint of 10 m. Table 3 illustrates the confusion matrix for the wetland baseline classification from the 20-band multi-temporal image.
2.6. Analysis
First, our analysis focused on evaluating the variation of the positional errors between each acquisition, as these errors are key for understanding the quality of the UAS outputs. Second, for the UAS GEOBIA classification we compared water surface area changes across time for the four test sites. Third, to assess changes in water level, we determined the elevation of one of the rails from the final 3D point cloud, where the tracks cross a bridge or culvert, and compared its elevation to that of the water surface elevation from a cross section in the 0.5 m DSM. Lastly, from the satellite imagery we assessed the baseline wetland classification in comparison to the verified wetland polygon database and compared the extractable water surface area from the individual images.
3. Results
3.1. UAS Data Acquisition
A total of 11,986 photographs were taken, and 43.09 hectares were mapped including the four sites and all sampling dates (Table 4). Figure 8 provides an example of a final 3D point cloud and Figure 9 provides an example of an orthomosaic. Point cloud densities range from 1106 pts/m2 to 3709 pts/m2 with a mean and standard deviation of 2306 ± 760 pts/m2. The density varied spatially throughout the scenes and across sampling dates (Figure 10) but in general ranged from ~400 to ~4000 pts/m2.
A comparison of the height of the railway tracks (negligible change in position between data sets) shows the close agreement between the 3D point clouds over time (Figure 11). In comparison to the October 3D point clouds all data sets acquired with the M300 show a deviation of approximately 1.3 cm (majority of points). The July data acquired with the M600 have a greater deviation (2.0–3.4 cm) from the October dataset.
3.2. Water Area and Water Level
3.2.1. UAS Orthomosaics and 3D Point Clouds
At the wetland sites 1A, 1B, and 2, the greatest water surface area was mapped in June (4%, 5.8%, 4.7% maximum difference, respectively) (Table 5, Figure 12). The models from June also showed the highest water level for those three sites (Figure 13). For the creek site (3A), the highest water level was in October (2.34 ± 0.02 m distance from the rails) and the minimal difference between August and September is within the uncertainty of the estimation (August: 2.47 ± 0.02 m, September: 2.43 ± 0.02 m); no data were acquired in June. October was also the sampling date for site 3A with the largest water surface area (5.9%) versus 4.5% and 4.8% for August and September, respectively. The changes in water surface area at site 3A are minimal (0.03 ha) compared to the wetland sites where the difference between minimum and maximum area coverage was found to be as high as 0.23 ha (Site 2). The larger error bars in Figure 13 for the July sampling date for sites 1A and 1B are from the models generated with the M600.
3.2.2. Satellite Image Classification
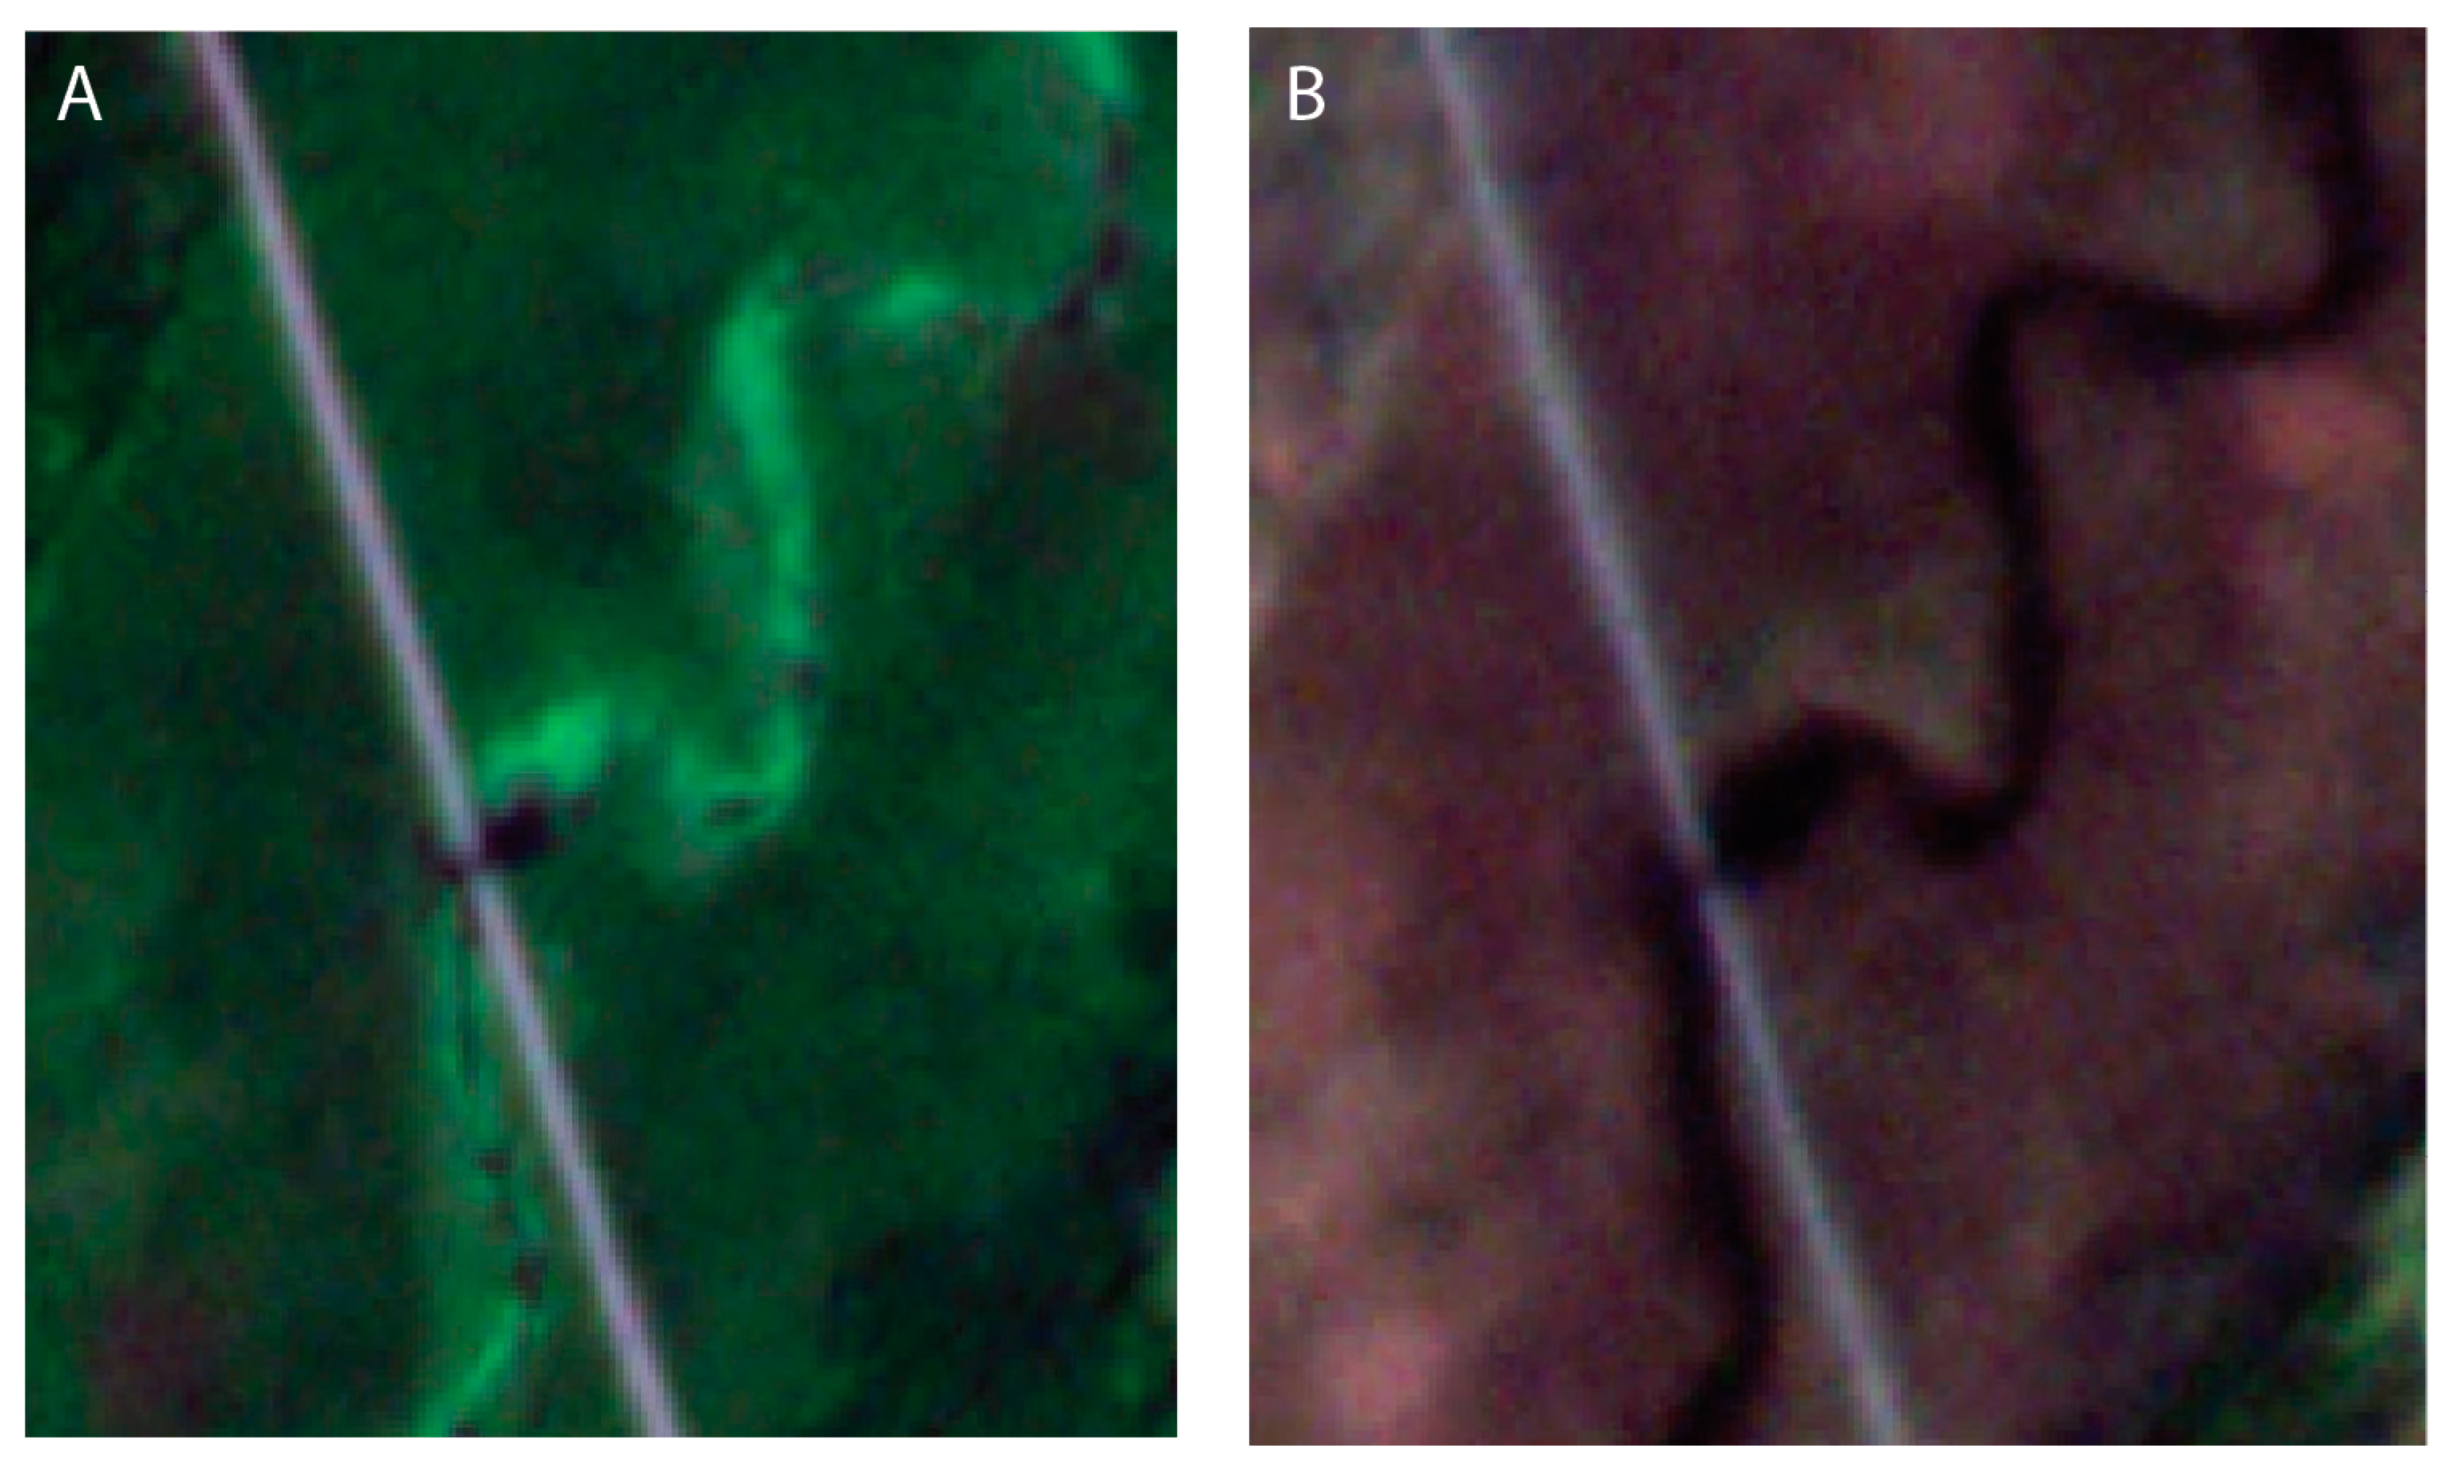
Our results at the larger scale (shown in Figure 14) illustrate the baseline classification of wetlands and the composite and time-specific extractable exposed surface water from the satellite imagery. For the wetland baseline classification, the 23 misclassified wetland points were located in areas with dense tree cover which we had classified as ‘forest’. The open areas of the wetlands are relatively well defined from the multi-temporal stack (Figure 14b). From the single date imagery, the water surface is highly discontinuous in July and September (Figure 14). In comparison, in October, a greater water surface area is extracted in comparison to the multi-temporal stack. In October, open water surface is no longer covered by the floating and emergent plants (Figure 15) as it is earlier in the season.
4. Discussion
With the increasing popularity of the UAS across all sectors in North America, including commercial operations (e.g., [27,28,29], there is an increasing need for the development of best practices to ensure consistent high-quality data acquisition and generation of products. As we showed, mission planning, data acquisition, and processing were key aspects for determining the vertical and horizontal change in water surface within the selected areas and across time. A key aspect of the mission planning and data acquisition that allowed for comparable multi-temporal data to be acquired (Figure 11) was the implementation of standard Geographic Information Systems (GIS) practices such as ensuring precise coordinates for the UAS RTK base station.
Analysis of the orthomosaics (and the 3D point cloud) required an understanding of the ecosystem. In a wetland (specifically a swamp as classified by the Ontario Ministry of Natural Resources and Forestry [26]), the meaning of ‘water extent’ is difference from the conventional perception of water being visible at the surface. The floating and emergent aquatic plants obscure the surface and as such need to be considered when quantifying the surface area of the water around the railway track. Results from [30] also indicate the need to consider floating vegetation separately in the generation of an accurate land cover map of a tropical wetland. In addition, because of the seasonal vegetation dynamics in the wetlands (i.e., growth and senescence), use of exposed water area as a proxy for water surface should be interpreted with caution. Early and late in the season, immature and senescent wetland vegetation exposes a larger portion of the water surface due to the seasonal changes in vegetation (Figure 12).
As expected, due to the changes in the vegetation cover over the growing season, the water area is underestimated from the satellite imagery (3 m pixels) (Figure 14 and Figure 15). In general, very few areas of exposed surface water are large enough to be the main contributor to the pixels. The growth of the wetland vegetation obscures the surface of the water and hence its extraction from the imagery. However, the satellite imagery is beneficial to extract the overall area (i.e., wetland) which is prone to flooding. Similar to the findings of [31], multi-temporal satellite imagery (Figure 7 and Figure 14) was found to be important for classifying the extent of the wetland in comparison to the individual images.
These differences between the UAS photographs and satellite imagery highlight the importance of scale. Using the UAS, the water area extraction was narrowed down to a 50 m buffer on either side of the tracks, providing visibility on the areas that may not be visible from the track level. The consistent multi-temporal UAS datasets facilitated the detection of changes in water level and water surface extent (seasonal changes in this case). The use of a high precision RTK-enabled UAS with a photogrammetric camera is fundamentally important for generating the datasets (3D point clouds, orthomosaics, and DSM) used in this type of analysis. Conversely, the satellite imagery provided a landscape overview of the composition of the landscape and can be used to narrow down the potential high-risk areas (e.g., wetlands) to be investigated at high spatial detail from the UAS data. Importantly, UAS photogrammetric data can be acquired under a range of illumination conditions including overcast skies (which obscure optical satellite imagery). Real-time remote visual inspection can further be carried out in adverse conditions such as rain, if necessary, with systems such as the M300RTK, which has an ingress protection rating of IP45 and can be used in rain up to 100 mm/24 h [32].
The need for a multi-scale approach that does not rely entirely on satellite imagery is exemplified by the Transportation Safety Board report describing a derailment along the Hudson Bay Line in a remote section of the track near Ponton, Manitoba, Canada in September 2018 [33]. The cause of the derailment was a sudden washout of the fill supporting the track over a small creek. The washout was due to unusually high precipitation (>60% over historical average) and the subsequent rupture of a beaver dam upstream [34]. The additional water increased the hydraulic pressure on the raised subgrade contributing to the failure. The event happened so rapidly during cloudy weather that it was not captured via satellite imagery.
Beaver dams have been successfully mapped from satellite imagery [35] and their locations when in proximity to tracks can be used to prioritize areas where high spatial detail, multi-temporal UAS imagery would be beneficial to acquire for a more detailed risk analysis. Many sections of Canadian railways in remote locations are built on fills at risk of a washout when exposed to unusual water events such as high precipitation, beaver dam ruptures, blocked culvert, etc. [33]. When a washout occurs, entire sections of track are essentially shut down resulting in economic consequences for the railways and livelihood repercussions for remote communities depending on the supplies brought by the railways.
The generation of the orthomosaics and 3D points for this project was completed primarily with Pix4D Mapper (Figure 4) with additional cleaning and quality checks with other software (CloudCompare and quick Terrain Modeler), resulting in the high accuracy datasets. In addition, generation of the initial dense 3D point clouds took between 1.5–4 h of processing per site. The time for processing could be reduced by acquiring smaller areas or by using an analytical workflow that is specifically for emergency response situations (e.g., Pix4Dreact) where the time to complete the processing is greatly reduced with a tradeoff of lower resolution and spatial accuracy. Nevertheless, our proof of concept should be integrated considering other aspects of water level/extent changes along the railway tracks, for example, as part of a monitoring program that evaluates hydrological changes locally and at the landscape levels.
Finally, a recent initiative from the European Commission investigated the use of UAS for autonomous, self-recharging, and continuously operating inspections of transport infrastructures [36]. Furthermore, regulatory developments such as the European Union Specific class Predefined Risk Assessment PDRA-G03 for Beyond Visual Line of Sight (BVLOS) flights [37] or the Transport Canada Standard Scenario STS-004 for BVLOS flight over low-risk ground areas in low-risk airspace are paving the way for long-range UAS inspections/mapping of transportation infrastructure. Some UAS have the demonstrated ability for BVLOS operations several kilometers from the operator, e.g., [38], allowing for increased flexibility and repeated monitoring. This is especially important because large sections of track in Canada are located in what is known as “dark territory”. In these remote sectors, the rail traffic controller has no way of detecting where the train is located or what is happening [33]. If a derailment occurs in these sectors, it can go unnoticed for several hours especially if the personnel are incapacitated. Developing a UAS-based approach that is flexible, scalable, practical, and easy-to-use would enable Canadian railways to use UAS during the inspections that are conducted following extreme events, such as heavy rainfall, to ensure track safety prior to train passage.
5. Conclusions
We showed that a combination of UAS data and satellite imagery can provide comprehensive information at multiple scales to detect and monitor fine scale changes of water area and level around railway tracks. Best practices of mission planning, data acquisition, and analysis must be adhered to for generating repeatable data and results. In the long term, this work is expected to contribute to the following:
- Improving the safety of railway operations by providing solutions based on emerging technologies that are able to detect problematic sources of water that are difficult to detect with current methods.
- Improving the fluidity of train traffic by reducing track downtime by implementing automated methods as an alternate solution to time consuming and labor-intensive visual inspections.
Finally, users need to consider the advantages and disadvantages of both the UAS and satellite-based assessments. For instance, although the high spatial detail satellite imagery used here cannot capture changes in water level, it can provide a large-scale understanding of temporal fluctuations in water extent from which potential future incidents may be predicted (e.g., increasing extent of water near a culvert could indicate a blockage). The high spatial resolution imagery used in this study also has a cost for commercial applications (e.g., railways purchasing imagery). Large areas to be covered and high temporal frequency of such imagery could be prohibitively expensive for commercial implementation. Conversely, a commercial off-the-shelf UAS like the one used in our study is relatively inexpensive and can be easily integrated into a railway monitoring program for focal areas that need to be monitored on a regular basis. A single time period of satellite imagery could provide the locations where UAS systems can be deployed for ongoing seasonal monitoring or a preventative measure after weather events.
Author Contributions
Conceptualization, A.R., J.P.A.-M. and M.K.; methodology, M.K. and J.P.A.-M.; formal analysis, M.K. and J.P.A.-M.; data collection, all authors.; writing—original draft preparation, J.P.A.-M., M.K. and A.R.; writing—review and editing, all authors. All authors have read and agreed to the published version of the manuscript.
Funding
This research was funded by Transport Canada Innovation Center, National Research Council Canada Resilient Ground Transportation Research Program, and the Natural Sciences and Engineering Research Council Canada (NSERC).
Data Availability Statement
Restrictions apply to the availability of these data.
Acknowledgments
Special thanks to Paul Charbachi from VIA Rail Canada, Brooke Jones from Transport Canada, and Robert Caldwell, Sylvie Chénier, and Albert Wahba from NRC.
Conflicts of Interest
The authors declare no conflict of interest. The funders had no role in the design of the study; in the collection, analyses, or interpretation of data; in the writing of the manuscript; or in the decision to publish the results.
References
- Trenberth, K.E. Changes in precipitation with climate change. Clim. Res. 2011, 47, 123–138. [Google Scholar] [CrossRef]
- Nemry, F.O.; Demirel, H. Impacts of Climate Change on Transport a Focus on Road and Rail Transport Infrastructures; European Commission: Brussels, Belgium, 2012.
- Palin, E.J.; Stipanovic Oslakovic, I.; Gavin, K.; Quinn, A. Implications of climate change for railway infrastructure. WIREs Clim. Change 2021, 12, e728. [Google Scholar] [CrossRef]
- Hansen, J.; Sato, M.; Ruedy, R.; Lo, K.; Lea, D.W.; Medina-Elizade, M. Global temperature change. Proc. Natl. Acad. Sci. USA 2006, 103, 14288–14293. [Google Scholar] [CrossRef]
- Meehl, G.A.; Arblaster, J.M.; Tebaldi, C. Understanding future patterns of increased precipitation intensity in climate model simulations. Geophys. Res. Lett. 2005, 32, L18719. [Google Scholar] [CrossRef]
- Fischer, E.M.; Knutti, R. Anthropogenic contribution to global occurrence of heavy-precipitation and high-temperature extremes. Nat. Clim. Change 2015, 5, 560–564. [Google Scholar] [CrossRef]
- Rahmstorf, S. Rising hazard of storm-surge flooding. Proc. Natl. Acad. Sci. USA 2017, 114, 11806–11808. [Google Scholar] [CrossRef] [PubMed]
- Roghani, A.; Mammeri, A.; Siddiqui, A.J.; Abdulrazagh, P.H.; Hendry, M.T.; Pulisci, R.M.; Canadian Rail Research, L. Using emerging technologies for monitoring surface water near railway tracks. In Proceedings of the Canadian & Cold Regions Rail Research Conference 2021 (CCRC 2021), Virtual Event, 9 November 2021; pp. 106–114. [Google Scholar]
- Esmaeeli, N.; Sattari, F.; Lefsrud, L.; Macciotta, R. Critical Analysis of Train Derailments in Canada through Process Safety Techniques and Insights into Enhanced Safety Management Systems. Transp. Res. Rec. 2022, 2676, 603–625. [Google Scholar] [CrossRef]
- Transportation Safety Board of Canada. Railway Investigation Report R09H0006. 2009. Available online: https://www.tsb-bst.gc.ca/eng/rapports-reports/rail/2009/r09h0006/r09h0006.html (accessed on 10 March 2023).
- Pickens, A.H.; Hansen, M.C.; Stehman, S.V.; Tyukavina, A.; Potapov, P.; Zalles, V.; Higgins, J. Global seasonal dynamics of inland open water and ice. Remote Sens. Environ. 2022, 272, 112963. [Google Scholar] [CrossRef]
- Cooley, S.W.; Smith, L.C.; Ryan, J.C.; Pitcher, L.H.; Pavelsky, T.M. Arctic-Boreal Lake Dynamics Revealed Using CubeSat Imagery. Geophys. Res. Lett. 2019, 46, 2111–2120. [Google Scholar] [CrossRef]
- Kalacska, M.; Chmura, G.L.; Lucanus, O.; Bérubé, D.; Arroyo-Mora, J.P. Structure from motion will revolutionize analyses of tidal wetland landscapes. Remote Sens. Environ. 2017, 199, 14–24. [Google Scholar] [CrossRef]
- Kalacska, M.; Lucanus, O.; Arroyo-Mora, J.P.; Laliberté, É.; Elmer, K.; Leblanc, G.; Groves, A. Accuracy of 3D Landscape Reconstruction without Ground Control Points Using Different UAS Platforms. Drones 2020, 4, 13. [Google Scholar] [CrossRef]
- Cadieux, N. Shapefile to DJI Pilot KML Conversion Tool. 2023. Available online: https://borealisdata.ca/dataset.xhtml?persistentId=doi:10.5683/SP3/W1QMQ9 (accessed on 10 March 2023).
- DJI. A3-Pro User Manual; DJI: Schenzen, China, 2016; Available online: https://dl.djicdn.com/downloads/a3/en/A3_and_A3_Pro_User_Manual_en_160520.pdf (accessed on 15 May 2022).
- Kalacska, M.; Arroyo-Mora, J.P.; Lucanus, O. Comparing UAS LiDAR and Structure-from-Motion Photogrammetry for Peatland Mapping and Virtual Reality (VR) Visualization. Drones 2021, 5, 36. [Google Scholar] [CrossRef]
- Gómez-Gutiérrez, Á.; Sanjosé-Blasco, J.J.; Lozano-Parra, J.; Berenguer-Sempere, F.; de Matías-Bejarano, J. Does HDR Pre-Processing Improve the Accuracy of 3D Models Obtained by Means of two Conventional SfM-MVS Software Packages? The Case of the Corral del Veleta Rock Glacier. Remote Sens. 2015, 7, 10269–10294. [Google Scholar] [CrossRef]
- Seitz, S.M.; Curless, B.; Diebel, J.; Scharstein, D.; Szeliski, R. A comparison and evluation of Multi-Voew Serep reconstruction algorithm. In Proceedings of the IEEE Computer Society Conference on Computer Vision and Pattern Recognition, New York, NY, USA, 17–22 June 2006. [Google Scholar]
- Frazier, A.E.; Hemingway, B.L. A Technical Review of Planet Smallsat Data: Practical Considerations for Processing and Using PlanetScope Imagery. Remote Sens. 2021, 13, 3930. [Google Scholar] [CrossRef]
- Hay, G.J.; Castilla, G. Geographic Object-Based Image Analysis (GEOBIA): A new name for a new discipline. In Geographic Object-Based Image Analysis (GEOBIA): A New Name for a New Discipline; Blaschke, T., Lang, S., Hay, G.J., Eds.; Object-Based Image Analysis; Lecture Notes in Geoinformation and Cartography; Springer: Berlin/Heidelberg, Germany, 2008. [Google Scholar]
- Karlson, M.; Reese, H.; Ostwald, M. Tree Crown Mapping in Managed Woodlands (Parklands) of Semi-Arid West Africa Using WorldView-2 Imagery and Geographic Object Based Image Analysis. Sensors 2014, 14, 22643–22669. [Google Scholar] [CrossRef] [PubMed]
- Kim, M.; Warner, T.; Madden, M.; Atkinson, D. Multi-scale GEOBIA with very high spatial resolution digital aerial imagery: Scale, texture and image objects. Int. J. Remote Sens. 2011, 32, 2825–2850. [Google Scholar] [CrossRef]
- Đurić, N.; Pehani, P.; Oštir, K. Application of In-Segment Multiple Sampling in Object-Based Classification. Remote Sens. 2014, 6, 12138–12165. [Google Scholar] [CrossRef]
- Lucanus, O.; Kalacska, M.; Arroyo-Mora, J.P.; Sousa, L.; Carvalho, L.N. Before and After: A Multiscale Remote Sensing Assessment of the Sinop Dam, Mato Grosso, Brazil. Earth 2021, 2, 303–330. [Google Scholar] [CrossRef]
- National Wetlands Working Group. In Wetlands of Canada. Ecological Land Classification Series; Sustainable Development Branch, Enviromnent Canada: Ottawa, ON, Canada, 1988; p. 452.
- Toriumi, F.Y.; Bittencourt, T.N.; Futai, M.M. UAV-based inspection of bridge and tunnel structures: An application review. Rev. IBRACON De Estrut. E Mater. 2023, 16, e16103. [Google Scholar] [CrossRef]
- Yoon, H.; Shin, J.; Spencer, B.F., Jr. Structural Displacement Measurement Using an Unmanned Aerial System. Comput.-Aided Civ. Infrastruct. Eng. 2018, 33, 183–192. [Google Scholar] [CrossRef]
- Máthé, K.; Buşoniu, L. Vision and Control for UAVs: A Survey of General Methods and of Inexpensive Platforms for Infrastructure Inspection. Sensors 2015, 15, 14887–14916. [Google Scholar] [CrossRef]
- Whiteside, T.G.; Bartolo, R.E. Mapping Aquatic Vegetation in a Tropical Wetland Using High Spatial Resolution Multispectral Satellite Imagery. Remote Sens. 2015, 7, 11664–11694. [Google Scholar] [CrossRef]
- Gao, Y.; Hu, Z.; Wang, Z.; Shi, Q.; Chen, D.; Wu, S.; Gao, Y.; Zhang, Y. Phenology Metrics for Vegetation Type Classification in Estuarine Wetlands Using Satellite Imagery. Sustainability 2023, 15, 1373. [Google Scholar] [CrossRef]
- Knisely, T. Just How Weather Resistant is the Matrice 300 RTK? Available online: https://enterprise-insights.dji.com/blog/matrice-300-weather-resistance (accessed on 10 July 2021).
- Transportation Safety Board of Canada. Rail Transportation Safety Investigation Report R18W0237. 2018; p. 52. Available online: https://www.bst-tsb.gc.ca/eng/rapports-reports/rail/2018/r18w0237/r18w0237.html (accessed on 10 March 2023).
- Neumayer, M.; Teschemacher, S.; Schloemer, S.; Zahner, V.; Rieger, W. Hydraulic Modeling of Beaver Dams and Evaluation of Their Impacts on Flood Events. Water 2020, 12, 300. [Google Scholar] [CrossRef]
- Zhang, W.; Hu, B.; Brown, G.; Meyer, S. Beaver pond identification from multi-temporal and multi- sourced remote sensing data. Geo-Spat. Inf. Sci. 2023, 1–15. [Google Scholar] [CrossRef]
- European Comission. Inspection Drones for Ensuring Safety in Transport Infrastructures. Available online: https://cordis.europa.eu/project/id/861111 (accessed on 20 July 2023).
- Fakhraian, E.; Aghezzaf, E.-H.; Semanjski, S.; Semanjski, I. Overview of European Union Guidelines and Regulatory Framework for Drones in Aviation in the Context of the Introduction of Automatic and Autonomous Flight Operations in Urban Air Mobility. In Proceedings of the DATA ANALYTICS 2022: The Eleventh International Conference on Data Analytics, Valencia, Spain, 13–17 November 2022; pp. 1–7. [Google Scholar]
- Fang, S.X.; O’Young, S.; Rolland, L. Development of Small UAS Beyond-Visual-Line-of-Sight (BVLOS) Flight Operations: System Requirements and Procedures. Drones 2018, 2, 13. [Google Scholar] [CrossRef]
Figure 1.
Relative location of test sites along the railway track in eastern Ontario for assessing change in surface water levels. Railway layer source: Ontario Ministry of Natural Resources and Forestry—Provincial Mapping Unit.
Figure 1.
Relative location of test sites along the railway track in eastern Ontario for assessing change in surface water levels. Railway layer source: Ontario Ministry of Natural Resources and Forestry—Provincial Mapping Unit.
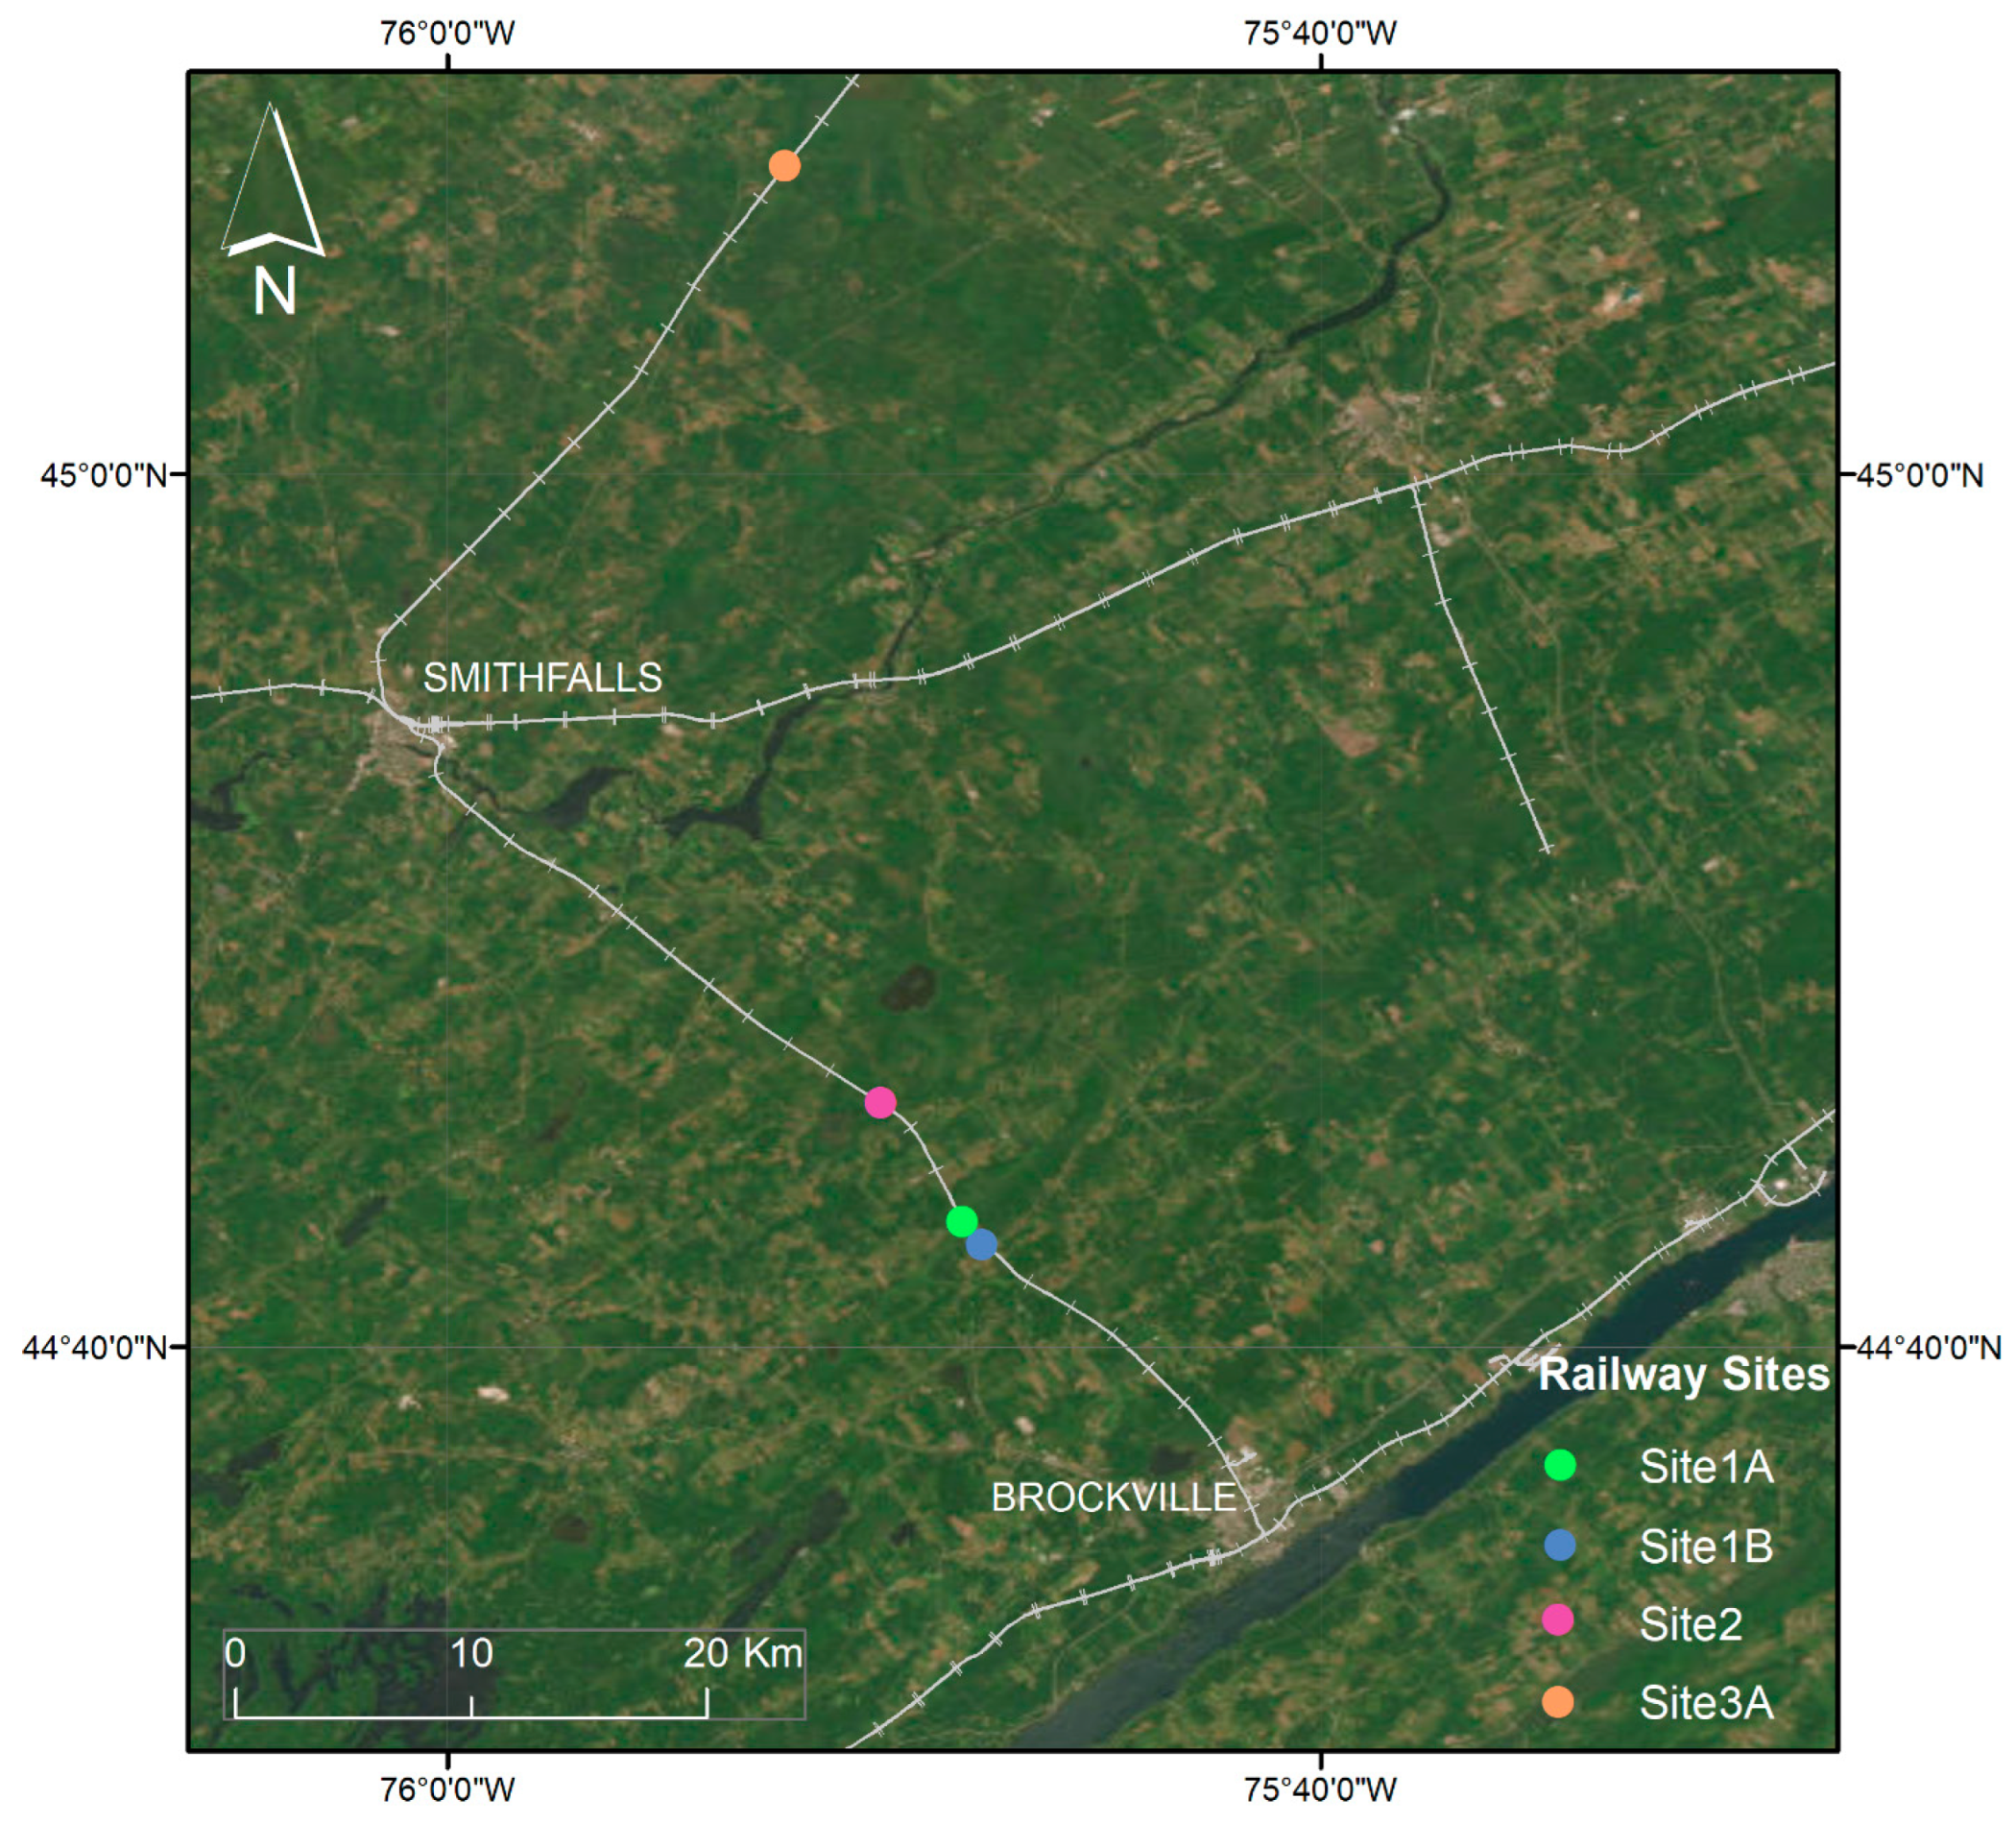
Figure 2.
Example UAS photographs showing the variability of water near the railway track right-of-way. (A) track crossing a wetland, June 2021; (B) track crossing a creek, October 2021.
Figure 2.
Example UAS photographs showing the variability of water near the railway track right-of-way. (A) track crossing a wetland, June 2021; (B) track crossing a creek, October 2021.
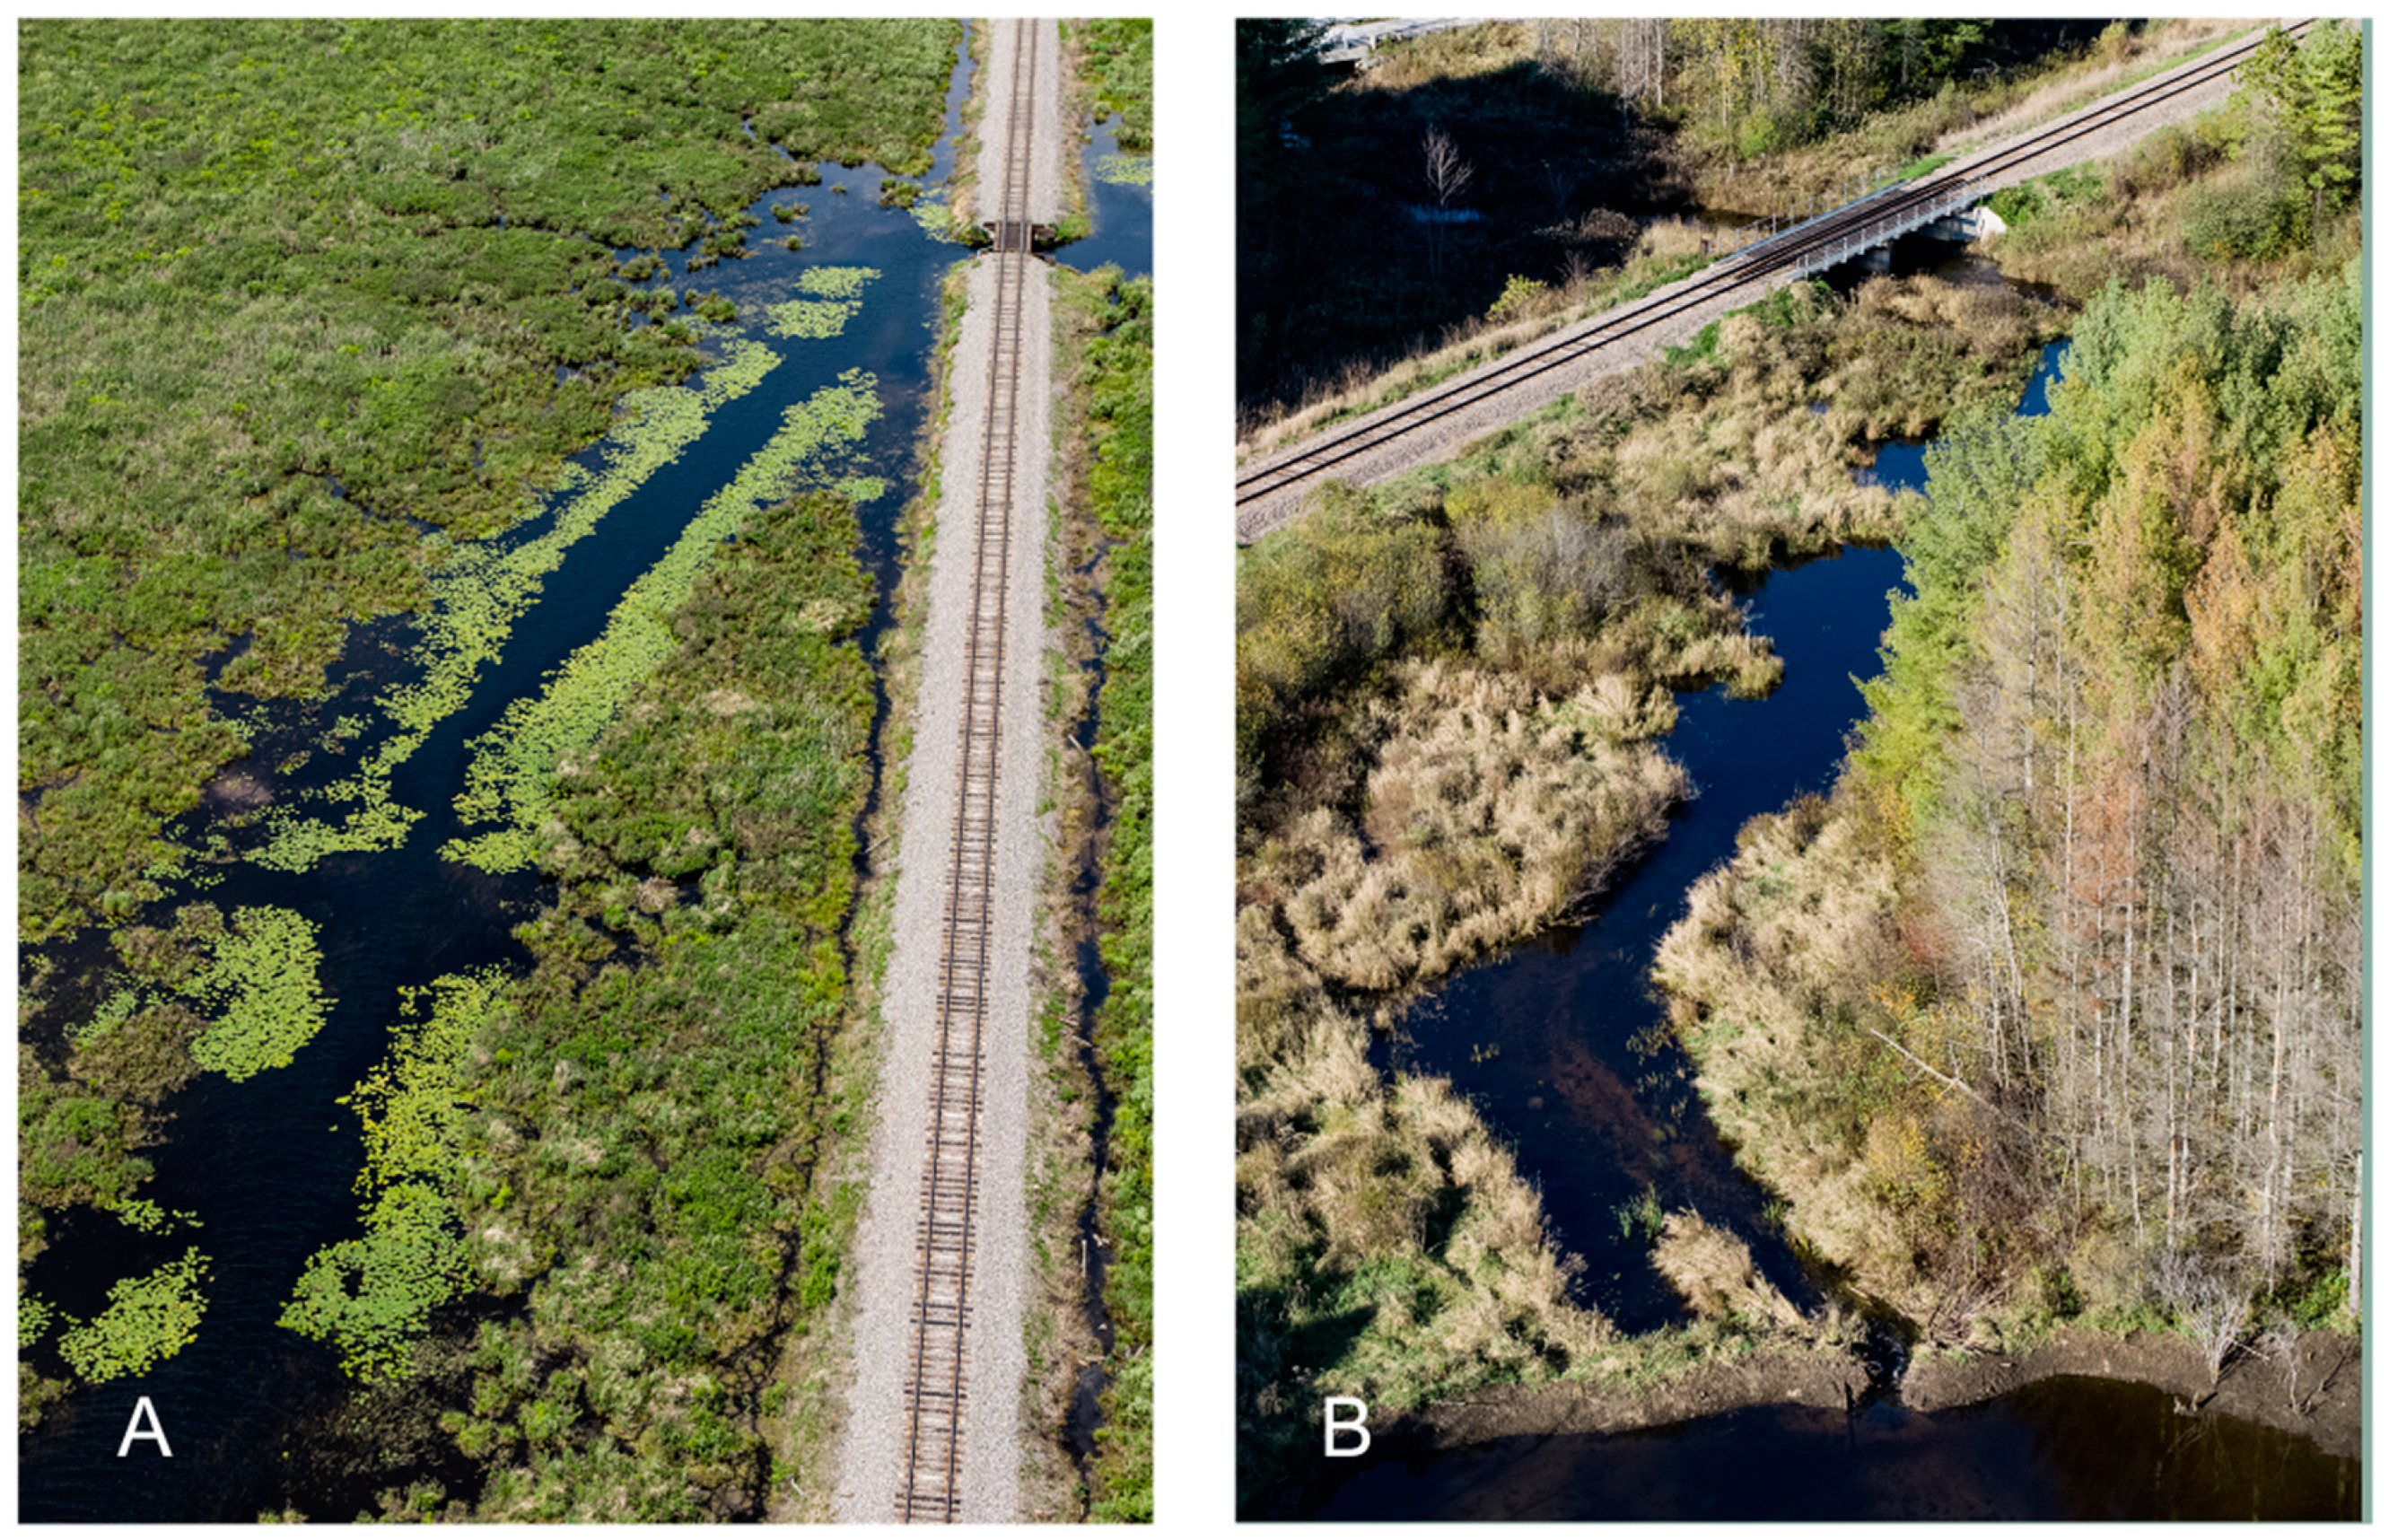
Figure 3.
(A) Photograph of the M300 with P1 camera, circular scanning radar and D-RTK2 base station. (B) Photograph of the M600P with the X5 camera and integrated D-RTK unit.
Figure 3.
(A) Photograph of the M300 with P1 camera, circular scanning radar and D-RTK2 base station. (B) Photograph of the M600P with the X5 camera and integrated D-RTK unit.
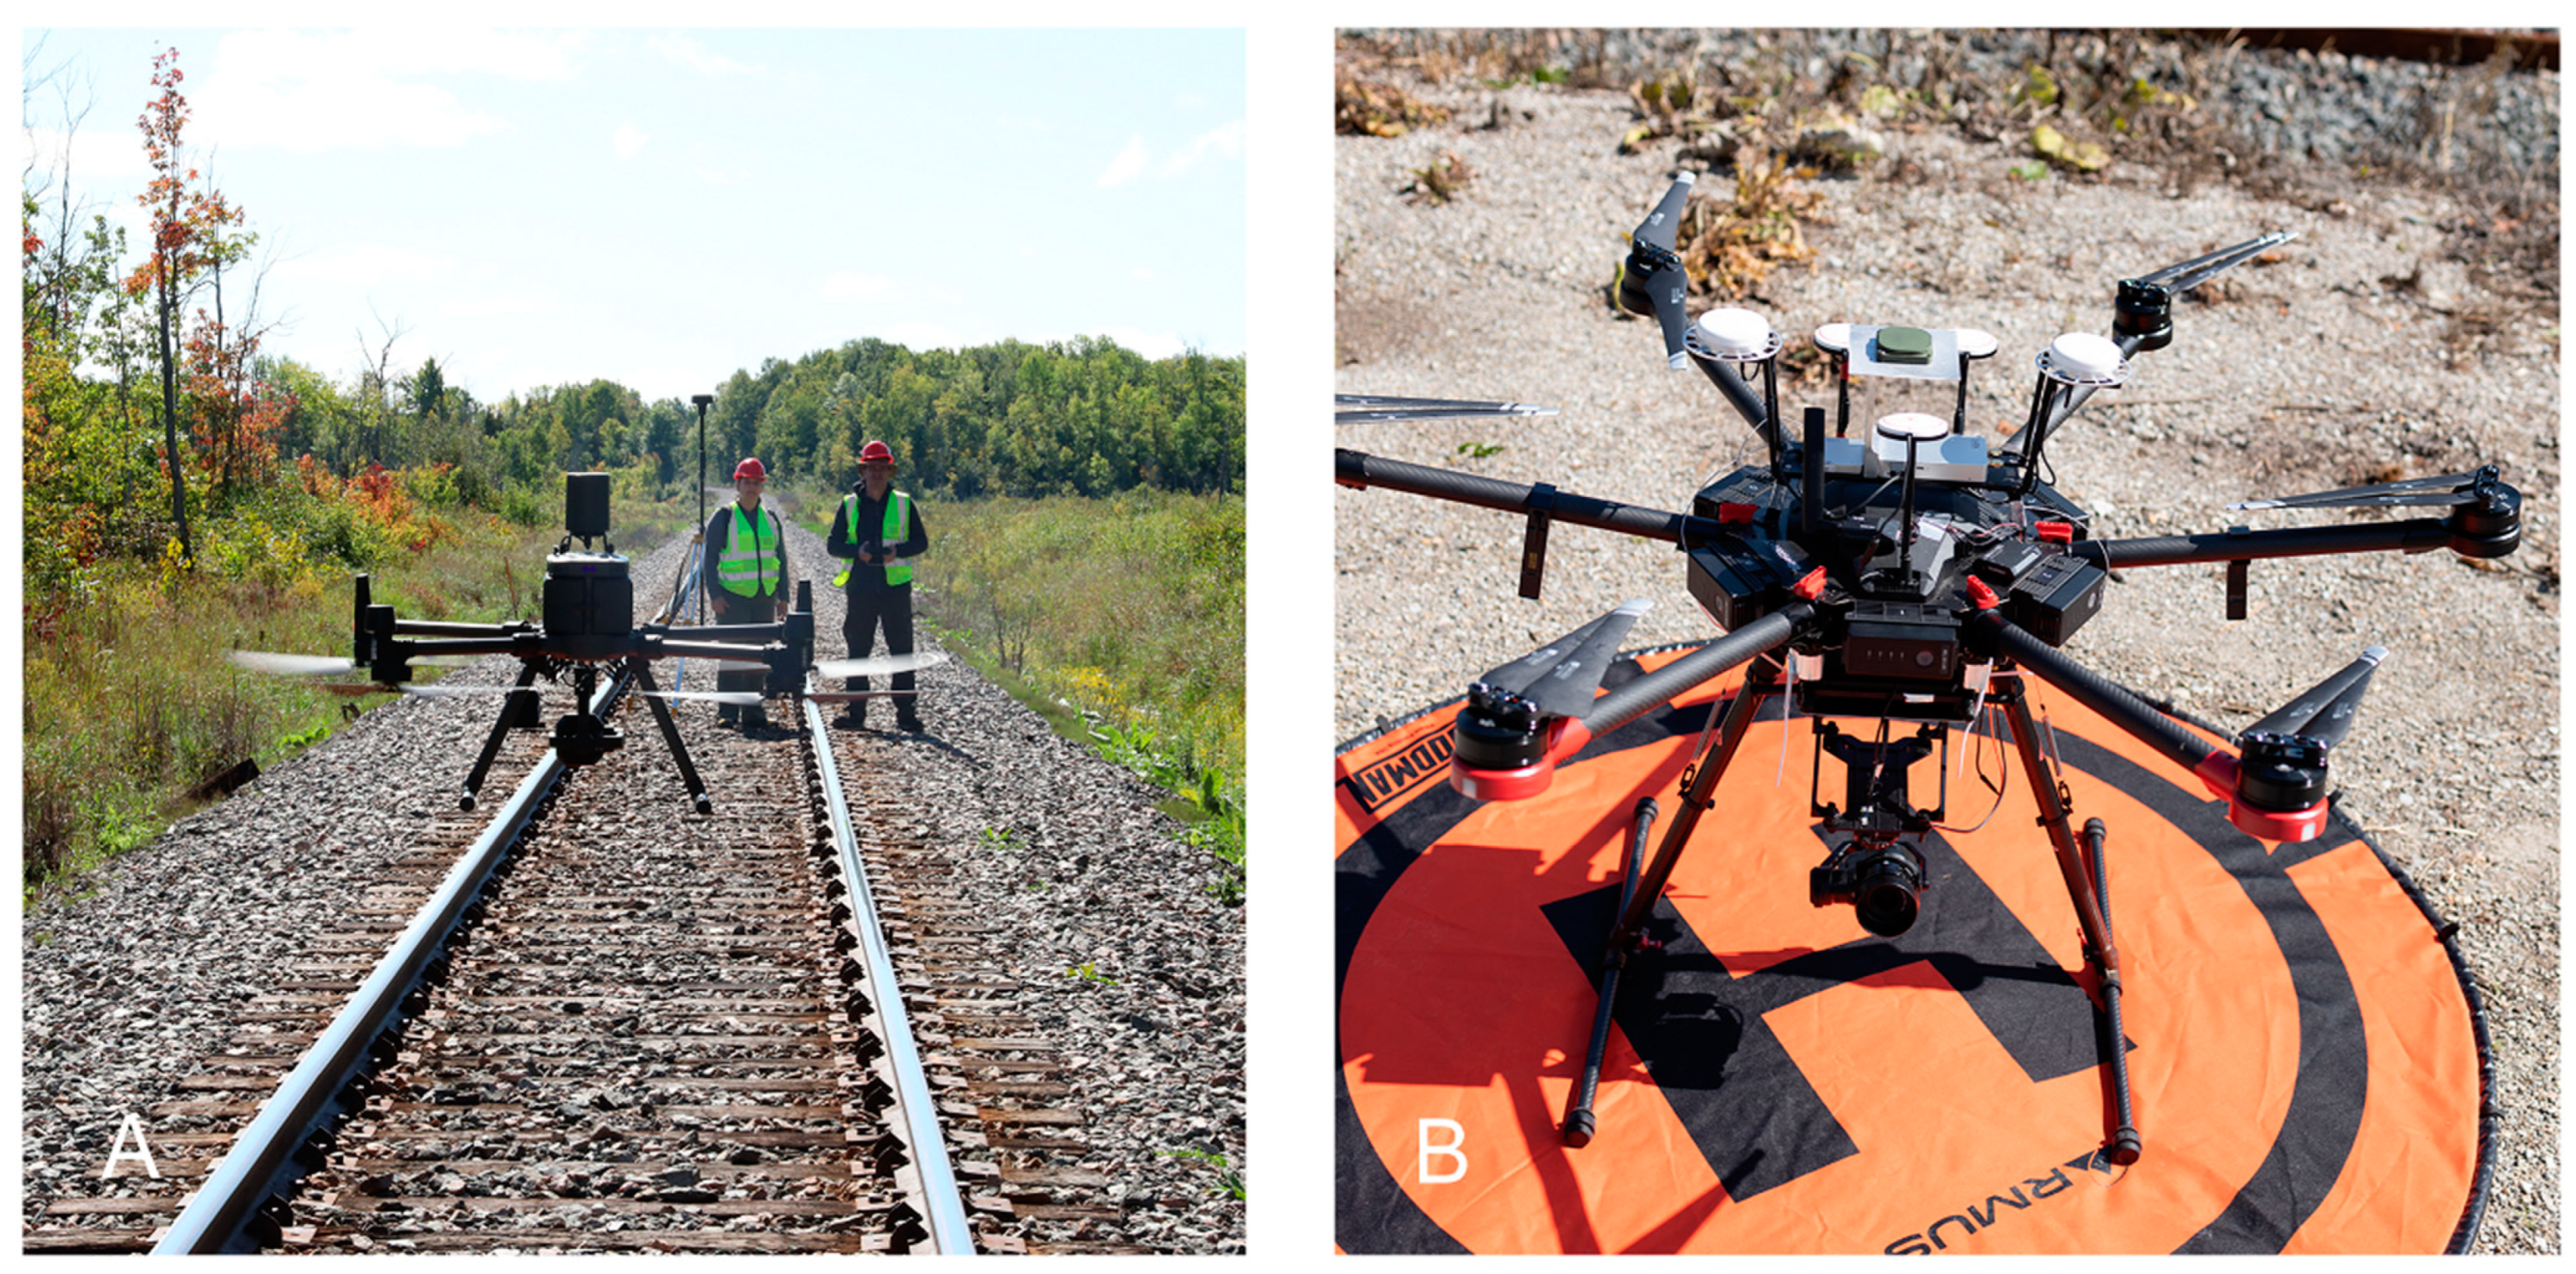
Figure 4.
Flowchart of the SfM-MVS workflow for generating the final products from the UAS RGB photographs. Final products are shown in blue. Processes are coloured based on the software used where green = Pix4D Mapper, orange = CloudCompare and red = Quick Terrain Modeler.
Figure 4.
Flowchart of the SfM-MVS workflow for generating the final products from the UAS RGB photographs. Final products are shown in blue. Processes are coloured based on the software used where green = Pix4D Mapper, orange = CloudCompare and red = Quick Terrain Modeler.
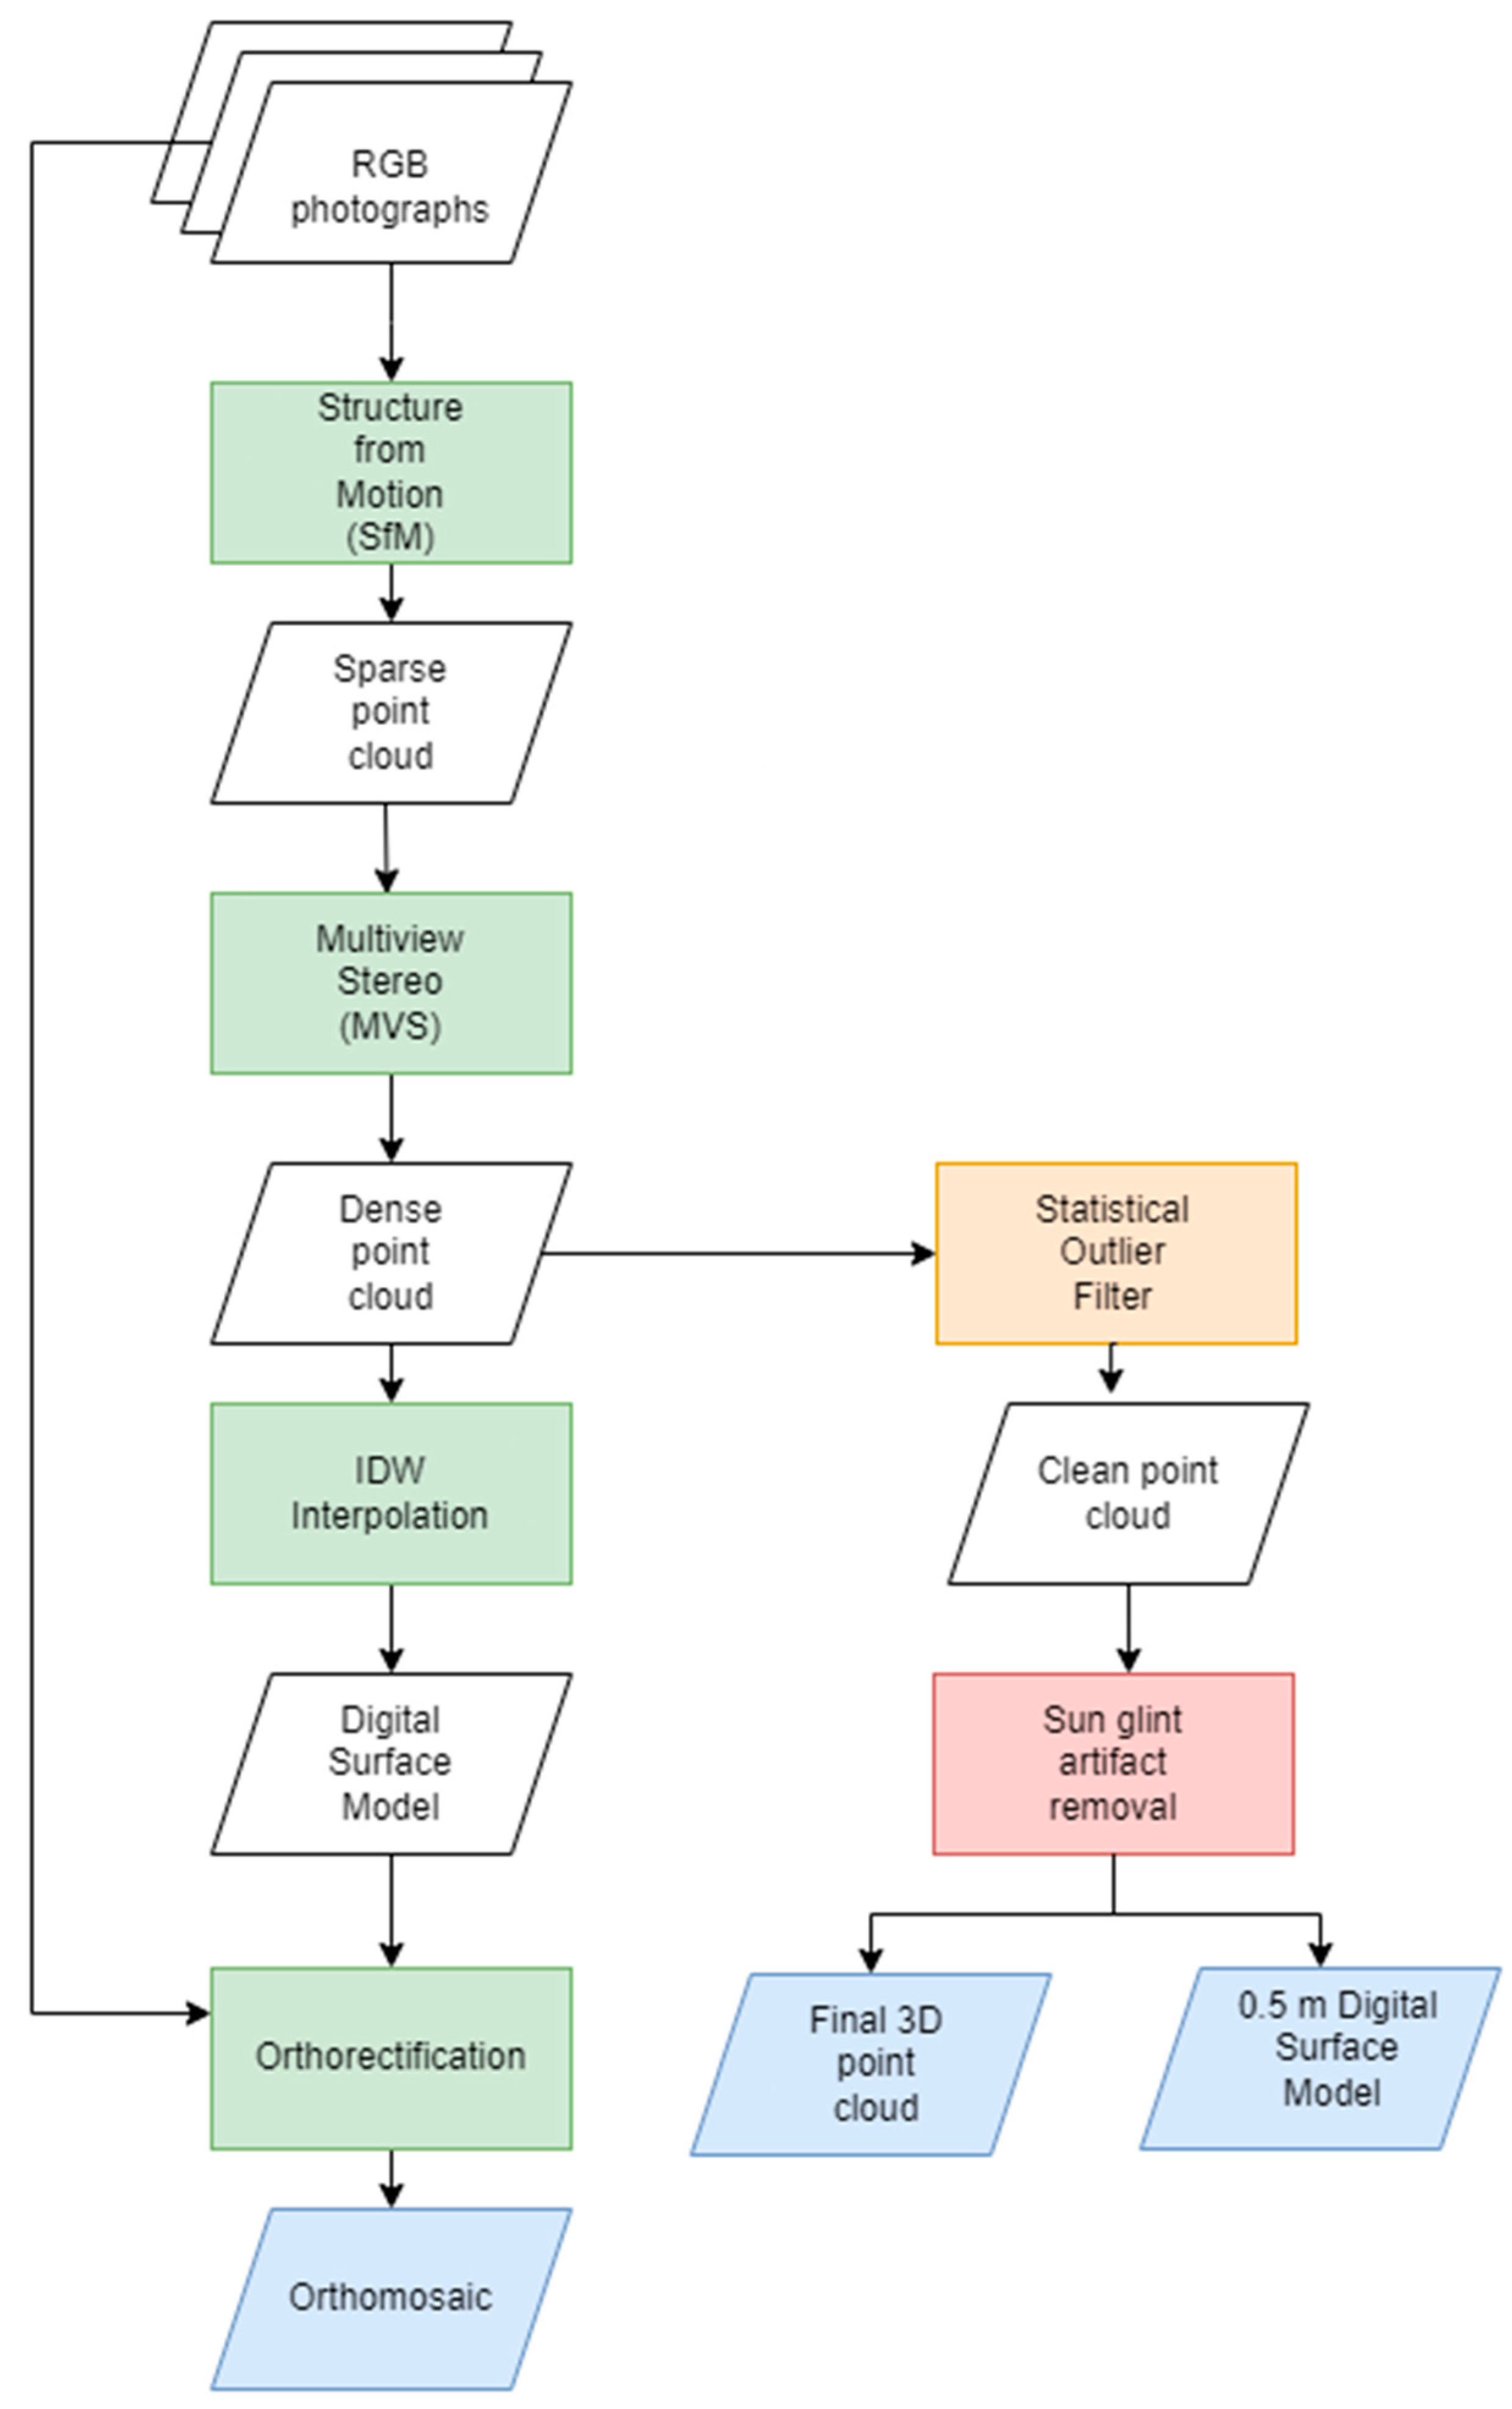
Figure 5.
PlanetScope Dove classic (PS) satellite imagery for sites 1A, 1B, and 2 used for water surface classification at the landscape level. Images were clipped to show the sites.
Figure 5.
PlanetScope Dove classic (PS) satellite imagery for sites 1A, 1B, and 2 used for water surface classification at the landscape level. Images were clipped to show the sites.
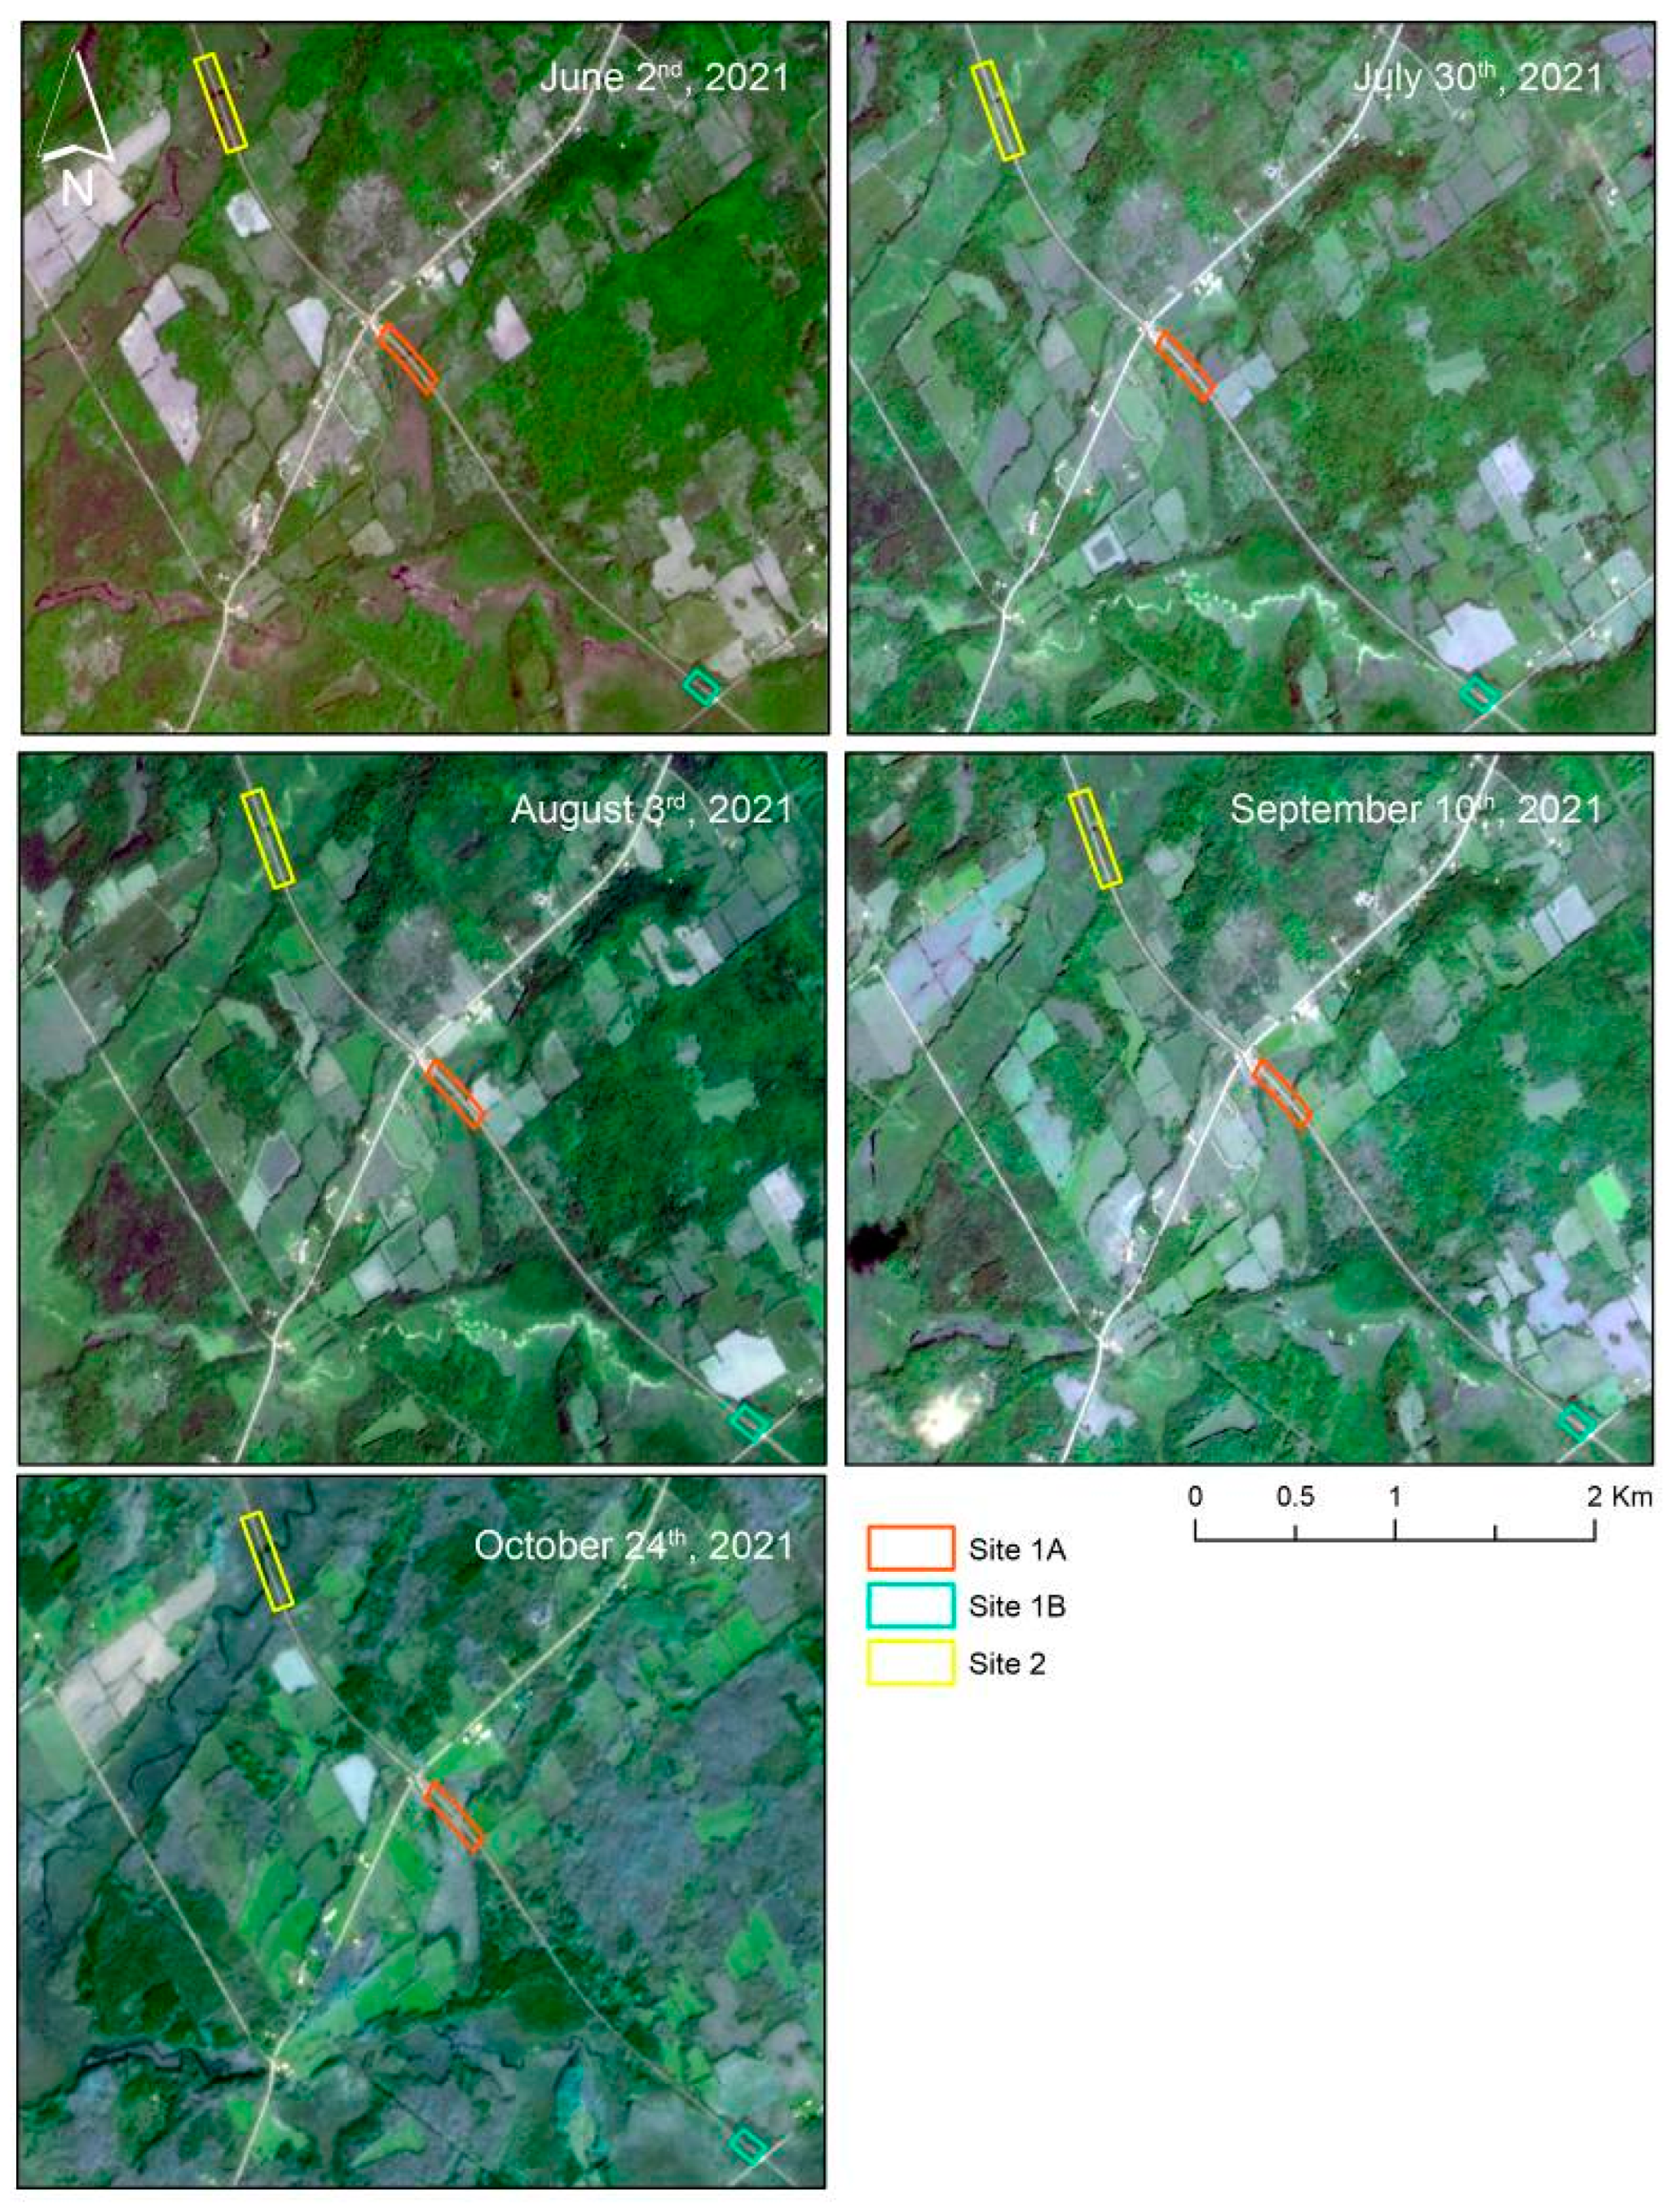
Figure 6.
Examples of aquatic vegetation that are important to consider within the water class when mapping water surface in the study area. (A) Pondweed (Potamogeton nodosus), (B) water lily (Nymphea odorata), (C) duckweed (Lemna minor), (D) water lettuce (Pistia stratiotes), (E) UAS photograph illustrating the aquatic plants in the context of open water near the track.
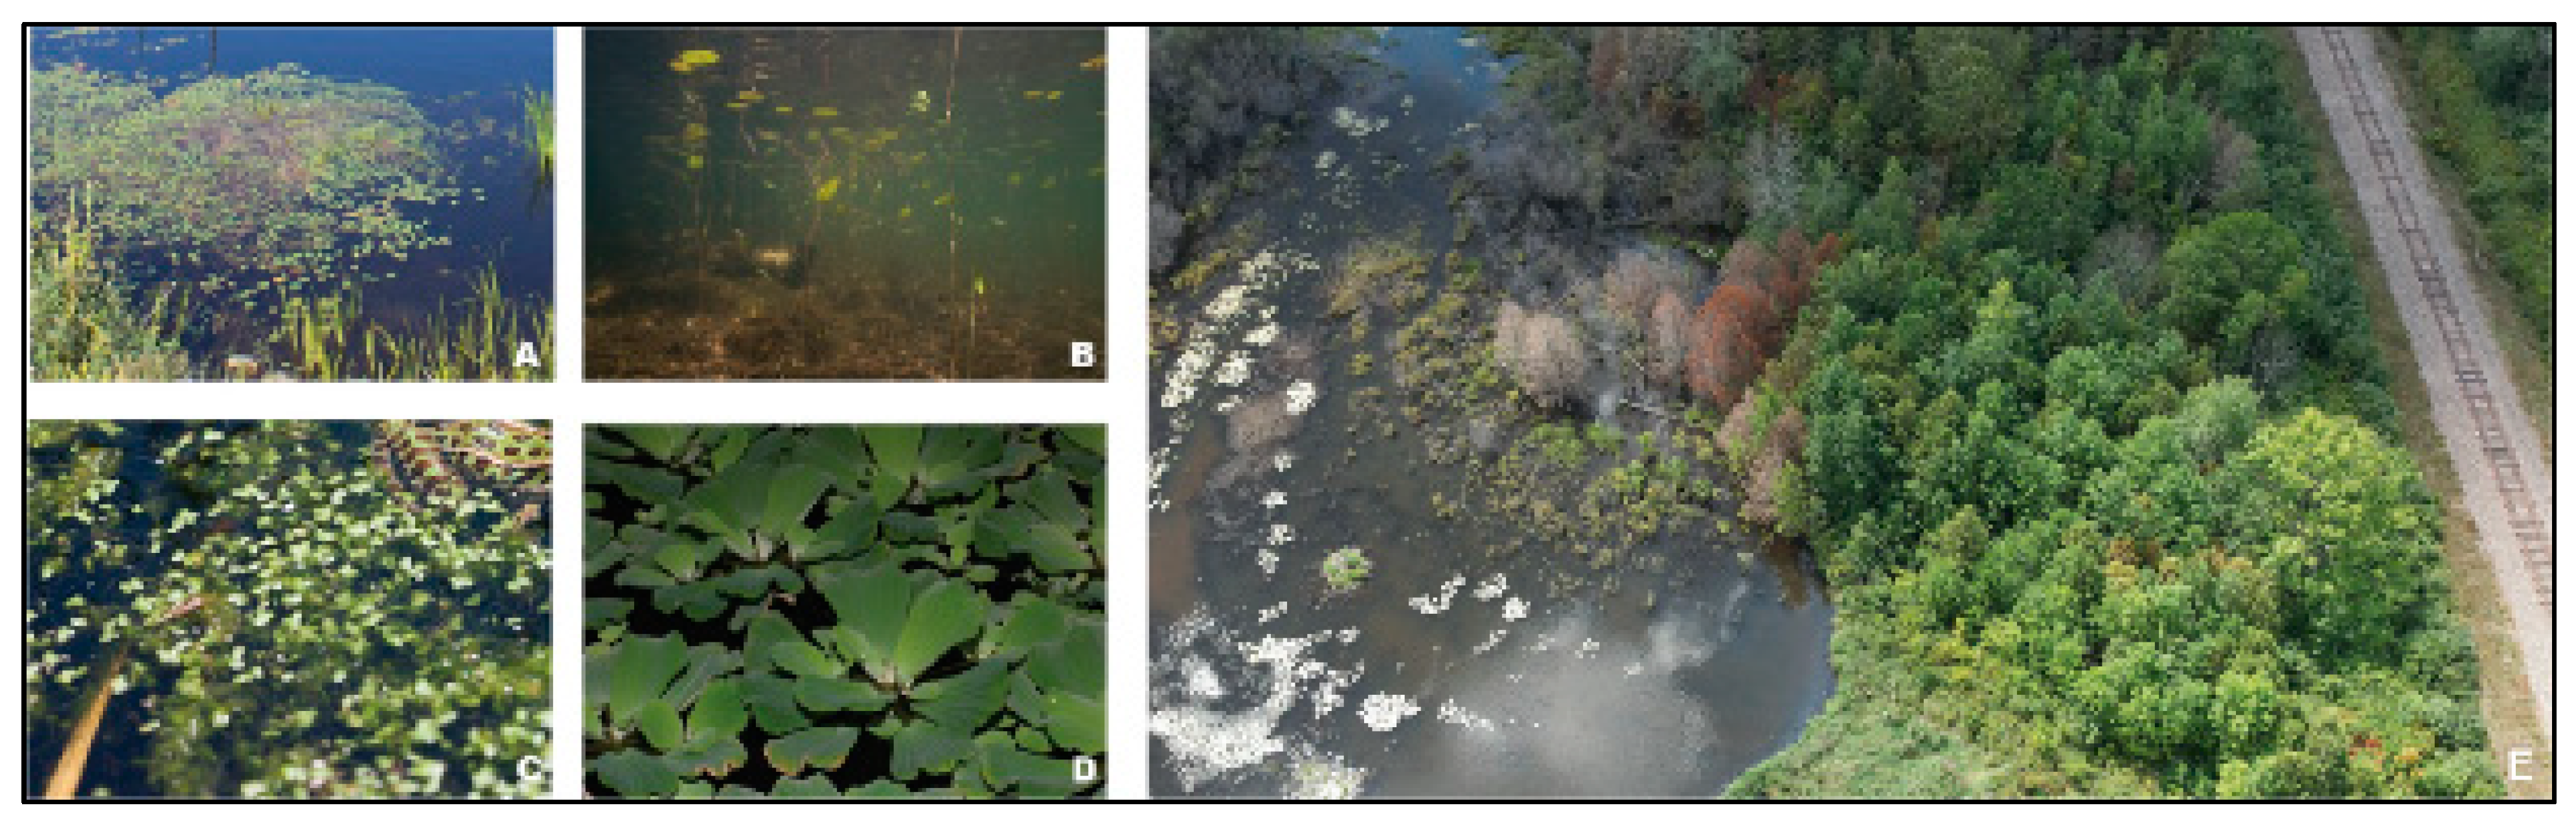
Figure 7.
(A) Example 4-band Planet Dove spectrum from July illustrating the similarity of the wetland class to the tree class; (B) Example multi-temporal spectra from the 20-layer stacked image illustrating wetland, tree, and an agricultural field; (C) 20-band multi-temporal image stack; band combination shown is R: September band 3, G: July band 2, B: June band 2.
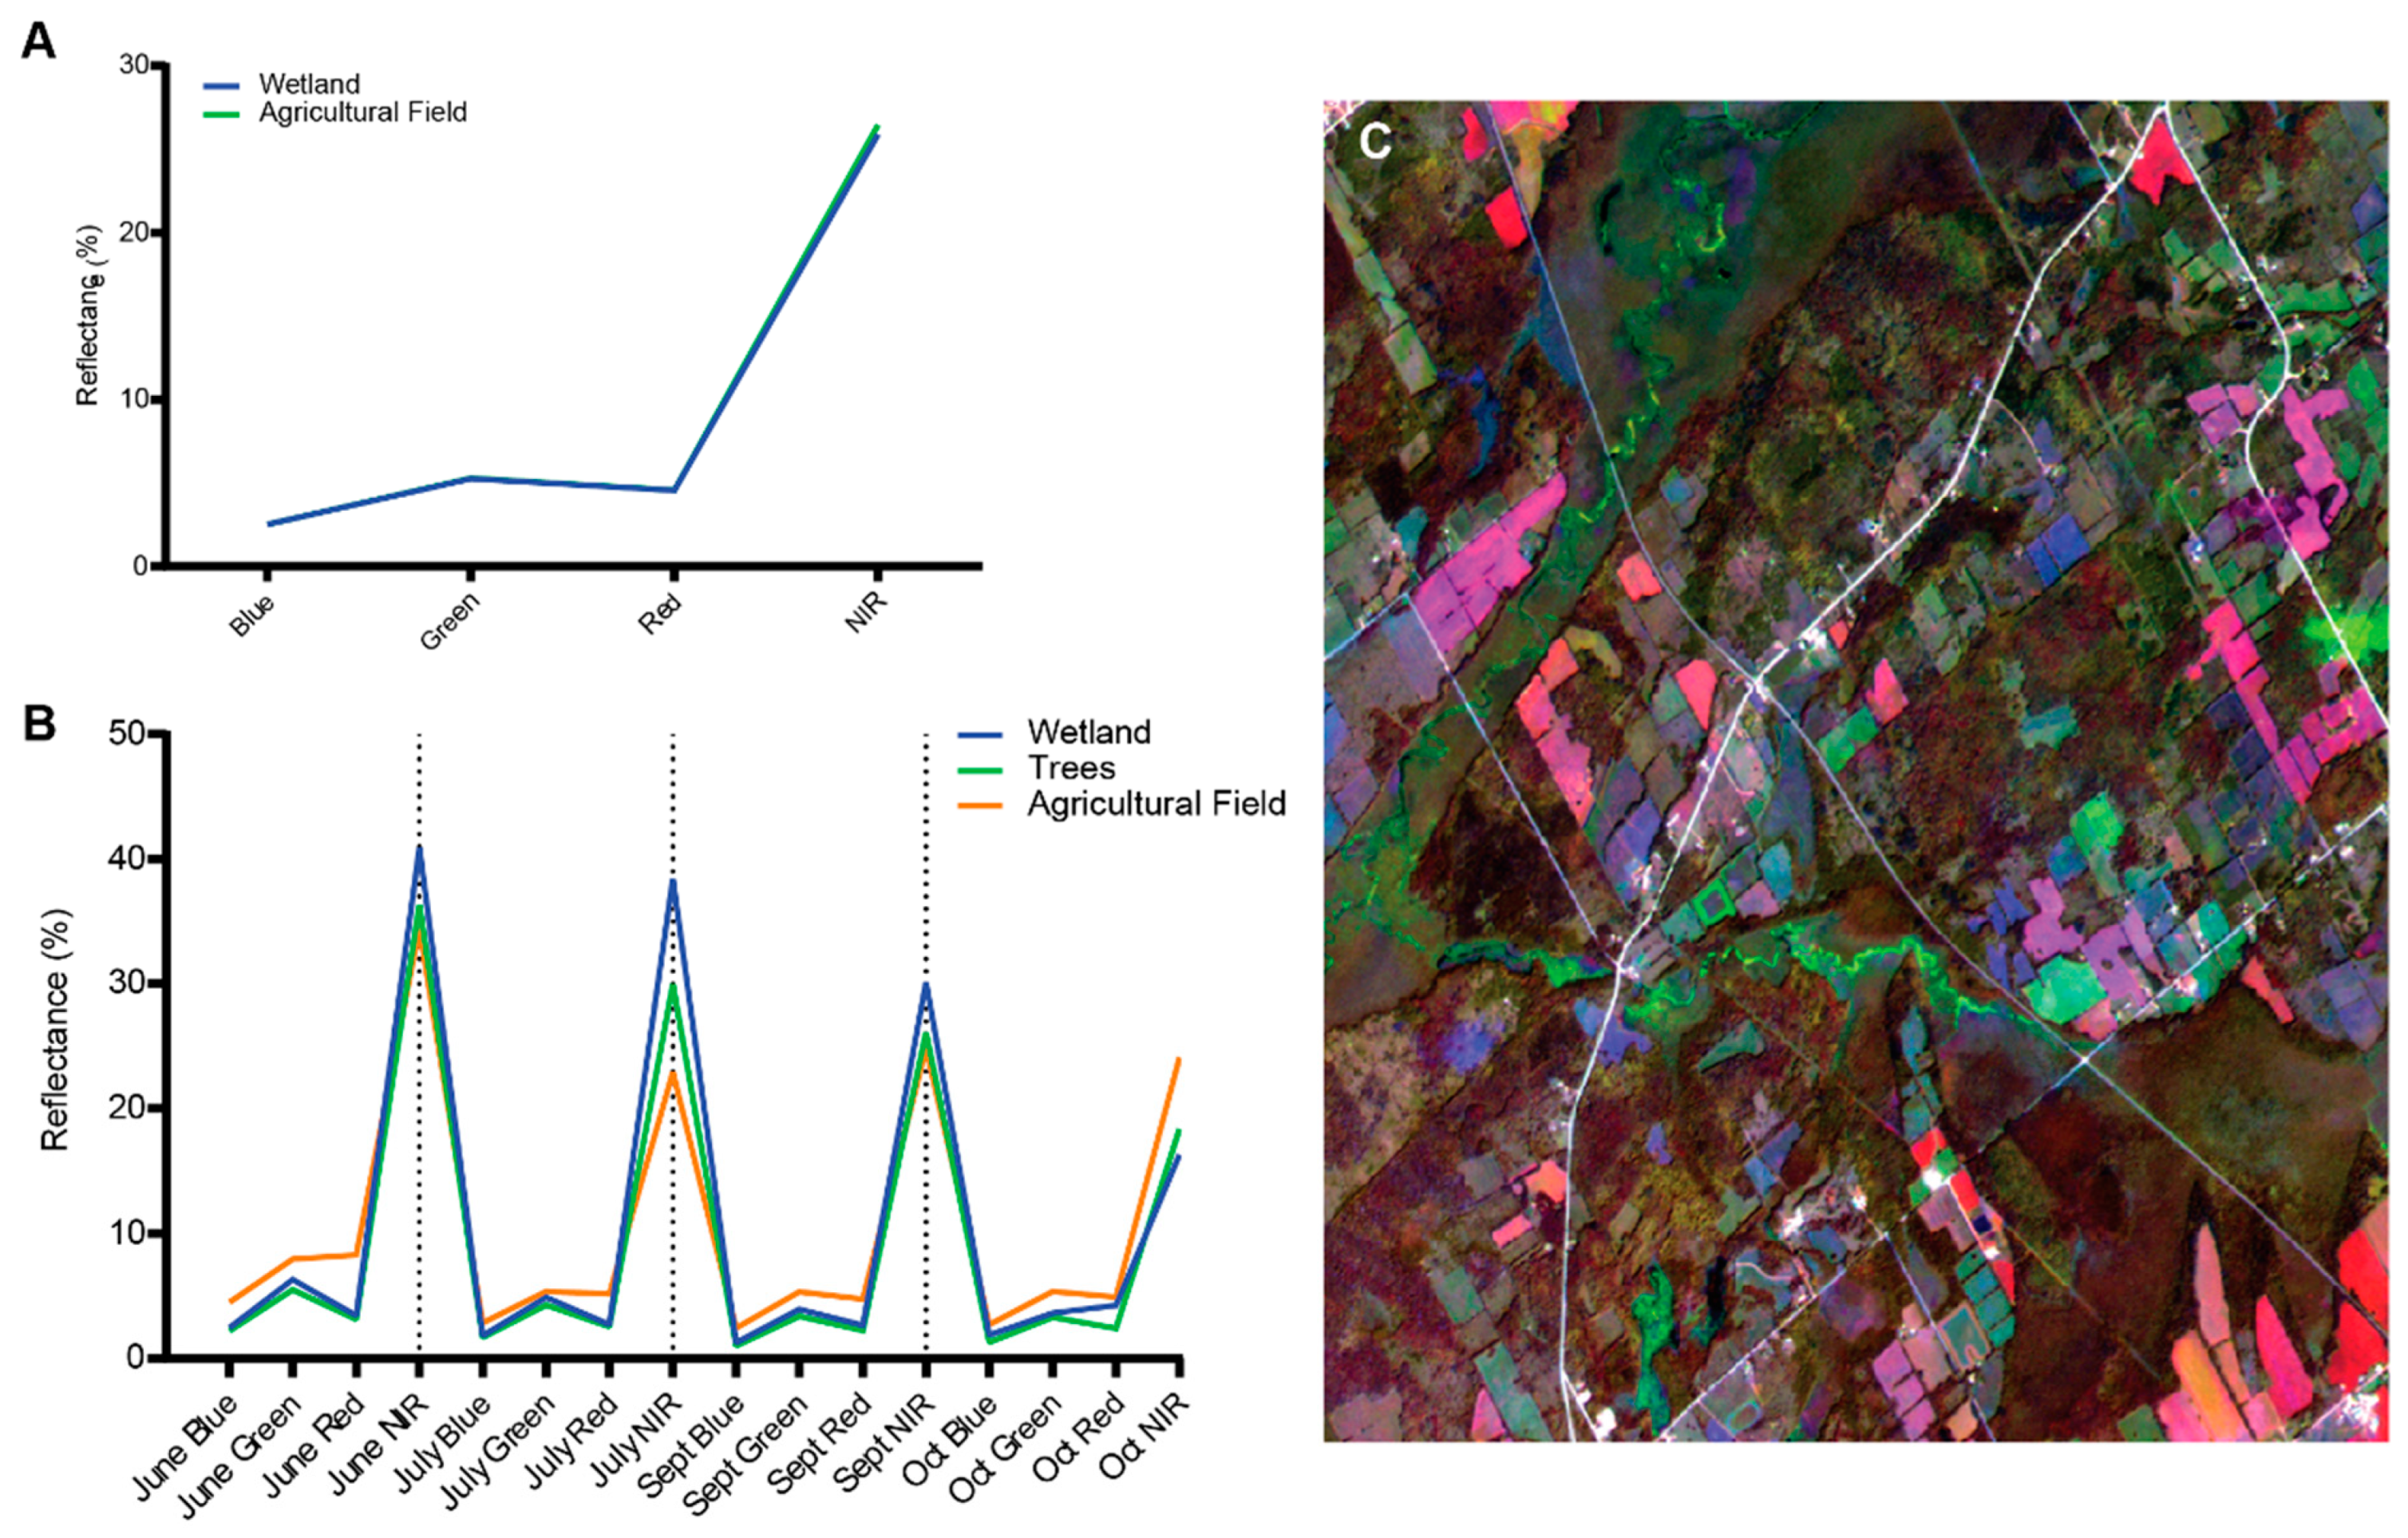
Figure 8.
Example of a final 3D point cloud (Site 3A—August) showing (A) RGB true color representation and (B) height above ellipsoid. The distribution along the vertical axis of the color bar shows the spread of the height values.
Figure 8.
Example of a final 3D point cloud (Site 3A—August) showing (A) RGB true color representation and (B) height above ellipsoid. The distribution along the vertical axis of the color bar shows the spread of the height values.

Figure 9.
Example orthomosaic (resampled to 3 cm pixel size) for Site 1A from 2 June 2021. Inset shows open water surface next to the culvert.
Figure 9.
Example orthomosaic (resampled to 3 cm pixel size) for Site 1A from 2 June 2021. Inset shows open water surface next to the culvert.
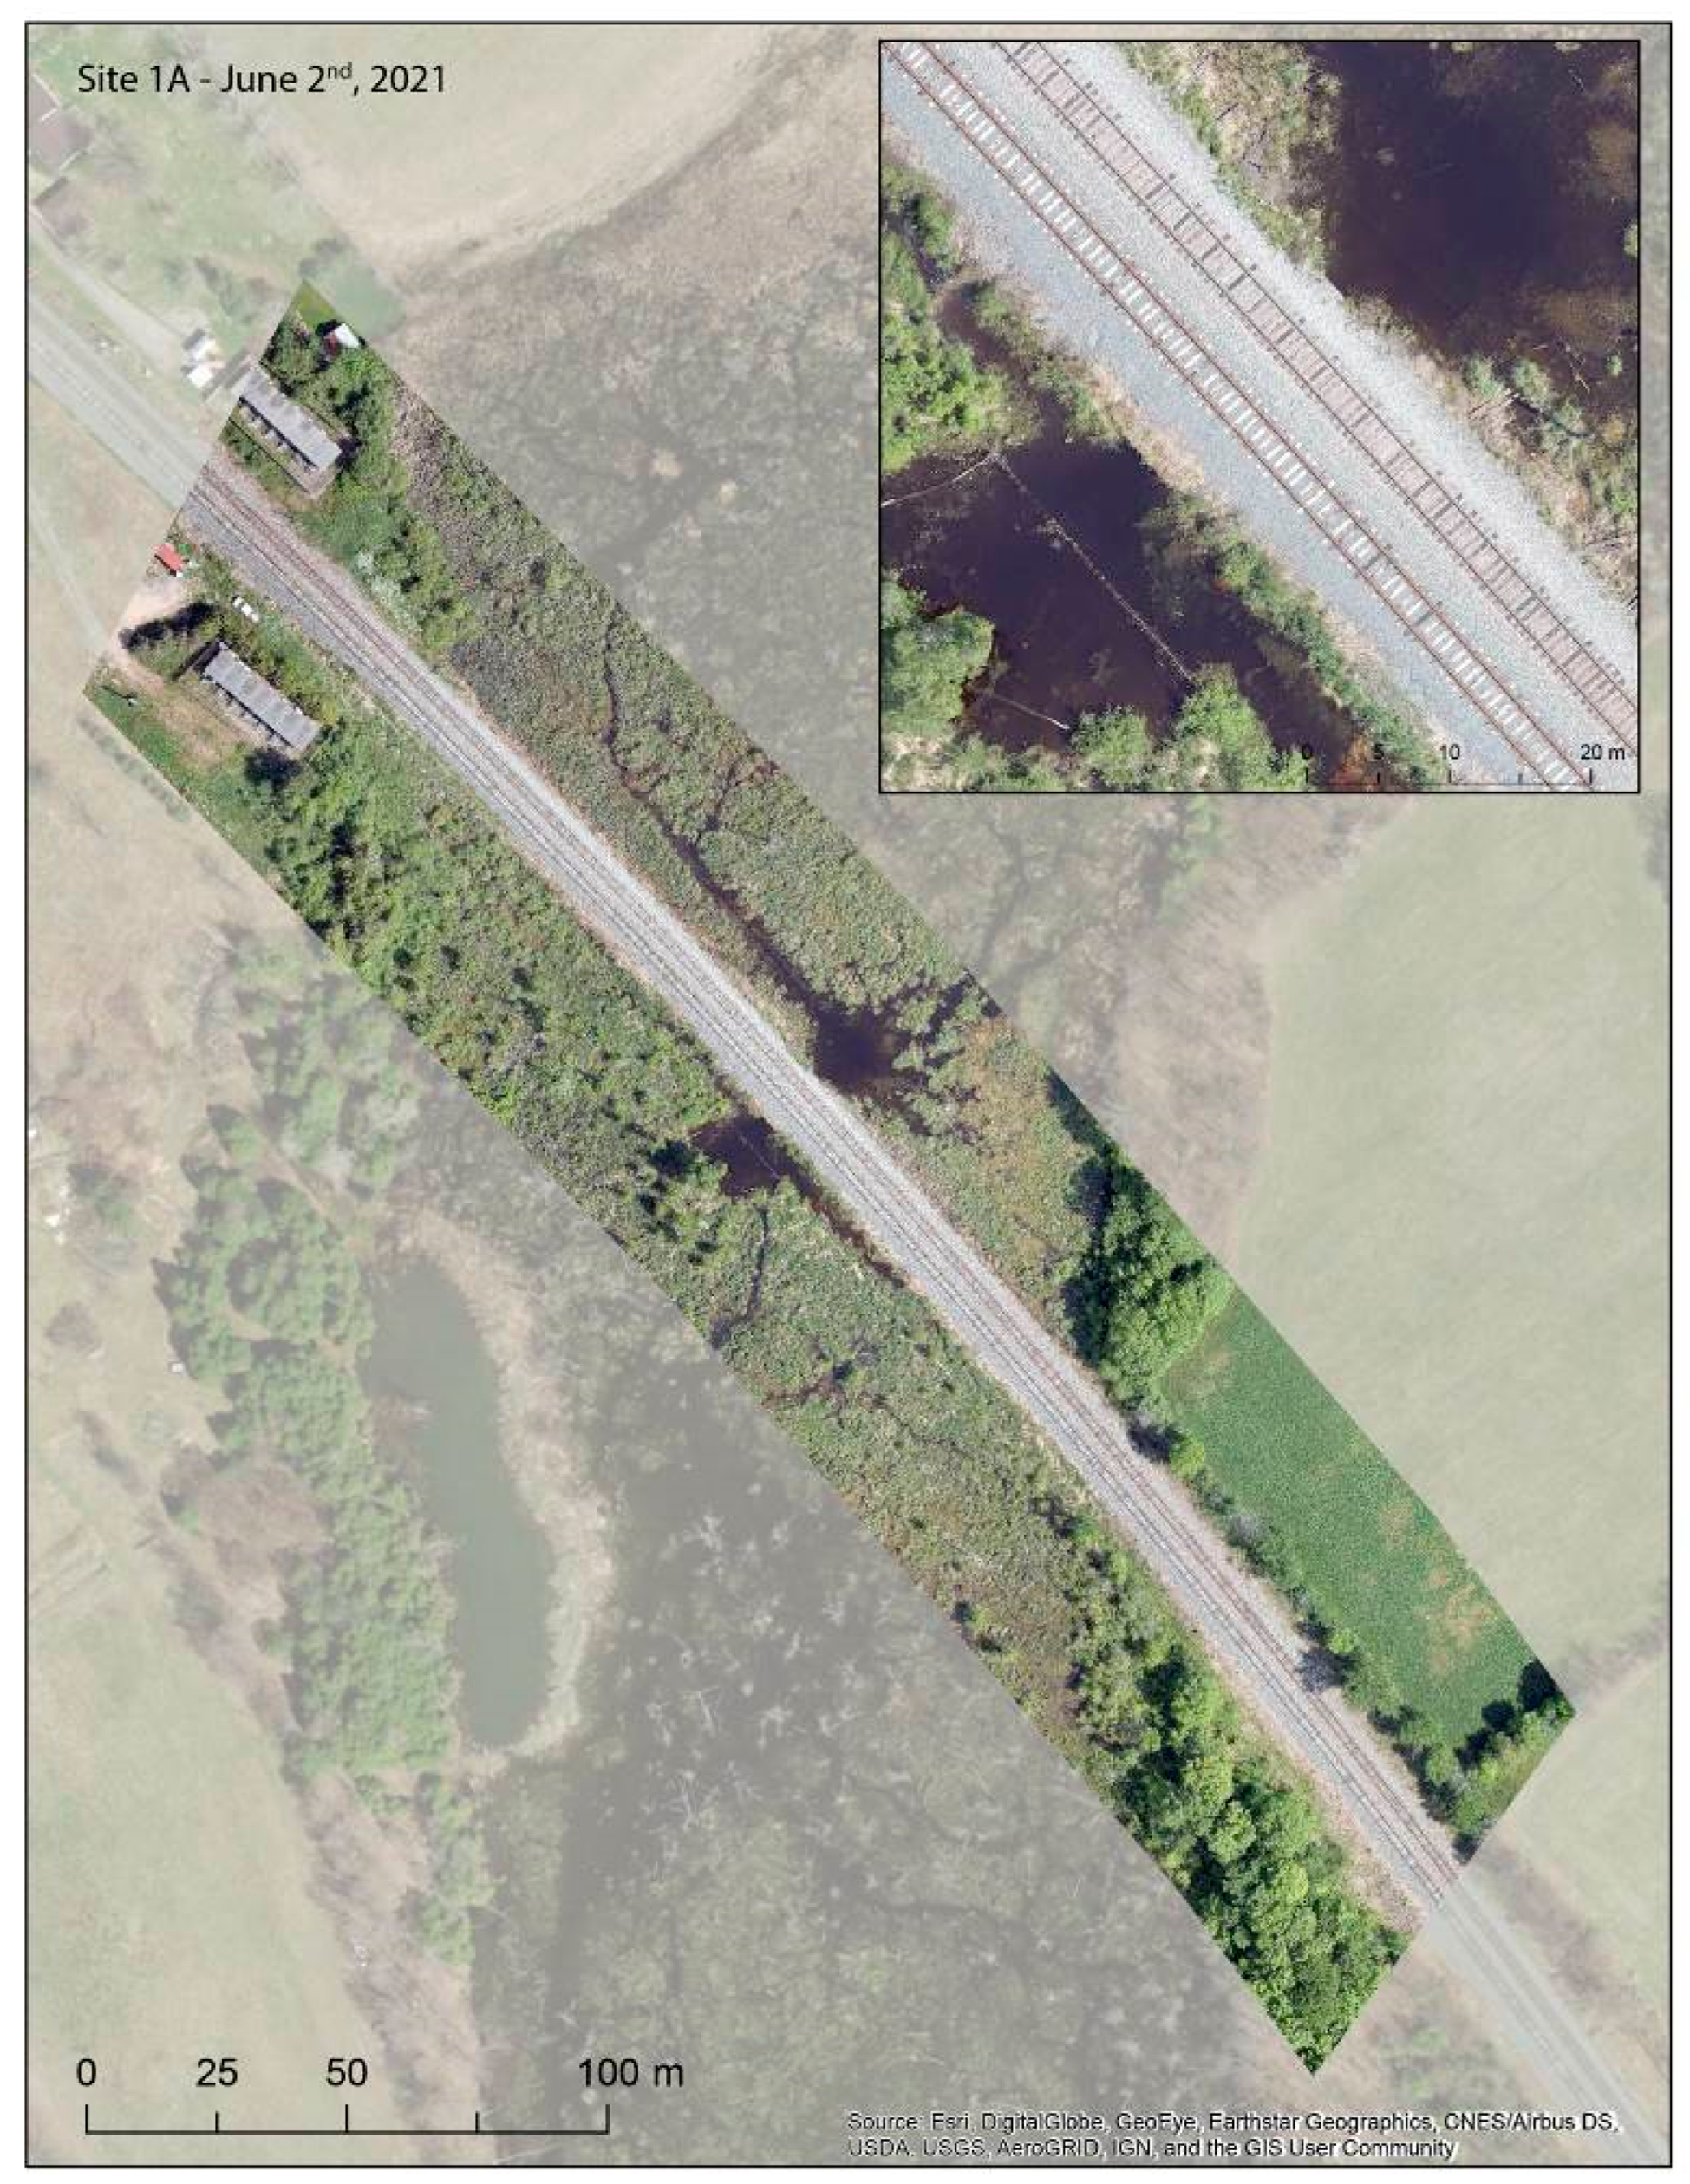
Figure 10.
Examples of the point density of the final 3D point clouds for (A) Site 3A—August and (B) Site 2—August.
Figure 10.
Examples of the point density of the final 3D point clouds for (A) Site 3A—August and (B) Site 2—August.
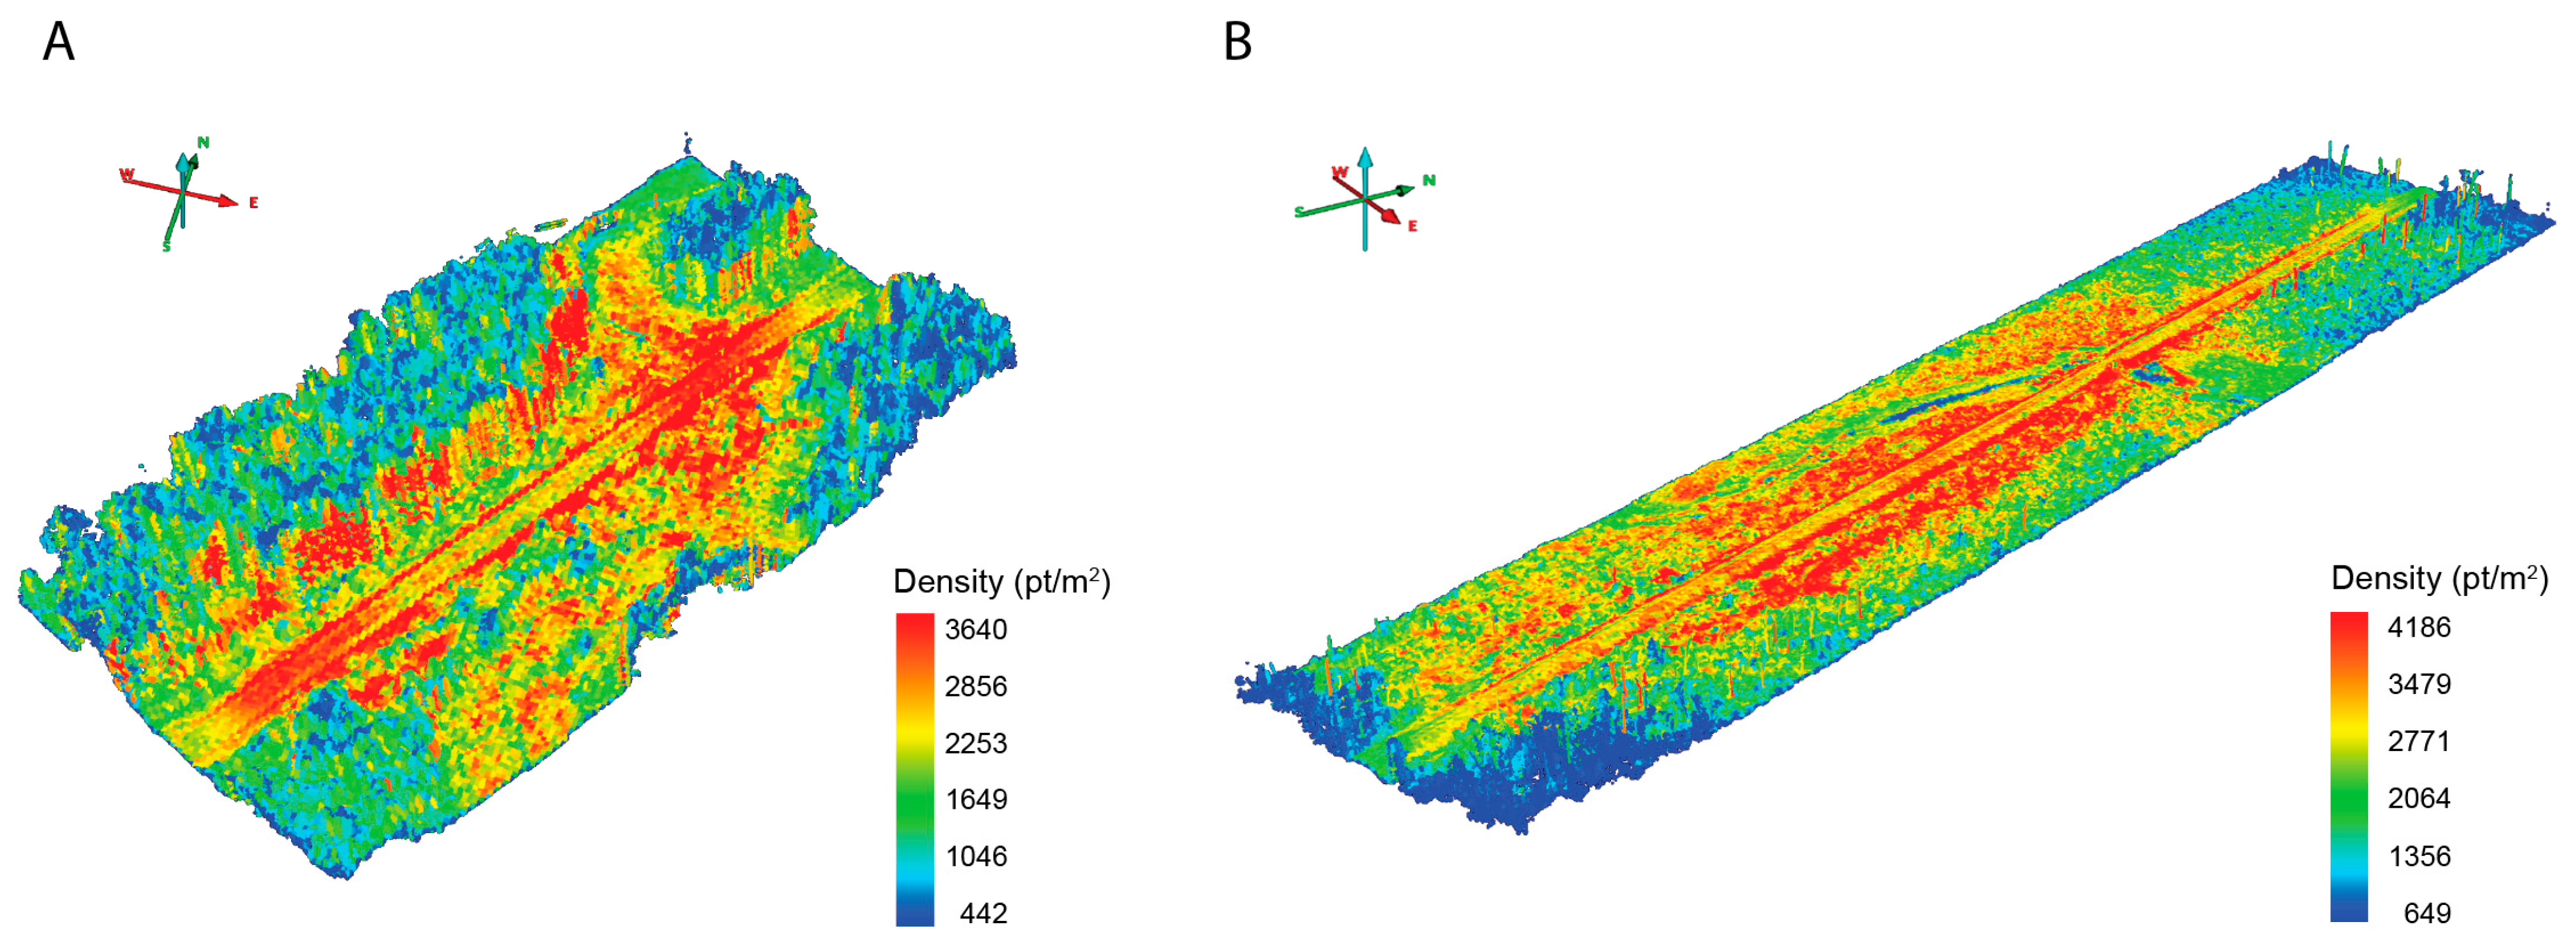
Figure 11.
Comparison of difference in position of points (distributions) representing the railway track and ties, the positions of which are considered to have negligible change throughout the sampling period June–October. The values in cm represent the absolute different between the June–September point clouds in comparison to October for each site. The two July datasets (Sites 1A and 1B) were acquired with the M600P and the X5 camera, all other datasets were acquired with the M300 and the P1 camera. The distributions along the vertical axes of the color bars illustrate the spread of the values.
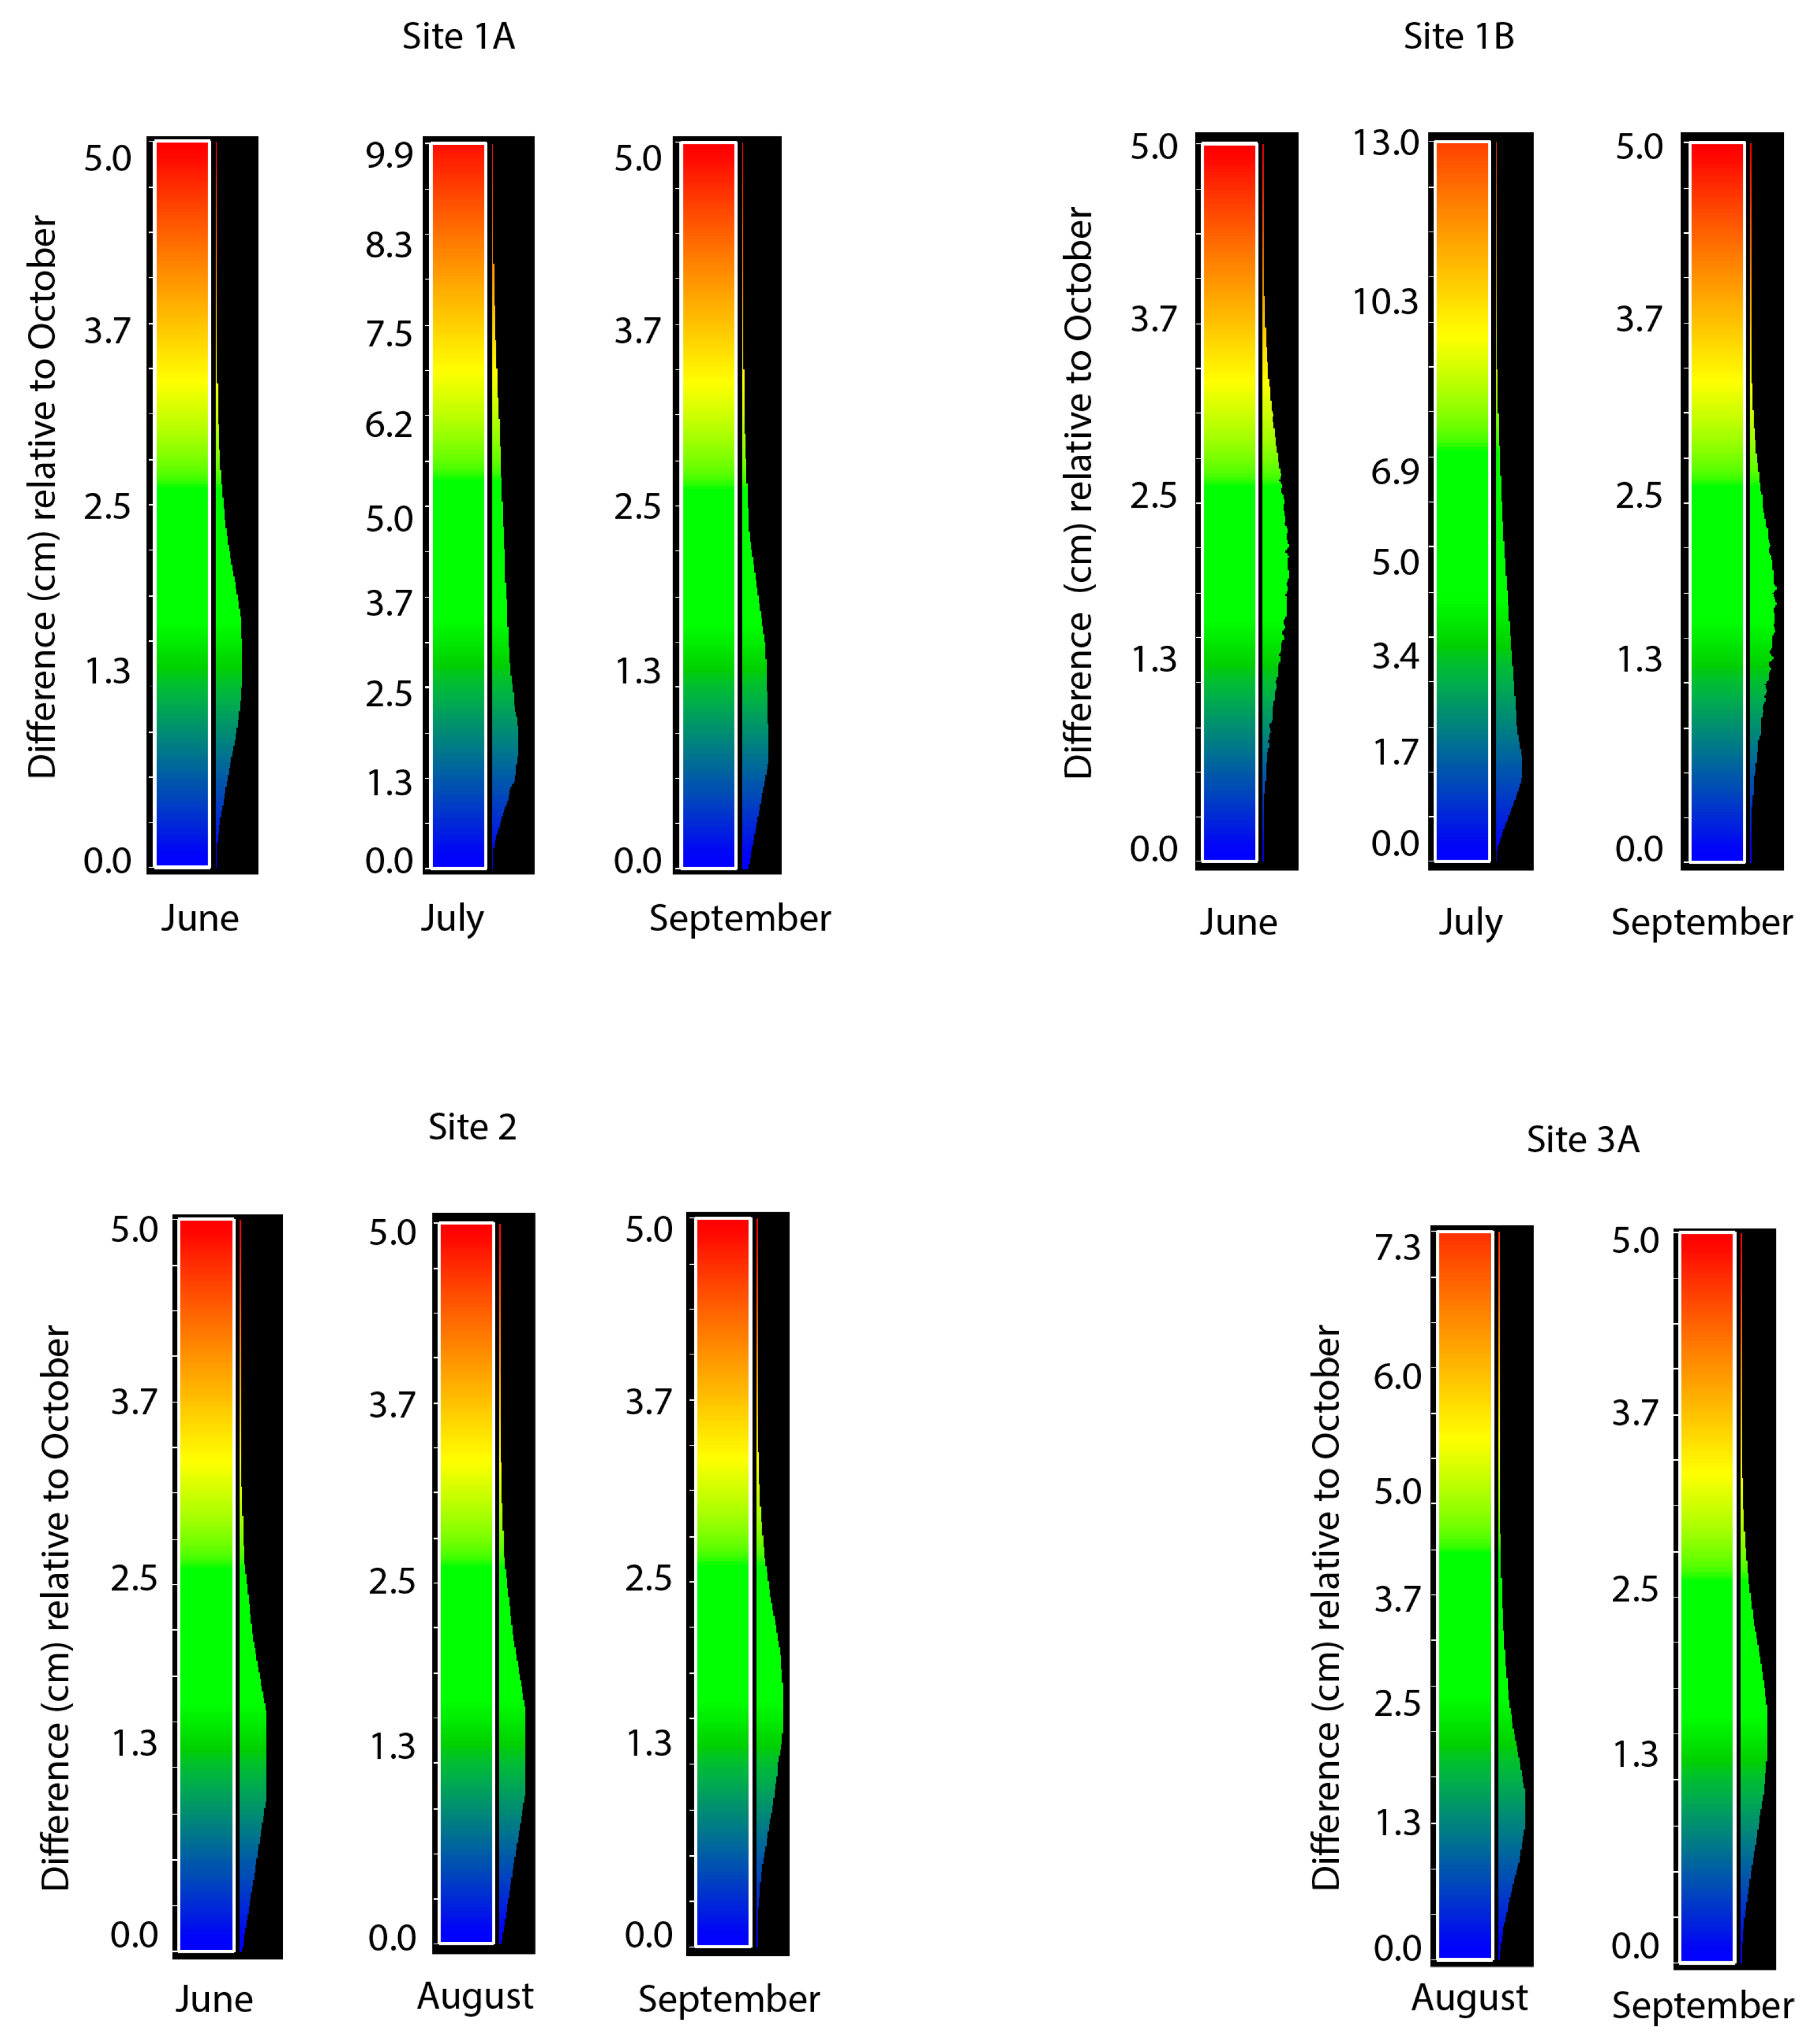
Figure 12.
Surface water (including aquatic vegetation) in percent cover across sites and periods based on a GEOBIA classification of the UAS orthomosaics (3 cm pixel size).
Figure 12.
Surface water (including aquatic vegetation) in percent cover across sites and periods based on a GEOBIA classification of the UAS orthomosaics (3 cm pixel size).

Figure 13.
Vertical distance between the rails crossing a culvert or bridge and the water level for each site across sampling dates. The error bars represent the uncertainty calculated as the variability in the rail and water surface heights.
Figure 13.
Vertical distance between the rails crossing a culvert or bridge and the water level for each site across sampling dates. The error bars represent the uncertainty calculated as the variability in the rail and water surface heights.
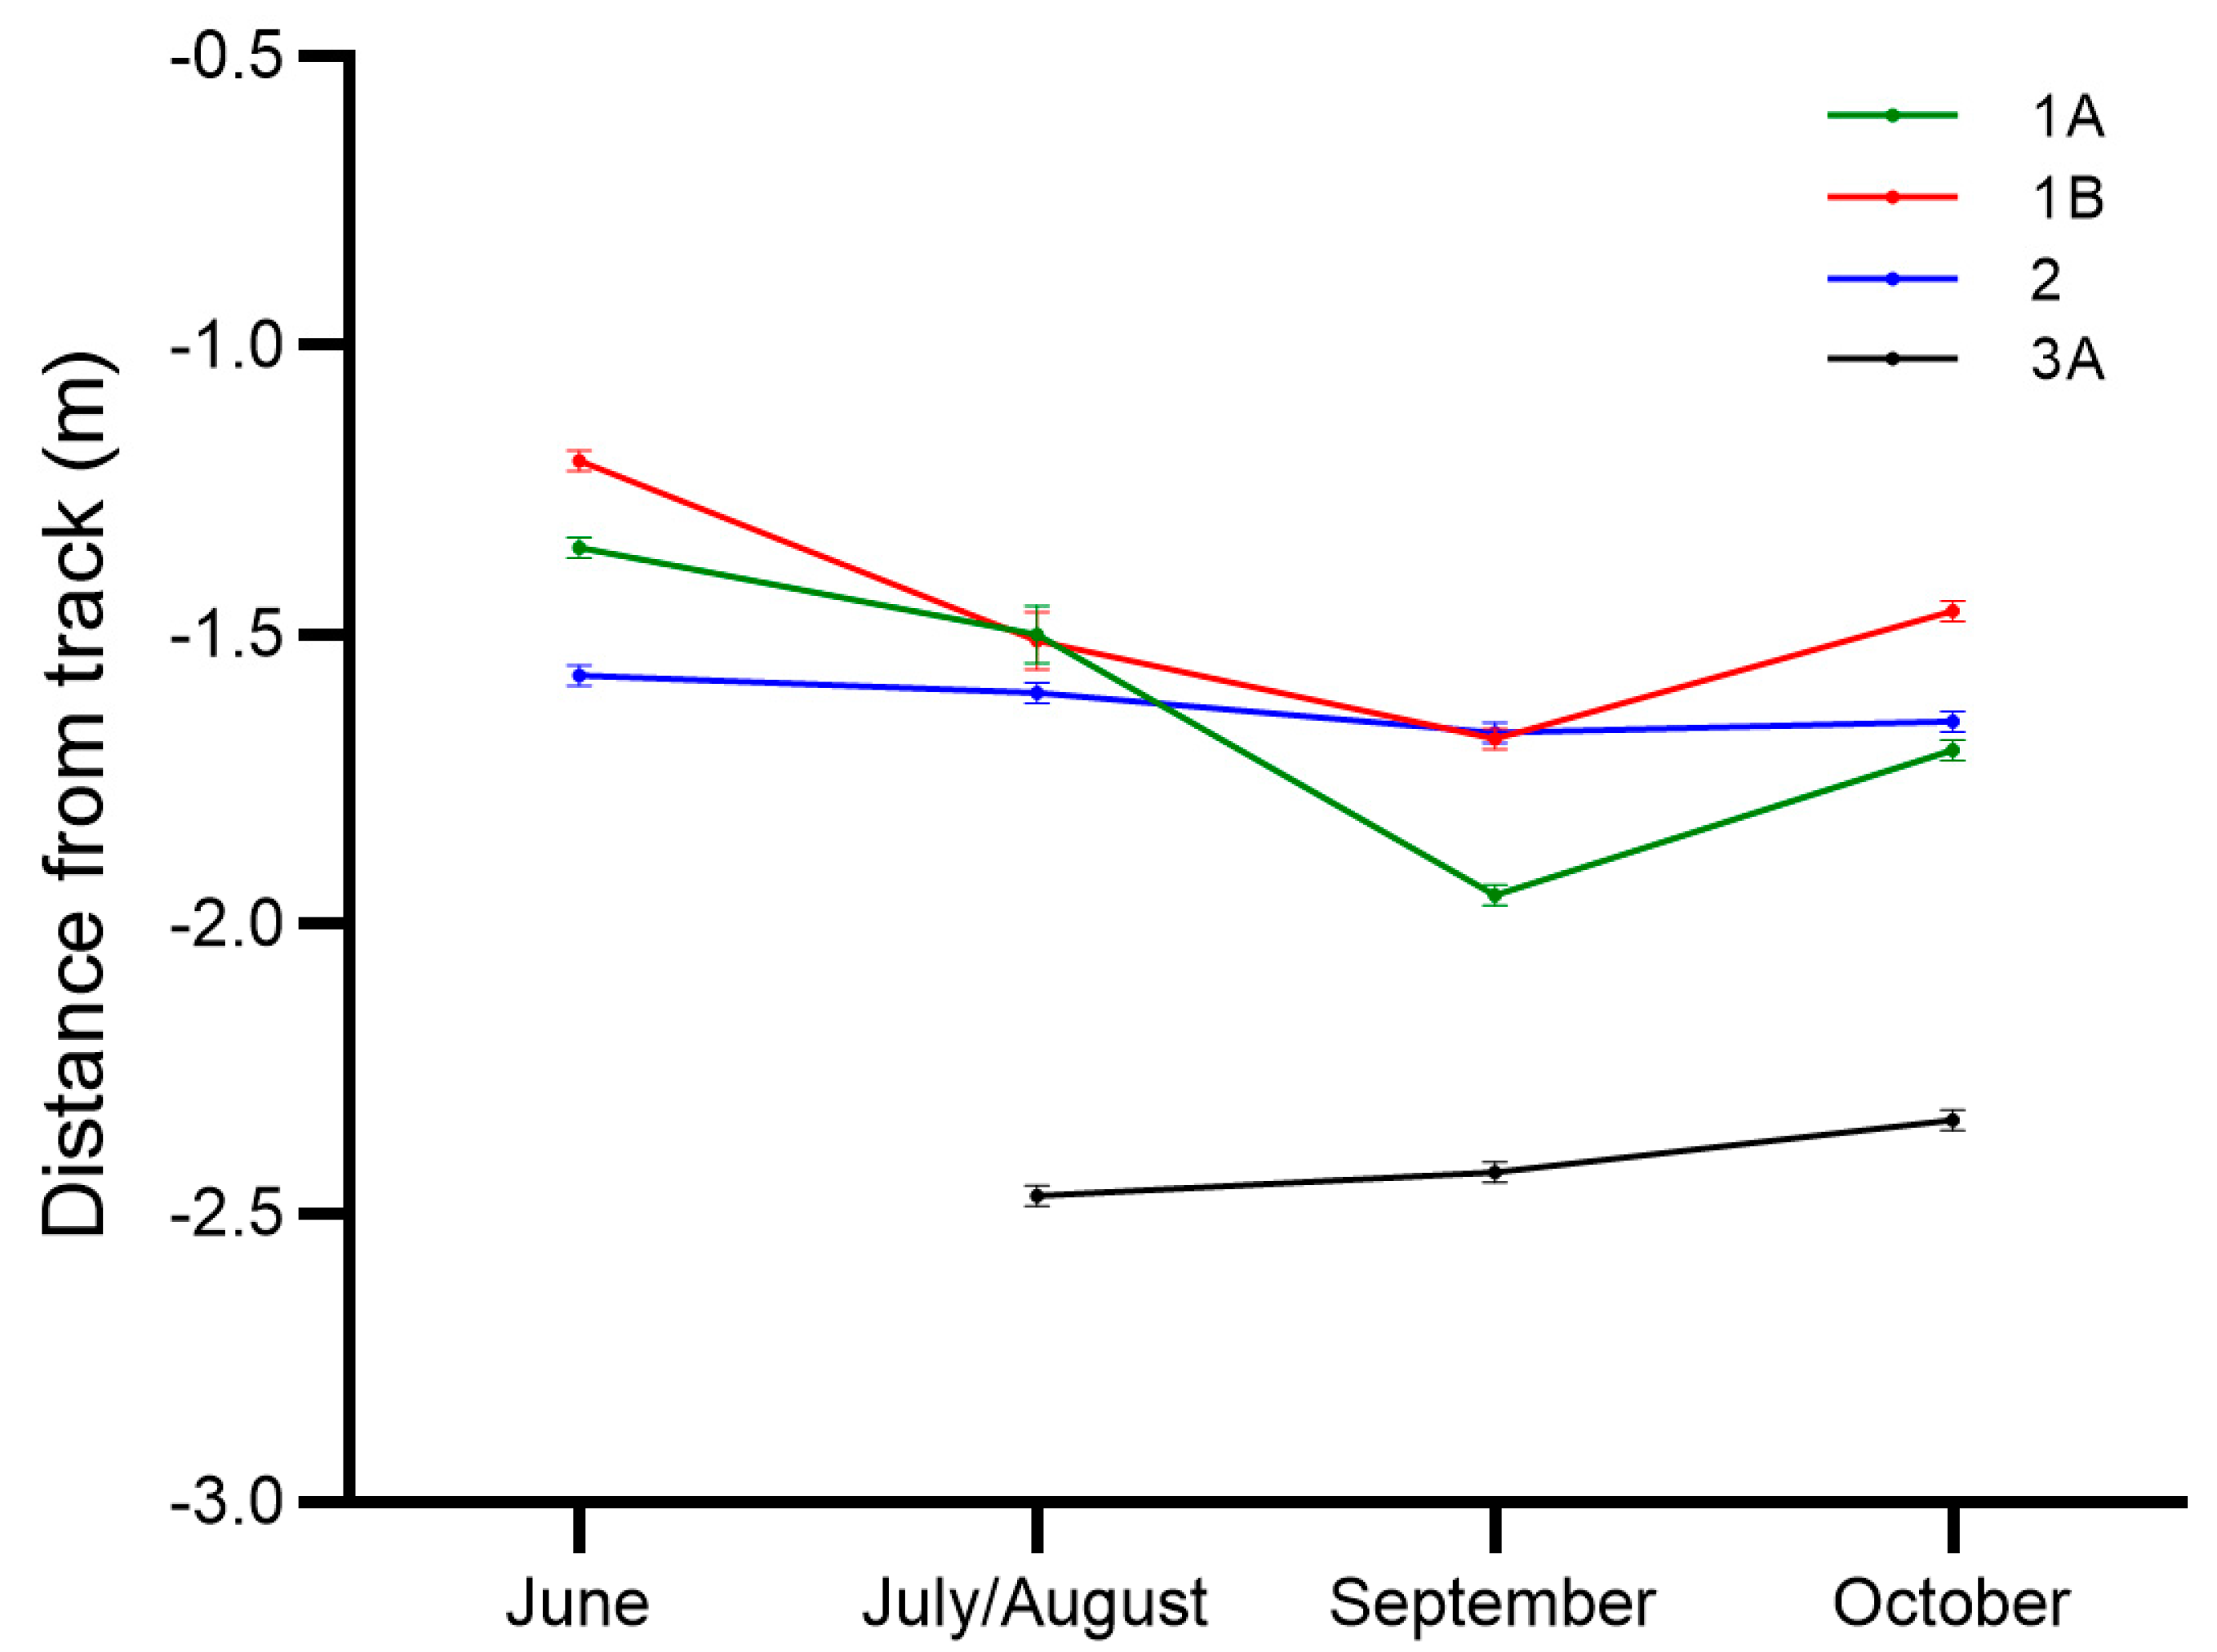
Figure 14.
(A) Changes in exposed surface water area and the delineation of the wetlands from multi-temporal satellite image stack; (B) Comparison of wetland baseline classification (wetland symbology) to the Ontario Ministry of Natural Resources and Forestry wetland database (red outline). The scale is the same for panels A and B.
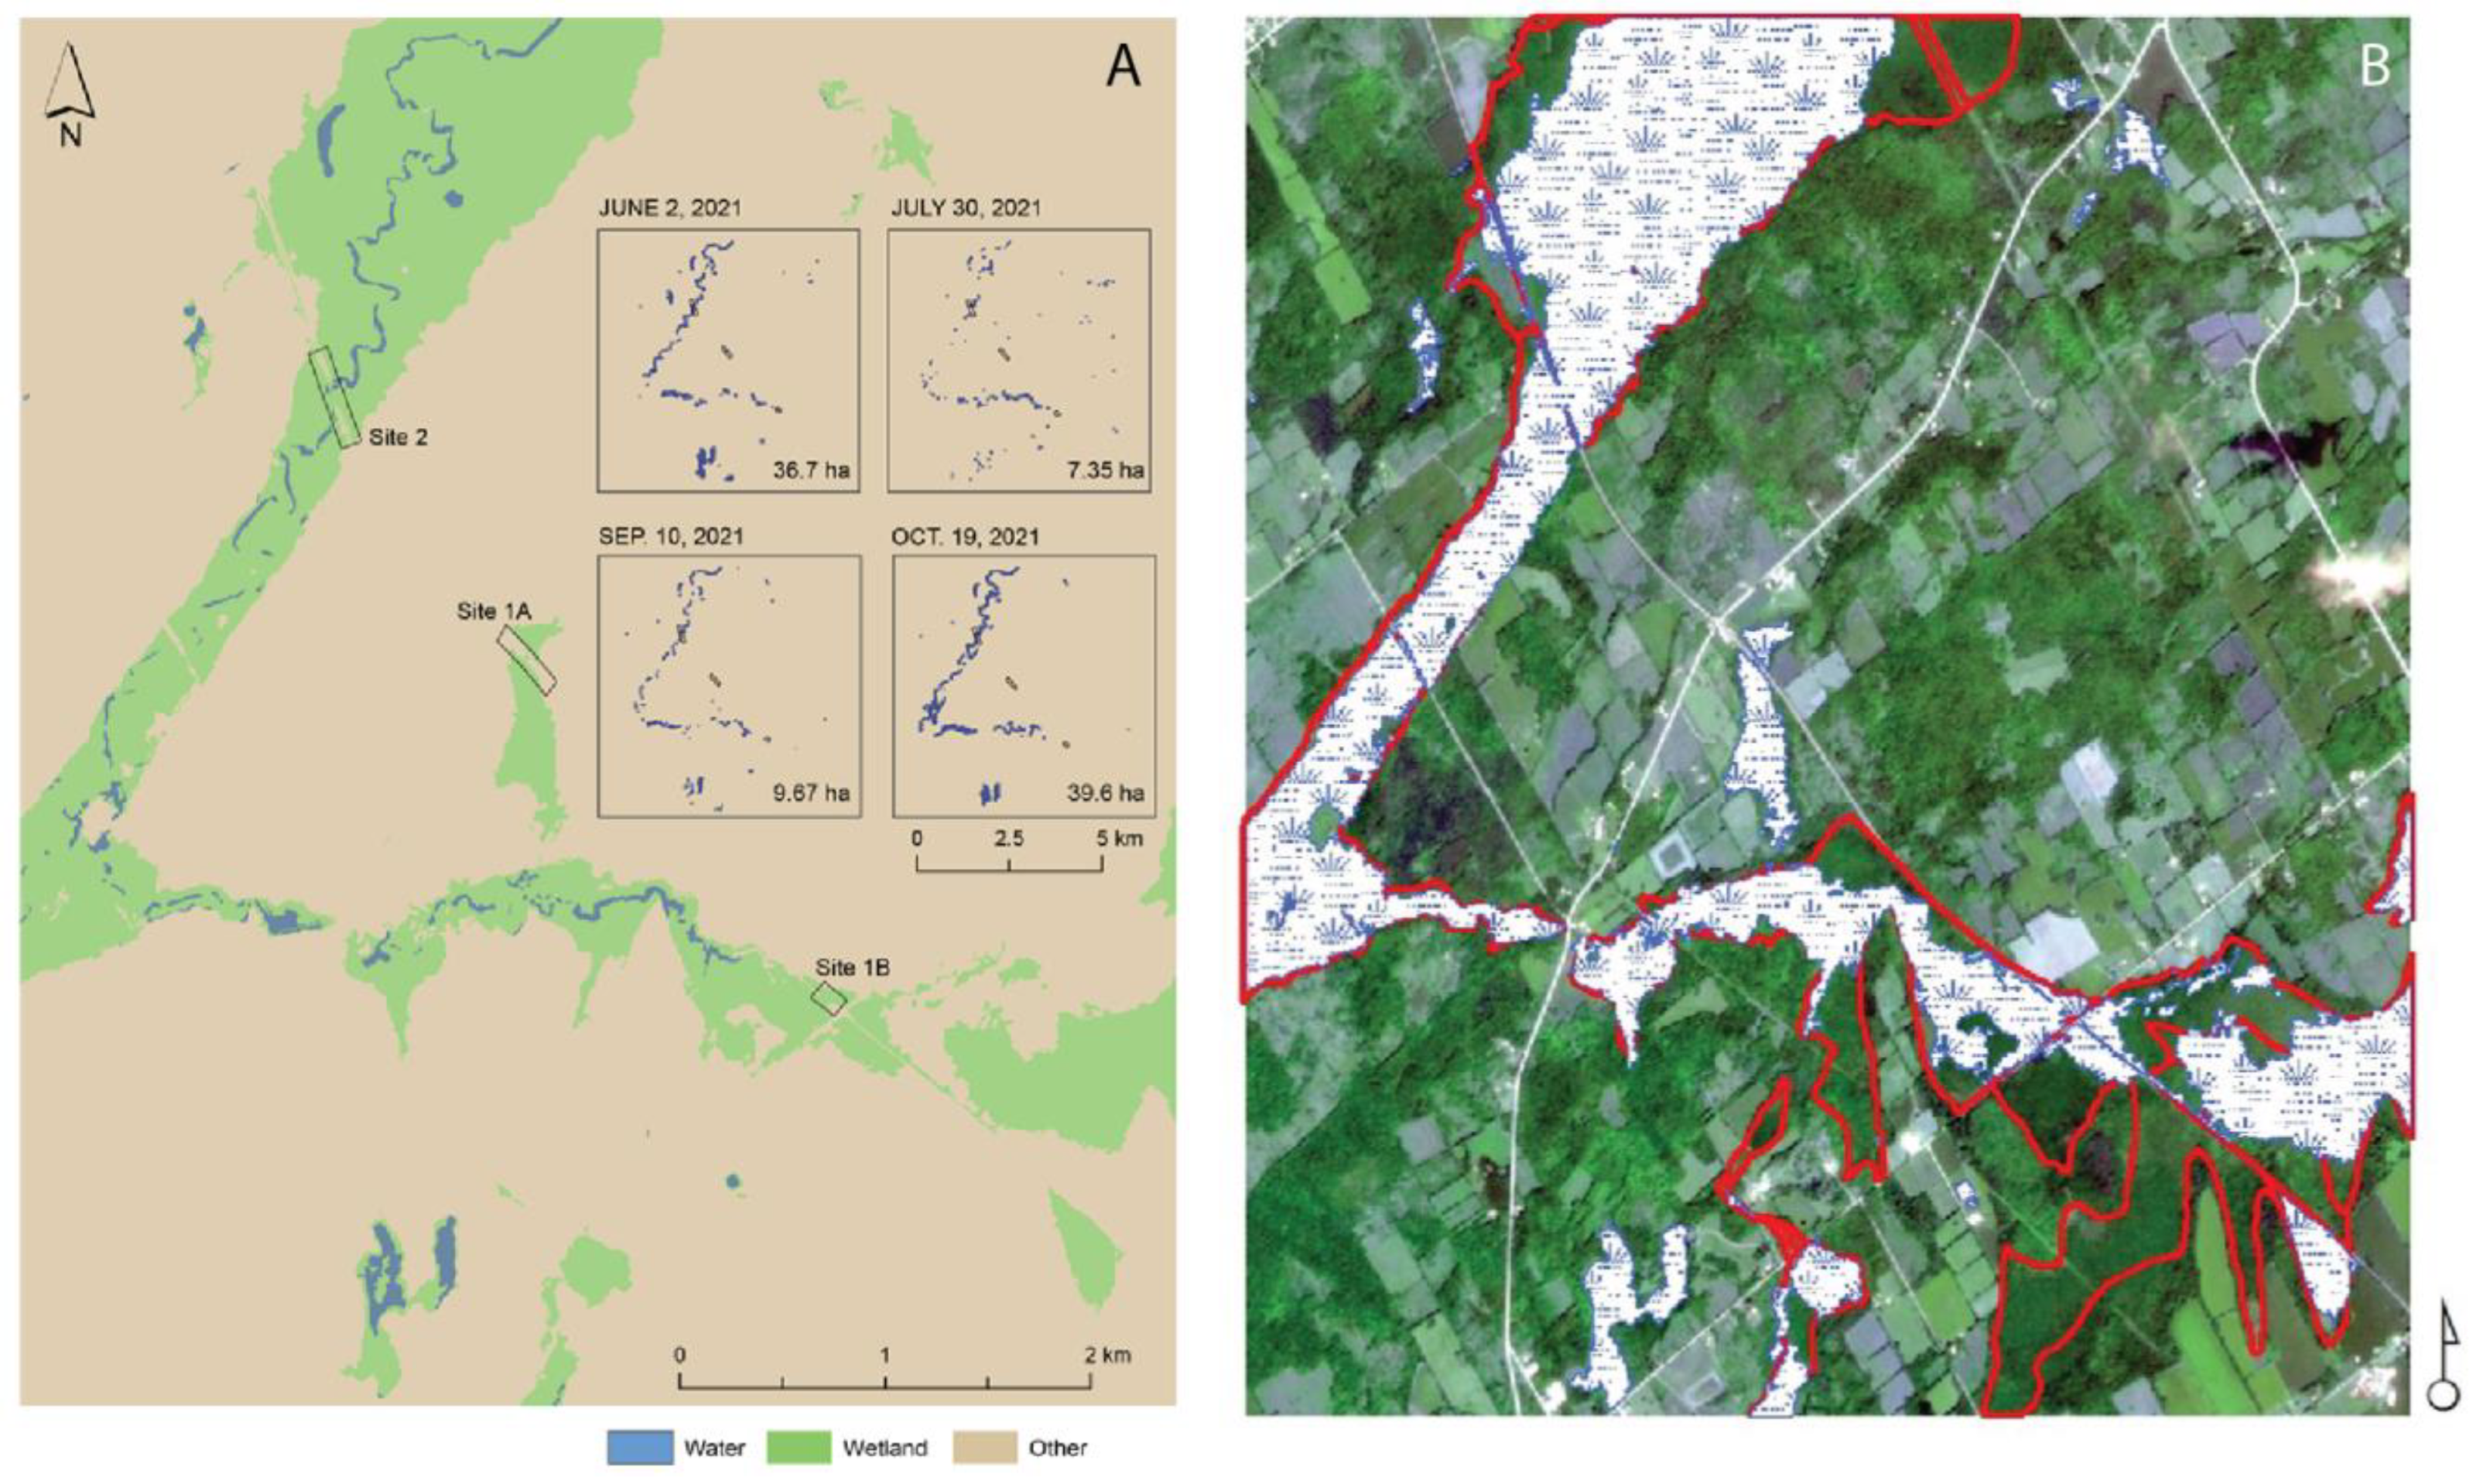
Figure 15.
Comparison of PS imagery from (A) July and (B) October of the railway track crossing the wetland in Site 2. In the July imagery the aquatic vegetation can be seen as bright green, obscuring the water surface below.
Figure 15.
Comparison of PS imagery from (A) July and (B) October of the railway track crossing the wetland in Site 2. In the July imagery the aquatic vegetation can be seen as bright green, obscuring the water surface below.

Table 1.
Acquisition mode, system, and base station used for data collection at railway sites.
| Date | Sampling Period | Sites | Acquisition Mode | System | Base Station | Altitude (m) |
|---|---|---|---|---|---|---|
| June 2 | 1 | 1A, 1B, 2 | Smart oblique | M300 + P1 | RS2 & Smartnet NTRIP | 100 |
| July 30 | 2 | 1A, 1B | Double Grid | M600P + X5 | DRTK1 * | 50 |
| August 6 | 2 | 2, 3A | Smart oblique | M300 + P1 | DRTK2, RS2 & Smartnet NTRIP | 80 |
| September 9 | 3 | 1A, 1B | Smart oblique | M300 + P1 | DRTK2, RS2 & Smartnet NTRIP | 80 |
| September 10 | 3 | 2, 3A | Smart oblique | M300 + P1 | DRTK2, RS2 & Smartnet NTRIP | 80 |
| October 19 | 4 | 1A, 1B, 2, 3A | Smart oblique | M300 + P1 | DRTK2, RS2 & Smartnet NTRIP | 80 |
* The DRTK1 base station for the M600P is only for the flight controller, the RTK improved positional information is not included in the geotagging.
Table 2.
Confusion matrix for the September Site 1B classification. The water class includes aquatic vegetation as described above. The vegetation class does not include the aquatic species. The infrastructure class includes the manmade objects (e.g., rails, railway ties, bridges).
Table 2.
Confusion matrix for the September Site 1B classification. The water class includes aquatic vegetation as described above. The vegetation class does not include the aquatic species. The infrastructure class includes the manmade objects (e.g., rails, railway ties, bridges).
| Infrastructure Reference | Vegetation Reference | Water Reference | User’s Accuracy (%) | |
|---|---|---|---|---|
| Infrastructure classification | 22 | 0 | 0 | 100 |
| Vegetation classification | 0 | 84 | 0 | 100 |
| Water classification | 0 | 5 | 33 | 86.8 |
| Producer’s accuracy (%) | 100 | 94.3 | 100 | OA (%) = 96.5 |
Table 3.
Confusion matrix for the wetland baseline from the multi-temporal PlanetScope Dove image classification.
Table 3.
Confusion matrix for the wetland baseline from the multi-temporal PlanetScope Dove image classification.
| Wetland Reference | Other Reference | User’s Accuracy (%) | |
|---|---|---|---|
| Wetland classification | 52 | 1 | 98.1 |
| Other classification | 23 | 81 | 77.8 |
| Producer’s accuracy (%) | 69.3 | 98.7 | OA (%) = 84.7 |
Table 4.
UAS data acquisition and SfM-MVS product characteristics.
| No. Photos | Area Orthomosaic (ha) | Total No. Points 3D Cloud (MM) | Avg. Point Density (pts/m2) | Point Cloud File Size (GB) | |
|---|---|---|---|---|---|
| Site 1A | |||||
| 2 June 2021 | 659 | 3.11 | 53.8 | 1664 | 1.37 |
| 30 July 2021 | 605 | 3.11 | 35.9 | 1140 | 1.19 |
| 9 September 2021 | 1017 | 3.11 | 120.0 | 3709 | 3.98 |
| 19 October 2021 | 1019 | 3.11 | 115.6 | 3574 | 4.74 |
| Site 1B | |||||
| 2 June 2021 | 360 | 1.44 | 26.9 | 1786 | 0.89 |
| 30 July 2021 | 405 | 1.44 | 16.7 | 1106 | 0.55 |
| 9 September 2021 | 485 | 1.44 | 37.7 | 2501 | 1.25 |
| 19 October 2021 | 483 | 1.44 | 37.6 | 2495 | 1.25 |
| Site 2 | |||||
| 2 June 2021 | 908 | 4.88 | 95.5 | 1900 | 3.92 |
| 6 August 2021 | 1262 | 4.88 | 119.7 | 2381 | 4.91 |
| 10 September 2021 | 1576 | 4.88 | 136.9 | 2722 | 5.61 |
| 19 October 2021 | 1499 | 4.88 | 135.1 | 2687 | 4.75 |
| Site 3A | |||||
| 6 August 2021 | 529 | 1.79 | 33.2 | 1781 | 1.10 |
| 10 September 2021 | 590 | 1.79 | 45.1 | 2418 | 1.50 |
| 19 October 2021 | 589 | 1.79 | 50.8 | 2724 | 2.08 |
| Total | 11,986 | 43.09 | 39.09 |
Table 5.
Total area (ha) of surface water extent mapped from the UAS orthomosaics.
| Site 1A | Site 1B | Site 2 | Site 3A | |
|---|---|---|---|---|
| June | 0.15 | 0.25 | 0.79 | - |
| July/August | 0.09 | 0.17 | 0.58 | 0.08 |
| September | 0.02 | 0.20 | 0.56 | 0.09 |
| October | 0.07 | 0.17 | 0.75 | 0.11 |
Disclaimer/Publisher’s Note: The statements, opinions and data contained in all publications are solely those of the individual author(s) and contributor(s) and not of MDPI and/or the editor(s). MDPI and/or the editor(s) disclaim responsibility for any injury to people or property resulting from any ideas, methods, instructions or products referred to in the content. |
© 2023 by the authors. Licensee MDPI, Basel, Switzerland. This article is an open access article distributed under the terms and conditions of the Creative Commons Attribution (CC BY) license (https://creativecommons.org/licenses/by/4.0/).
Share and Cite
MDPI and ACS Style
Arroyo-Mora, J.P.; Kalacska, M.; Roghani, A.; Lucanus, O. Assessment of UAS Photogrammetry and Planet Imagery for Monitoring Water Levels around Railway Tracks. Drones 2023, 7, 553. https://doi.org/10.3390/drones7090553
AMA Style
Arroyo-Mora JP, Kalacska M, Roghani A, Lucanus O. Assessment of UAS Photogrammetry and Planet Imagery for Monitoring Water Levels around Railway Tracks. Drones. 2023; 7(9):553. https://doi.org/10.3390/drones7090553
Chicago/Turabian StyleArroyo-Mora, Juan Pablo, Margaret Kalacska, Alireza Roghani, and Oliver Lucanus. 2023. "Assessment of UAS Photogrammetry and Planet Imagery for Monitoring Water Levels around Railway Tracks" Drones 7, no. 9: 553. https://doi.org/10.3390/drones7090553