3.1. Analysis of the Generation Results of the DEMs and DSMs
The correlations between the DEMs generated from image points and LiDAR points and field-measured elevations were analyzed, as shown in
Figure 2.
The results shown in
Figure 2 indicate that the DEMs generated from both image points and LiDAR points are highly correlated with field-measured elevations, with an R
2 of 0.95 and 0.97, and a RMSE of 0.28 and 0.24 m, respectively. The difference in correlation results was evaluated through a
t-test in Python, and the
p-value was 0.76, which indicated that there was no significant difference between the DEMs generated based on the image points and the LiDAR points. The spatial distributions of the DEMs generated based on the image points and LiDAR points, as well as the differences, are shown in
Figure 3.
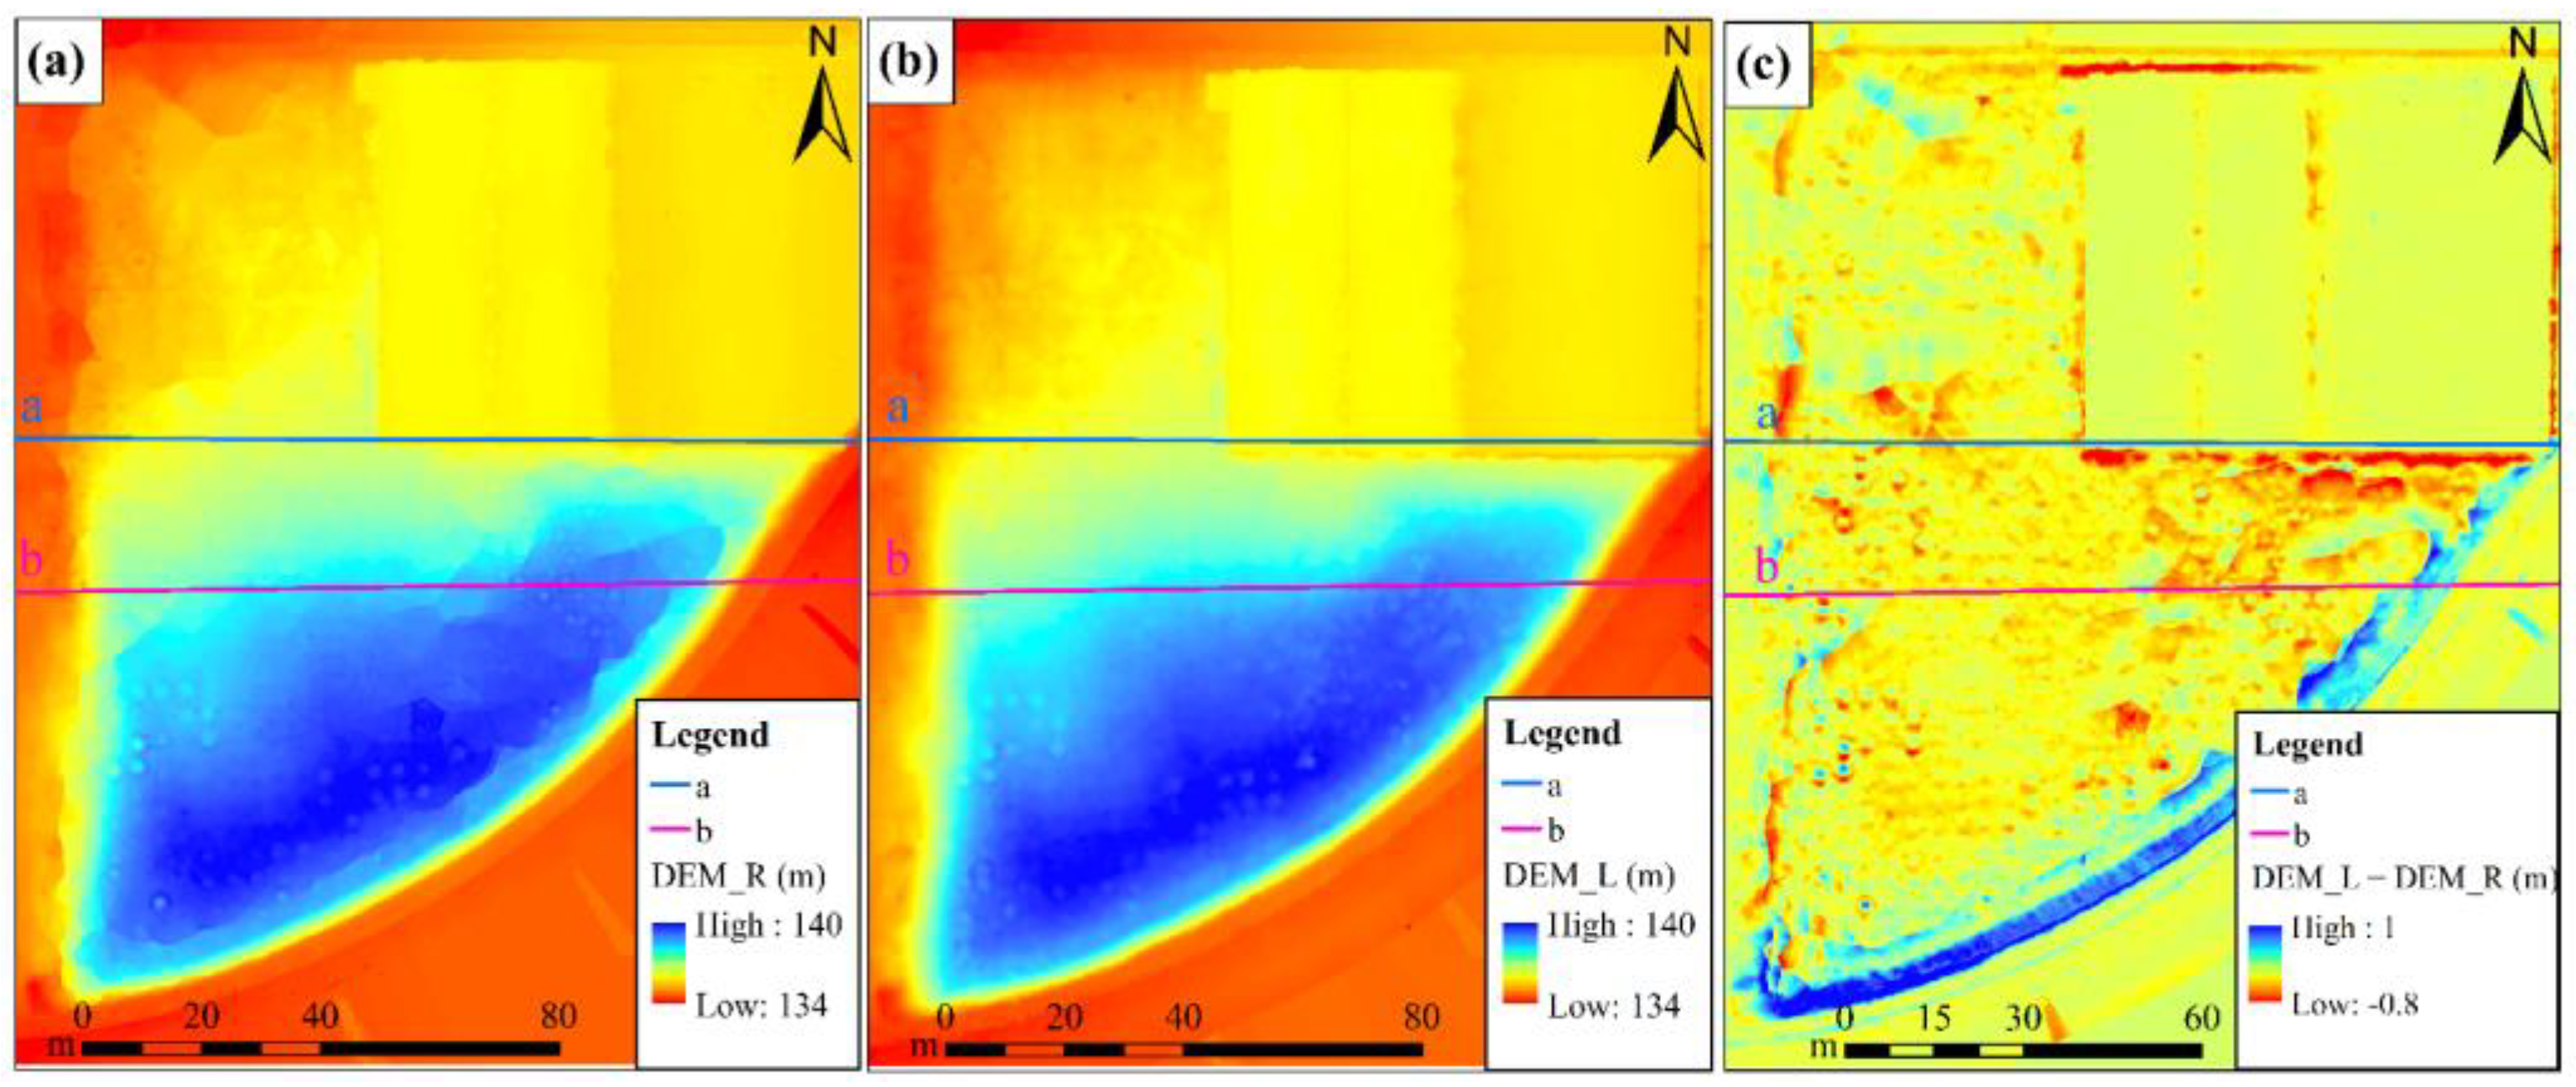
The results in
Figure 3a,b show that both DEMs’ values are within the range of 134–140 m, but the DEM generated from LiDAR points exhibits smoother readings in areas with a high canopy closure. Additionally, the difference between two DEMs in areas with a high canopy closure is also relatively large, as shown in
Figure 3c.
To further demonstrate the differences between the two DEMs, two cross sections, a and b, with relatively high and low canopy closure, respectively, were selected on the spatial distributions of the DEMs (as shown in
Figure 3) and are presented in
Figure 4.
According to
Figure 4, it is evident that the elevation values of the DEMs generated based on image points are generally higher than those obtained from LiDAR points. In areas without forest, the elevation values of the two DEMs are almost identical. However, as the forest canopy closure increases, the differences between the values of the two DEMs tend to increase.
- 2.
Results of the DSMs
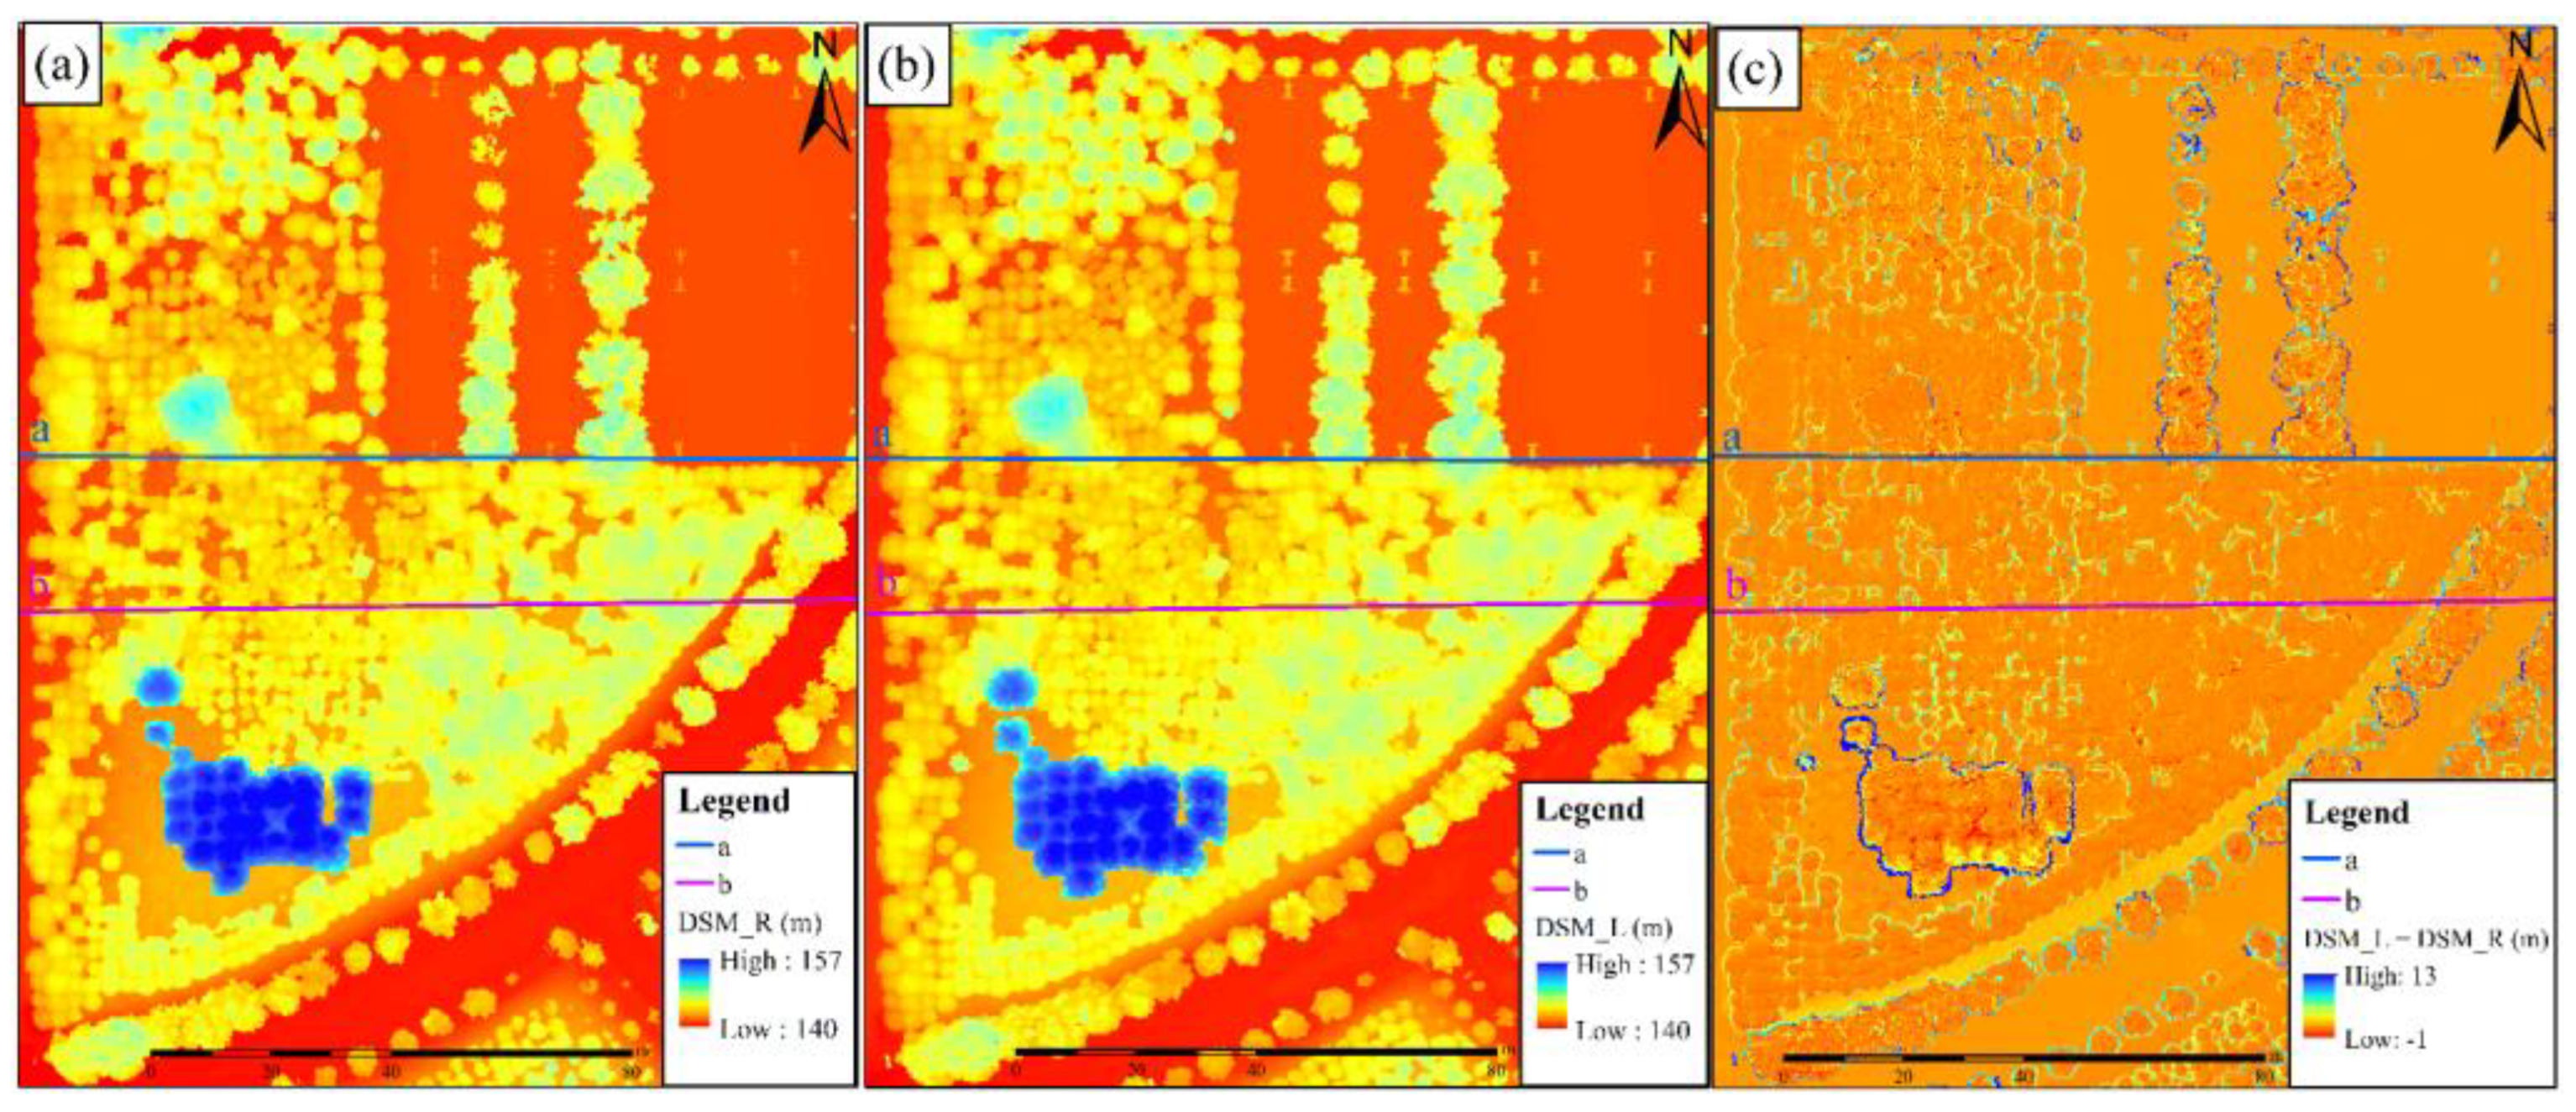
Compared to ground points, both image points and LiDAR points include more forest canopy points, so the generated DSM has higher accuracy in theory. However, further verification is needed to explore the differences between the DSMs generated from LiDAR points and image points. The elevation distributions of the DSMs generated based on image points and LiDAR points, as well as the differences, are shown in
Figure 5.
The results in
Figure 5a,b show that both DSMs’ values are within the range of 140–157 m, indicating that the maximum tree height is within 15 m. As shown in
Figure 5c, the differences between the DSMs mainly occur at the boundary of the tree canopy.
To further explore the differences between the DSMs, two cross sections, a and b, with relatively high and low canopy closure, respectively, were selected on the spatial distributions of the DSMs (as shown in
Figure 5) and are presented in
Figure 6 and
Figure 7.
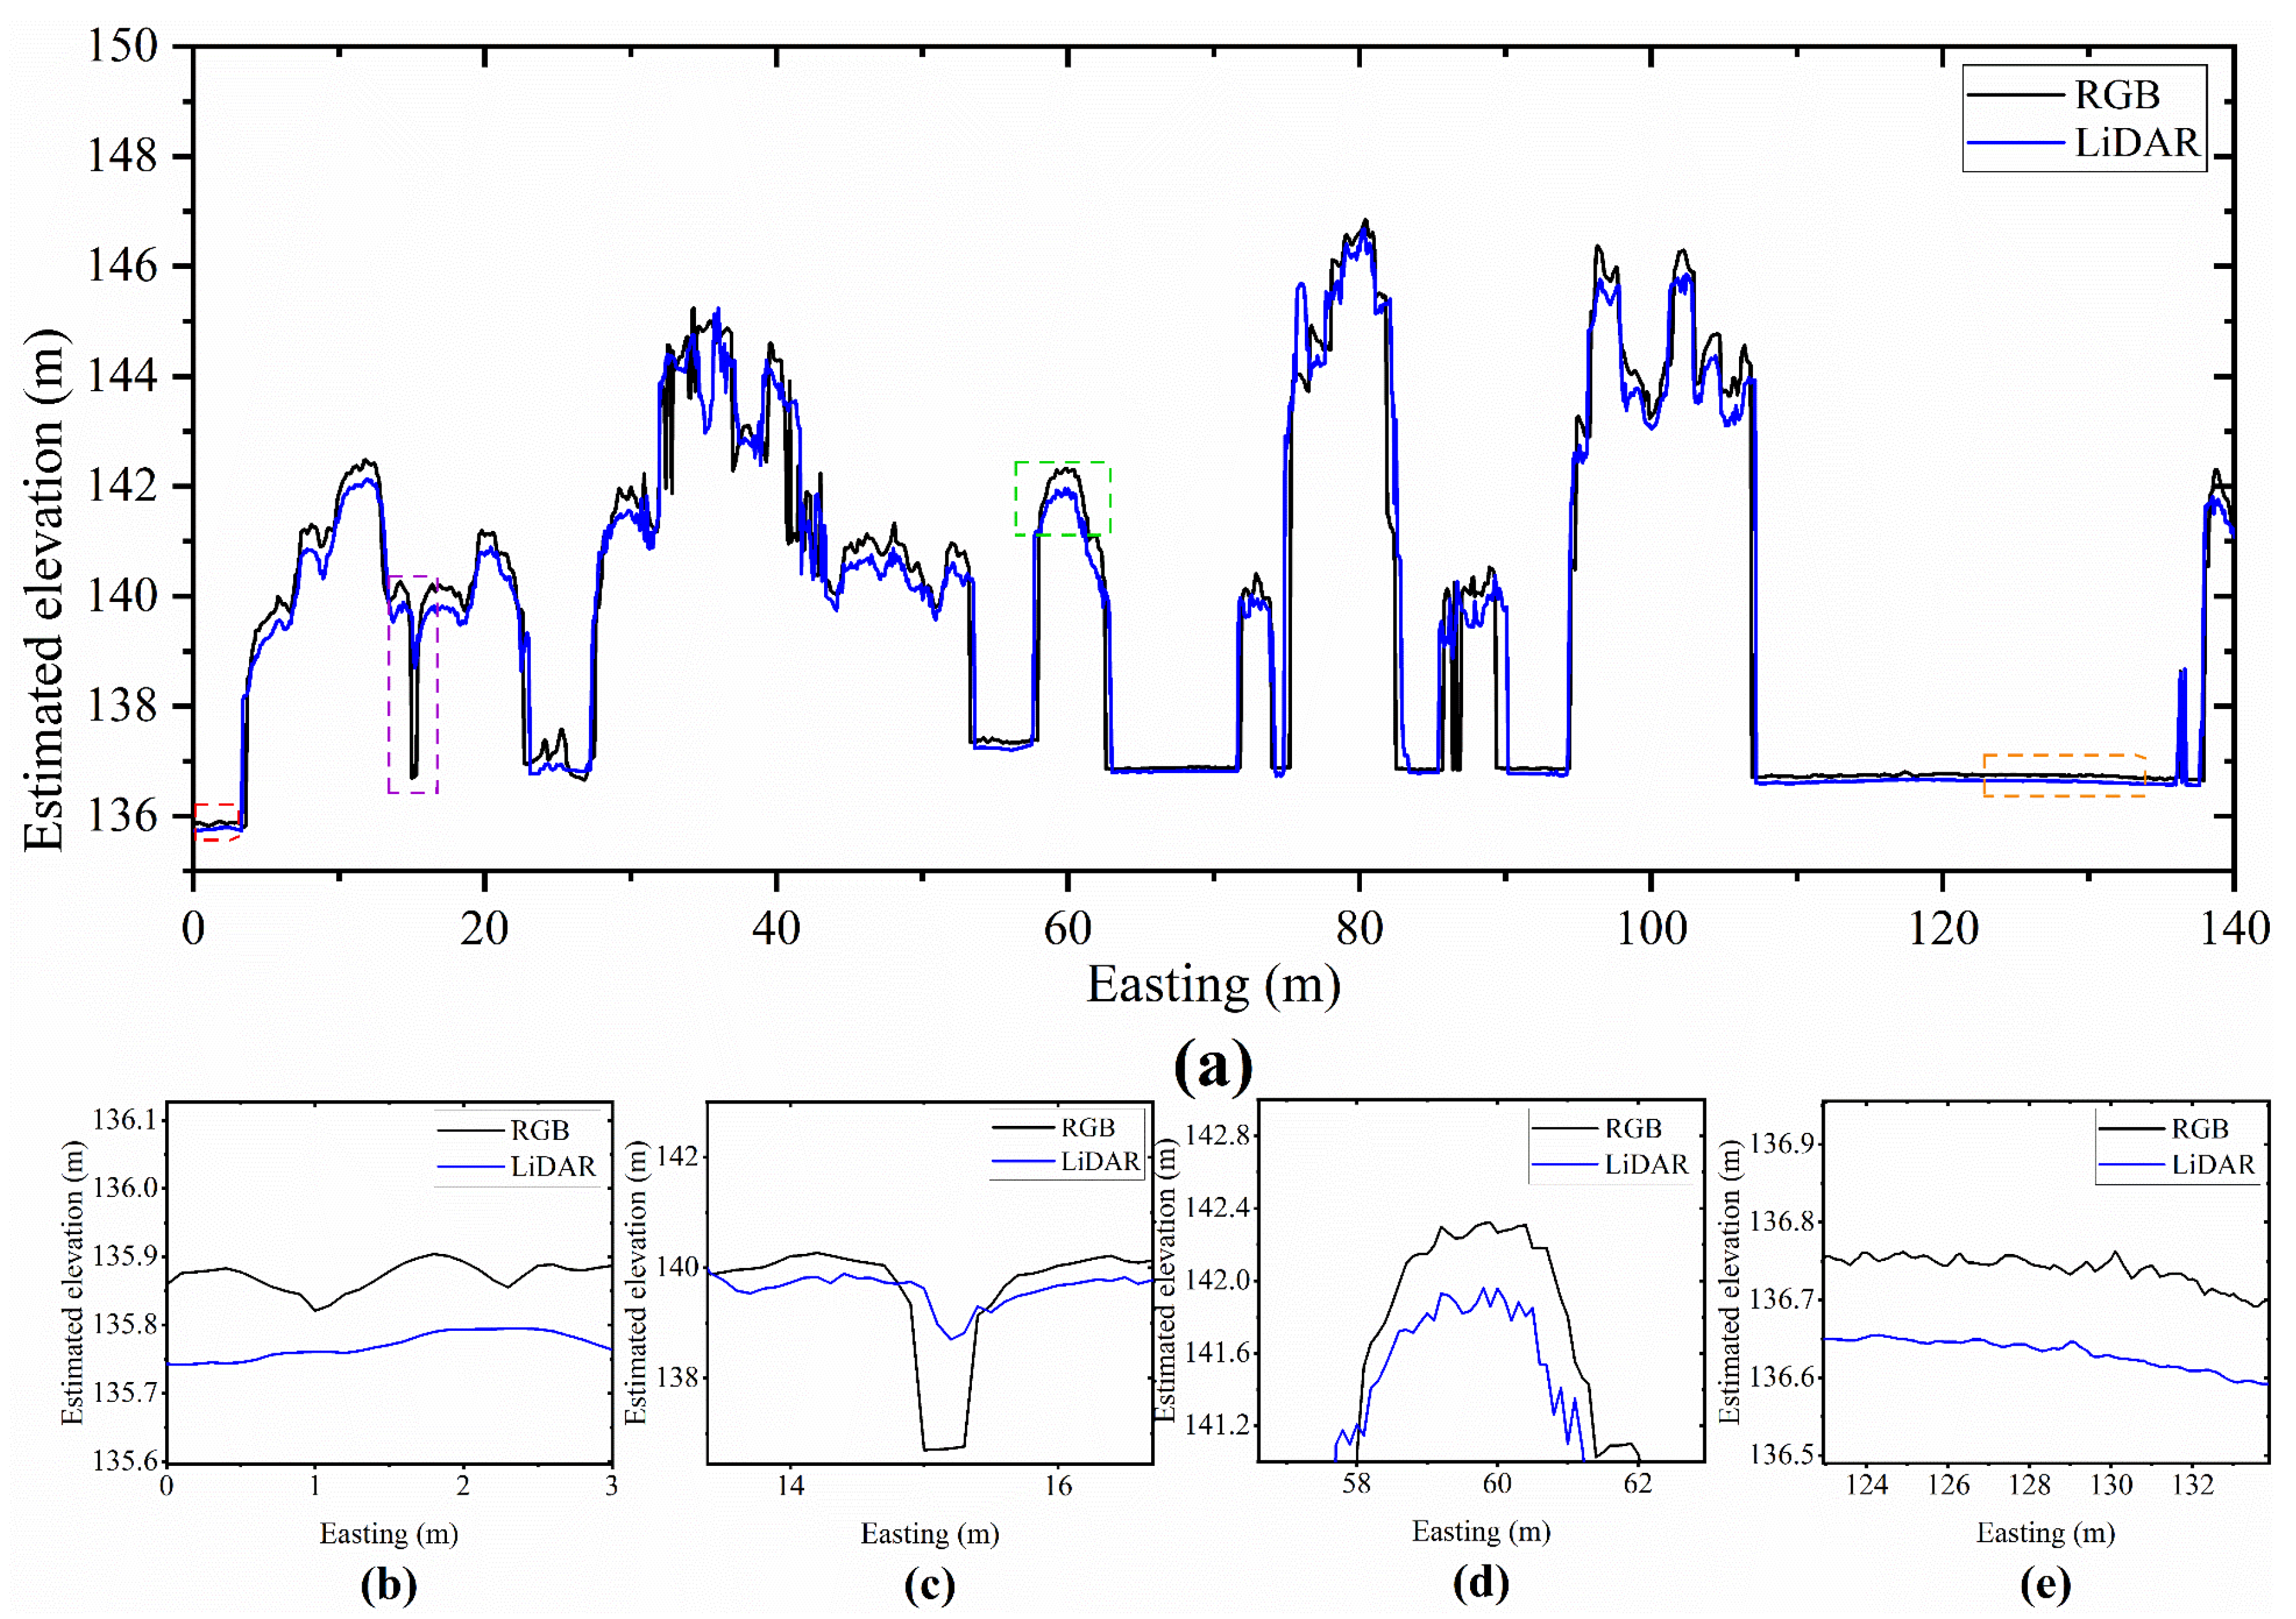
Figure 6a and
Figure 7a indicate that the elevation values of the DSM generated based on image points are higher than those obtained from LiDAR points. Specifically, in the case of grassland areas, the elevation values of the DSM generated from image points are higher than those obtained from LiDAR points, as shown in
Figure 6b and
Figure 7b. In the canopy boundary area, the DSM generated based on LiDAR points has higher elevation values than those obtained from image points, as shown in
Figure 6c and
Figure 7c. However, for the canopy top, the elevation values of the DSM generated from image points are higher than those obtained from LiDAR points, as shown in
Figure 6d and
Figure 7d. In the case of flatland areas, the elevation values of the DSM generated from image points are higher than those obtained from LiDAR points, but the differences are relatively small, only about 0.1 m, as shown in
Figure 6e and
Figure 7e.
3.2. Analysis of Individual Tree Segmentation Results and Extraction Results for the Structural Parameters of Individual Trees
- 1.
Segmentation Results for Individual Trees
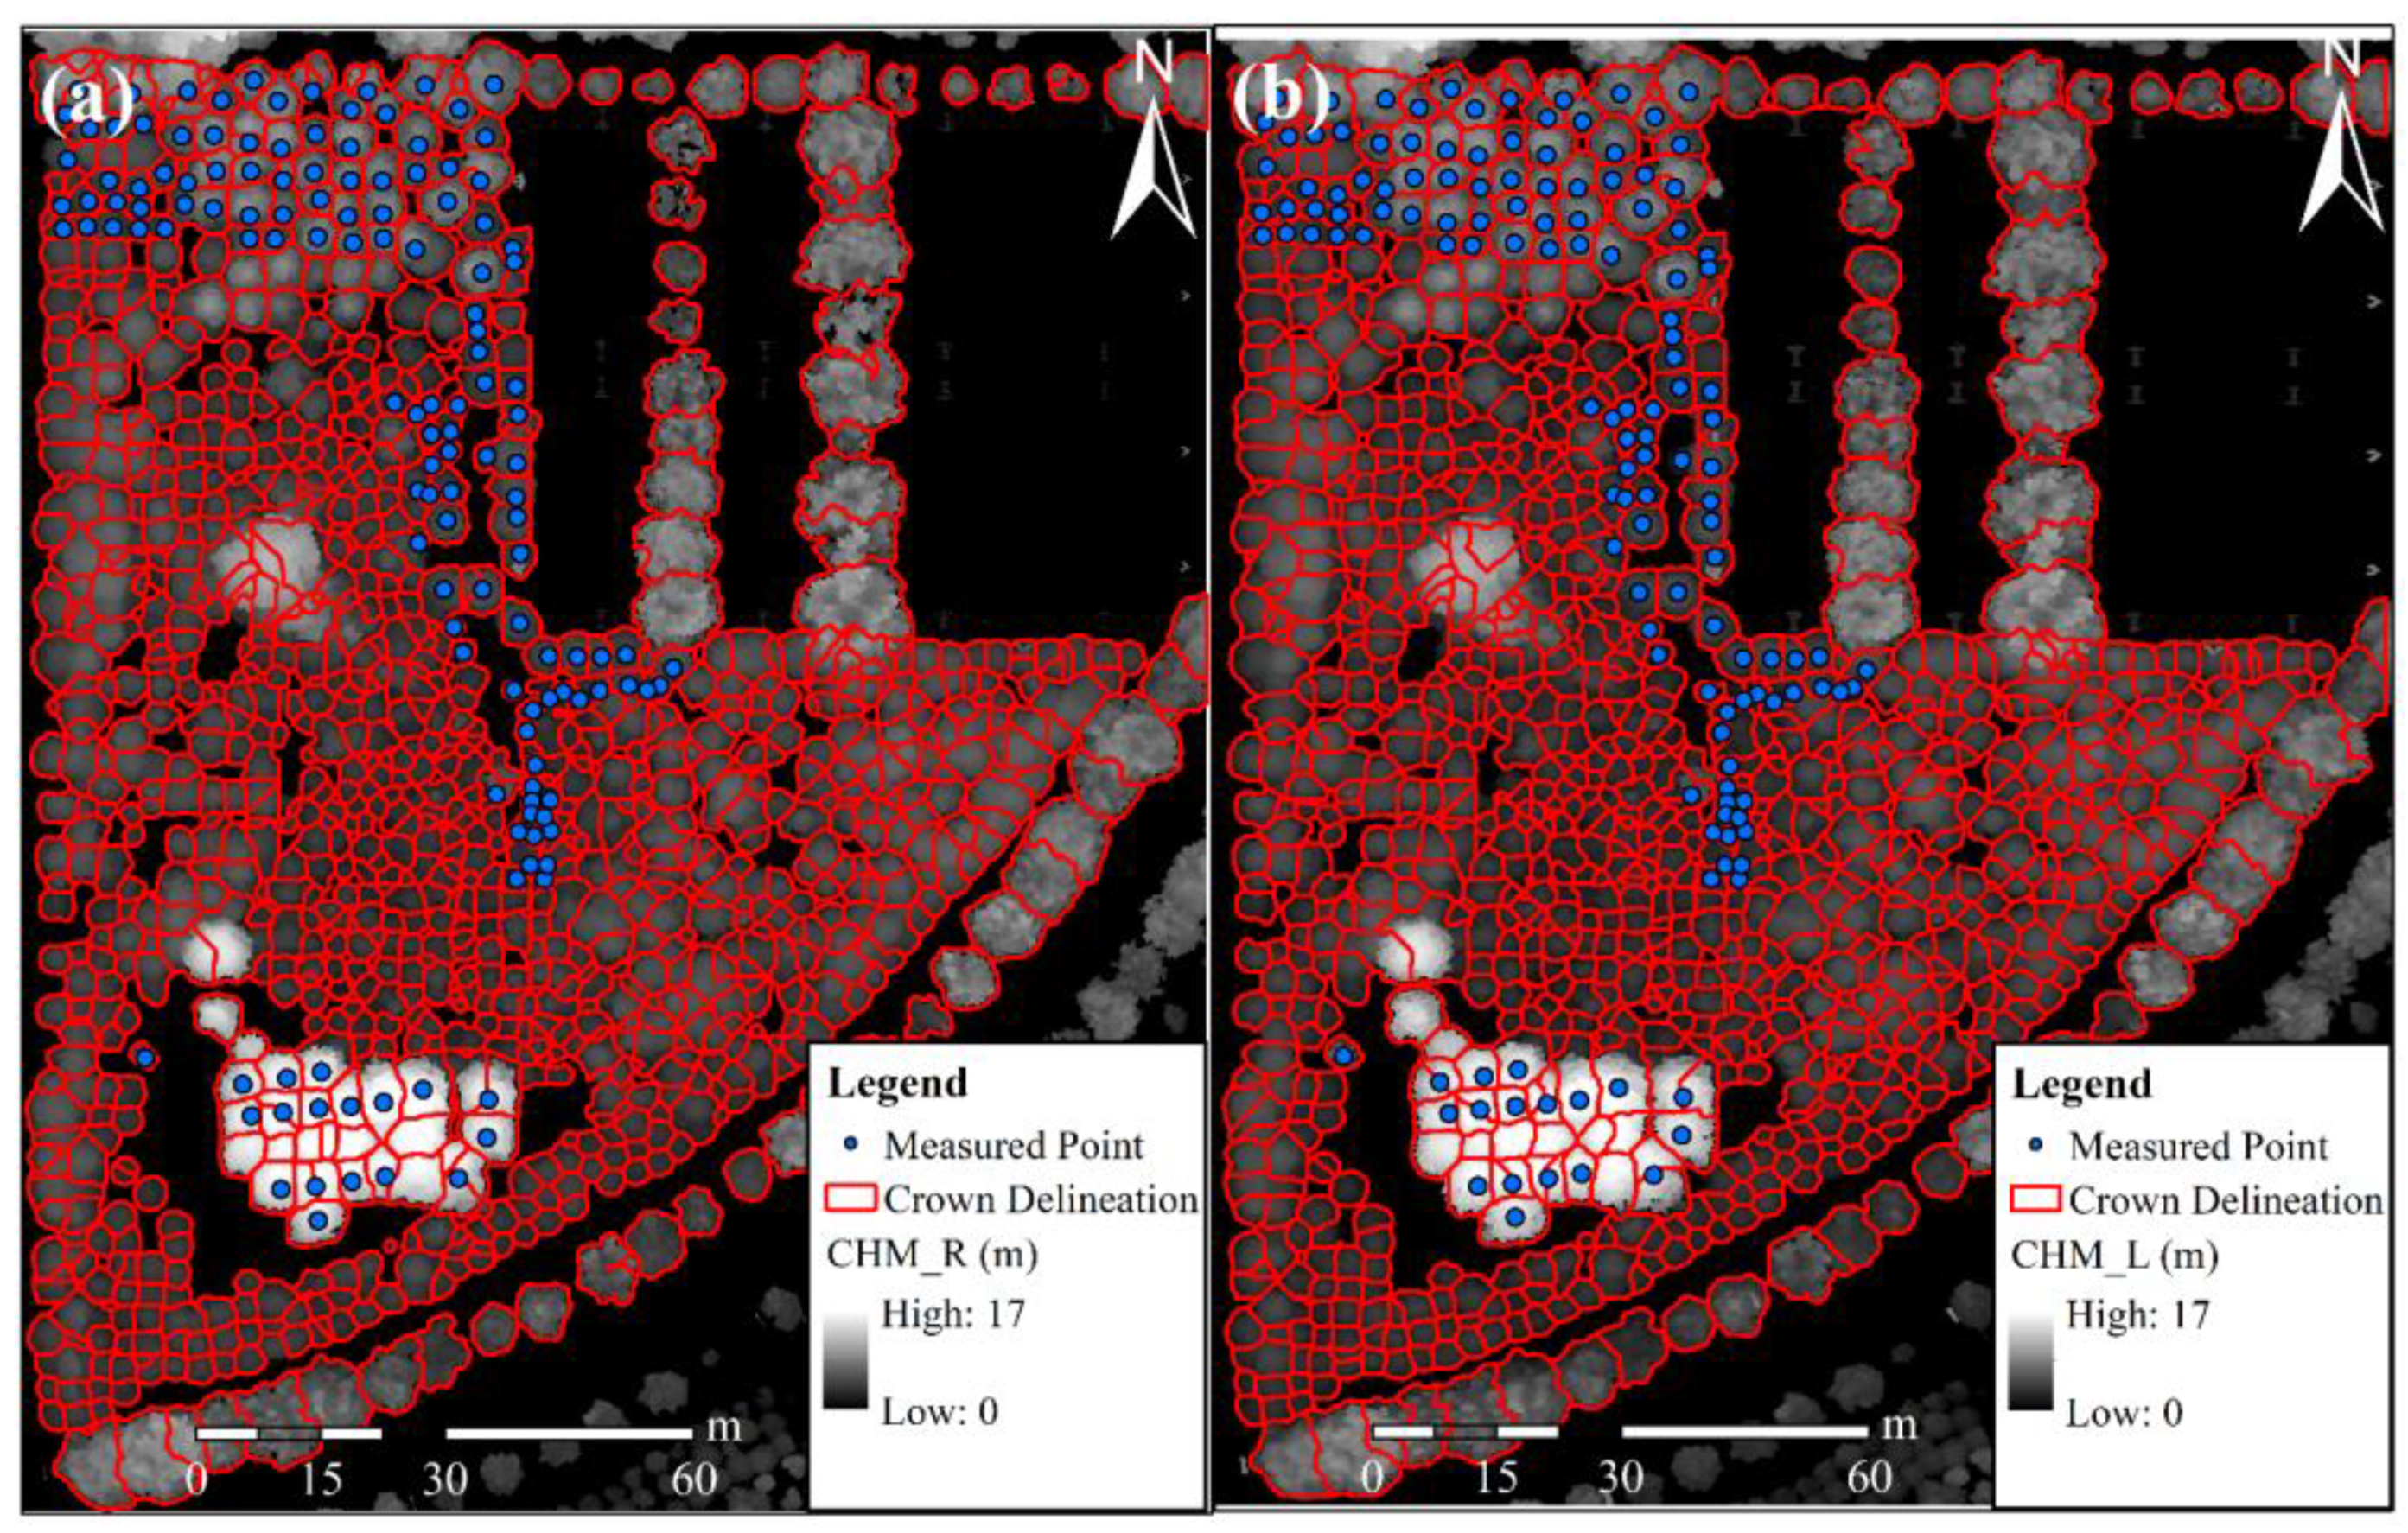
The segmentation results for individual trees based on the CHM using the watershed algorithm are shown in
Figure 8.
As shown in
Figure 8, accurate segmentation results were obtained using the watershed algorithm based on the CHMs generated from both image points and LiDAR points, but there are still some over-segmentations and under-segmentations. The segmentation results of 143 trees shown in
Figure 8 were statistically analyzed, as shown in
Table 2.
Based on
Table 2, it is shown that for the segmentation results of the image points, fifteen trees were over-segmented, seven trees were under-segmented, and three trees were not segmented, resulting in an r of 92.19%, p of 88.72%, and F of 90.42%. For the segmentation results of the LiDAR points, eighteen trees were over-segmented, six trees were under-segmented, and seven trees were not segmented, resulting in an r of 89.60%, p of 86.15%, and F of 87.84%. The results indicate that the individual tree segmentation results of the image points are better than those of the LiDAR points.
- 2.
Result of Tree Crown Width Extraction
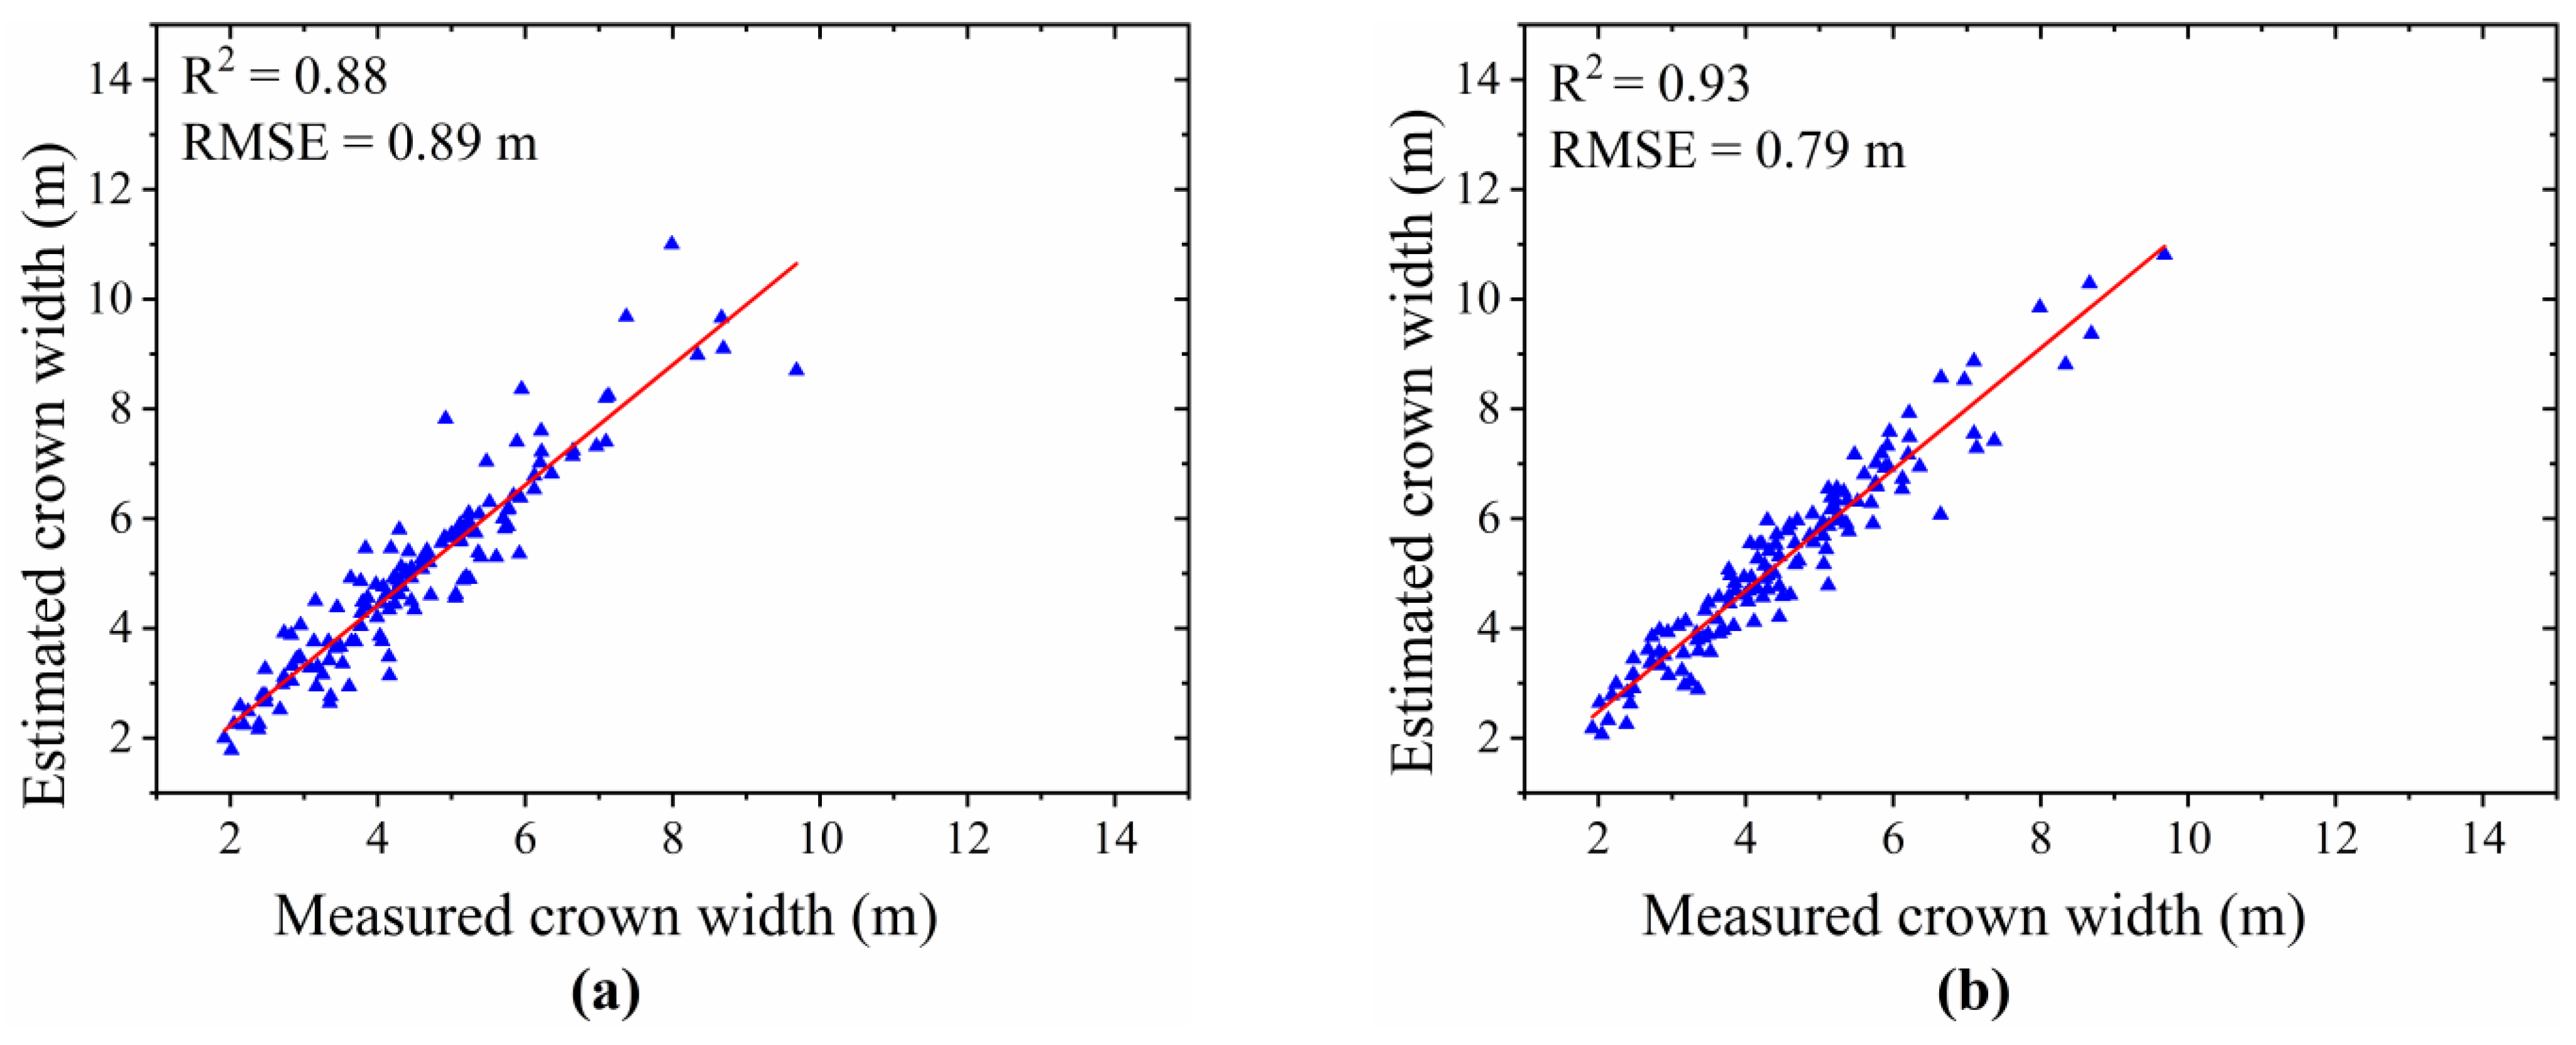
To further quantify the differences in crown width extraction based on image points and LiDAR points, a correlation analysis was conducted between the crown width extraction results and the field-measured crown widths, as shown in
Figure 9.
From the results shown in
Figure 9, the results of the crown width extraction based on image points and LiDAR points exhibit a high correlation with the field-measured crown widths. Additionally, the crown width extraction results based on the LiDAR points have a higher correlation (R
2 = 0.93, RMSE = 0.79 m) than those based on the image points (R
2 = 0.88, RMSE = 0.89 m). Performing a
t-test to obtain the difference between the crown width extraction results, the
p-value was 0.19, which is much greater than 0.05, indicating that there is no significant difference in crown width extraction results between the image points and LiDAR points.
- 3.
Result of Tree Height Extraction
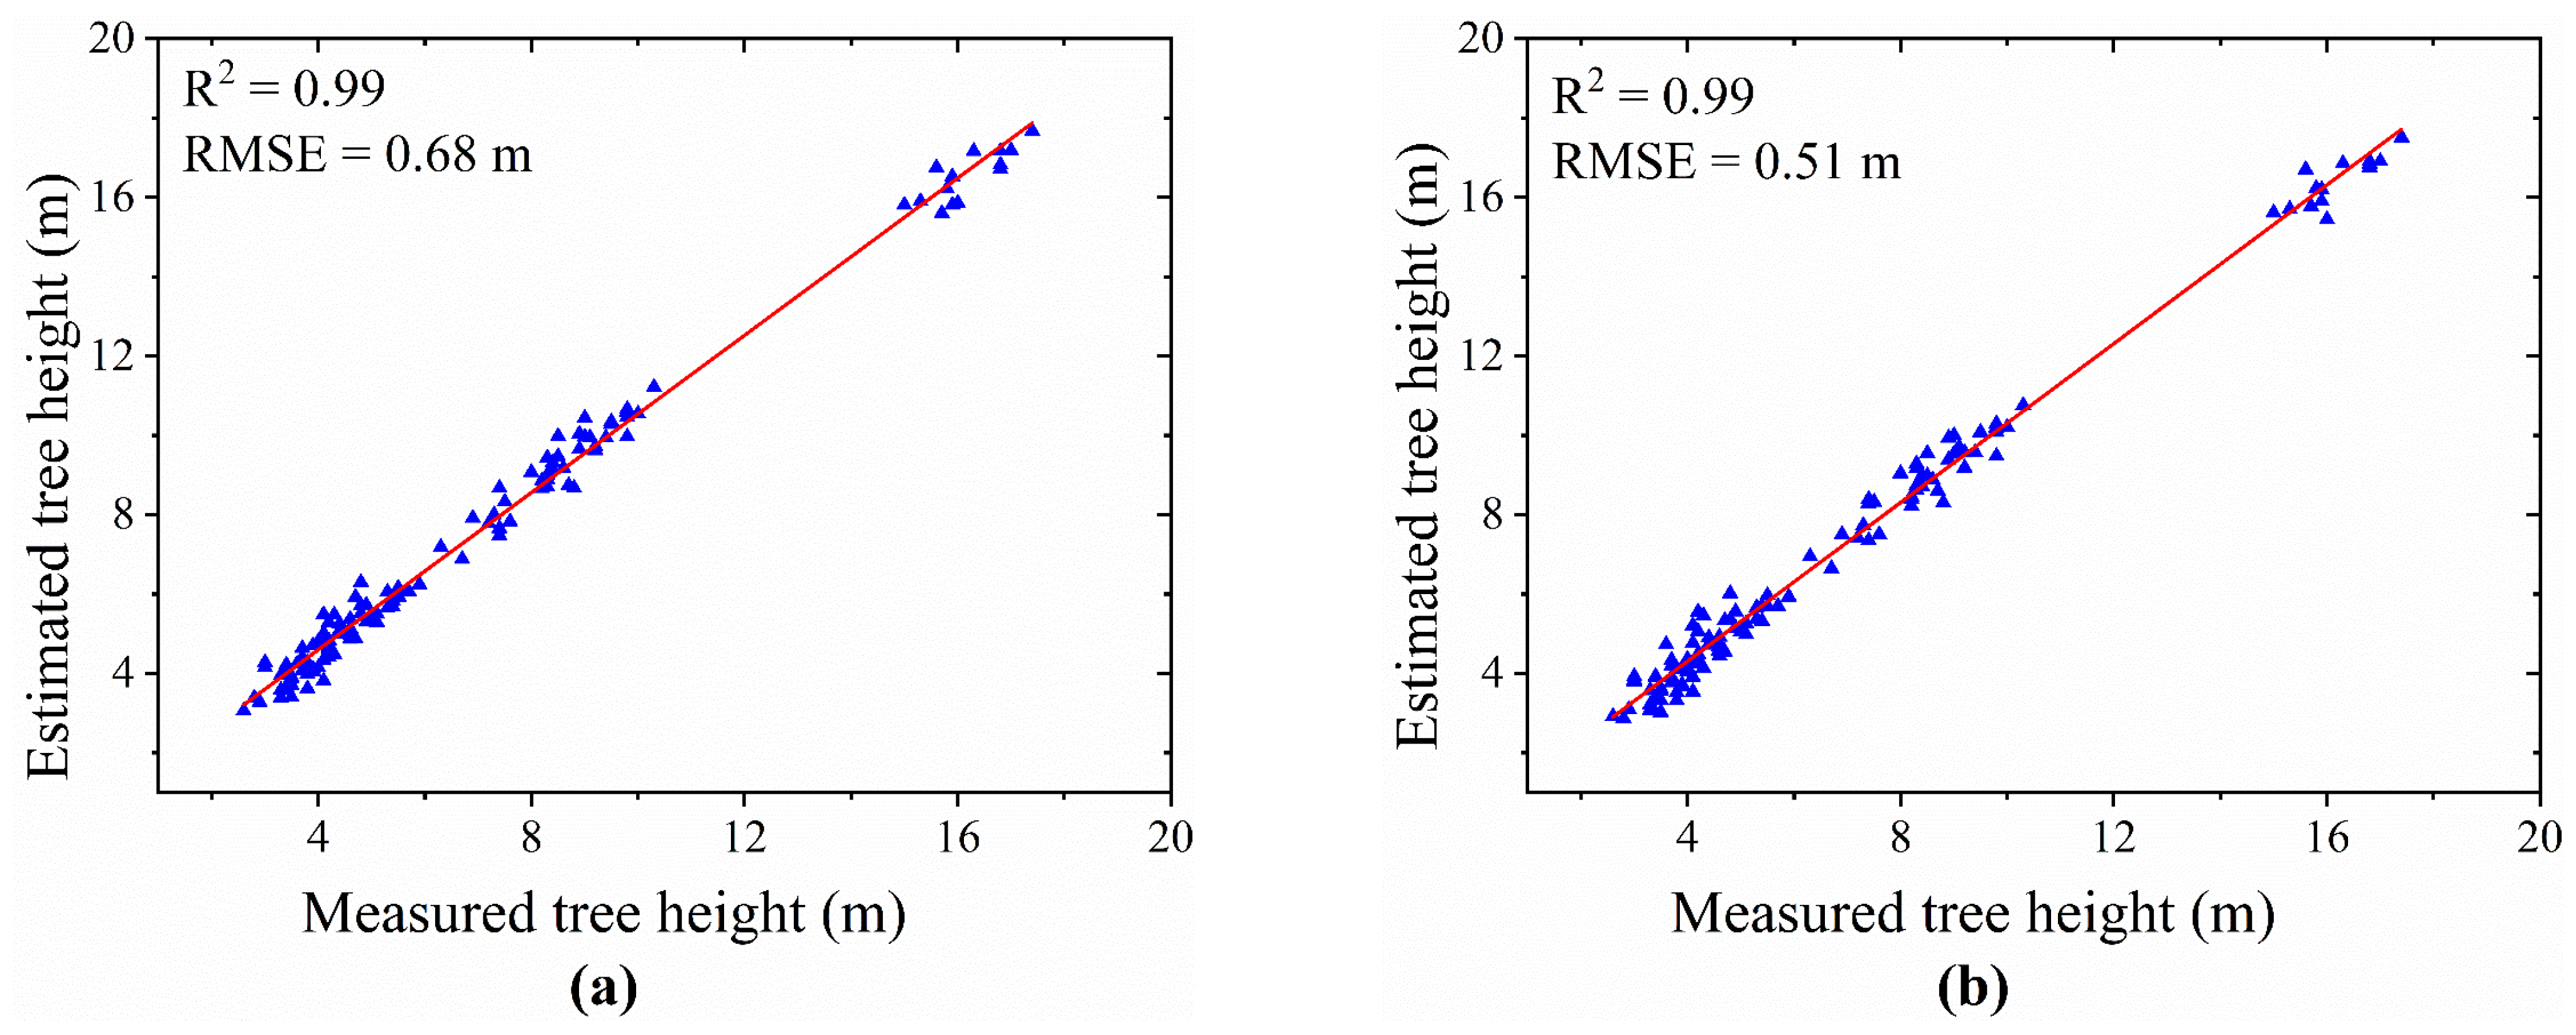
Similarly, correlation analysis was conducted between the individual tree height extraction results and the field-measured tree height, as shown in
Figure 10.
As shown in
Figure 10, the extraction results of the tree height based both on image points and LiDAR points exhibit a high correlation with the field-measured tree height, with an R
2 of 0.99 and 0.99, and a RMSE of 0.68 and 0.51 m, respectively. Performing a
t-test to obtain the difference between tree height extraction results, the
p-value was 0.60, which is much greater than 0.05, indicating that there is no significant difference in tree height extraction results between the image points and LiDAR points. Therefore, under cost-control conditions, image points can be used to replace LiDAR points for extracting individual tree structural parameters.
3.3. Comparison of Crown Width and Height Extraction Results for Different Tree Species
To explore the differences in crown width and tree height extraction results of different tree species based on LiDAR points and image points, four tree species (Cinnamomum camphora, Osmanthus fragrans, Liriodendron chinense, and Magnolia grandiflora) were studied.
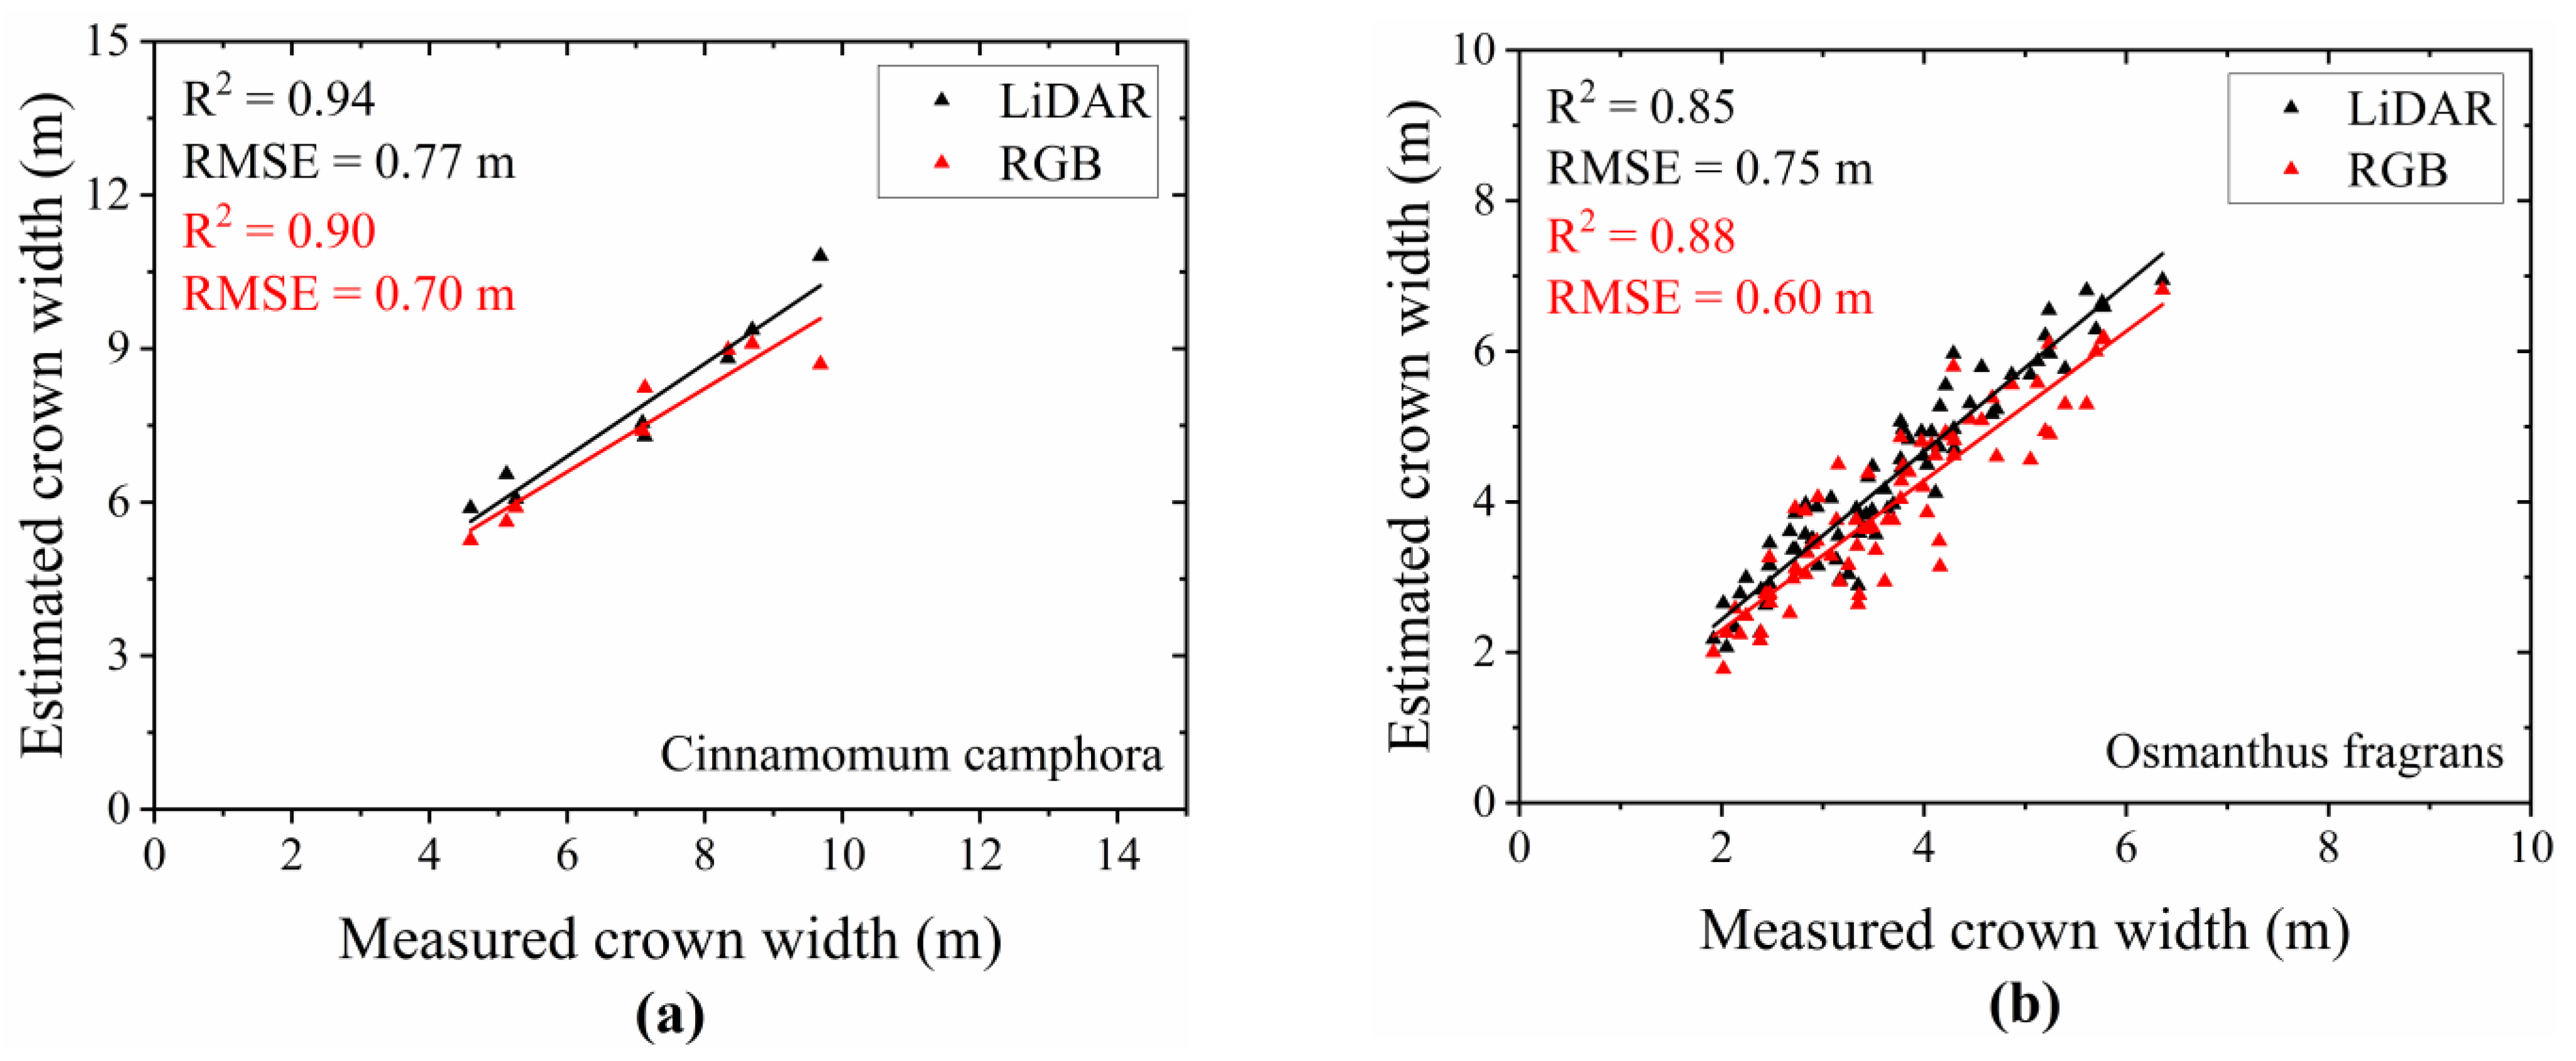
Based on LiDAR points and image points, the crown widths of four tree species were extracted; the correlation results with the field-measured crown widths are shown in
Figure 11.
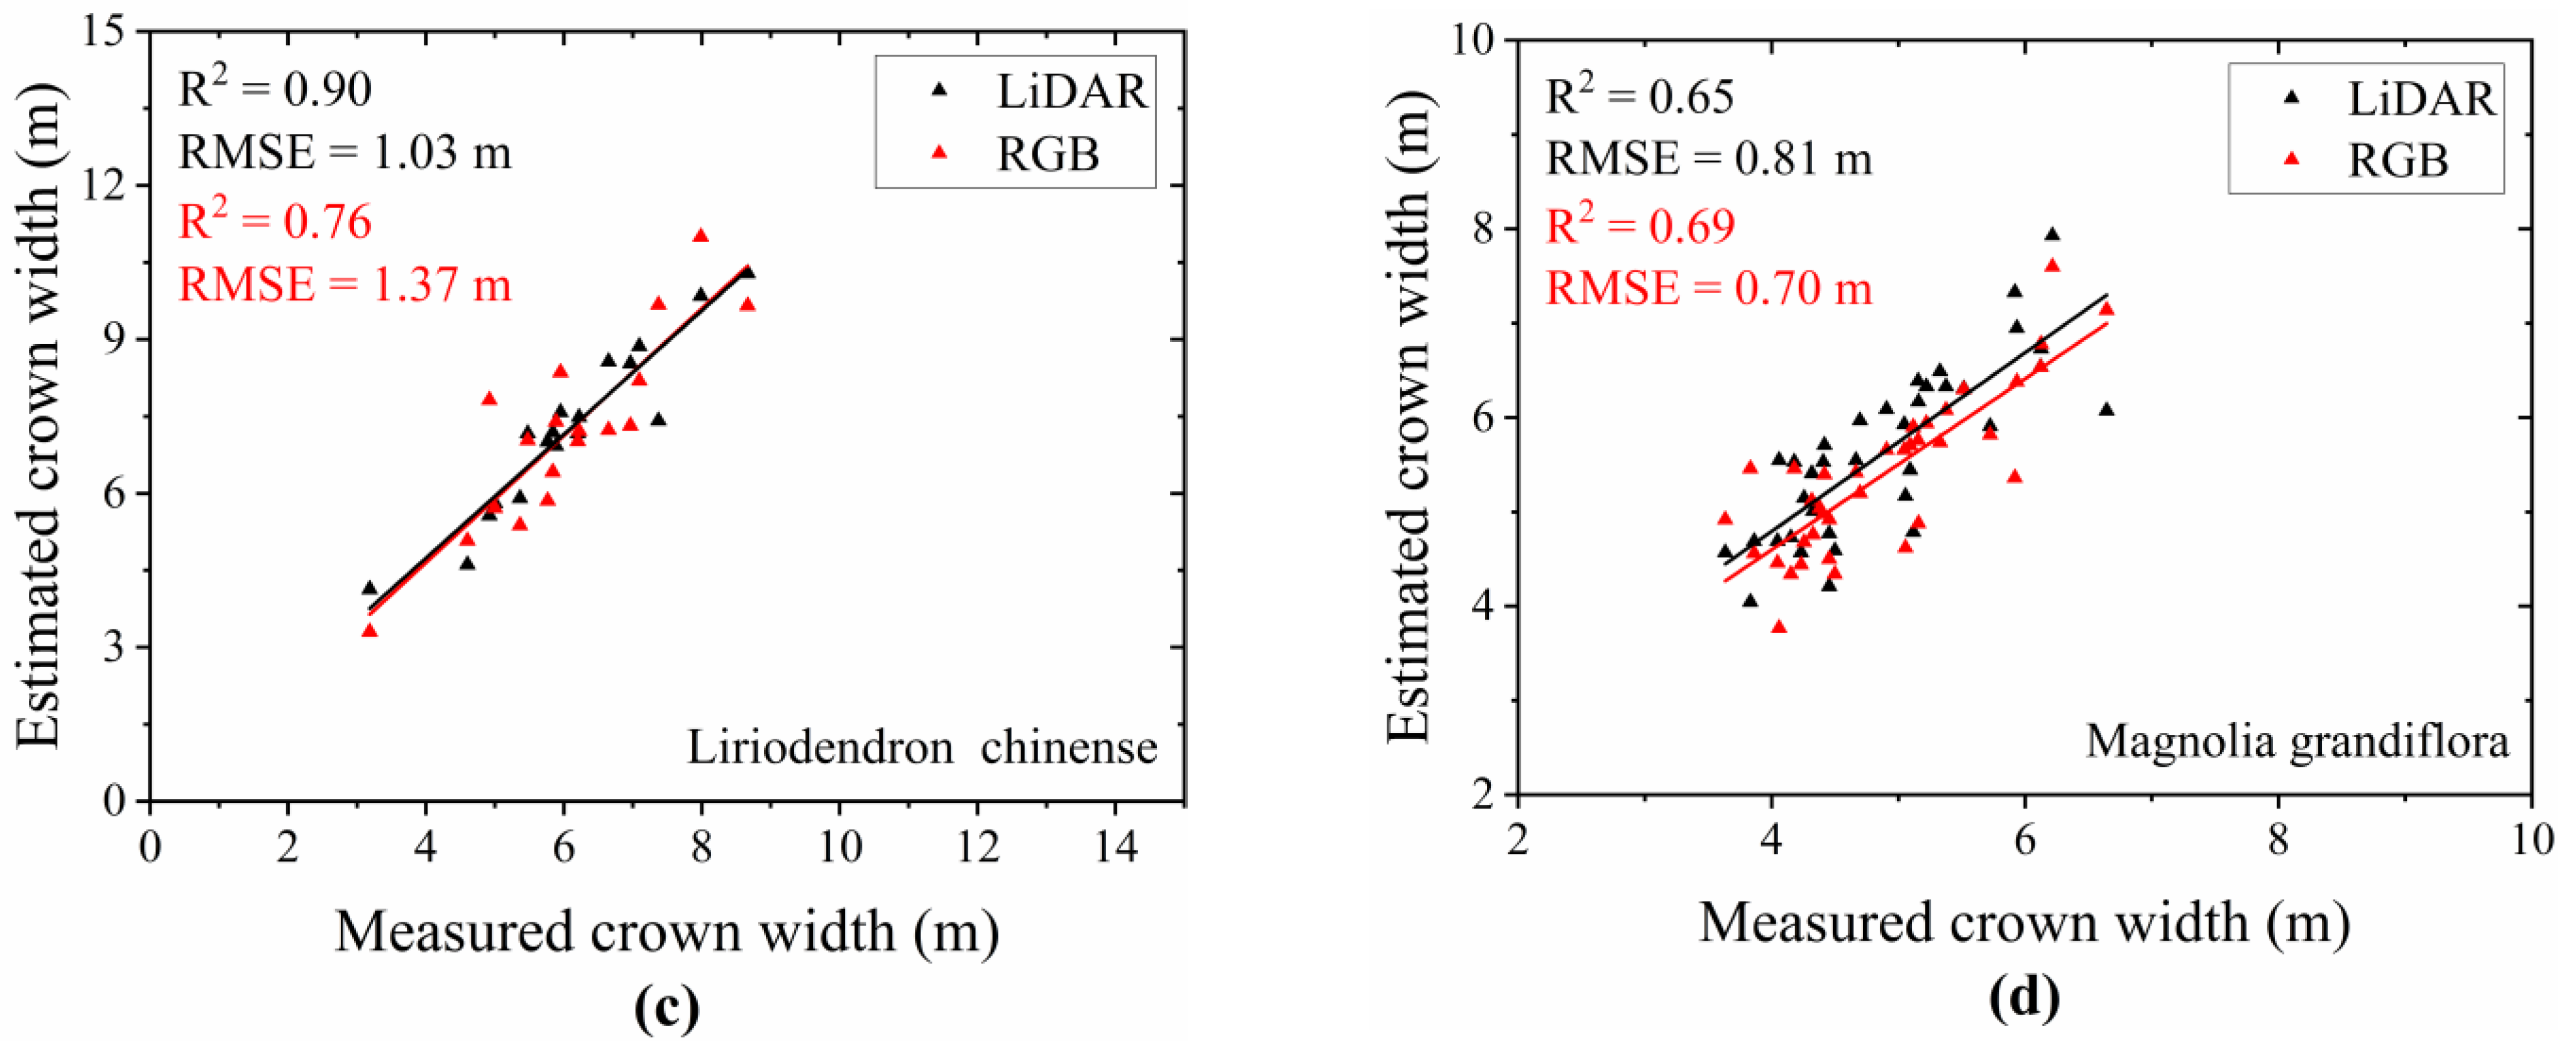
From the results shown in
Figure 11, among four different tree species, the crown width extraction accuracy of Cinnamomum camphora is the highest, with an R
2 of 0.94 and a RMSE of 0.77 m for LiDAR points, and with an R
2 of 0.90 and a RMSE of 0.70 m for image points. The crown width extraction accuracy of Magnolia grandiflora is the lowest, with an R
2 of 0.65 and a RMSE of 0.81 m for LiDAR points, and with an R
2 of 0.69 and a RMSE of 0.70 m for image points. For Cinnamomum camphora and Liriodendron chinense, the crown width extraction results based on the LiDAR points are better than those obtained from the image points. However, for Osmanthus fragrans and Magnolia grandiflora, the crown width extraction results based on the image points are superior to those obtained from the LiDAR points. In the case of Liriodendron chinense, the difference in crown extraction results between the LiDAR points and image points is the greatest, with an R
2 of 0.90 and a RMSE of 1.03 m for the LiDAR points, and with an R
2 of 0.76 and a RMSE of 1.37 m for the image points. The R
2 and RMSE were 0.14 and 0.34 m, respectively. For the remaining three tree species, the differences in the crown extraction results between the LiDAR points and image points are relatively small, with the maximum difference of 0.04 for the R
2 and 0.15 m for the RMSE.
To further test whether the differences in the crown width extraction results are significant, one-way analysis of variance (ANOVA) was performed on the crown width extraction results of four tree species based on LiDAR points and image points using Origin Pro 2018 software, as shown in
Table 3 and
Table 4.
By analyzing the results shown in
Table 3, it was found that the
p-values were all less than 0.05, indicating that further Tukey’s tests could be performed to analyze the differences in crown width extraction among different tree species. By analyzing the results of Tukey’s tests on the differences in crown width extraction among different tree species shown in
Table 4, it was found that all the
p-values were less than 0.05, indicating that all the differences in crown width extraction results among different tree species based on both LiDAR points and image points were significant.
- 2.
Extraction Results of Tree Height for Different Tree Species
Similarly, the correlation results between the field-measured and the extracted tree heights of different tree species based on LiDAR points and image points are shown in
Figure 12.
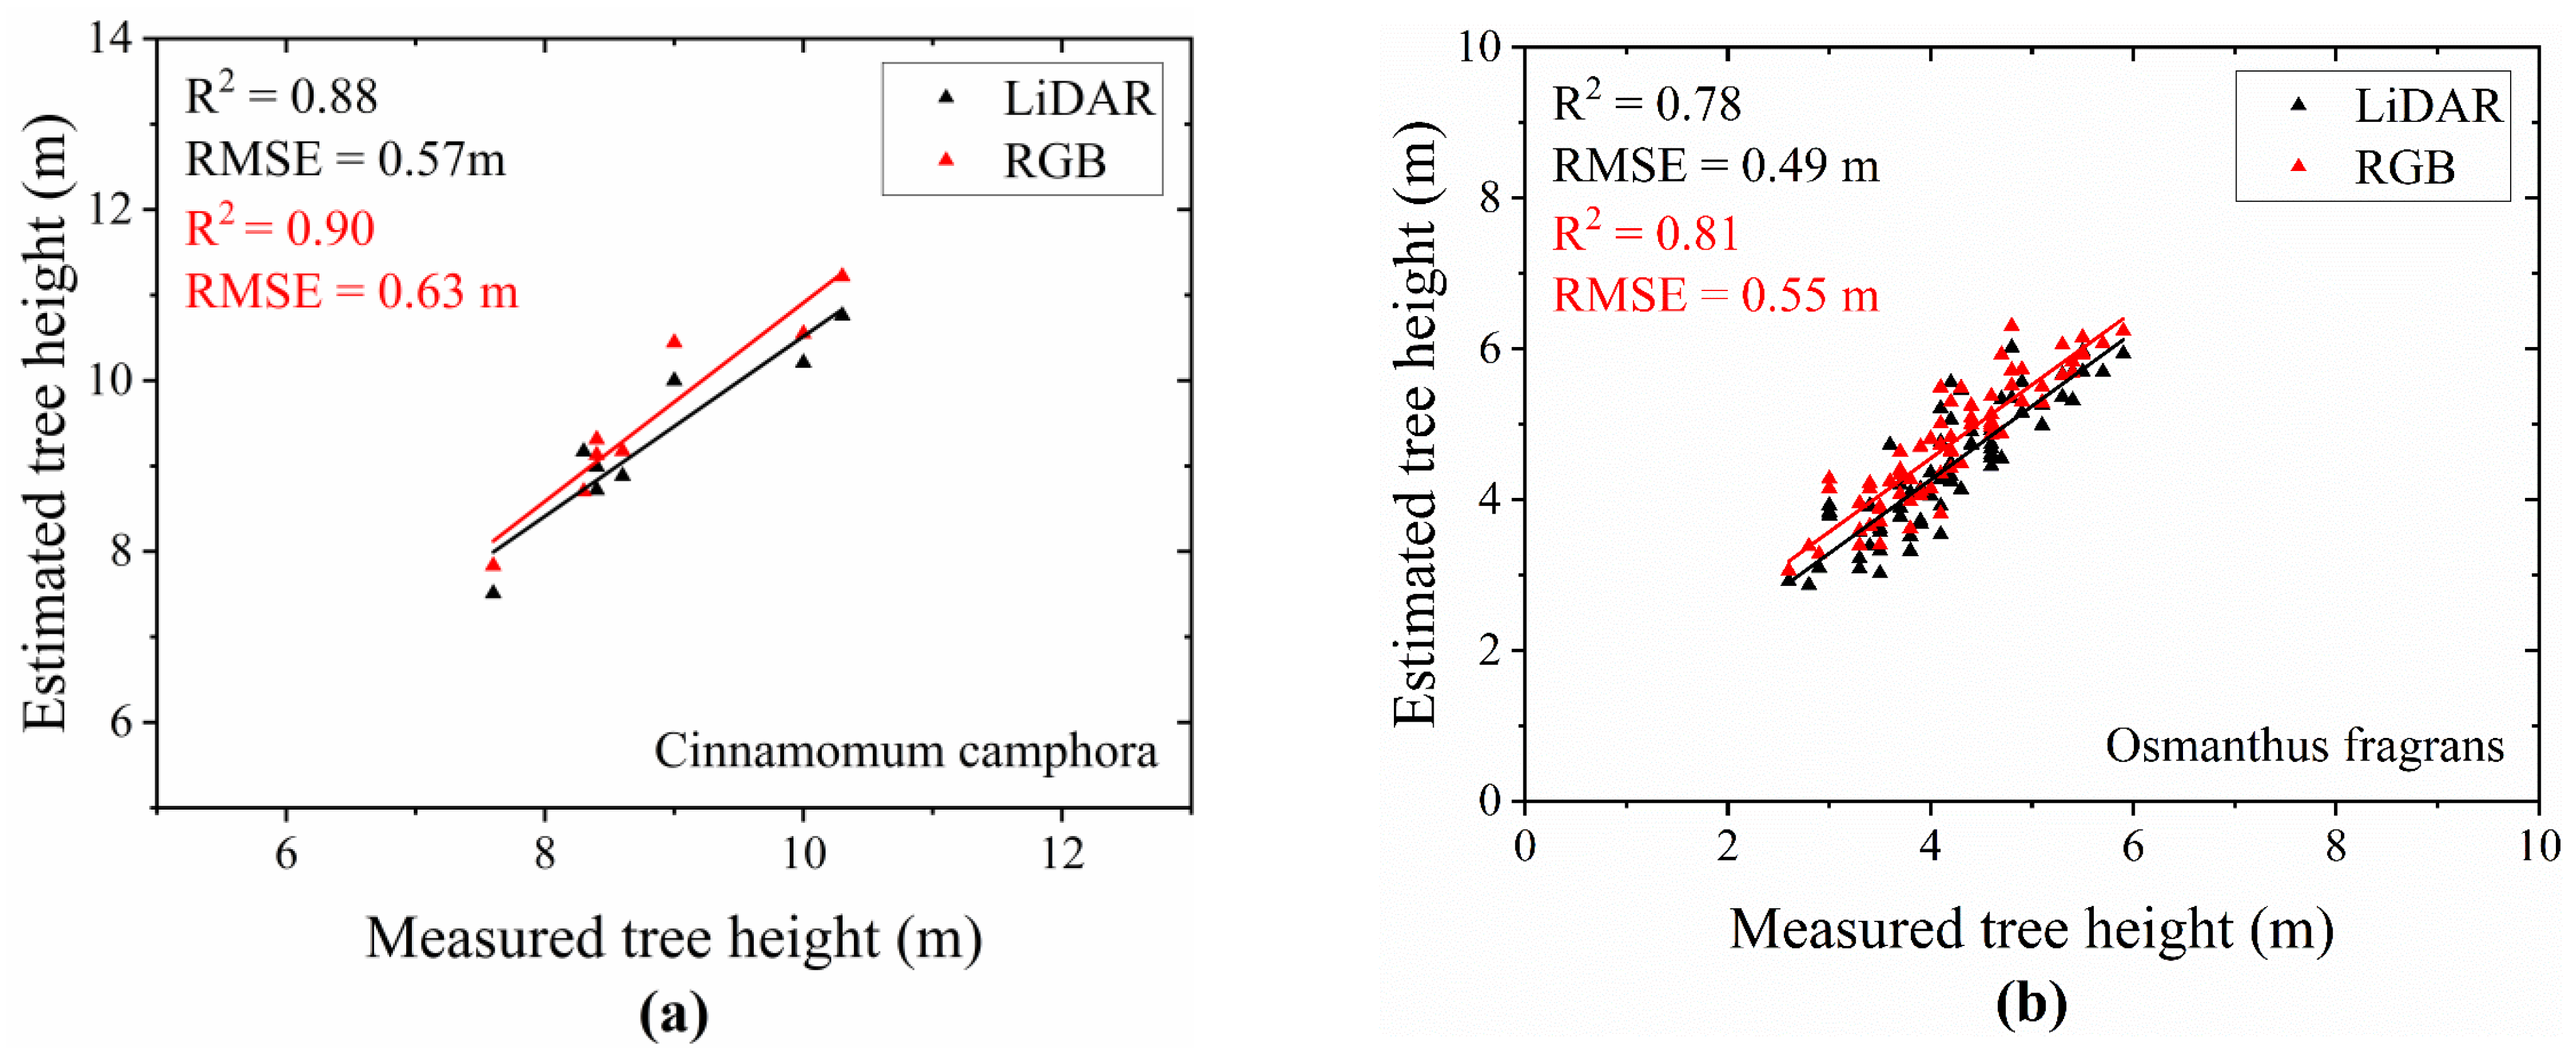
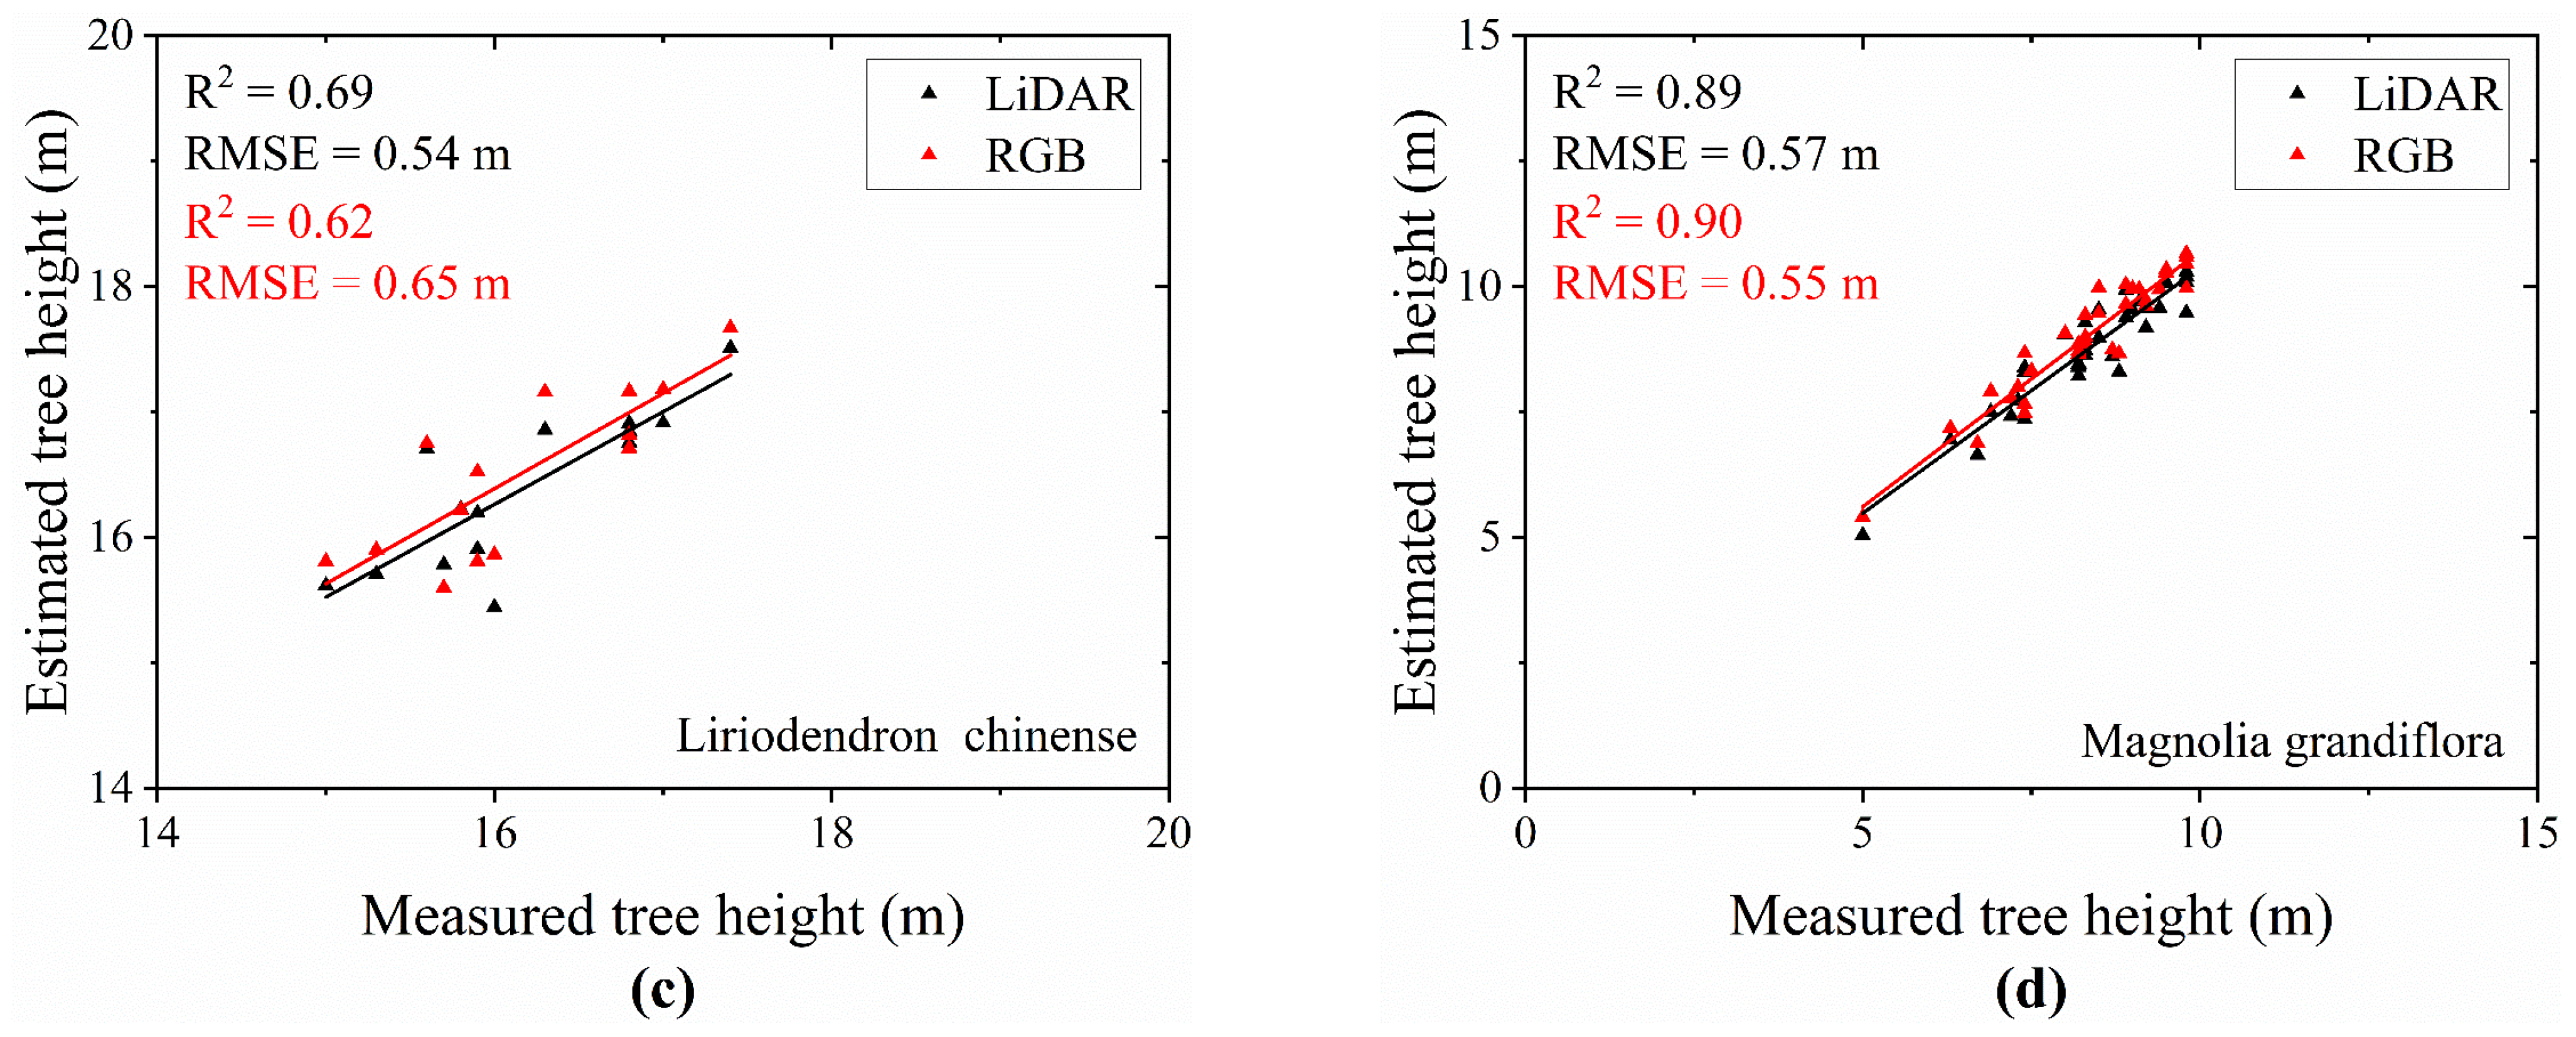
The results presented in
Figure 12 suggest that among four different tree species, the tree height extraction accuracy of Magnolia grandiflora is the highest, with an R
2 of 0.89 and a RMSE of 0.57 m for LiDAR points, and with an R
2 of 0.90 and a RMSE of 0.62 m for image points. In contrast, the tree height extraction accuracy of Liriodendron chinense is the lowest, with an R
2 of 0.69 and a RMSE of 0.54 m for LiDAR points, and with an R
2 of 0.62 and a RMSE of 0.65 m for image points. For Liriodendron chinense, the tree height extraction results based on LiDAR points outperform those obtained from image points. In contrast, for Cinnamomum camphora, Osmanthus fragrans, and Magnolia grandiflora, the tree height extraction results based on image points are superior to those obtained from LiDAR points. Specifically, the difference in tree height extraction results between the LiDAR points and image points is the largest for Liriodendron chinense, with a difference in R
2 of 0.07 and in RMSE of 0.11 m. Comparatively, for the other three tree species, the differences in R
2 and RMSE are relatively small, with the maximum differences in R
2 and RMSE being 0.03 and 0.06 m, respectively.
To further test whether the differences in tree height extraction results are significant, Origin Pro 2018 software was used to perform ANOVA, and the results are shown in
Table 5 and
Table 6.
By analyzing the results shown in
Table 5, it was found that all the
p-values were less than 0.05, indicating that further Tukey’s tests could be performed to analyze the differences in tree height extraction among different tree species. By analyzing the results of the Tukey’s tests shown in
Table 6, it was found that all the
p-values were less than 0.05, indicating that all the differences in tree height extraction results among different tree species based on both LiDAR points and image points were significant.
To summarize, for the extraction of the individual tree crown width and tree height, the results of different tree species based on LiDAR points and image points are different. Statistics are provided on the methods with better extraction results for individual tree crown width and tree height of different tree species, as shown in
Table 7.
As shown in
Table 7, for the extraction of individual tree structural parameters, the LiDAR points and image points have their own advantages and disadvantages, and the extraction accuracy is closely related to the tree species.


