Article

A System for the Direct Monitoring of Biological Objects in an Ecologically Balanced Zone

1
College of Resources & Safety Engineering, China University of Mining and Technology (Beijing), Ding No. 11 Xueyuan Road, Haidian District, Beijing 100083, China
2
Department of Mechatronics and Technological Measurements, Tambov State Technical University, Tambov 392000, Russia
3
Physics Department, National University of Science and Technology “MISIS”, Moscow 119049, Russia
4
Department of Electronic Engineering, National Research University Higher School of Economics, Moscow 101000, Russia
*
Author to whom correspondence should be addressed.
Drones 2023, 7(1), 33; https://doi.org/10.3390/drones7010033
Submission received: 17 November 2022 / Revised: 25 December 2022 / Accepted: 26 December 2022 / Published: 1 January 2023

Abstract

:
This article discusses a model of a robotic platform that can be used for the proximal probing of biological objects in an ecologically balanced zone. The proximal probing is for scanning deciduous and fertile parts of biological objects with a hyperspectral camera at a distance of no more than a few meters. It allows for the obtention of information about the presence of phyto-diseases of tissues and also about the degree of ripeness and other parameters of the internal quality of the fruit. In this article, we report the methods and approaches used to detect fruits in the crown of a tree and also to identify their diseases such as scab and decay with an accuracy of at least 87%. For the autonomous movement of the platform in an ecologically balanced area, visual and inertial navigation is based on a Zed 2i stereo camera. This allows for the moving of biological objects in accordance with a given route indicated on the 2D map. The analysis of the information received from this platform allows for the building of maps of the presence of phyto-deseases in an ecologically balanced zone, and decisions are promptly made regarding the implementation of technical and protective measures that ensure high-quality products.

1. Introduction

The production of fruits and berries is extremely laborious and difficult to automate. There is a need to reduce labor intensity, minimize operating and production costs and the environmental impact and optimize the entire production cycle. The foregoing causes an increase in interest, among both researchers and practitioners, in the development of autonomous tractors [1] and autonomous and semi-autonomous robotic systems [2,3], which automate the main complex of mechanized works in fruit growing. The most typical tasks include soil sampling for agrochemical analyses, tree planting, foliar fertilizing, chemical treatments and fruit harvesting. Recently, routine planting monitoring, providing information for automated decision support in the precision gardening system, has been added.
Robotic platforms for mechanical and chemical weeding are represented by the following types: Hortibot (Aarhus University, Denmark) [2], Vitirover (NaïoTechnologies, France) [3], EcoRobotix (Switzerland), BoniRob (DeepfieldRobotics, Germany) [4], FarmWise (USA), AgBotII, Digital Farmhand (Australia) and FarmDroid (Germany). The efficiency of robotic weeders approaches 90%, whereas herbicide treatment using Drop on Demand (DoD) robotic systems can be 100% efficient [5]. Still, the information about the actual performance of the robotic platforms and the adaptability to different crops is scarce. An increase in their velocity, performance and surface area, as well as improving the accuracy of weed detection, are required to expand the scope of commercial applications of the robotic platforms.
Robotic technologies for the highly precise detection and identification of diseases, as well as insect pests [6], have been developed. Researchers proposed a convolutional neural network-based model for the multiple classification of insects and methods for rough detection and counting YOLO (You Only Look Once) and also classification and exact counting based on Support Vector Machines (SVM) using global functions [6,7]. These algorithms allow for the detection of the symptoms of powdery mildew, tomato spotted wilt virus, Xylella fastidiosa bacterial pathogen, etc.
An automated robotic platform (Bernard, France) has been developed for sugar beet phenotyping. It includes a wheeled mobile robot and a six-degrees-of-freedom manipulator for the colorimetric and geometric measurements of plants. T. Mueller-Sim, M. Jenkins, J. Abel and G. Kantor are with The Robotics Institute of Carnegie Mellon University and devised a robotic ground platform for the high-performance phenotyping of sorghum and corn crops. The fully automated platform for phenotyping from Rothamsted Research, UK includes high-resolution RGB cameras, as well as cameras detecting the brightness of chlorophyll fluorescence and thermal infrared cameras, two hyperspectrometers and two lidars. A number of commercially available autonomous and semi-autonomous robotic platforms for the harvesting of diverse fruits have been created (Table 1).
Of particular concern is the development of mechanically reinforced frame elements and active manipulators of robotic systems [8]. Interfaces (for example, grips) should be small, minimal in weight and processed taking into account operational strength and plastic characteristics [9,10].
All of the robotic platforms mentioned above employ technical vision based on RGB and hyperspectral cameras operating in the IR and visible spectrum ranges. Acoustic distance sensors, gyroscopes, lidars, inertial measurement units (IMU) and GPS navigation (GPS RTK) are used for the positioning system. The robotic platforms include either 4- or 6-wheel chassis with 2-, 4- or all-wheel drive by servos and/or stepper motors.
Common tasks for robotic platforms include the route planning, detection and classification of the objects of interest (crops, pests, etc.), finding fruits in three-dimensional space using the input from stereo cameras and lidars, the dosing of chemicals, coping with the navigation system inaccuracy while driving through “unstructured” agricultural areas and ensuring safety by detecting and circumventing people and other obstacles. Roboplatform control problems also arise due to a technical vision failure arising from the uneven lighting of the scene, a nonlinear real-time response, position displacement due to drift and the accumulation of errors by the sensors. In addition, constant communication is necessary between works and objects, which requires the additional development of new methods of deep learning for their orientation in space.
The hyperspectral analysis research review:
Recently, the analysis of hyperspectral reflectance has been increasingly used for the remote and proximal probing of plant organs. This is due to the development of the technique and technology of hyperspectral cameras, increasing their availability and reducing the cost. Hyperspectral reflectance imaging in the visible and near-infrared spectral regions allowed for the detection and classification of apples infected with fruit worm (Laspeyresia pomonella) [11]. The most accurate classification was obtained using five channels (434.0 nm, 437.5 nm, 538.3 nm, 582.8 nm and 914.5 nm): 82% for the calibration dataset; 81% and 86% for healthy and damaged apples.
Reflectance in the visible and near-infrared range (400–900 nm) revealed the rot, bruises, wounds and soil contamination of apple and pear fruits of several varieties [12] using the second derivative of the reflectance spectrum in the absorption band of chlorophyll (centered at 685 nm) and two bands in the NIR region (950–1650 nm), regardless of the fruit color and variety [13]. Optimal results were obtained by using a spectral index in the form of a ratio of reflection coefficients at 1074 nm and 1016 nm. The accuracy of damage detection was 92%. Hyperspectral images were also used to predict the content of soluble solids in the tissues of apples of various colors [14].
In mathematical models describing the reflection spectra in the 450–1000 nm range to predict the dynamics of fruit hardness and the content of soluble solids in Golden Delicious apples, the accuracy of prediction peaked at 675 nm [15]. Hyperspectral reflectance images taken in the range of 400–1000 nm were used to determine the content of glucose, fructose and sucrose in whole kiwi fruits and their slices [16].
The optical properties of the skin and pulp of Breaburn, Kanji and Green Star apples varieties in the range of 500–1850 nm revealed spectral contributions to light absorption by carotenoids (500 nm), anthocyanins (550 nm), chlorophyll (678 nm) and water (970, 1200 and 1450 nm) [17]. The processing of hyperspectral images (400–1000 nm) with an artificial neural network (ANN) detected cold damage to apple fruits [18]. The ANN selected the optimal wavelengths (717, 751, 875, 960 and 980 nm) for classifying apples according to the degree of their damage. Spectral and spatial criteria made it possible to achieve an average accuracy of 98.4% in detecting damaged fruits.
The possibility of determining the stage of maturity of blueberries by hyperspectral imaging was studied [12]. Three methods for selecting informative spectral bands based on information theory and using the Kullback–Leibler divergence were used. This made it possible to achieve a classification accuracy of more than 88%.
Hyperspectral images were also used to monitor the fungal infection of dates by employing four spectral channels in the NIR (1120, 1300, 1610 and 1650 nm), with an accuracy of at least 91% [19]. A similar approach, implemented in the range of 400–780 nm, was used to classify tomato leaves into healthy leaves and those affected by gray mold [20]. Hyperspectral imaging also made it possible to analyze the spatial variation in the diffuse reflection of fruits (apples, peaches, pears, kiwi and plums) and vegetables (cucumbers, zucchini and tomatoes) in the spectral range of 500–1000 nm [21]. The NIR reflectance images made it possible to visualize quality parameters and predict the sugar content and hardness of melons using the Partial Least Squares Regression (PLSR) method, the Principal Component Analysis (PCA) and the Support Vector Machine (SVM) method, as well as an ANN; PLSR was evaluated as the best method [22].
Reflection in the ranges of 750–850 nm and 900–1900 nm has been used to detect bruises in apples of five varieties (Champion, Gloucester, Golden Delicious, Idared and Topaz) [23]. The spectra were pre-processed by baseline displacement/linear correction, multiple scattering correction (MSC), standard normal variation with trend elimination (SNV&DT) and the second derivative calculated by the Savitsky–Golay algorithm. The analysis of hyperspectral images obtained in the range of 500–1000 nm revealed the dependence of the apple storability decline on the energy of the damaging impact [10,11,12,13,24].
Hyperspectral images in the visible and NIR ranges (450–1040 nm) have been successfully used to monitor the ripeness of nectarines of the Big Top and Magic varieties (Prunus persica L. Batsch var. Nucipersica) using RPI and IQI indices calculated on the base of 650–730 nm and 940–1040 nm channels [25]. Hyperspectral images (the bands 650–850 nm and 900–1000 nm) were used to detect bruises and dents in peaches 12, 24, 36 and 48 h after their mechanical damage, as well as to detect various skin defects (damage by insects, phytopathogenic fungi, etc.) of two-colored Pinggu peaches [26].
Navigation systems enable the positioning of autonomous mobile robots and guide them along a preset route. Currently, satellite, inertial and visual navigation systems are widespread in agricultural robots, with a predominance of satellite navigation. However, the latter is limited by the instability of the satellite signal [26]. Therefore, full autonomy of a robot can be achieved only when using a combined navigation system that includes all of the above-mentioned components [27]. The most promising method of robot guiding is based on the imaging of the robot’s surroundings, mimicking the vision of living organisms—a basic and evolutionarily ancient way of perceiving information. It is also intuitively attractive since people and animals often use visual information to navigate in space.
Cameras used for visual navigation are divided into three types: monocular, binocular (stereo cameras) and depth (RGB-D) cameras [28]. Unlike monocular cameras, stereo cameras and RGB-D cameras obtain a depth map representing distances to the surfaces of objects in the camera’s field of view. The advantage of using such cameras for mobile robot navigation is that they provide ample capabilities for pattern recognition during mapping, allowing for navigation by landmarks [29]. Video records of geo-referenced landmarks allow for the determination of true coordinates and plan movement using a topological image of the surroundings.
Visual landmarks can be classified into artificial and natural ones. Detecting and tracking artificial landmarks make the task easier because of the optimal contrast, and their exact geometric and physical properties are known in advance.
The first artificial landmarks used in robotics were contrasting lines and crosses drawn on the floor. The approach when the robot control system constantly compares images of the target and current surroundings to adjust its trajectory is called visual servo control [30].
Another method of the visual navigation of agricultural robots is the use of natural differences in the color, e.g., treated vs. untreated areas of the field. This allows, using simple binarization, for the determination of the boundaries of the land plots. In combination with the least square method and morphological analysis, this approach is efficient in guiding ground robots [31]. The combination of Hough transformation with different navigation methods is more precise (its average error is below 0.5°, which is much lower than the average error of the least square method) and faster (by 35.20 ms, as compared with the calculation time of traditional conversion) [30,31,32].
A more advanced computer vision-based navigation system suggested for intellectual agricultural robots implementing Internet of Things (IoT) technology is navigation with binocular vision. It uses both land plot boundaries and the height of the plants extracted as the navigation parameters. The ANN- and deep learning-based methods of visual navigation are vigorously developing since they are suitable for navigating smart agricultural robots in complicated surroundings [33]. Since precise global positioning systems can be unavailable in orchards, a combination of 3D vision, lidar and ultrasound proximity sensors has been suggested to achieve the reliable navigation of agricultural robots [33,34].
Collectively, hyperspectral control is currently a ubiquitous approach to the monitoring of plant and fruit conditions, although a higher precision is desirable for the application of this method in precision horticulture. The common sources of error are the fluctuations of natural light conditions, shadows, the natural heterogeneity of fruit color, etc. Possible solutions include the use of a refined mathematical model for objects classification and an informed choice of images in spectral channels with minimal interference. Here, we propose such an approach in combination with the visual and inertial navigation on a single robotic platform.

2. Materials and Methods

2.1. A System for the Proximal Sensing of Apple Orchards

We developed a system for the proximal monitoring of apple orchards using a hyperspectral sensor for perceiving the fruit condition and an image sensor for navigation. The main component of the system was a robotic wheeled platform (1 in Figure 1) powered by 500 W electric motors and 30 Ah lithium-ion batteries, lasting for at least 2 h. The overall dimensions of the platform were 1.5 × 1.5 m, and the load capacity was 200 kg, which is enough to carry additional equipment, e.g., a manipulator for fruit sampling or harvesting (5 in Figure 1). As a model ground, we employed an intensive industrial apple orchard (Ligol variety on the rootstock 62–396, a 4.5 × 1.2 m planting) located in Tambov region, Russia (52.8800906, 40.488069). Information about the geographical location of the orchard and the topographic characteristics of the site can be obtained from yandex maps by clicking on the following link: https://yandex.ru/maps/225/russia/?l=sat%2Cskl&ll=40.490031%2C52.880102&mode=searse&sll=40.488069%2C52.880091&text=52.880091%2C40.488069&z=18 (accessed on 10 September 2021). A circle on the map (discussed below in the text) marks a garden plot in the vicinity of the city of Michurinsk (Tambov region, Russia).
In the orchard, the platform is guided by a computer vision system based on a Zed 2i (Stereolabs, San Francisco, CA, USA, https://www.stereolabs.com/zed-2i/ (accessed on 17 August 2021)) stereo camera (2 in Figure 1) with a built-in function for inertial navigation (gyroscope, magnetometer, etc.) and an industrial computer AIE100-903-FE-NX (Axiomtek, Taipei City, Taiwan) (4 in Figure 1). A pre-built 3D map of the orchard is also required for the navigation. The platform also supports manual remote control for building the map when an operator guides the platform along each row of the orchard both in the forward and reverse directions to collect the images as well as the magnetometer and gyroscope readings. In the process of moving the platform around the garden using the Zed2i camera, the following information is collected: left and right rectified/unrectified images; depth data; IMU data; visual odometry: the position and orientation of the camera.
The collected data in the form of an SVO file was transmitted to the cloud storage, and the 3D depth map was generated on a local computer with an nVidia RTX3070 GPU (nVidia, Santa Clara, CA, USA). 3D point cloud generation is performed automatically using the ZED ROS2 wrapper package (https://www.stereolabs.com/docs/ros2/ (accessed on 24 August 2022)), launched under ROS2 Foxy Fitzroy (https://docs.ros.org/en/foxy/Installation/Ubuntu-Install-Debians.html (accessed on 6 September 2022)). The resulting 3D map is loaded onto the platform’s onboard computer and the operator’s tablet. The original application installed on a tablet transforms the 3D map into a 2D map, which is more convenient for the user in marking the route for the platform. The conversion of a 3D map to 2D is carried out using the package Rtabmap_ros (https://github.com/introlab/rtabmap_ros (accessed on 6 September 2022)). The pre-set route in the form of a coordinate array is transmitted to the onboard computer of the platform.
To monitor the plants, the platform is equipped with a hyperspectral sensor (3 in Figure 1) represented by an FX10 line scanner (SPECIM, Oulu, Finland) driven by a two-phase stepper motor, YK286EC156A1 (Yako, Shenzhen, China), controlled from the computer via an SSD2608H (Yako, Shenzhen, China) driver. The hyperspectrometer featured a 400–1000 nm spectral range and a 1024-pixel line sensor (the spectral band width was 2.6 nm); the shooting speed was 330 lines per second. The light source was a 50 W tungsten-halogen lampmounted on calipers for vertical movement. To obtain a 2D hyperspectral image, the camera moved linearly in the vertical direction; the lines recorded during the camera movement were programmatically joined into two-dimensional hyperspectral scans.

2.2. Robotic Platform on Board the Control System and the Sensors

The platform was controlled by a high-performance industrial computer, AIE100-903-FE-NX (Axiomtek, Taipei City, Taiwan), equipped with an NVIDIA Jetson Xavier NX module with a 6-core 64-bit processor and a 384-core NVIDIA® Volta™ graphics processor architecture. This setup was capable of operation outdoors in real orchards in the −30 °C to +50 °C temperature range.
The platform control system is shown in Figure 2. To navigate the platform, a Zed 2i stereo camera (IP66 protection class) was connected to the onboard computer via a USB Type-C interface. Control signals were transmitted to the electric motors of the wheels through low-current control and power relays; the digital control signals were relayed through an optocoupler and a system of transistor switches.
The platform was also equipped with a remote control (RC) based on the Heltec ESP32 (Heltec, Chengdu, China, https://heltec.org/?s=ESP32, accessed on 8 August 2022) microcontroller with LoRaSX1276 (Semtech, Camarillo, CA, USA) modules equipped with a joystick and buttons. The RC was used to guide the platform when building a 3D orchard map or during platform staging.
The main component of the navigation system of the robotic platform was a stereo camera Zed 2i, which was protected according to the IP66 class. It takes images with two RGB cameras with a 120° FoV; it also uses IMU sensors for positioning and spatial orientation. The stereo camera is mounted on a device to stabilize its position in the horizontal plane. The images were processed with an onboard industrial computer, AIE100-903-FL-NX (Axiomtek, Taipei City, Taiwan), with an NVidia Jetson Xavier NX GPU.
The software on the onboard computer processes the stereo images from the Zed 2i camera together with the readings of the magnetometer, gyroscope and barometer. It calculates the current coordinates ( x ,   y ,   z ) of the platform in the coordinate system O x 0 y 0 z 0 of the pre-built orchard map, as well as the rotation angles α ,   β and γ of the platform coordinate system relative to the axes z 0 , y 0 and x 0 , respectively.
Disregarding the difference in the elevations, the trajectory of the platform movement in the orchard can be represented as a broken linear function in the horizontal plane x 0 y 0 (Figure 3). Considering the general case when the platform is located at point A, the coordinate system of the platform x 1 y 1 z 1 is rotated relative to the axes z 0 , y 0 and x 0 at angles α A , β A and γ A , and the optical axis of the camera coincides with the axis x 1 . To proceed to point B, the platform must turn counterclockwise at an angle of φ A and then move in the direction of the vector ρ until the platform occupies a circle with a center in point B which is equal to the largest dimensions of the platform.
Provided that the stereo camera is stabilized in the horizontal plane and the z 0 and z 1 axes remain parallel, the following Equation (1) is valid for determining the rotation angle of the platform:
φ A = a t a n ( y B 1 , x B 1 )
The coordinates of point B in the coordinate system of the platform are determined from Equation (2):
ρ = M 1 ( R r )
where M is the rotation matrix of Equation (3):
M = ( cos α A sin α A 0 sin α A cos α A 0 0 0 1 )
It is at an arbitrary angle α A around the axis z 1 relative to the coordinate system O x 0 y 0 z 0 ; R , r —the coordinate vectors of the points B and A in the coordinate system O x 0 y 0 z 0 .
The platform navigation system works as follows. It takes a pre-built 3D map of the orchard as an input together with a travel route specified as a matrix of ( x ,   y ) coordinates of nodal points (A, B, …) comprising the route. The platform software continuously analyzes the data received from the stereo camera Zed 2i and its built-in 9DoF IMU sensors determining the current coordinates and orientation of the platform in the coordinate system of the 3D map. Based on these data and the coordinates of the nearest route point, the resulting rotation matrix M is calculated, along with the vector ρ of the coordinates of the nearest route point in the coordinate system of the platform and the angle of rotation of the platform φ . The platform turns in the given direction and moves, following the specified course, to the vicinity of the nearest route point. After this, the next closest point of the route is taken, and the procedures of orientation and movement are repeated until the end of the route.

3. Results and Discussion

3.1. Construction of 3D and 2D Maps of the Orchard

For successful platform navigation, a 3D map of the orchard has been built by the manual guiding of the platform along each row (Figure 4), recording, with the Zed 2i stereo camera, a depth map, as well as information about the camera orientation angles in space and camera coordinates relative to the initial waypoints. The soil of the rows on which the platform was moving was covered with weeds. The raw data collected in this way were transferred to the cloud and processed as described above (Figure 5). To process the raw data received from the Zed2i camera, we used the ZED ROS2 wrapper (https://www.stereolabs.com/docs/ros2/ (accessed on 19 August 2021)), launched under ROS2 Foxy Fitzroy (https://docs.ros.org/en/foxy/Installation/Ubuntu-Install-Debians.html (accessed on 6 September 2022)) on a cloud computer running the Ubuntu operating system 20.04 (https://releases.ubuntu.com/ (accessed on 8 August 2022)). The ZED ROS2 package used allows us to receive the following data from the Zed2i camera: left and right rectified/unrectified images; depth data; colored 3D point cloud; IMU data; visual odometry: position and orientation of the camera. The resulting 3D map was uploaded, through a cloud storage, to an operator’s tablet for the creation of a route for the platform.
The resulting 3D map was transformed into a 2D map (Figure 6) suitable for specifying the starting and ending points of the route. To build a 2D map, a 3D binarization operation is performed by zeroing the z coordinates of the points above the specified threshold (0.1 m) and setting the z coordinates of the remaining points to unity, i.e., P x , y , z = { P x , y , 0 ,   i f   z > threshold ;   P x , y , 1 } . The resulting 2D map of the orchard depicts tree rows as obstacles (in black) and the spaces between them as passable roads (in white). The specified operation is performed automatically using the RTAB-Map (Real-Time Appearance-Based Mapping) package, detailed instructions for the use of which can be found at the following link: https://wiki.ros.org/rtabmap_ros/Tutorials/StereoOutdoorMapping (accessed on 24 August 2022). The resulting map is loaded onto a tablet computer, where the user can specify the finish point and the trajectory of movement.
Figure 6a shows the constructed 2D map of the orchard, and Figure 6b shows a fragment of the map on which the shortest trajectory of the platform movement from the starting point to the end point is marked with a red line, and the blue lines indicate possible directions for moving. The calculation of the shortest trajectory was carried out using the Probabilistic Roadmap (PRM) pathplanner of the Robotics System Toolbox software package. The PRM pathplanner constructs a roadmap in the free space of a given map by using randomly sampled nodes in the free space and connecting them with each other. The output of the PRM is an array of ( x ,   y ) coordinates of points comprising the path of platform movement.

3.2. Hyperspectral Monitoring of Fruit Condition

Figure 7a shows an image obtained as a result of the pixel-by-pixel subtraction of images obtained in the channels 666 nm and 782 nm (showing the greatest contrast between leaves and fruits) and normalized by the minimax algorithm [33,34,35]. Due to the fluctuation of the solar light intensity during image recording, e.g., in cloudy vs. sunny weather, the image can be either too dark or bright. In the example shown in Figure 7, the image is quite dark, so its histogram (Figure 8a) is shifted to the left (it lacks pixels with values above 60). The use of filters or grading transformations to stretch the histogram is difficult in this case since they require the manual adjustment of parameters such as the aperture or constants of grading depending on the level of illumination of the scene.
To solve this problem, adaptive histogram equalization was performed using the CLAHE (Contrast Limited Adaptive Histogram Equalization) method, which can be implemented without the intervention of the operator. The equalization was carried out after splitting the original image into blocks of 32 × 32 pixels. The result is shown in Figure 7b, and the corresponding histogram is shown in Figure 8b. The presence of peaks at brightness levels of 60, 140 and 190 corresponds to three objects: background, foliage and fruits in the image.
The target region of interest encompasses fruits (the foreground objects). If the scene is uniformly illuminated, these objects are easy to pick by performing a global thresholding operation with a manually selected threshold. However, in a real-life orchard under fluctuating solar light, the threshold value should be individually selected for each image; hence, an algorithm for the automatic selection of the foreground area is required. The technique of detecting near-field objects was tested at the landfill under conditions close to real ones. Tests have shown that for the sort “Golden”, the proposed approach allows for a detection accuracy of at least 95%. At the same time, taking into account the limited field of view of the SPECIM FX10 camera and the need for the 2D reconstruction of the image, it is advisable to use a multispectral camera or an RGB camera with optical filters at 666 and 782 nm to monitor near-field objects.
Such an algorithm includes some operations with constant parameters independent of illumination intensity. First, the image is broken into the tiles of 505 × 505 pixels. Then, adaptive mean thresholding is carried out for each tile, and the threshold value is automatically calculated as the arithmetic mean of the values of the pixels comprising the corresponding tile. The resulting image contained a lot of noise (Figure 9b), which was suppressed by applying the operation of erosion followed by dilation (in three iterations, by the convolution of the image obtained at the previous step with a kernel of 9 × 9 pixels, Figure 9c). After this operation, the images were still noisy, so the Distance transform was applied, yielding binary images (Figure 9d) with pixel values representing the distance to the nearest pixel of the background. The brightest pixels in the resulting image corresponded to the central part of the foreground objects. To isolate the entire object around the central (Figure 9e), the threshold transformation and dilate operation were consistently applied. The threshold was set to the maximum of 0.6·PD_t, where PD_t is the pixel value of the Distance transform image, and the expansion was performed in 20 iterations by convolving the binarized image with a 15 × 15 pixel kernel. Finally, after bitwise multiplication of the resulting image by the original image (Figure 9a), an image of the foreground area with apples has been obtained (Figure 9f).
After the adaptive threshold transformation for each image tile, the foreground object mask is obtained (Figure 10). Bitwise multiplication of the mask and the image of the scene allows for the selection of the area occupied by the image of fruits in any spectral channel.

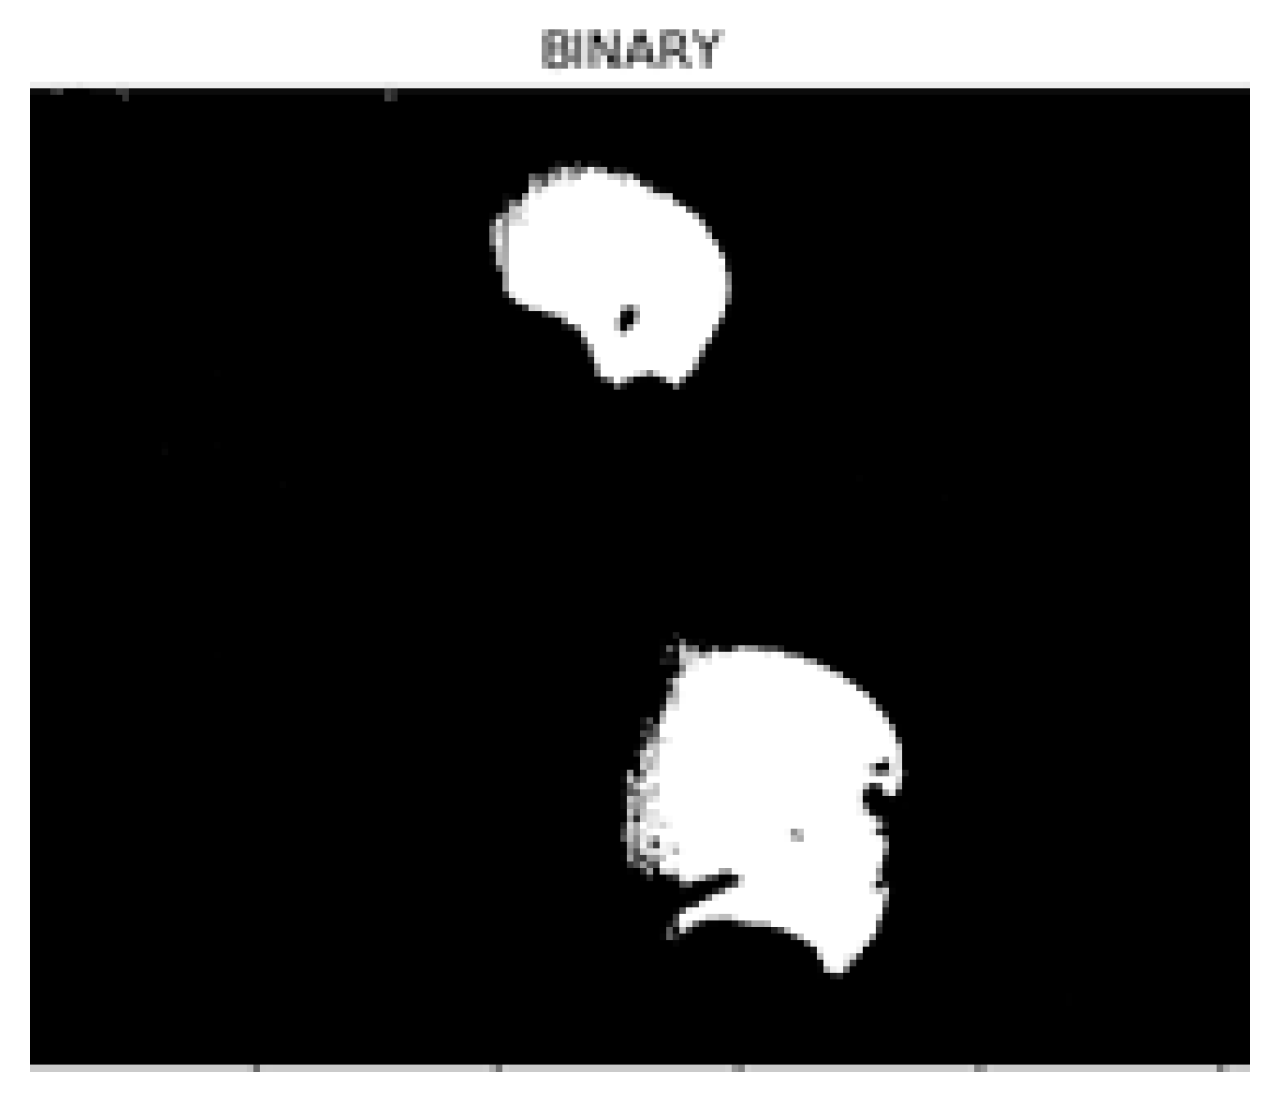
3.3. Detection of Apple Damages in Hyperspectral Images

The area of the apple image was further analyzed for the possibility of the classification into the following groups: healthy apple (class 0), rotten (class 1), Jonathan spotting (class 2), insect damage (class 3) and scab (class 4). Apples of the following sorts were studied: “Imrus”, “Orel striped” and “Spartan”. These apples were obtained from experimental gardens of the Federal Scientific Center named after I.V. Michurin (Michurinsk, Tambov region, Russia). For these classes of apple surfaces, using the Specim FX10 camera, more than 52,000 spectrograms of optical radiation reflected from their surface were obtained. At the same time, a halogen lamp, R7S Haloline Eco 64690 Osram, 80W2900 K (China), was used as a backlight. The camera sensor signals were normalized to the maximum value and then averaged for each class of apple plant tissue. It was found that, at certain wavelengths, the listed classes of plant tissues have common patterns of radiation reflection (Figure 11a–e), which makes it possible to use multidimensional discriminant analysis to classify apples by defects.
Discriminant functions were used in the classification, containing vegetation indices as predictors and taking into account the patterns of radiation reflection at wavelengths of 500, 510, 550, 680, 700, 750, 905 and 962 nm. The values of the coefficients of discriminant functions were found in the process of learning from more than 1000 reflection spectra from sections of plant tissues of apples of each class of the above sorts. In addition, 150 spectrograms were obtained for each apple sort for all classes of plant tissue, which were later used to independently verify the workability of the proposed classification method.
As a result of the application package SPSS Statistics, the following classification functions were obtained:
F i = k 1 ( 1 R I 510 1 R I 700 ) + k 2 ( 1 R I 550 1 R I 700 ) + k 3 ( R I 680 R I 500 ) R I 750 + + k 4 ( R I 750 R I 680 ) ( R I 750 + R I 680 ) + k 5 R I 905 R I 962 + k 6 ( R I 680 R I 640 ) R I 680 + k 7
where i is the class of the plant tissue of apples, and RIλ is the intensity of reflected radiation with a wavelength λ from the surface of the apple. Table 2 shows, as an example, the values of the coefficients of the classification function for apples of the IMRUS variety obtained for a training sample of spectrograms.
Table 2 shows examples of the values of the coefficients of the classification function for apples of the IMRUS sort obtained for a training sample of spectrograms. At the same time, the value of the Wilkes lambda criterion is less than 0.007, which shows a significant difference in the average values of discriminant functions in the studied classes.
The prediction results from the control sample of the spectrograms show that the classification accuracy is not worse than 80%. The prediction accuracy of healthy plant tissue without defects is no worse than 98%. The class of the surface of the plant tissue of apples is assumed to be equal to the index of the classification function, which has the maximum value, with the values of predictors obtained experimentally

4. Conclusions

Here, we report on a complex solution for the proximal sensing of apple fruits and trees in an industrial orchard. The developed solution consisted of a robotic platform with an electric drive and an algorithm for its combined (visual and inertial) navigation based on the input from diverse sensors including a stereo camera. The detection of fruit damages by phytopathogens was accomplished by the use of a hyperspectral camera; special attention was paid to the pre-selection of the region of interest containing images of fruits. Overall, this solution would find use in monitoring and decision support systems in precision horticulture. Its potential applications include the timely scheduling of the agrotechnical and protective measures to ensure the high quality of the fruit crop.

Author Contributions

W.Z., P.B., D.M. and I.U.: conceptualization, software, data curation, writing—original draft preparation, writing—review and editing, supervision, funding acquisition; P.B., Y.K., A.D., A.E. and A.Z.: validation, formal analysis, investigation, visualization, writing—original draft preparation. All authors have read and agreed to the published version of the manuscript.

Funding

This research was funded by the National Natural Science Foundation of Surface Project of China, grant number 51774289 and the National Natural Science Foundation of Surface Project of China, grant number 52074291.

Data Availability Statement

Not applicable.

Acknowledgments

https://www.tmuellersim.com/publications (accessed on 17 August 2021) (Stereolabs, San Francisco, CA, USA, https://www.stereolabs.com/zed-2i/ (accessed on 17 August 2021)); ROS2 Foxy Fitzroy (https://docs.ros.org/en/foxy/Installation/Ubuntu-Install-Debians.html (accessed on 6 September 2022)); Rtabmap_ros (https://github.com/introlab/rtabmap_ros (accessed on 6 September 2022)); RTAB-Map (Real-Time Appearance-Based Mapping, https://wiki.ros.org/rtabmap_ros/Tutorials/StereoOutdoorMapping (accessed on 19 August 2021)), Heltec ESP32 (https://heltec.org/?s=ESP32 (accessed on 8 August 2022)).

Conflicts of Interest

The authors declare no conflict of interest.

References

  1. Ismail, I.W.; Hudzari, R.M.; Saufi, K.M.; Fung, L.T. Computer-controlled system for autonomous tractor in agricultural application. J. Food Agric. Environ. 2012, 10, 350–356. [Google Scholar] [CrossRef]
  2. Jorgensen, R.; Sorensen, C.; Maagaard, J.; Havn, I. HortiBot: A System Design of a Robotic Tool Carrier for High-tech Plant Nursing. CIGR J. 2007, IX, 1–13. Available online: https://cigrjournal.org/index.php/Ejounral/article/view/937/931 (accessed on 17 November 2022).
  3. Keresztes, B.; Germain, C.; Da Costa, J.-P.; Grenier, G.; Beaulieu, X.D. Vineyard Vigilant & INNovative Ecological Rover (VVINNER): An autonomous robot for automated scoring of vineyards. In Proceedings of the International Conference of Agricultural Engineering, Zurich, Switzerland, 6–10 July 2014; Available online: http://www.geyseco.es/geystiona/adjs/comunicaciones/304/C04230001.pdf (accessed on 17 November 2022).
  4. Biber, P.; Weiss, U.; Dorna, M.; Albert, A. Navigation System of the Autonomous Agricultural Robot BoniRob. In Proceedings of the International Conference of Agricultural Engineering, Zurich, Switzerland, 6–10 July 2014; Volume 72. Available online: https://www.cs.cmu.edu/~mbergerm/agrobotics2012/01Biber.pdf (accessed on 17 November 2022).
  5. Utstumo, T.; Urdal, F.; Brevik, A.; Dørum, J.; Netland, J.; Overskeid, Ø.; Berge, T.W.; Gravdahl, J.T. Robotic in-row weed control in vegetables. Comput. Electron. Agric. 2018, 154, 36–45. [Google Scholar] [CrossRef]
  6. Ampatzidis, Y.; De Bellis, L.; Luvisi, A. iPathology: Robotic applications and management of plants and plant diseases. Sustainability 2017, 9, 1010. [Google Scholar] [CrossRef] [Green Version]
  7. Zhong, Y.; Gao, J.; Lei, Q.; Zhou, Y. A vision-based counting and recognition system for flying insects in intelligent agriculture. Sensors 2018, 18, 1489. [Google Scholar] [CrossRef] [Green Version]
  8. Qin, J.; Lu, R. Measurement of the optical properties of fruits and vegetables using spatially resolved hyperspectral diffuse reflectance imaging technique. Postharvest Biol. Technol. 2008, 49, 355–365. [Google Scholar] [CrossRef]
  9. Safronov, I.S.; Neplueva, A.A.; Ushakov, I.V. Mechanical Properties of Laser Treated Thin Sample of an Amorphous-Nanocrystalline Metallic Alloy Depending on the Initial Annealing Temperature. Defect Diffus. Forum 2021, 410, 489–494. [Google Scholar] [CrossRef]
  10. Ushakov, I.V.; Safronov, I.S. Directed changing properties of amorphous and nanostructured metal alloys with help of nanosecond laser impulses. CIS Iron Steel Rev. 2021, 22, 77–81. [Google Scholar] [CrossRef]
  11. Safronov, I.S.; Ushakov, I.V.; Minaev, V.I. Influence of Environment at Laser Processing on Microhardness of Amorphous-Nanocrystalline Metal Alloy. Mater. Sci. Forum 2022, 1052, 50–55. [Google Scholar] [CrossRef]
  12. Samat, A.; Li, E.; Liu, S.; Miao, Z.; Wang, W. Ensemble of ERDTs for Spectral–Spatial Classification of Hyperspectral Images Using MRS Object-Guided Morphological Profiles. J. Imaging 2020, 6, 114. [Google Scholar] [CrossRef]
  13. Liu, J.; Wu, Z.; Xiao, Z.; Yang, J. Classification of Hyperspectral Images Using Kernel Fully Constrained Least Squares. ISPRS Int. J. Geo-Inf. 2017, 6, 344. [Google Scholar] [CrossRef]
  14. Tian, X.; Li, J.; Wang, Q.; Fan, S.; Huang, W. A bi-layer model for nondestructive prediction of soluble solids content in apple based on reflectance spectra and peel pigments. Food Chem. 2018, 239, 1055–1063. [Google Scholar] [CrossRef] [PubMed]
  15. Lou, Y.; Sun, R.; Cheng, J.; Qiao, G.; Wang, J. Physical-Layer Security for UAV-Assisted Air-to-Underwater Communication Systems with Fixed-Gain Amplify-and-Forward Relaying. Drones 2022, 6, 341. [Google Scholar] [CrossRef]
  16. Hu, W.; Sun, D.W.; Blasco, J. Rapid monitoring 1-MCP-induced modulation of sugars accumulation in ripening Hayward kiwifruit by Vis/NIR hyperspectral imaging. Postharvest Biol. Technol. 2017, 125, 159–168. [Google Scholar] [CrossRef]
  17. Van Beers, R.; Aernouts, B.; Watté, R.; Schenk, B.; Nicolaï, A.; Saeys, W. Effect of maturation on the bulk optical properties of apple skin and cortex in the 500–1850 nm wavelength range. J. Food Eng. 2017, 214, 79–89. [Google Scholar] [CrossRef]
  18. ElMasry, G.; Wang, N.; Vigneault, C. Detecting chilling injury in Red Delicious apple using hyperspectral imaging and neural networks. Postharvest Biol. Technol. 2009, 52, 1–8. [Google Scholar] [CrossRef]
  19. Teena, M.A.; Manickavasagan, A.; Ravikanth, L.; Jayas, D.S. Near infrared (NIR) hyperspectral imaging to classify fungal infected date fruits. J. Stored Prod. Res. 2014, 59, 306–313. [Google Scholar] [CrossRef]
  20. Xie, C.; Yang, C.; He, Y. Hyperspectral imaging for classification of healthy and gray mold diseased tomato leaves with different infection severities. Comput. Electron. Agric. 2017, 135, 154–162. [Google Scholar] [CrossRef]
  21. Ou, W.; Wu, T.; Li, J.; Xu, J.; Li, B. RREV: A Robust and Reliable End-to-End Visual Navigation. Drones 2022, 6, 344. [Google Scholar] [CrossRef]
  22. Sun, M.; Zhang, D.; Liu, L.; Wang, Z. How to predict the sugariness and hardness of melons: A near-infrared hyperspectral imaging method. J. Chem. Eng. 2017, 218, 413–421. [Google Scholar] [CrossRef]
  23. Baranowski, P.; Mazurek, W.; Pastuszka-Woźniak, J. Supervised classification of bruised apples with respect to the time after bruising on the basis of hyperspectral imaging data. Postharvest Biol. Technol. 2013, 86, 443–455. [Google Scholar] [CrossRef]
  24. Munera, S.; Amigo, J.M.; Blasco, J.; Cubero, S.; Talens, P.; Aleixos, N. Ripeness monitoring of two cultivars of nectarine using VIS-NIR hyperspectral reflectance imaging. J. Food Eng. 2017, 214, 29–39. [Google Scholar] [CrossRef]
  25. Li, X.; Liu, Y.; Jiang, X.; Wang, G. Supervised classification of slightly bruised peaches with respect to the time after bruising by using hyperspectral imaging technology. Infrared Phys. Technol. 2021, 113, 103557. [Google Scholar] [CrossRef]
  26. Pershina, J.S.; Kazdorf, S.Y.; Lopota, A.V. Methods of Mobile Robot Visual Navigation and Environment Mapping. Optoelectron. Instrum. Data Process. 2019, 55, 181–188. [Google Scholar] [CrossRef]
  27. Hayajneh, M.; Al Mahasneh, A. Guidance, Navigation and Control System for Multi-Robot Network in Monitoring and Inspection Operations. Drones 2022, 6, 332. [Google Scholar] [CrossRef]
  28. Kulik, A.; Dergachov, K.; Radomskyi, O. Binocular technical vision for wheeled robot controlling. Transp. Probl. 2015, 10, 55–62. [Google Scholar] [CrossRef]
  29. Chaumette, F.; Hutchinson, S.; Corke, P. Visual Servoing; Springer Handbook of Robotics; Jorge Pomares, Department of Physics, Systems Engineering and Signal Theory; University of Alicante: Alicante, Spain, 2016; ISSN 2079-9292. [Google Scholar]
  30. Pomares, J. Visual Servoing in Robotics; Systems Engineering and Signal Theory; University of Alicante: Alicante, Spain, 2021; pp. 1–141. [Google Scholar]
  31. Zhang, Z.; Li, P.; Zhao, S.; Lv, Z.; Du, F.; An, Y. An adaptive vision navigation algorithm in agricultural IoT system for smart agricultural robots. Comput. Mater. Contin. 2021, 66, 1043–1056. [Google Scholar] [CrossRef]
  32. Li, J.; Yin, J.; Deng, L. A robot vision navigation method using deep learning in edge computing environment. EURASIP J. Adv. Signal Process. 2021, 2021, 22. [Google Scholar] [CrossRef]
  33. Rovira-Mas, F.; Saiz-Rubio, V.; Cuenca-Cuenca, A. Augmented Perception for Agricultural Robots Navigation. IEEE Sens. J. 2021, 21, 11712–11727. [Google Scholar] [CrossRef]
  34. Vilkas, E.I. Axiomatic Definition of the Value of a Matrix Game. Theory Probab. Its Appl. 1963, 8, 324–327. [Google Scholar] [CrossRef]
  35. Norde, H.; Voorneveld, M. Axiomatizations of the Value of Matrix Games; CentER Discussion Paper; Tilburg University: Tilburg, The Netherlands, 2003; Volume 17, pp. 1–9. ISSN 0924-7815. [Google Scholar]
Figure 1. System for the proximal sensing of apple orchards.
Drones 07 00033 g001
Figure 2. Platform control scheme.
Drones 07 00033 g002
Figure 3. Coordinate system of the platform and 3D coordinates of the orchard.
Drones 07 00033 g003
Figure 4. The orchard fragment image, the depth map and the map of the plot and its surroundings.
Drones 07 00033 g004
Figure 5. Transforming the 3D map to a 2D map. This image is generated by the TAB-Map program.
Drones 07 00033 g005
Figure 6. 2D map of the orchard: (a) original image; (b) a fragment of the image (shown in a) with a larger magnification.
Drones 07 00033 g006
Figure 7. Fragment of the image of the apple tree with fruits: (a)—original image, (b)—image converted using the CLAHE method.
Drones 07 00033 g007
Figure 8. Histograms of (a) the original image shown in Figure 7 and (b) its CLAHE transform.
Drones 07 00033 g008
Figure 9. Stages of foreground object selection on the image: (a)—original image; (b)—this image was transformed using the adaptive mean thresholding method; (c)—this image was obtained using operation of erosion followed by dilation; (d)—this image was obtained using the Distance transform method; (e)—this image was obtained using the threshold transformation and delete operation; (f)—the image of the foreground area with apples has been obtained.
Drones 07 00033 g009
Figure 10. Binary mask of image regions containing fruits.
Drones 07 00033 g010
Figure 11. Spectrogram for apples: (a) an apple of class “0”; (b) an apple of class “1”; (c) an apple of class “2”; (d) an apple of class “3”; (e) an apple of class “4”.
Drones 07 00033 g011
Table 1. Robotic solutions for the automated monitoring and picking of fruits.
Fruit CropsManufacturerNavigationCountry
ApplesAbundant RoboticsLidarUSA
FF Robotics-Israel
StrawberriesDogtooth TechnologiesGPSUK
Rubion OctinioIR TagsBelgium
Thorvald IILidarNorway
Agrobot SW 6010-Spain
Bell pepperSweeperVisualNetherlands
AsparagusCerescon-Netherlands
TomatoesMetomotionVisualIsrael
Root-AIVisualUSA
OrangesEnergid-USA
CherriesCherry-harvesting robotVisualJapan
AgribotGPSSpain
CucumbersVanHenten-Netherlands
EggplantHayashiVisualJapan
Asparagus-harvesting robotVisualJapan
WatermelonsUmedaVisualJapan
MushroomsAgaricusbisporusVisualUK
Table 2. Examples of the values of the coefficients of the classification.
SortClassk1k2k3k4k5k6k7
IMRUS0−90,772.272,274.5432.2224.9113.8−141.8−198.1
1−24,073.233,071.5226.1139.6116.9−39.36−143.5
2−7872.6815,772.93229.6795.6132.42−61.36−171.70
3−18,502.019,299.0231.7147.897.2−28.3−113.0
4−27,195.121,123.5290.0214.5103.7−18.6−145.4
Disclaimer/Publisher’s Note: The statements, opinions and data contained in all publications are solely those of the individual author(s) and contributor(s) and not of MDPI and/or the editor(s). MDPI and/or the editor(s) disclaim responsibility for any injury to people or property resulting from any ideas, methods, instructions or products referred to in the content.

