1. Introduction
Photogrammetry is a surveying methodology broadly used in many fields from geology to environmental and structural engineering to mechanics and biology. In archaeology, photogrammetry is mainly used for the investigation and analysis of large sites and the documentation of archaeological remains.
Recent advances in computer vision algorithms, together with their implementation in the traditional photogrammetric processing of images, result in a new photogrammetric methodology called structure from motion (SfM) photogrammetry [
1]. SfM photogrammetry enables the final user to use any type of camera, from reflex to action cameras, without being bound by special rigor, to obtain high-quality 3D reconstructions and images. An important feature of SfM photogrammetry is the acquisition of a highly redundant dataset of images and ground measurements [
2]. Each reconstructed point needs to be detected in at least 10 images, with different viewing angles, directions, and scale [
3]. The measurement of ground reference data is also necessary to avoid distortions during photogrammetric reconstruction, to generate georeferenced 3D models [
4]. Cameras handled by an operator, UAV (unmanned aerial vehicle) system, and poles can be used according to the purposes of the survey. Ground control measurements can be acquired by measuring the 3D coordinates of points (natural points or artificial targets) or by relying on objects with known dimensions (e.g., roads, etc.). Several software tools were developed to process field data and obtain 3D models, digital surface models (DSM), and orthophotos, allowing each single user to obtain a 3D reconstruction—even users who have poor knowledge of photogrammetric theories.
In landscape archaeology, 3D reconstruction methods based on UAV photogrammetry are well suited because even large areas can be analyzed at fine resolution. This approach could help for a better and more exhaustive understanding of settlements and urban/architectural patterns [
5,
6]. Photogrammetry enables researchers to obtain 3D products with metric and photorealistic content that is useful for archaeological applications both for site investigations [
7] and the study of larger areas [
8,
9]. This method allows one to increase, in a very sensible way, the productivity on the field, compared with traditional methods used in archaeology; moreover, in many cases, the use of drones combined with terrestrial photogrammetry and laser scanning [
10,
11] allow researchers to perform topography even in difficult-to-reach sites [
12]. Digitization makes it possible to share more information within the scientific community. Basic instrumentations [
8], untrained staff [
7], unplanned flights, and participatory approaches [
5] can be successfully used.
This essay presents the results of a prospecting and surveying study carried out in Tacuil, an archaeological complex composed of two pukaras (fortified hilltop sites), and a lower hamlet in the area of Molinos (Salta, Argentina). After sharing some basic rules for obtaining 3D photogrammetric products that are suited for site and landscape archaeological investigations and mapping, the authors aimed to demonstrate that this approach is particularly useful in the case of scattered, difficult-to-reach sites, located in mountainous environments. Two photogrammetric approaches will be prospected and analyzed in this paper: ground and UAV photogrammetry. These approaches can be easily integrated as they are effective for the survey of sites differing in terms of extension and complexity.
Given the emphasized strategic position of these sites, the issue of their intervisibility/invisibility is particularly important. The focus of our analysis is the assessment of the objective visibility of Tacuil from a quantitative point of view, as well as the varying nature and distribution of architectures across its three sectors. This analysis, performed thanks to the use of a drone, along with other assessments, may widen our understanding of the hilltop sites of the Southern Andean area. Indeed, in the case of Tacuil and other similar types of sites, the theme of the visibility/invisibility of the archaeological features has deep implications for an exhaustive interpretation of the functionality of the architectural remains of this type of settlement.
To date, only a limited number of pukara maps have been published, precisely for the reasons of difficult access explained above. Most of these maps date back to periods in which these techniques did not exist yet: this paper also aims to contribute to sharing basic topographic data on late hilltop sites of Northwestern Argentina.
1.1. The Pukaras
The definition of
pukara encompasses very peculiar settlement systems that distinguish the late period of the Southern Andean area [
13,
14,
15,
16,
17,
18,
19]. According to the historical definition given by [
13] (p. 85), a
pukara is a settlement in an elevated position. protected and difficult to reach, from which one can visually control the surroundings. In Argentina, this type of settlement was widespread in a large area, stretching from Jujuy to La Rioja.
The defensive and strategic features of
pukaras were emphasized in the past (in particular in the area of Titicaca, see [
20]), thus leading contemporaries to overestimate their nature as undefeatable strongholds. In addition, modern approaches consider that their hilltop position might have been chosen to better control resources or as symbolic locations [
21,
22].
1.2. Study Area: Geological Framework and Archaeological Context
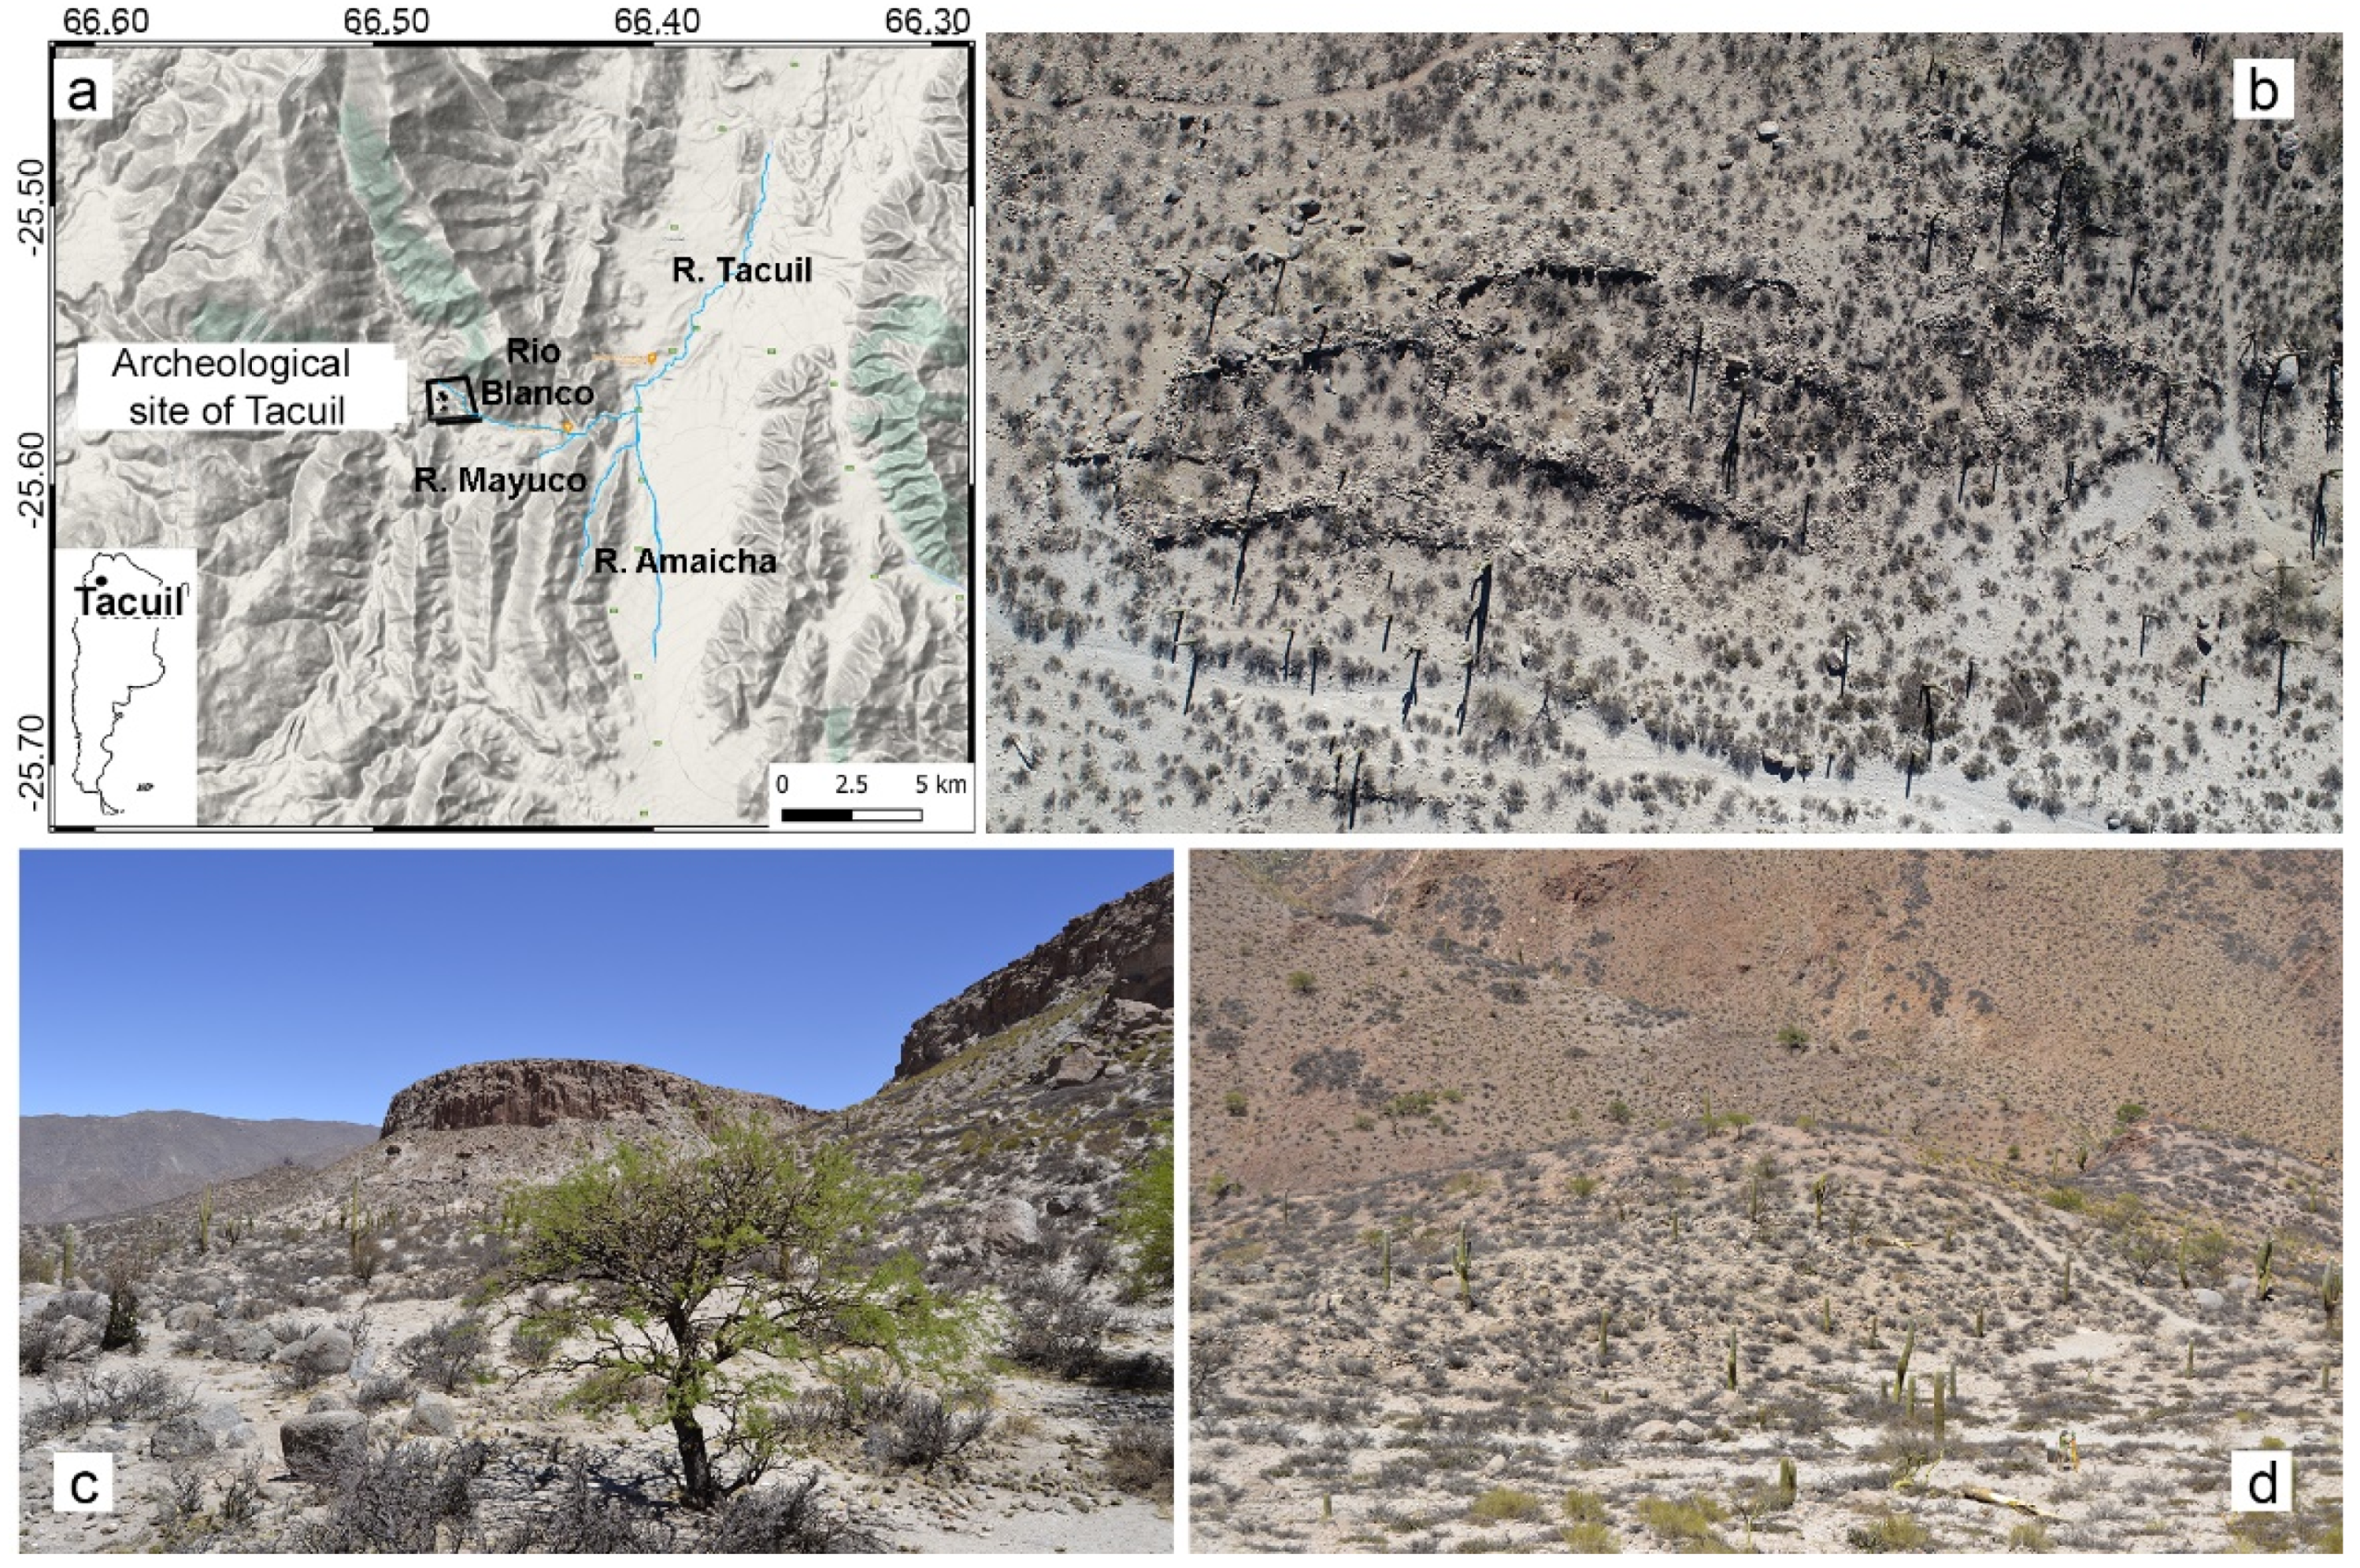
The Tacuil Pukara complex is located at 2667 mt (8750 ft) above sea level in an Andean secondary valley (Tacuil Valley, Salta Province, Argentina), in the middle of the Cachaquí river basin (
Figure 1a). Like other
pukaras in this area (for instance, Luracatao and Gualfin), it is in a strategic transit area between the
puna (plateau) and the important natural communication route of the Calchaquí river. The site is surrounded by ample stretches of agricultural land [
23,
24,
25]. Specifically, the site is located in an area delimited by the confluence of the Rio Blanco and La Hoyada rivers to the north and the Rio Blanco and Mayuco rivers to the south. The climate is dry and warm; the rain fall is between 300 and 350 mm (12–14 in) per year, and precipitation is mainly concentrated in the summer [
26].
Figure 1a shows the geographical settings of the area, with the area of the archeological site of Tacuil indicated, where UAV-based photogrammetry has been performed.
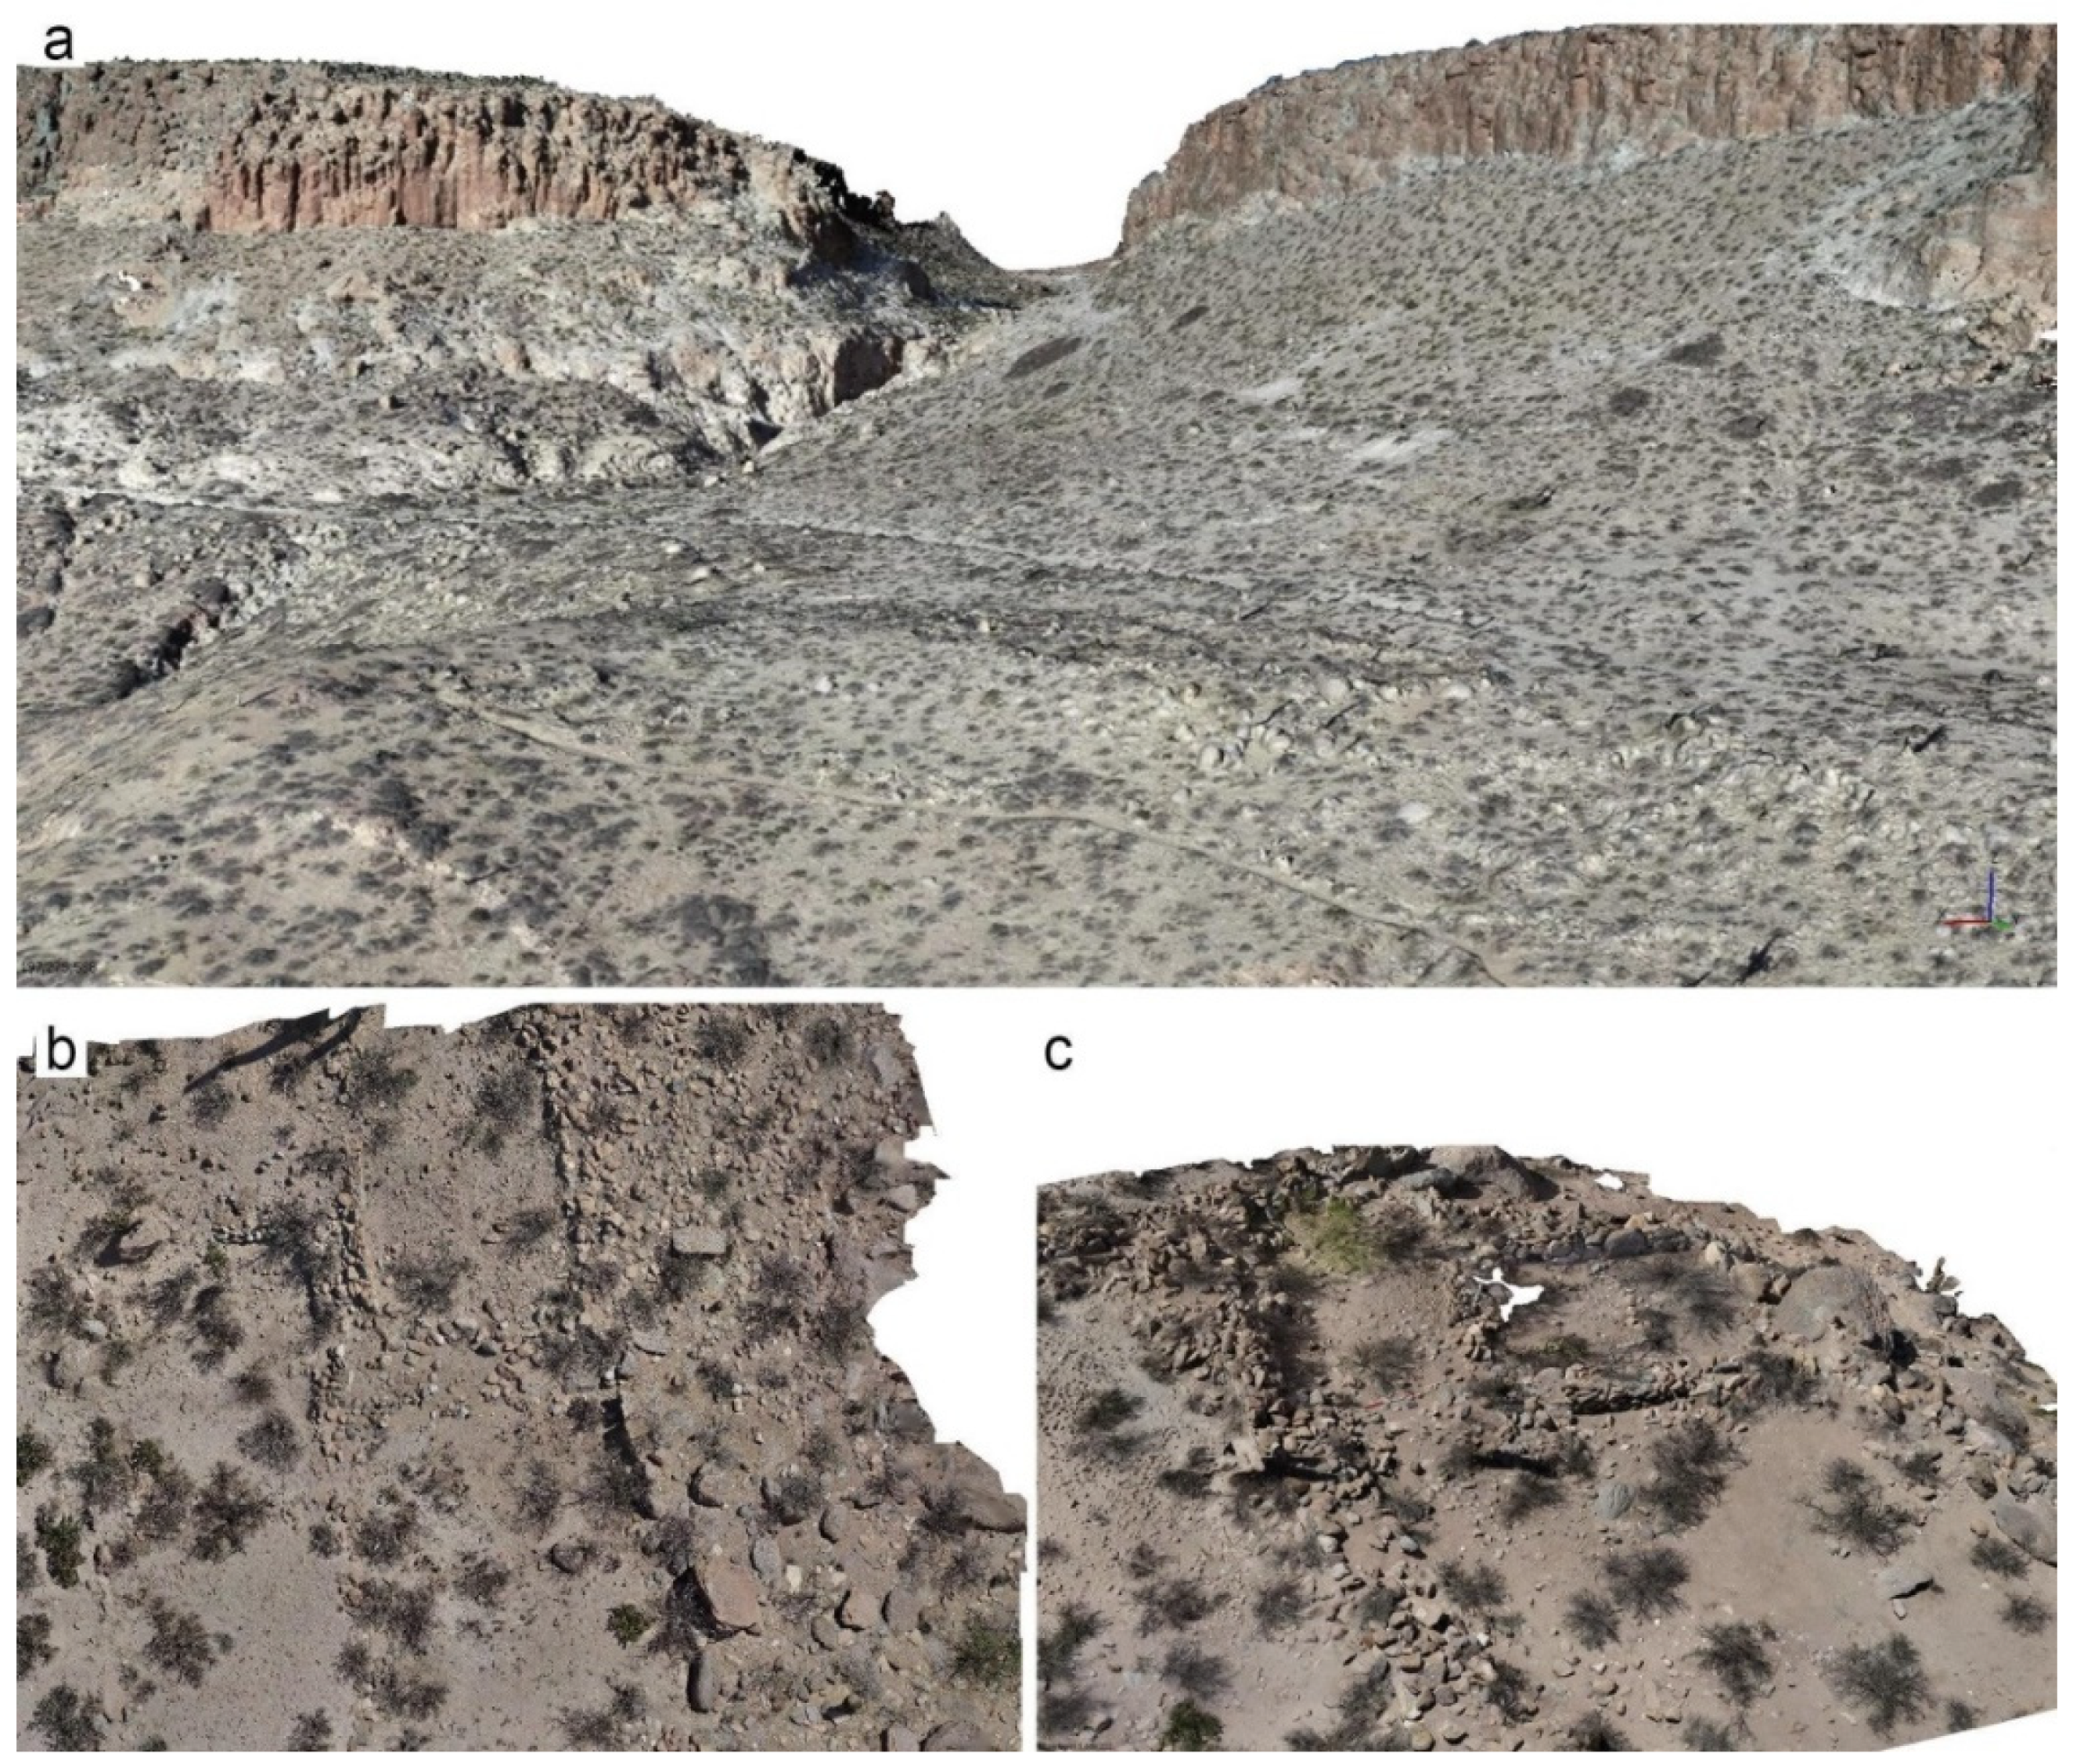
Figure 1b illustrates a top view of the lower portion of the site with low and sparse spontaneous vegetation, and
Figure 1b,c represent panoramic views and main topographic characteristics of the area.
The archaeological complex, known since the colonial era and recently studied by Veronica Williams and her team [
21,
27,
28], consists of three main areas built and used roughly in the same period (XIII–XIV c.). Such areas are reported on
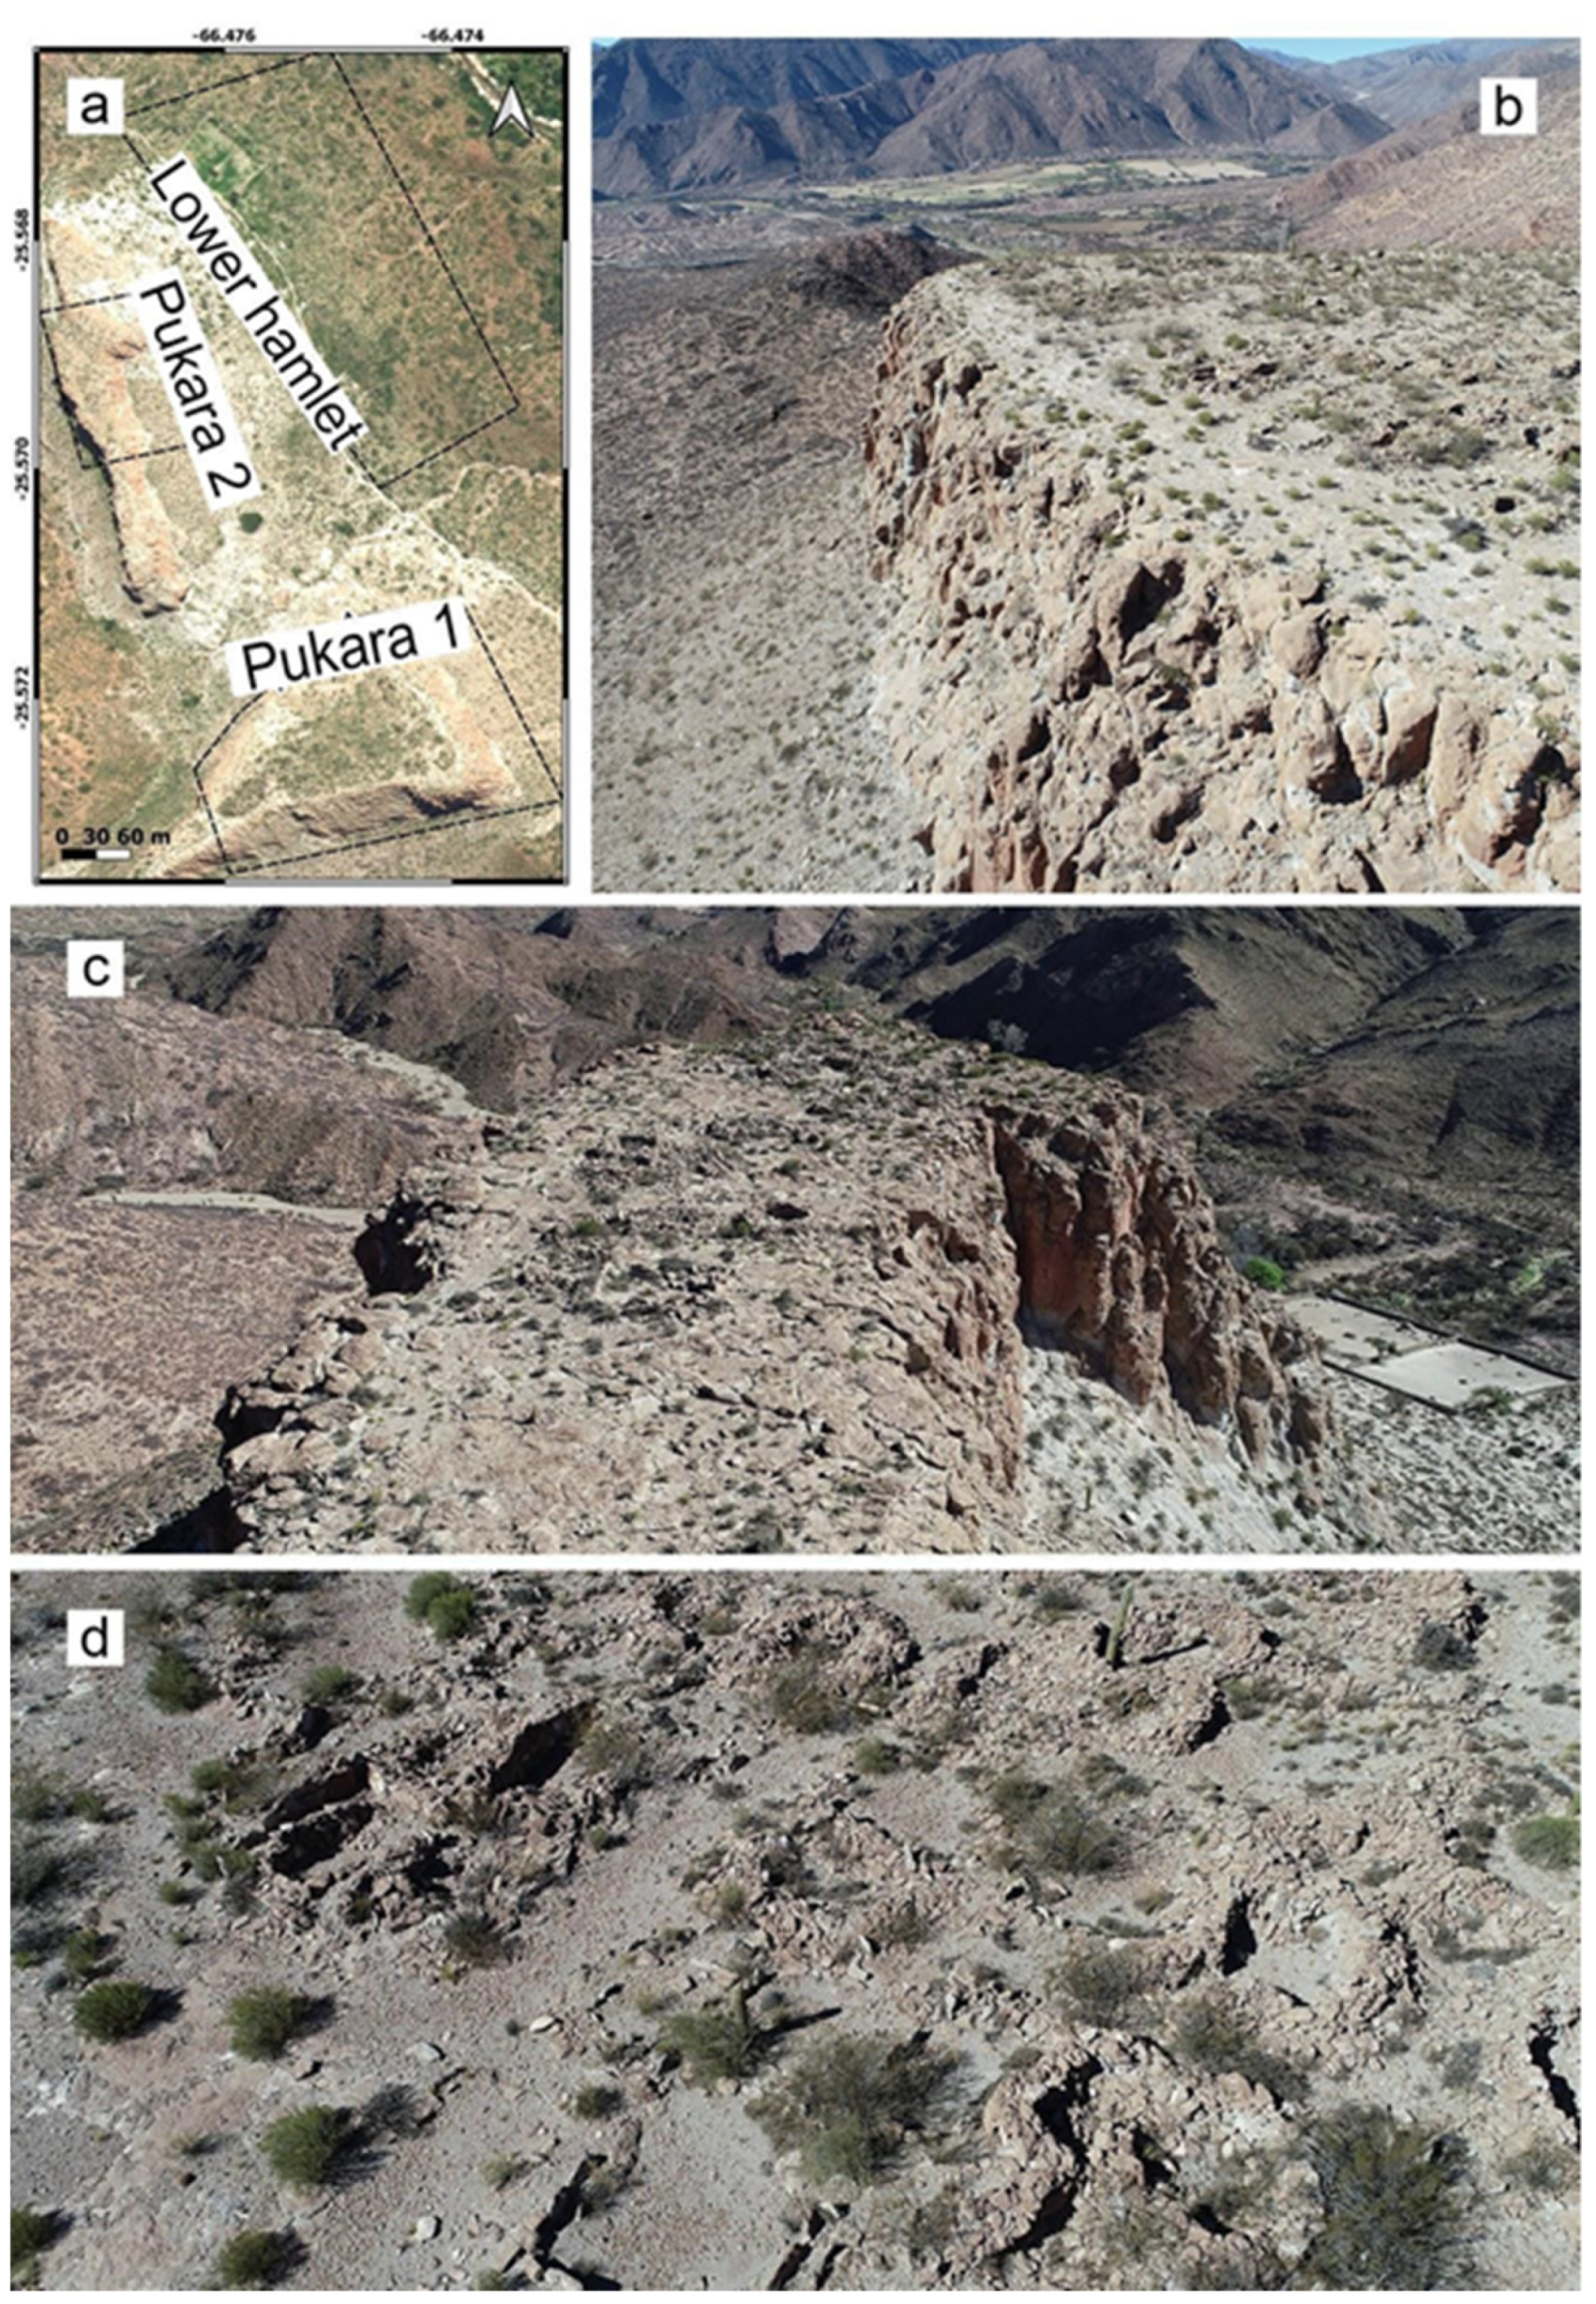
Figure 2a by the names Pukara 1 (2820 m), Pukara 2 (2838 m), and Lower Hamlet (2740 m). In the present day, Pukara 2 is unreachable without mountain-climbing equipment for safety (see
Figure 2b,c).
Figure 2d shows the archaeological structures discovered by the UAV survey on Pukara 1, where ground surveys were not feasible.
The upper sites (
pukaras) were located on natural bulwarks that guarantee visual control over the entire area beneath. The hills hosting the two
pukaras are dacitic rocks with steep slopes. This type of geoform is composed of dacitic ignimbrite, a volcanic rock present in the area and referable to Complejo Volcánico Cerro Galán, which dates back to Paleogene and Neogene [
29]. In all the areas domestic activities were recorded, indicating that Tacuil was a polyfunctional settlement and that the fortresses were not exclusively strongholds or refuges. It also pointed out that, as already observed by other authors,
pukaras often have a complex topography that could not be fully understood without taking into account all their parts [
5]. Therefore, the importance of an accurate mapping of all archaeological features of their surrounding territory is clear.
2. Materials and Methods
2.1. UAV Photogrammetry
A Phantom 4 Pro UAV System and its integrated camera were used; the camera has a focal length of 8.8 mm and a resolution of 4864 × 3648 pixels. A total of 3 flights were carried out and 850 images were acquired in order to cover an area of about 0.6 km
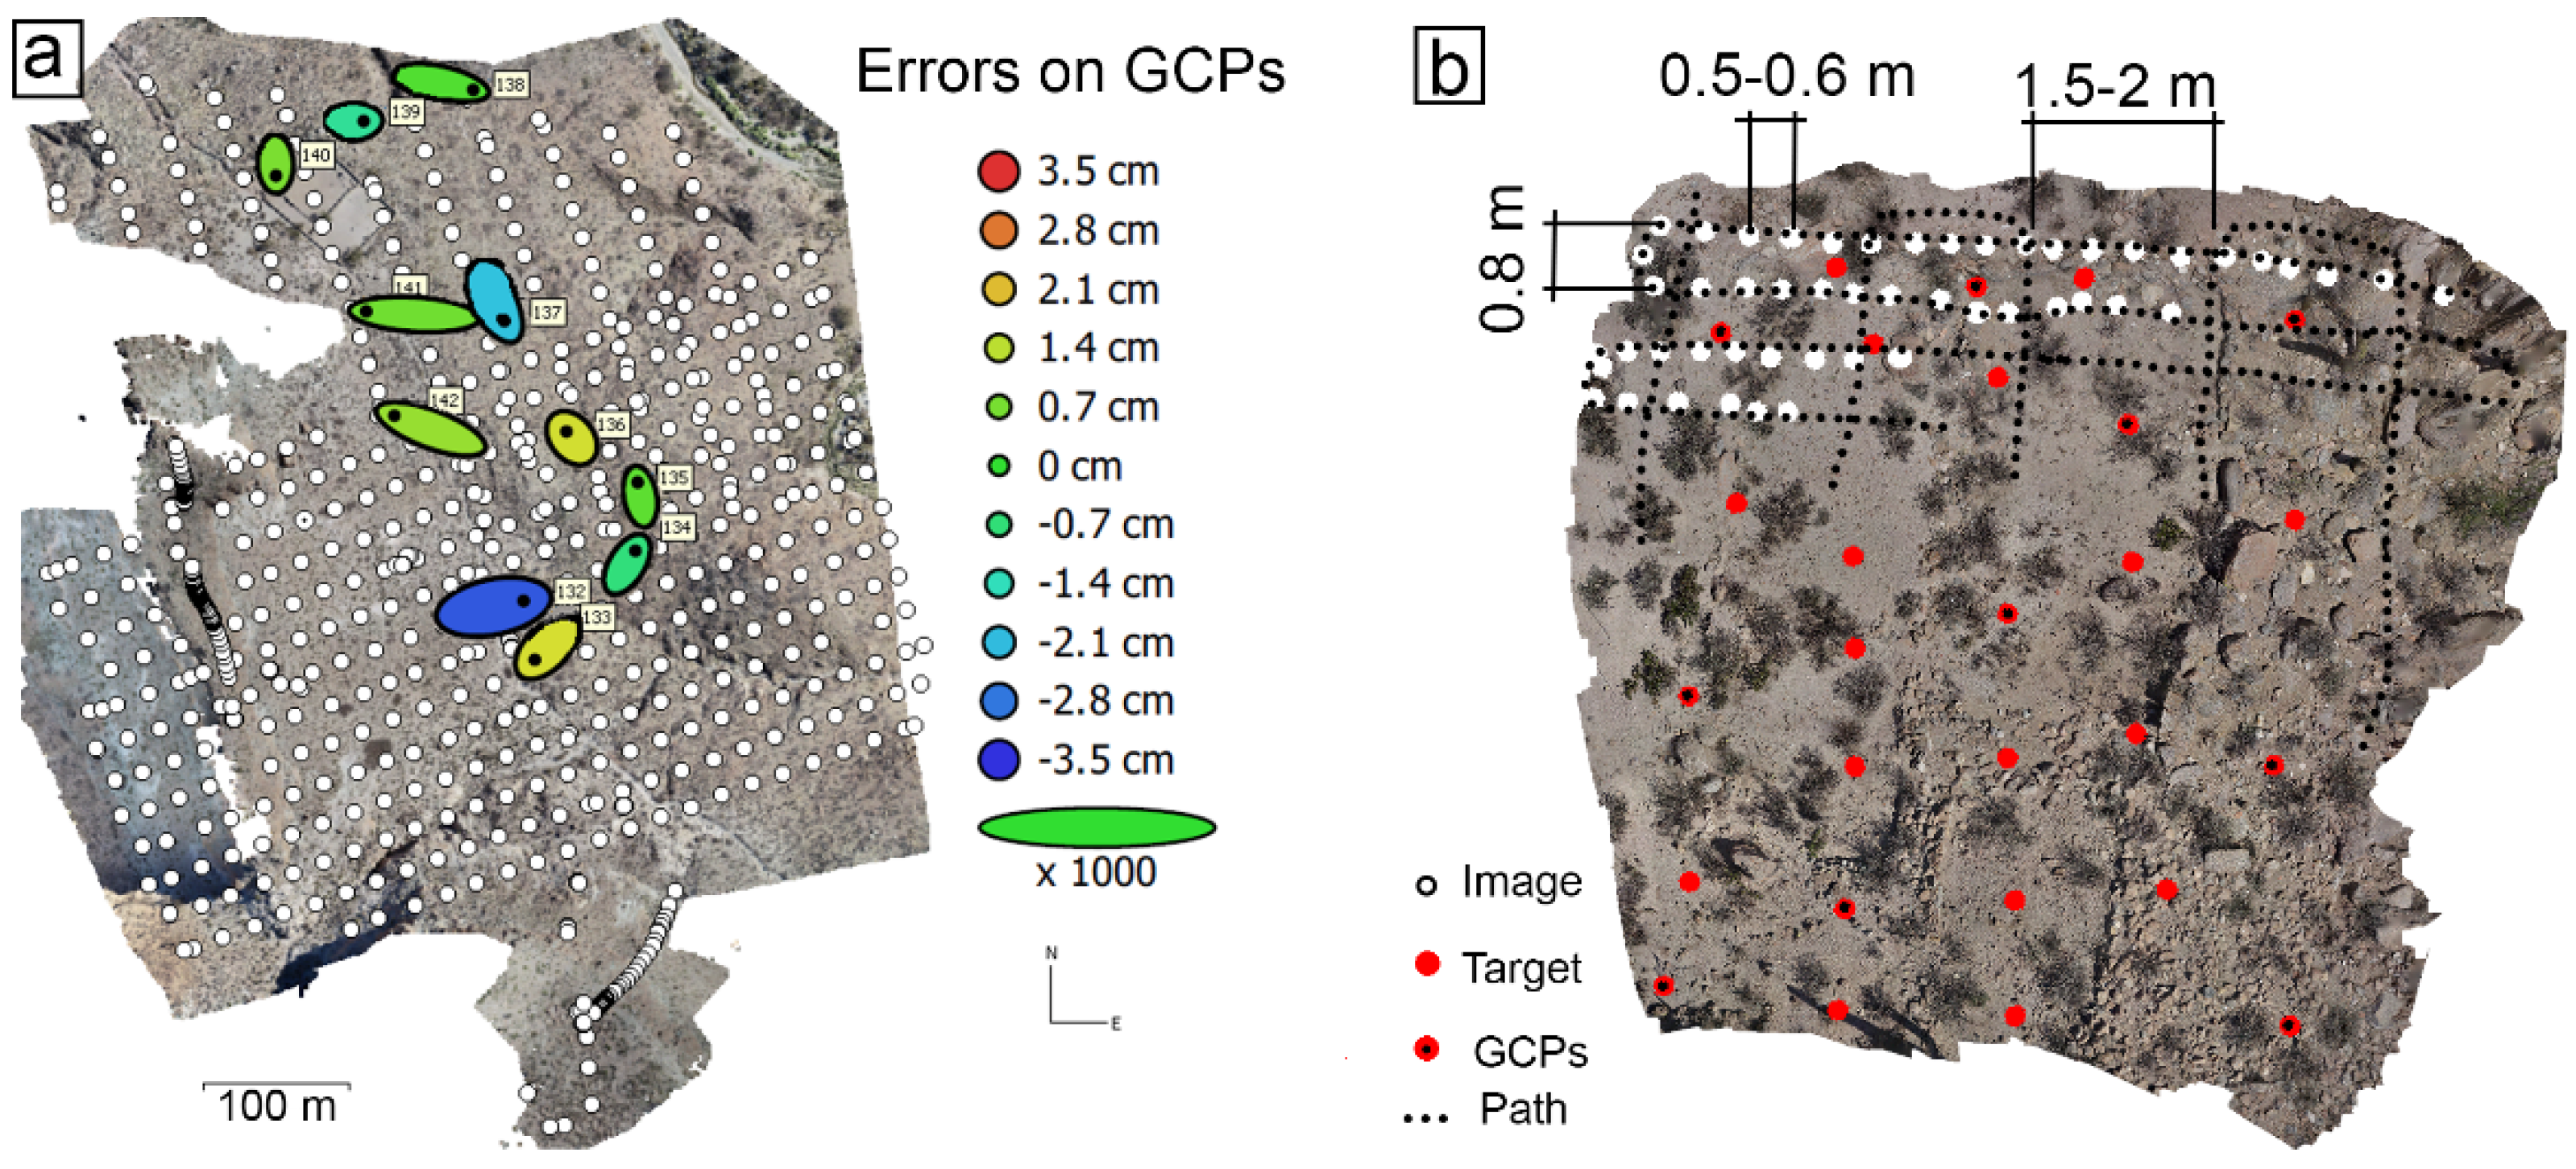
2 at a flying altitude of about 80 mt (262 ft) and a ground resolution 2.36 cm/pix. A commercial flight design app was used. The coordinates of 11 ground control points (GCPs) were measured using GNSS (see
Figure 3a); these values will be useful as a constraint during photogrammetric reconstruction and for the georeferencing of generated products. GCPs were primarily located in the central portion of the investigated area [
30].
Because of the strong winds and the huge difference in height between the valley and the uplands, it was hard to plan a proper photogrammetric flight over these areas; accordingly, some panoramic videos were acquired for documentation and promotion purposes. Videos had a resolution of 3840 × 2160 pixels. Finally, 5 UAV flights were performed (about 2 h of flight) and the entire surveying operations required 2 operators for half a day (about 4 h).
2.2. Ground Photogrammetry
A ground survey was designed to perform local investigations of archaeological excavations and for the documentation of remains. For these purposes, a camera handled by an operator was used: a Sony DSC-QX10, fixed on top of a 3 m (9.8 ft) long pole. This cheap and easy solution guaranteed a privileged viewing point, allowing for the acquisition of high-quality images, while avoiding occlusions and perspective distortions. A specific image acquisition project was designed, considering the ground footprint of each acquired image and the redundancy of data required by SfM. The camera was fixed with an off-nadir angle of 30 degrees, which prevented the operator from being framed and ensured optimal acquisitions of even small vertical walls. The focal length was set at 4.45 mm (17.5 in) (minimum length) to increase the footprint and reduce the number of images. The resulting ground resolution was about 1 mm/pix. This methodology can also be effectively used for the survey of medium extension areas (a few hundred square meters), or in scenarios where a UAV flight is not feasible.
Ground photogrammetry was applied in this area for the high-resolution digitalization of some settlements, for which further analyses investigations are planned. Targets were positioned in the investigated sites to delimit the area of interest and help the operator in following straight paths. Some of the targets were measured with a total station to constrain the photogrammetric reconstruction and provide results in a local and properly scaled reference frame.
The acquisition pattern is represented in
Figure 3b. To guarantee the required redundancy of data, the operator needed to acquire an image every 0.5–0.6 m (about a step in the forward direction), and the distance between parallel path lines needed to be about 0.8 m (a longer step). Crossed paths were also suggested to strengthen the acquisition geometry; in this case, the acquisition frame rate could be increased (each 1–2 m) and the distances between subsequent paths can be a few meters.
2.3. Photogrammetric Processing
The acquired data were processed with Agisoft Metashape Professional Edition v.1.5 (
www.agisoft.com, accessed on 29 December 2021), a commercial software based on SfM algorithm, designed for close-range photogrammetric applications [
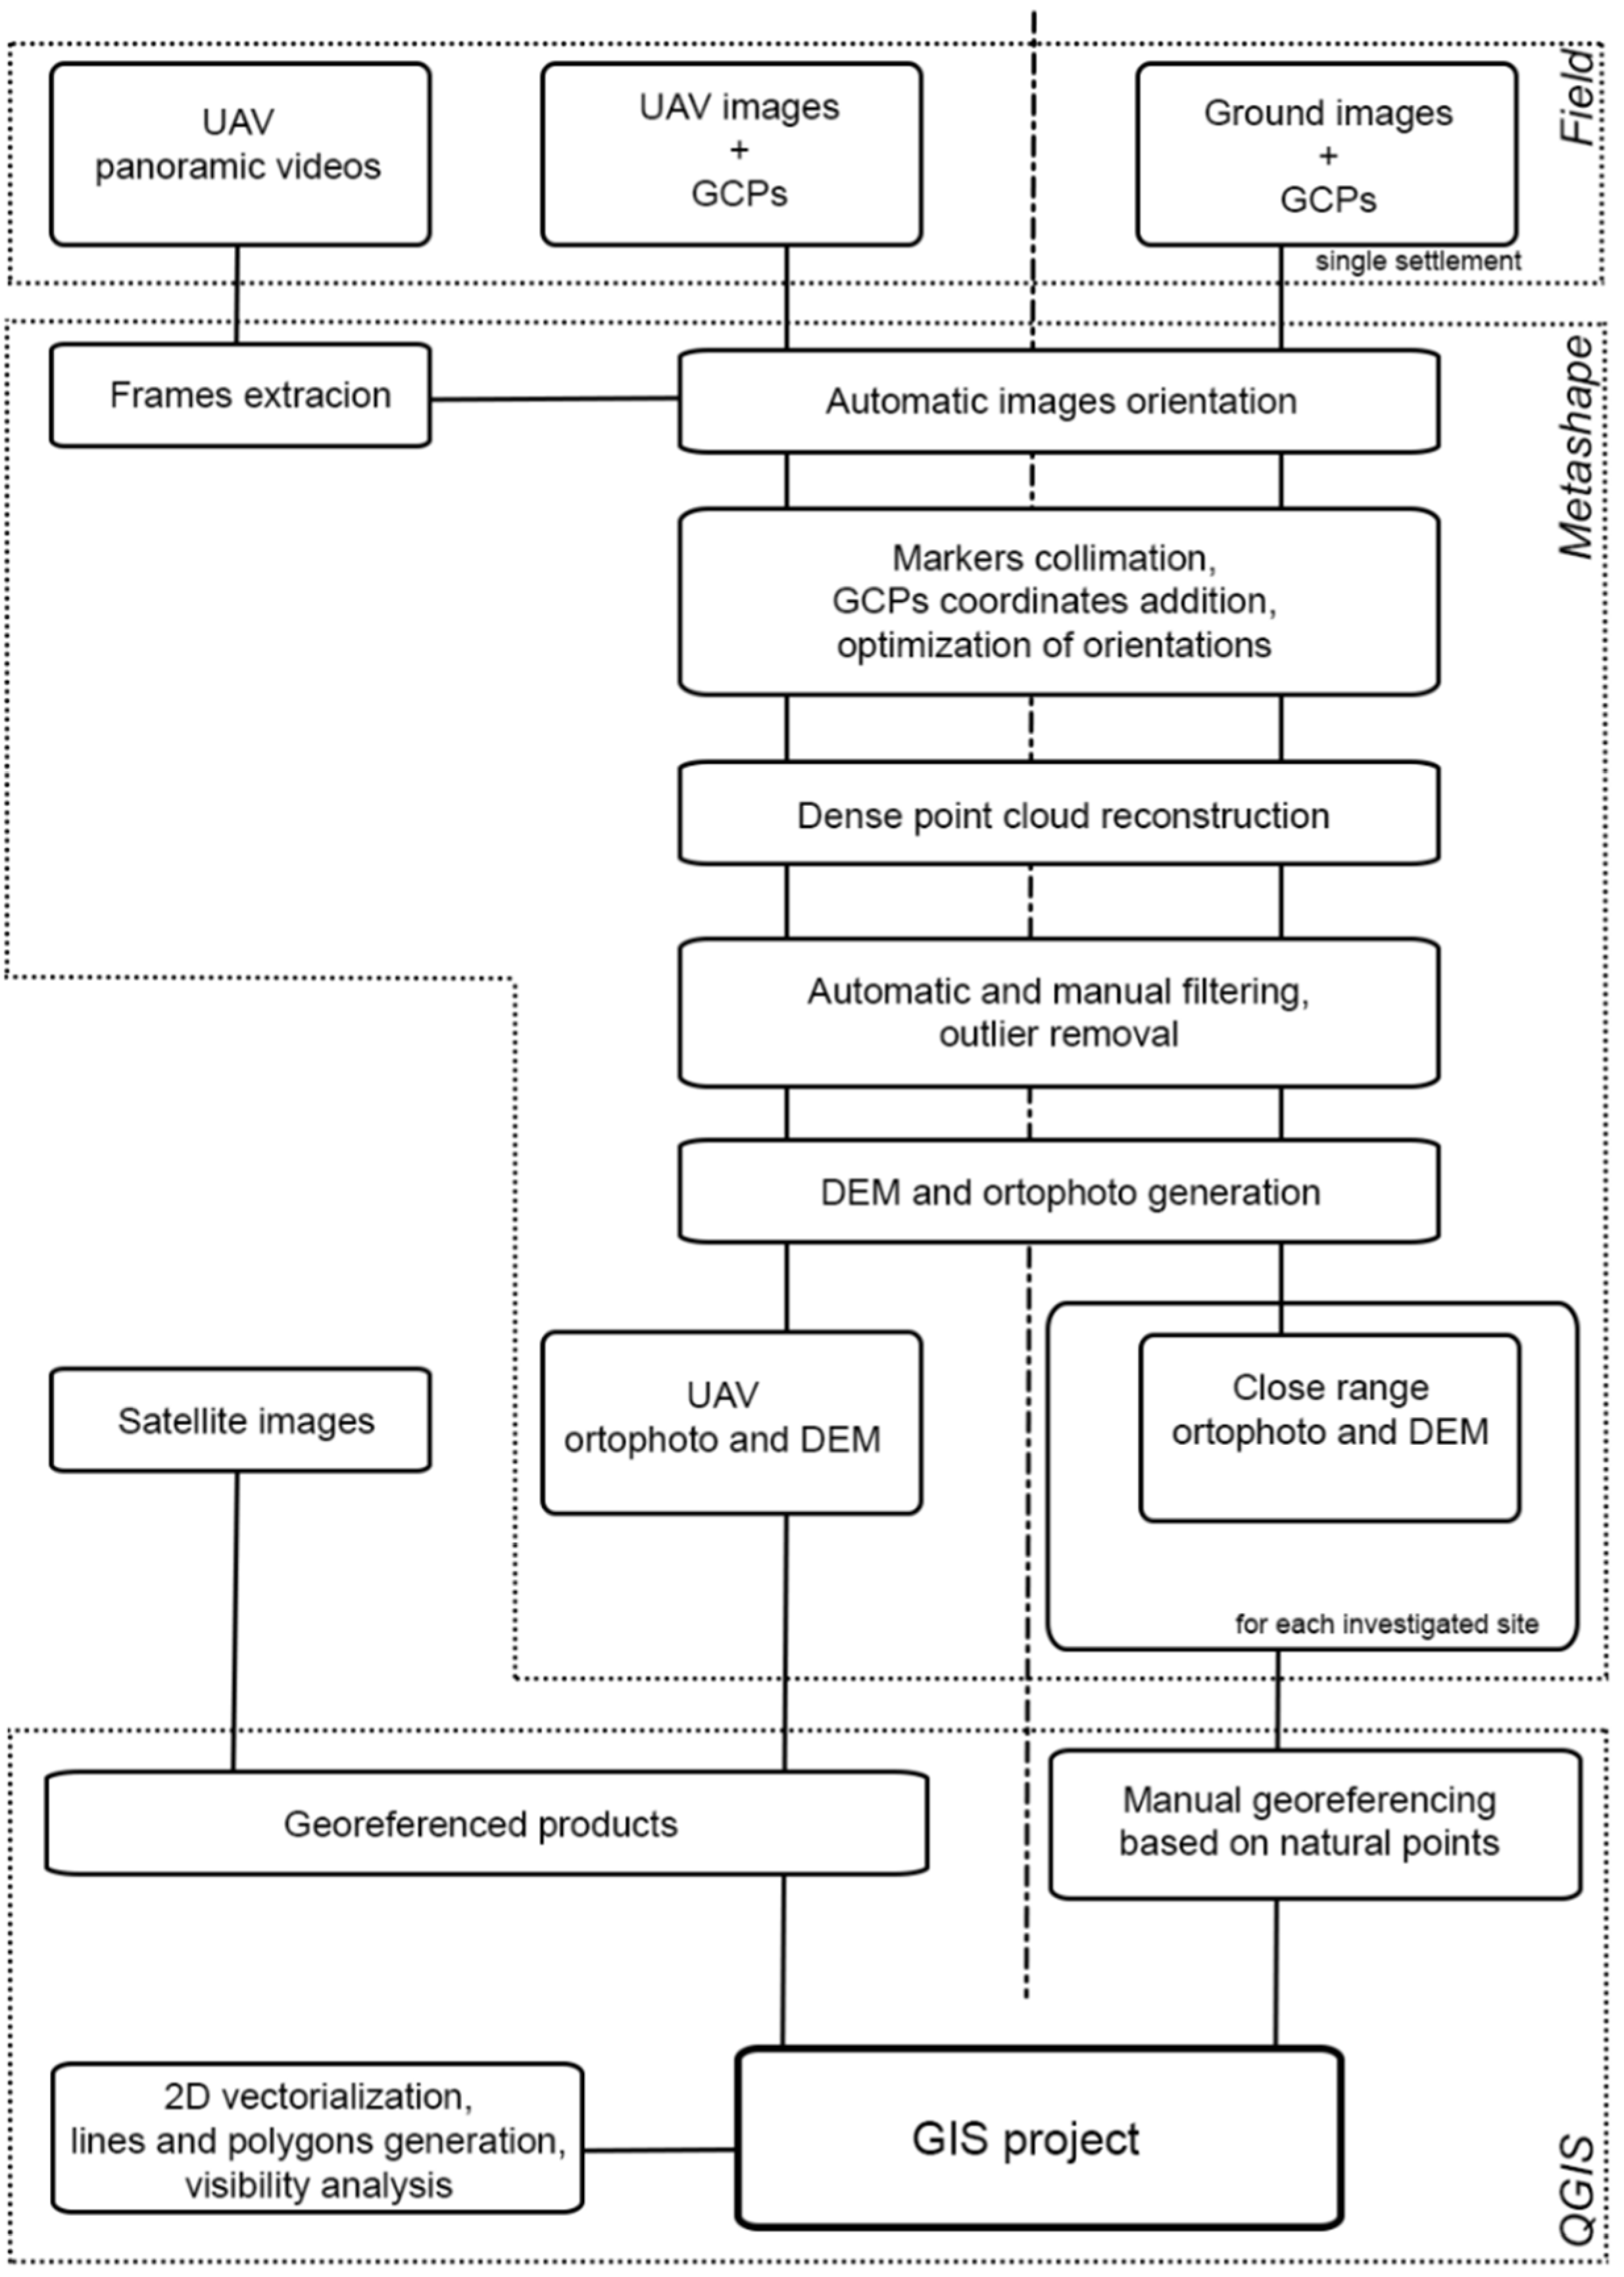
31]. The workflow we followed for the processing of the acquired datasets is summarized in
Figure 4: first, a raw orientation of acquired images was run, then an optimization based on GCPs coordinates and their location on the images was performed. These steps enabled the user to obtain the pose and orientation of acquired images, internal camera calibration parameters, and the so-called sparse point cloud—a low-density 3D representation of the detected scene [
32]. Image matching algorithms were then applied for a pixel-to-pixel correspondence analysis and to obtain a 3D dense point cloud, a high-density reconstruction of the scene [
33]. The dense point cloud is the basis for the extraction of 2D products: the digital elevation model (DEM) and the orthophotos. In this case, processing parameters were set to guarantee highly accurate results with medium resolution data (high-accuracy setting in the alignment step, and medium-quality setting in the dense cloud reconstruction step; see Agisoft Metashape user manual for further information).
UAV dataset images were processed in a single project. Frames were extracted from the panoramic videos to allow for a better reconstruction of the two bulwarks and were added to other images (see
Figure 2d). The final number of processed images was about 1130 and required about 50 hours’ processing (images to orthophotos). A proportion of 90% of the processing time was required for automatic calculation, with 10% (in this case about 5 h) employed by an operator to manually identify the targets in the acquired images. Ground datasets were split into several projects, one for each site. All projects were processed with the same parameters’ settings.
2.4. Data Management and Mapping
Generated DEM and orthophotos were imported in QGIS (
www.qgis.org, accessed on 29 December 2021) to create maps of the area and enable spatial analysis of the detected settlements. UAV products were georeferenced according to the reference system used for GCPs surveys. Products based on the ground survey required preliminary processing: some of the generated orthophotos were within the same reference system (local, according to the total station survey), while others were registered thanks to common points. As a last step, the final orthophotos were georeferenced using natural points in common with UAV products.
Satellite images available using Web Mapping Services (WMS) were added to the final project, allowing for the representation of the entire valley. DEM from the UAV survey and orthophotos were used to perform the mapping and vectorialization of archaeological settlements through QGIS tools.
2.5. Visibility Analysis
Visibility analysis (more often called viewshed in terrain analysis) produces vector or raster format images representing the geographical area that is visible from a given location, and includes all points that are in the line of sight of the selected location. Points that are beyond the horizon or obstructed by morphological or human-made features will be excluded from the visible area. Conversely, visibility analysis can also refer to the area from which an object can be seen.
The use of elevation models characterized by suitable values of spatial resolution and vertical accuracy is a fundamental requirement to achieve a reliable visibility analysis. Said parameters can be related to the geographical area of the analysis. Evidently, a study conducted on a local scale requires more detailed elevation models; whereas, analyses performed over larger areas can be based on less well defined elevation models. The area under investigation is totally free from any type of modern urbanization; therefore, the level of definition of the terrain features were carefully considered with respect to the geographical extent. As far as the analysis at the site scale is concerned, the elevation of the observer and the manufacts belonging to the archaeological findings should be represented by the elevation models. For larger scale analyses, the introduction of effects due to the earth curvature and atmospheric refraction takes on significant importance. Finally, view radius and sample spacing (interval at which elevations are examined) are required to perform a visibility analysis.
3. Results
3.1. Photogrammetric Survey
UAV survey produced a 3D point cloud with a resolution and an accuracy of about 2–3 cm (0.8–1.2 in). Generated DEM had a resolution of 4.7 cm/pix and the full resolution orthophoto (2.5 cm–1 in) was 3 GB, which is hard to handle in other software; therefore, a 5 cm/pix orthophoto was created for the import in QGIS and the following activities.
The ground photogrammetric survey produced various 3D models of the investigated area with a resolution of about 1.5 mm (0.05 in) and an accuracy ranging between 4–8 cm (1.6–3.2 in). Bigger errors were detected on the elevation because of the unfavorable acquisition geometry (reduced distances). The generated DEM and orthophotos had a resolution of a few centimeters (2.3 cm–0.9 in) to ensure easy handling in the following steps. [5 contains few views of the investigated areas as represented in the virtual model.
Figure 5a exhibits a view of the 3D model of the entire Tacuil area obtained with UAV photogrammetry;
Figure 5b,c show views of two smaller structures in the lower hamlet, documented with a ground photogrammetry approach.
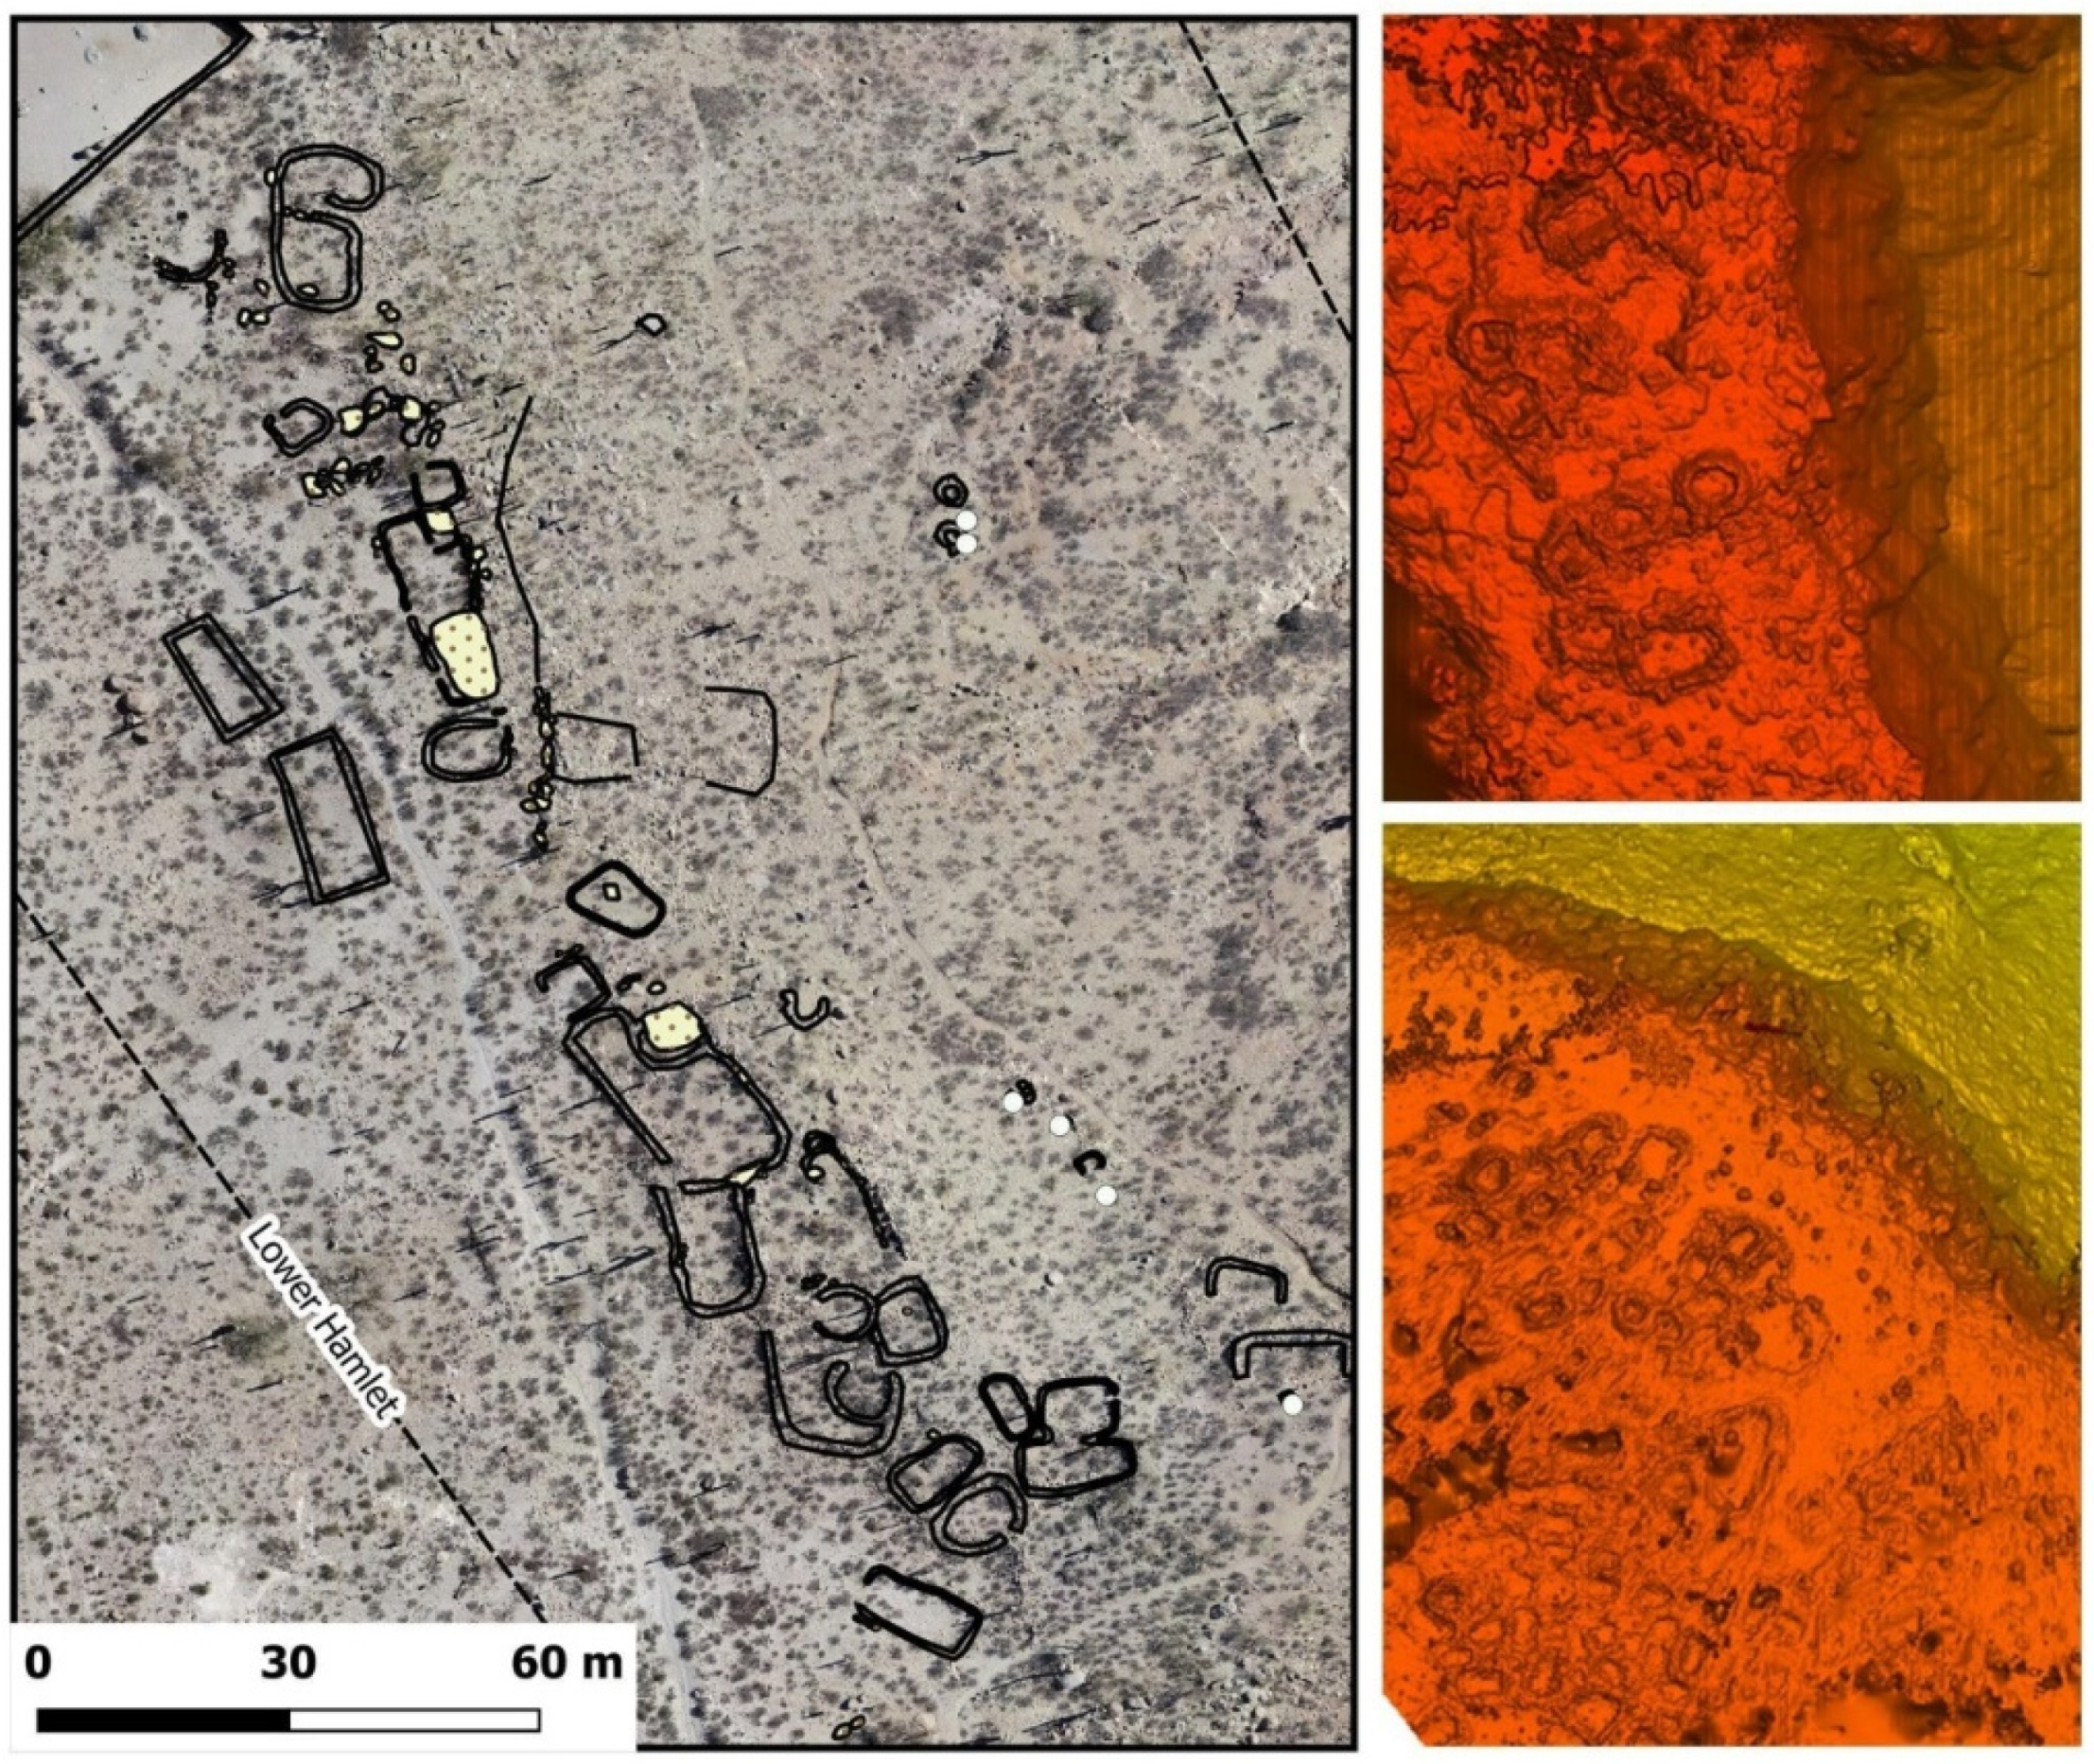
Figure 6 shows some achievements after the photogrammetric processing. In particular, on the left, the high-resolution orthophoto of the lower hamlet with interpreted shapes of structures is shown. On the right, the digital elevation models of a couple of sectors belonging to Pukara 1 (below) and 2 (above) are also represented. Structures are sharply visible and aid in instances when site inspection and topographic surveying is not feasible or difficult due to logistic constraints or inaccessible areas.
3.2. Mapping the Visibility Analysis
The visibility analysis was carried out on both the large and local scales. For the purpose of the large-scale visibility study, a digital elevation model, based on globally available visible satellite data, was used. In particular, the 30 m resolution ASTER Global Digital Elevation Model (ASTGTM v002,) was selected. Besides, to perform the visibility analyses at the best achievable level of detail within the area of Tacuil, the elevation model from the UAV photogrammetry survey was processed at 5 cm spatial resolution.
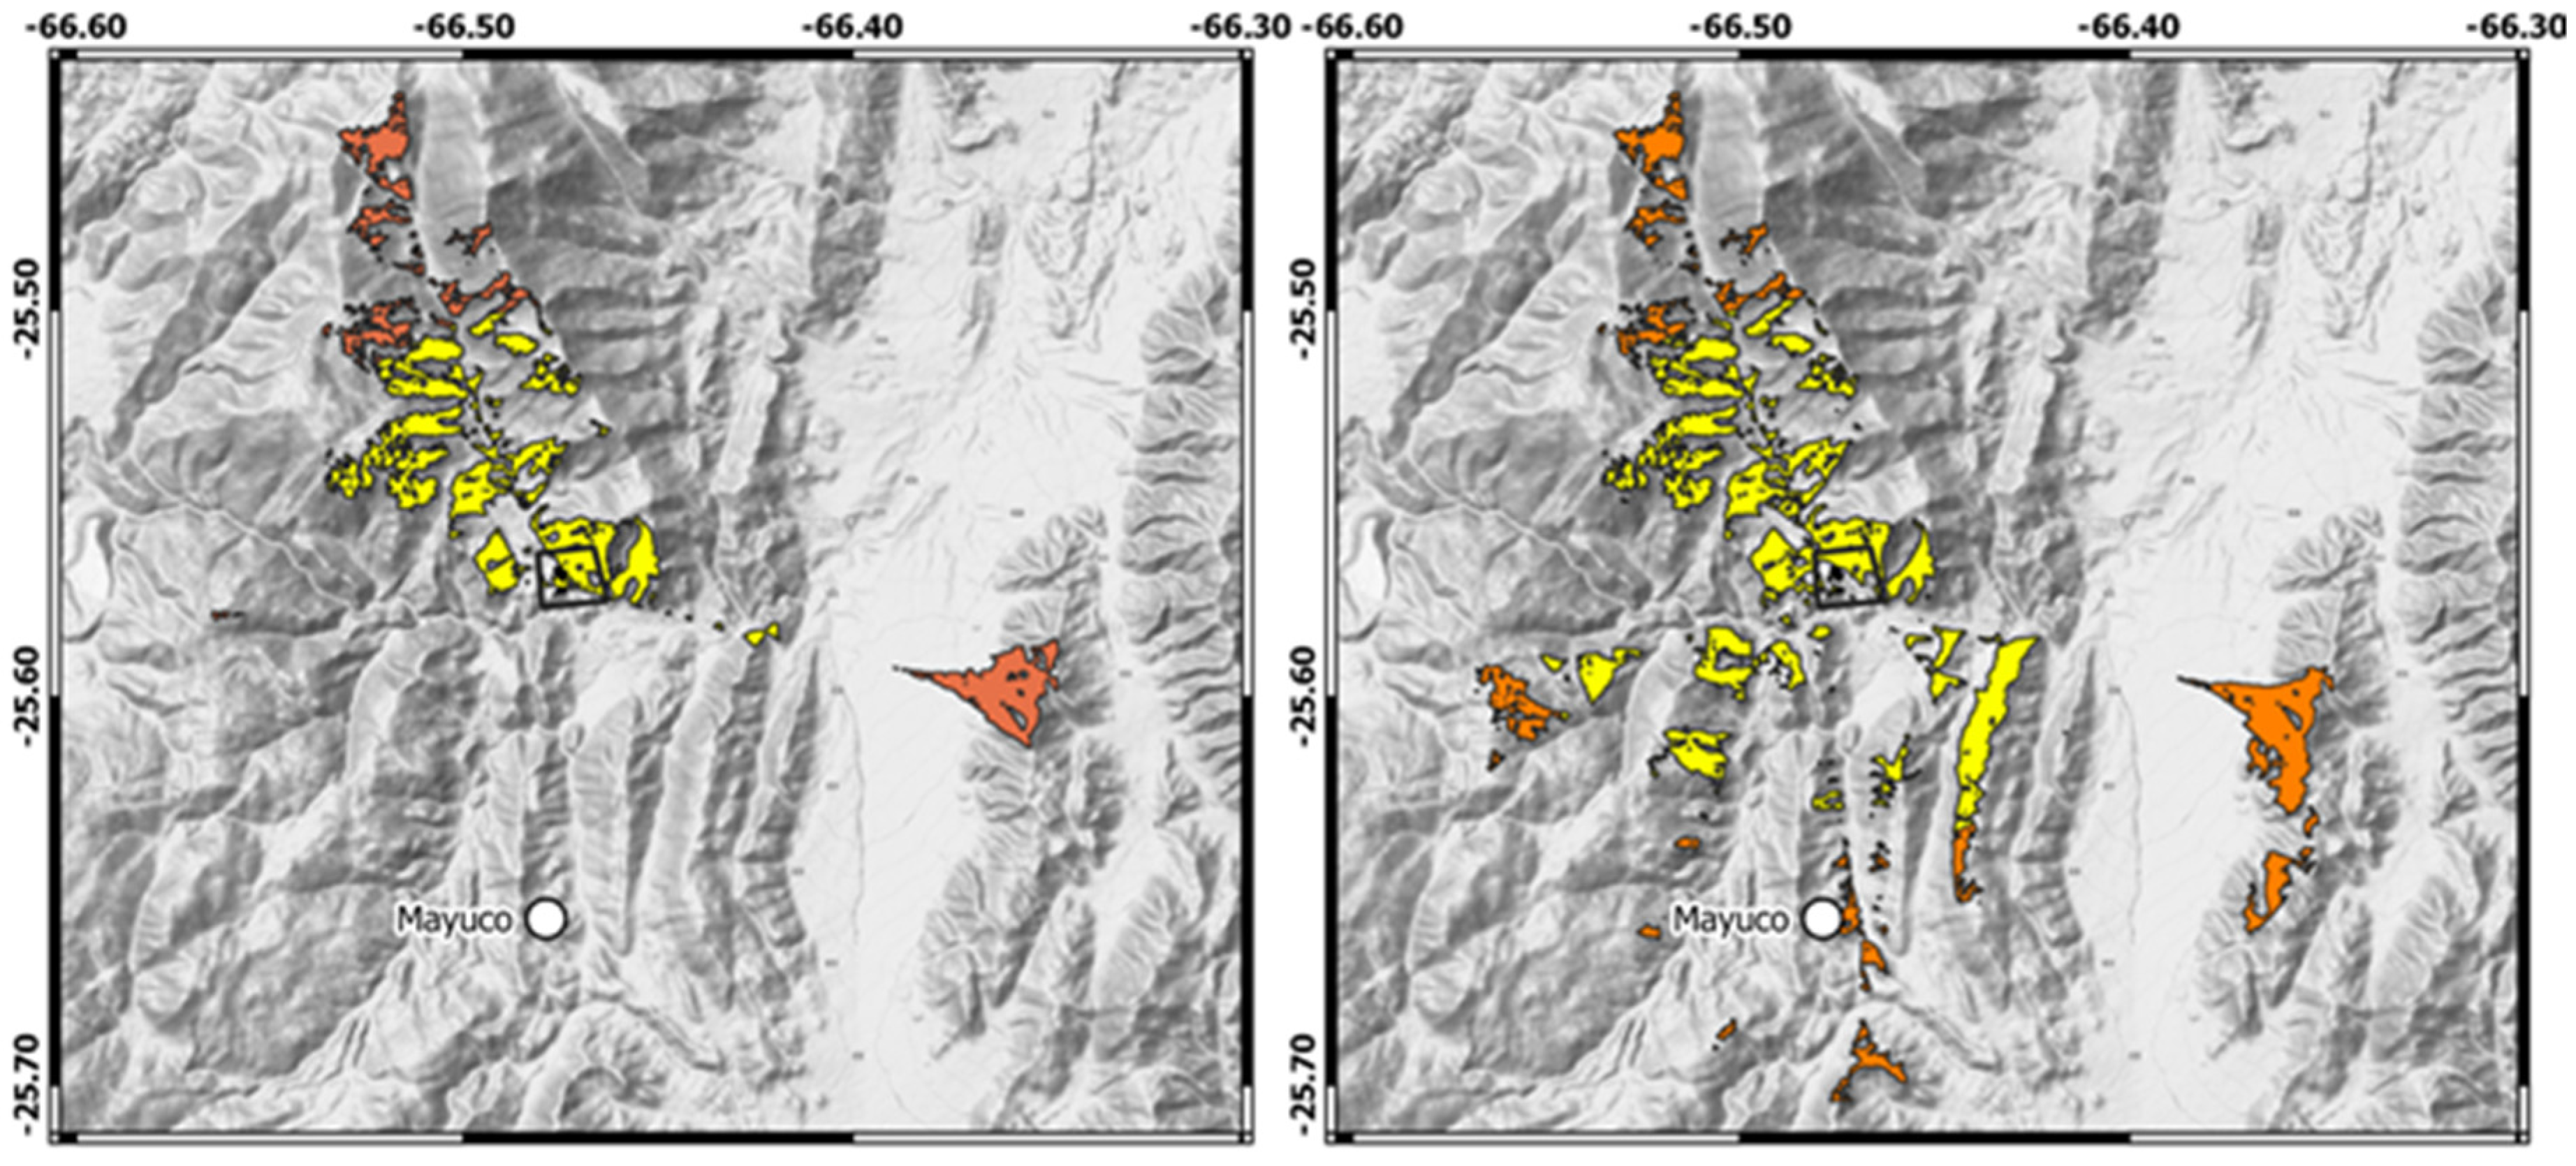
Figure 7 summarizes the results of these analyses. In particular, the left and right figures report the analyses carried out over large extents by setting distances of 8 and 15 km, respectively, with respect to an ideal observer placed in the center of the two
pukaras. The algorithm considers the effect of the Earth’s curvature and the atmospheric refraction to achieve reliable results over considerable distances.
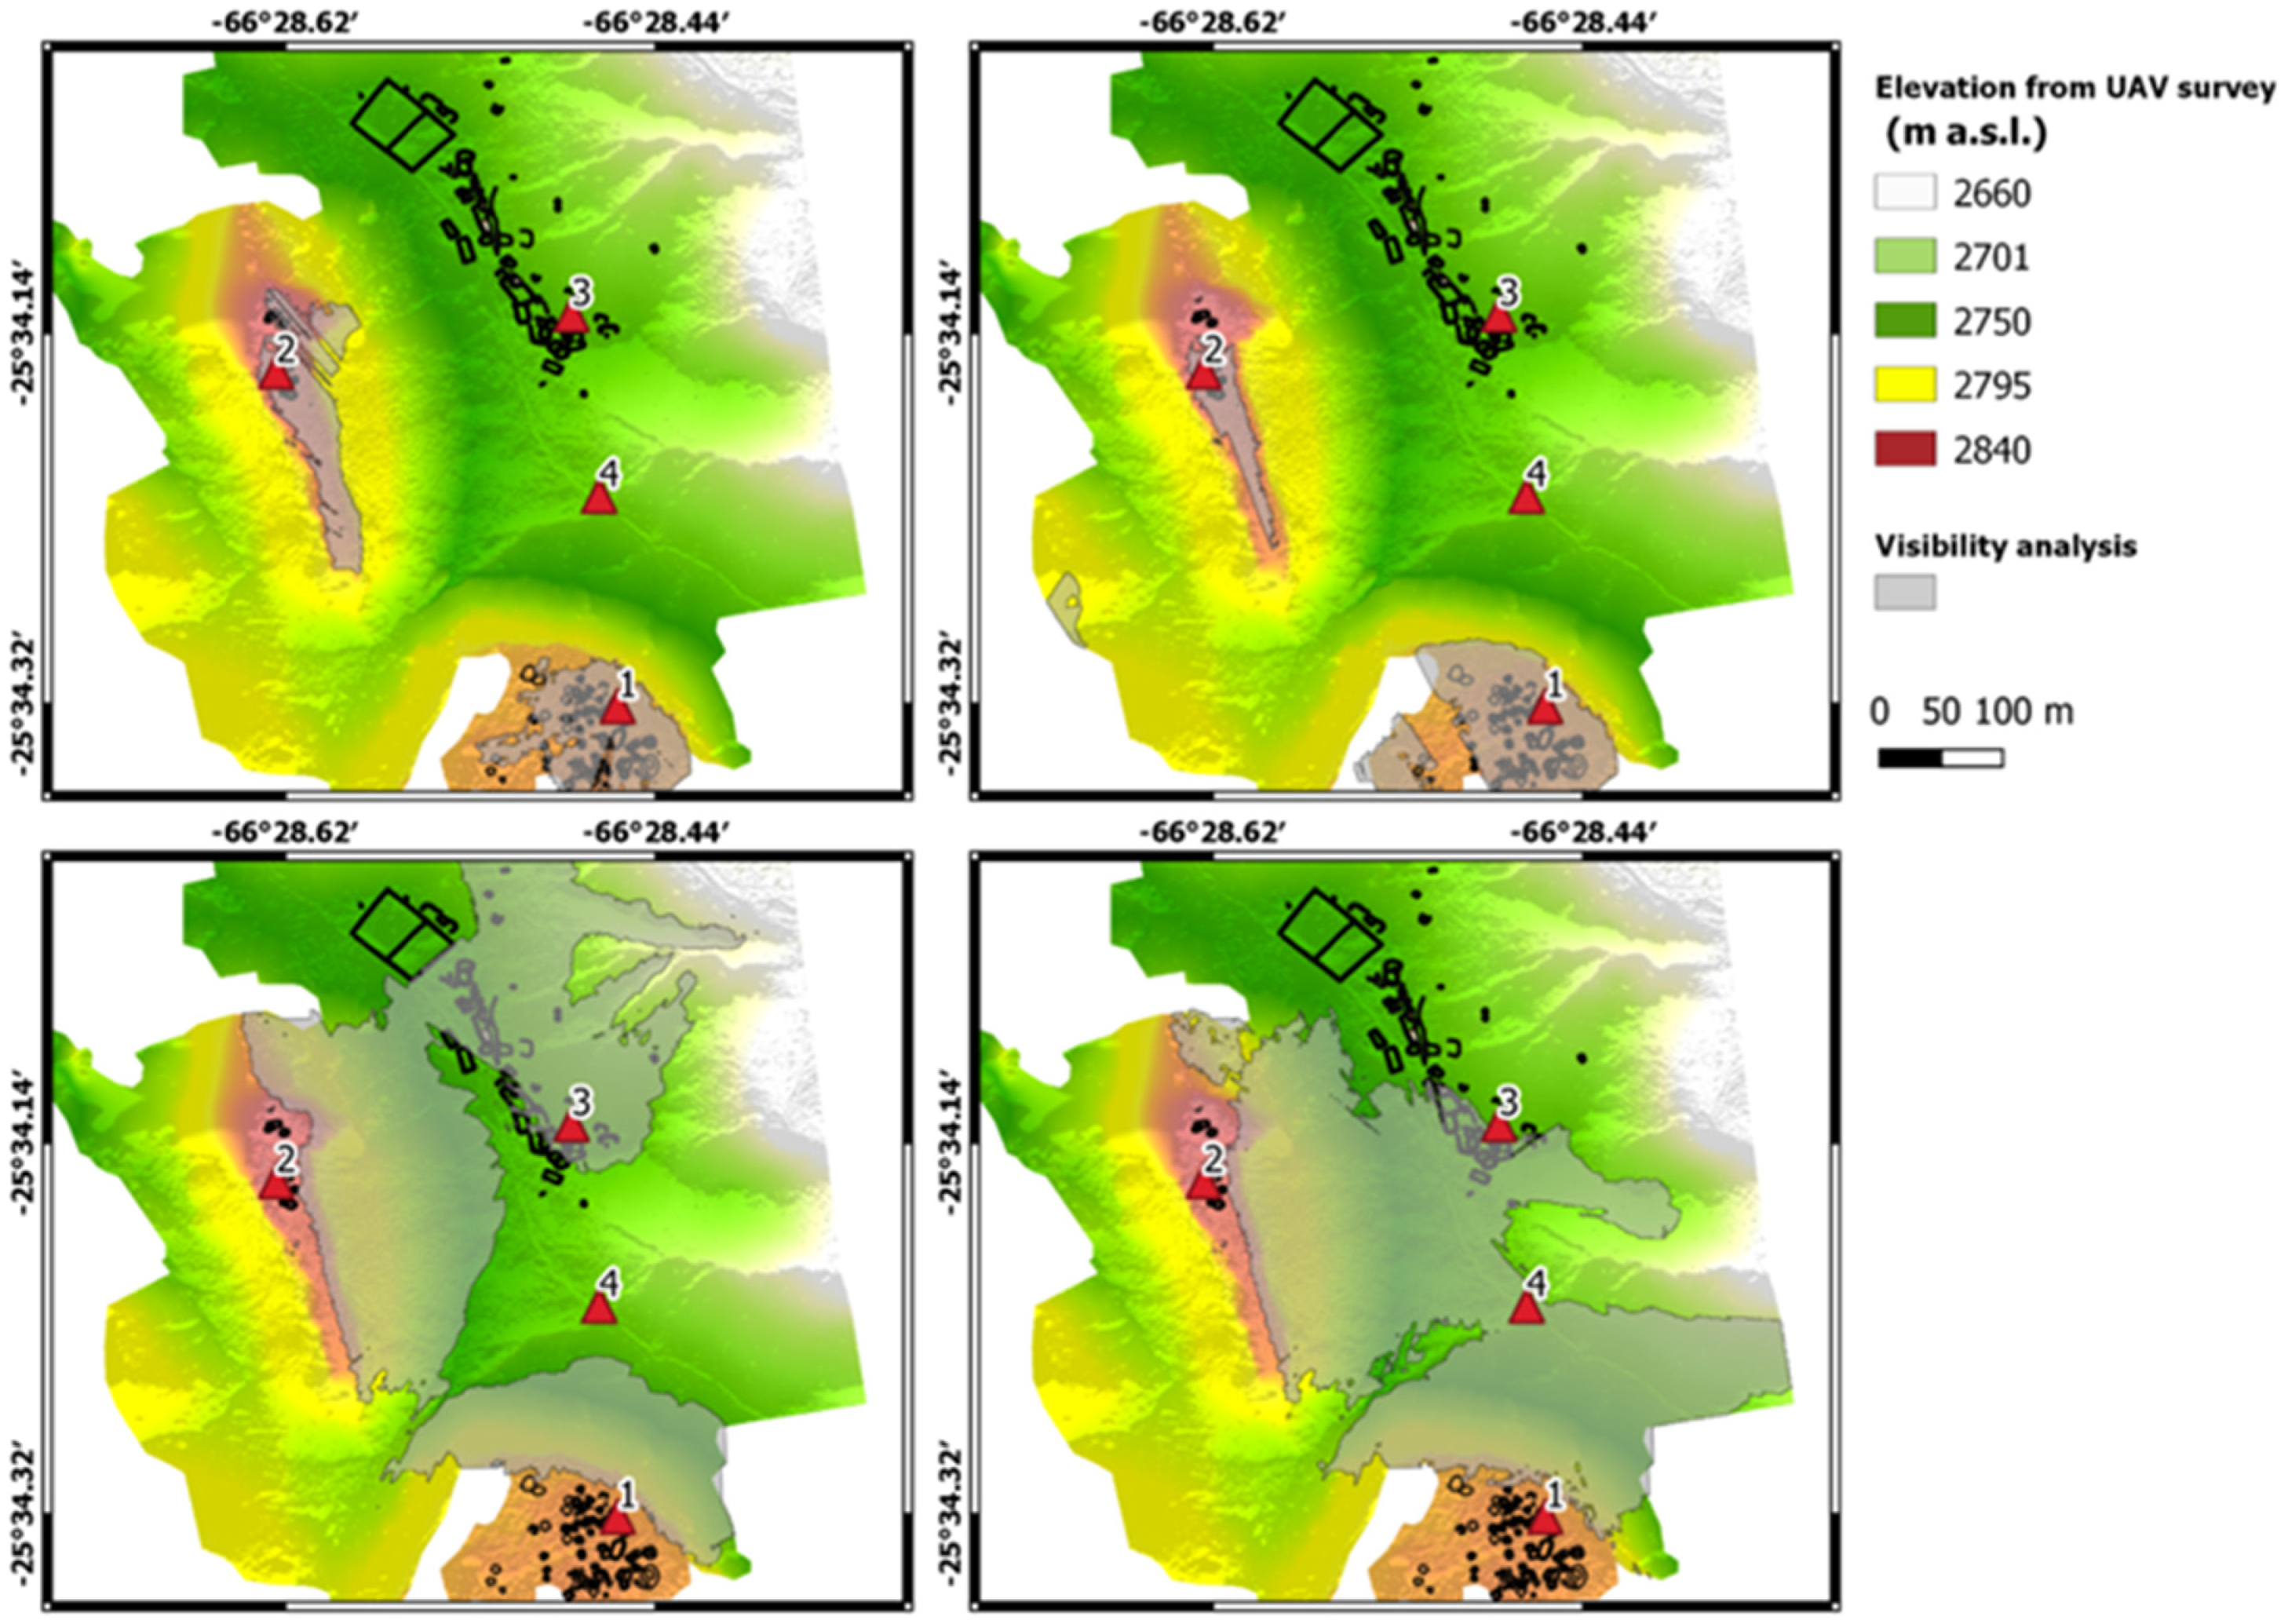
At local scale, the visibility analysis, based on very high geomorphic details, allowed us to define the areas from which the archaeological structures located on both
pukaras are visible and vice versa. This type of analysis required setting the elevation of the observation point and targets with respect to the ground. These values were set at 1.6 m and 2.0 m, respectively.
Figure 8 shows the results of the visibility analysis at local scale from points located in the central parts of Pukara 1 (point 1 in the upper right map) and Pukara 2 (point 2 in the upper right map) and in the proximity of the Tacuil site (points 3 and 4 in the lower maps).
4. Discussion
4.1. Interpreting the Archaeological Features through Drone Images: Productiveness and Effectiveness
As mentioned above, the archaeological complex consists of three main sectors: two
pukaras (Pukara 1 and Pukara 2) and a semi-conglomerated Lower Hamlet, leaning on alluvial plains at the foot of Pukara 1 (see
Figure 2). Of this complex, until today, only a map of Pukara 1, made in the 1970s [
34], was available, and it was a partial relief of the lower part. The latter is the product of 2 entire fieldwork campaigns (2016, 2017), which involved about 9000 images taken over 20 days of relief work with pole and camera [
35]. This methodological approach was insufficient for having a satisfactory result, due to the great extent of Tacuil complex, the considerable differences in height, and the harshness of the terrain. The use of a drone, despite the difficulties of handling it in an area like that of Tacuil. characterized by the presence of strong winds, has proved to be the fastest and most effective solution to obtain a complete plan of the archaeological complex. This methodology also allowed a considerable saving of time; in fact, the flight over the area was carried out in a single day.
Beside productiveness considerations, the bird’s eye view provided by the drone images allowed a clearer identification of the shape of the archaeological enclosures. As highlighted in several previous studies, carried out on coeval sites [
16,
19], the settlement pattern for this type of site, the distribution of structures, and the orientation of entrances do not seem to respond to pre-set criteria. The construction technique, with dry stone walls, most of which are now dismantled, the use of lithic material for the construction of color, and the mimetic shapes, with respect to the geographical environment, make it very difficult to identify the different archaeological features. The drone images have facilitated the identification of the enclosures and their internal divisions, especially in the Lower Hamlet area, where the invasive vegetation decreases the visibility of the archeological structures from a ground perspective. The drone images allowed us to map the structures in Pukara 2, which are otherwise unreachable, due to the extreme vertical morphology of the rock dacite on which it stands. The drone images were also of great help for the analysis of structures in relation to the morphology of the geographical environment, especially in environments with such peculiar characteristics.
In the two Pukaras, it was possible to clearly identify the concentration of the structures towards the interior of the dacitic rocks, so they are completely invisible for those who pass under the two outcrops. The ground photogrammetry approach, as introduced in the previous sections, can be used as an alternative to UAV photogrammetry, if the area of interest is a no-fly zone, or if its size does not justify the use of aerial technologies. Moreover, a terrestrial approach can be performed in integration with a UAV survey if small-scale investigations are required, i.e., whenever it is necessary to guarantee a greater resolution of the documentation, or when the geometries are complex (i.e., excavations, vertical walls), and a bird’s eye view comes out ineffective.
4.2. Building the Map of Tacuil
4.2.1. The “Semi-Conglomerated” Lower Hamlet
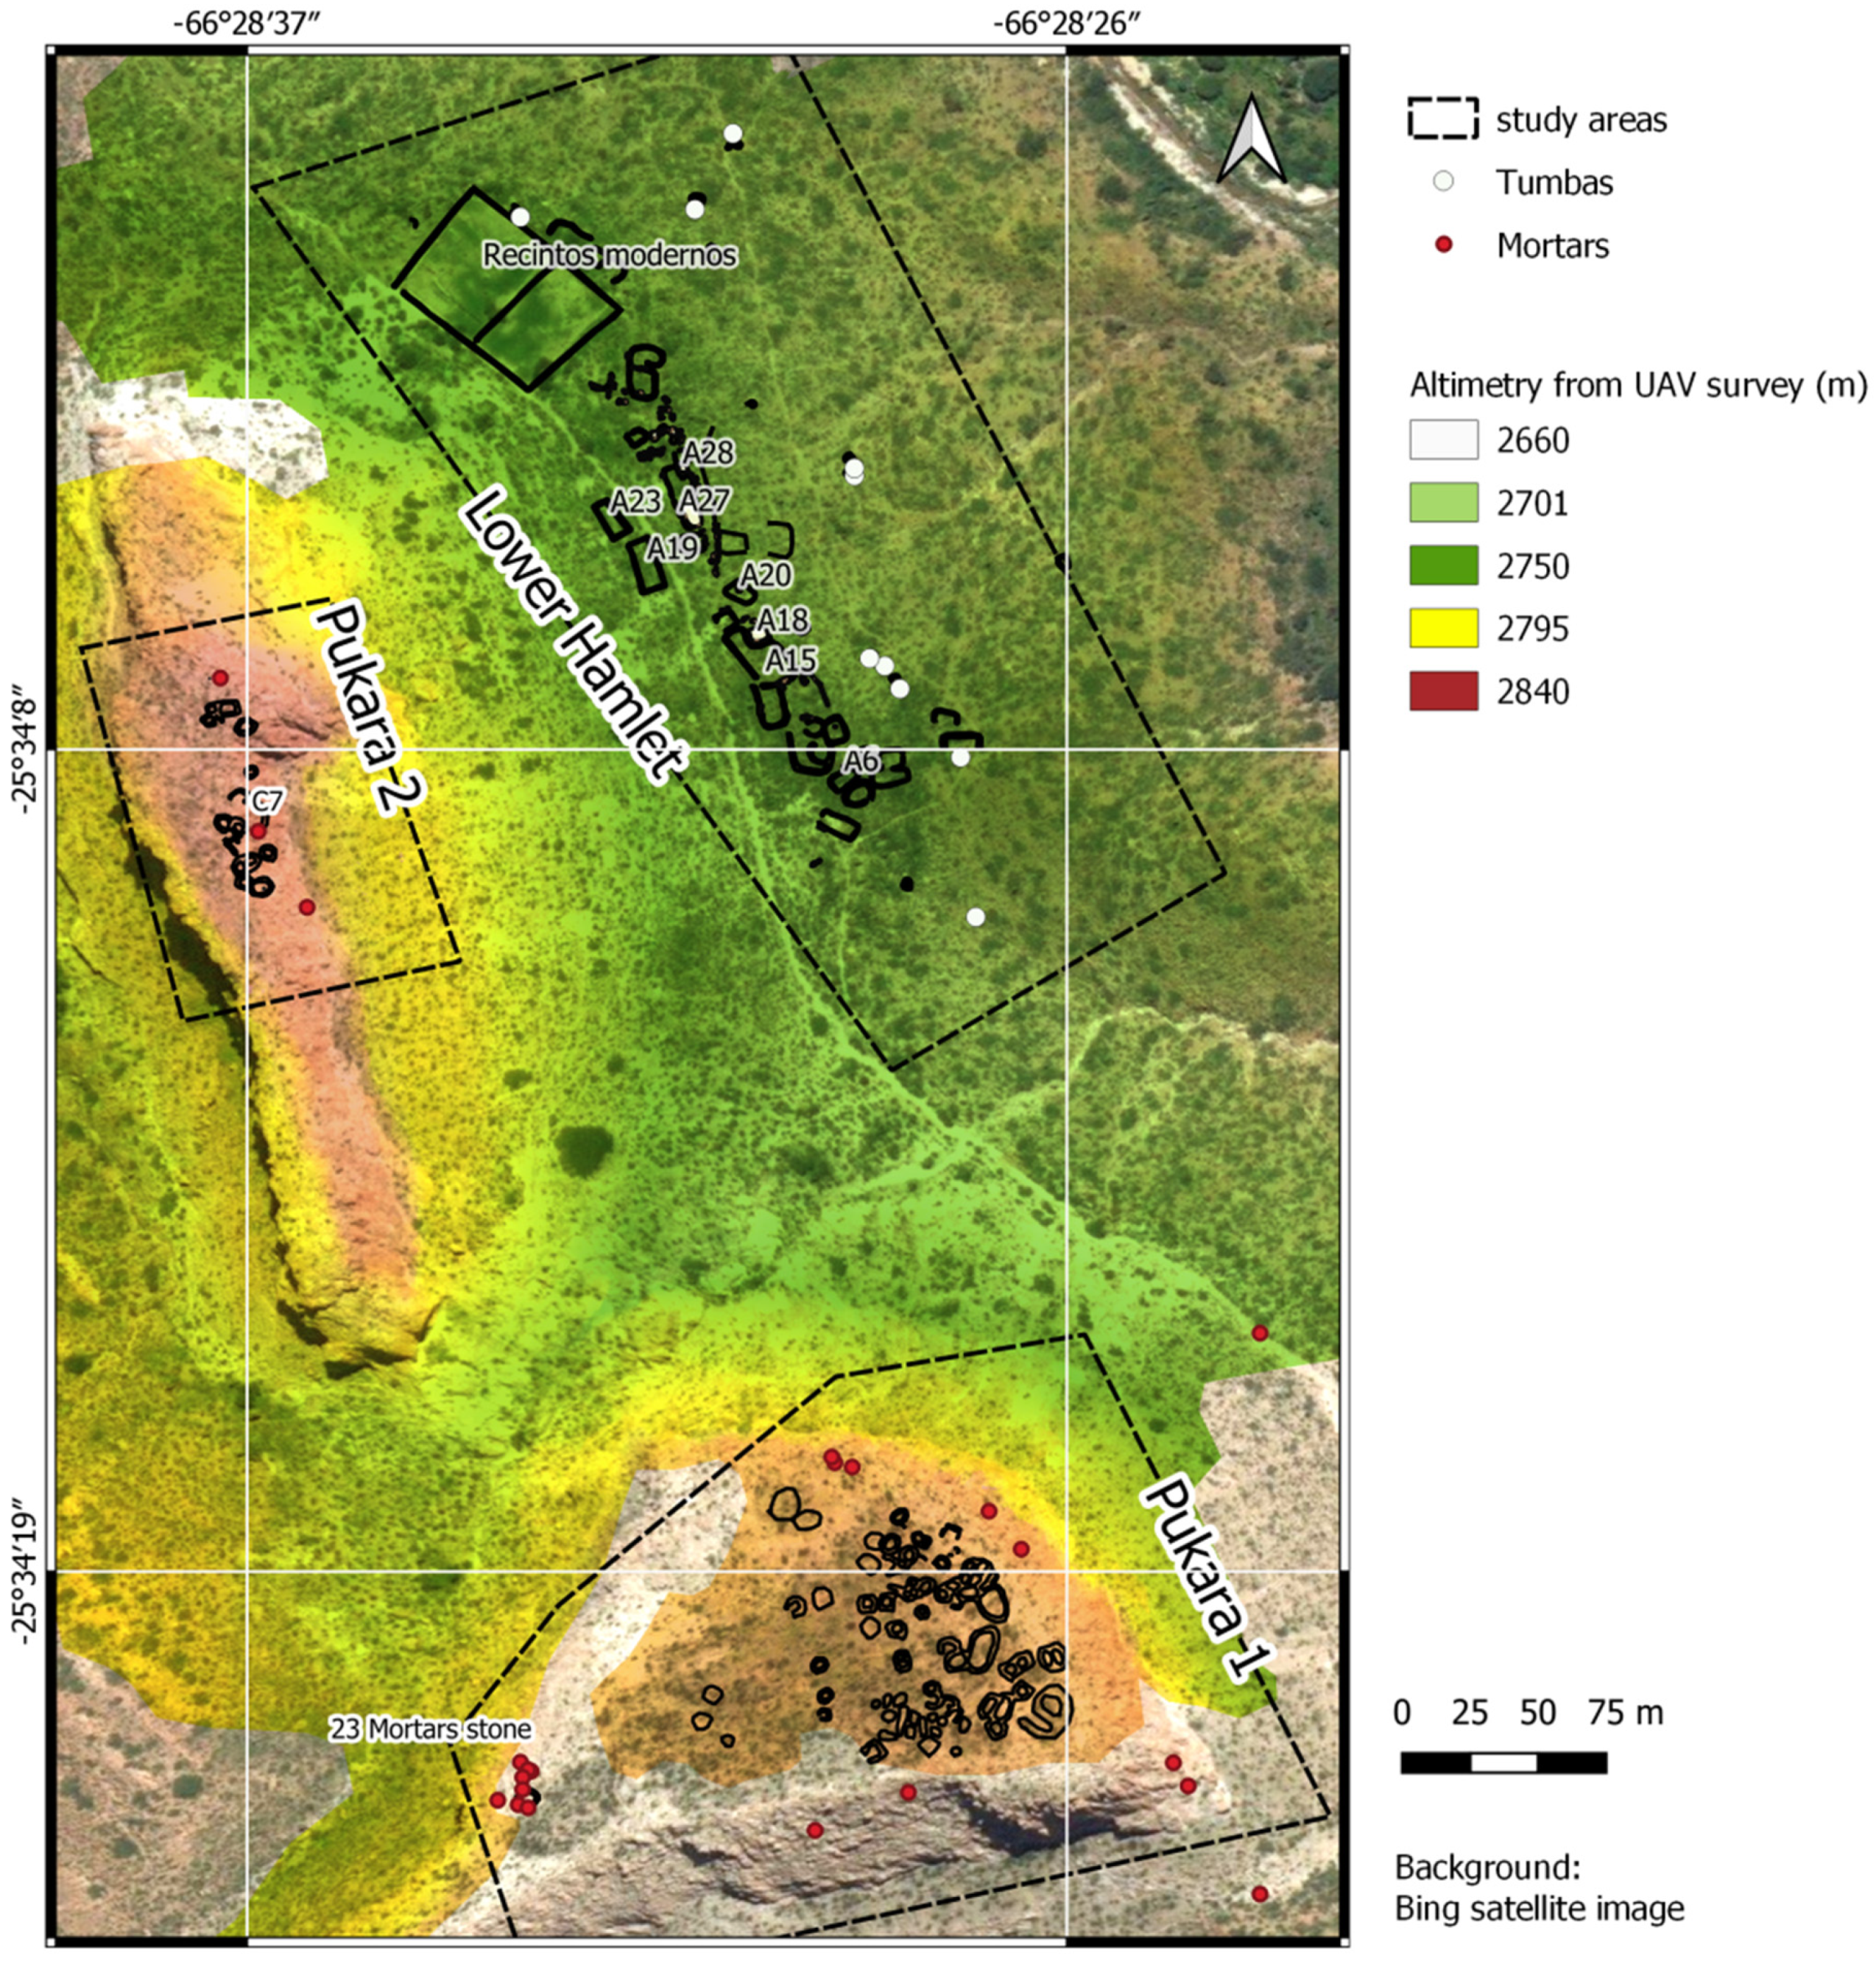
The archaeological structures in the lower portion of the site lie on a series of artificially modified terraces located on the western bank of Rio Blanco. These structures occupy an area of 7.5 acres toward north/south and are bordered by 2 ancient paths. This part of the archaeological site has been assiduously visited in modern times: once a year, the northernmost portion of the site welcomes a local festival, dedicated to the flock breeding cycle called “la bajada”, namely the descent to the valley of the flock, which is gathered in a large empty space on the lower settlement that was specifically modified to this purpose (see
Figure 9, Recintos Modernos). The ancient structures were removed to create this empty space and were used to set up a large fence, which is perfectly visible from satellite photos. The site was therefore exploited to source construction material, which was also used to build ancillary structures north of the large fence, where cooking facilities are accommodated during the annual festival.
The archaeological structures are, overall, in a bad state of conservation: during surveying activities, a total of 37 structures and 13 funerary structures were recorded (
Figure 9, tumbas), taking into account solely the structures showing a higher degree of archaeological record. In the light of the largeness of the whole area, of the area fenced in modern times (0.66 acres)—these fences cover approximately 9% of the surface and were not considered—and the presence of numerous collapsing walls, we may hypothesize that in ancient times, at the peak of the expansion of the village, there were at least 20% more original structures than those of the present calculation.
In general, the structures are located at a greater distance from one another, and their surface is larger than those of Pukaras 1 and 2, with a varying shape that tends to a sub-rectangular plan with rounded corners. Many of the structures share a wall; some have a more elongated and rectangular plan and occupy a larger surface. They present an internal fence overlooking an internal area (potentially a courtyard) of the structure itself (e.g., A15 and A18, measuring 314 and 56 m2, respectively; and A27 and A28, measuring 127 and 19, respectively). The single structures have a varying surface, between 35 and 160 m2. Two structures with a regular plan (A23, 109 m2, and A19, 177 m2), placed one next to the other and distanced from the other structures, stand out for their straight corners and bring to mind Inca kallankas. Unfortunately, they are in a bad state of conservation.
4.2.2. Pukaras 1 and 2
As already mentioned, the two
pukaras of Tacuil are located on the flat tops of two rock outcrops. The southernmost Pukara 1 [
34,
36] was until now lacking a plan. The northern Pukara 2 was reached for the first time during the 2018 campaign. It was also surveyed with a drone. This enabled us to confirm the presence of the structures that seemed to be glimpsed from satellite images, to proceed with a collection of surface material, and finally produce a complete survey of this site based on the images provided by the drone, which were also interpreted thanks to the data provided by direct observation.
The surface of Pukara 1 has an extension of almost 8.6 acres. About 70 structures were identified in this area, mostly with a sub-circular plan, although some of them have a sub-rectangular plan with rounded corners. It should be emphasized that this number does not coincide with that of the Raffino survey [
34], in which 100 structures could be identified. This discrepancy can be explained by the temporal distance of 50 years between the surveys: this certainly affected the state of conservation of the structures. Some of the structures identified by Raffino may no longer be recognizable: in particular, new collapses that occurred in the long lapse of time between the first and the second surveys may have rendered the internal divisions of some buildings illegible. Furthermore, even the presence of a greater or lesser quantity of vegetation might have affected the possibility of correctly interpreting the position of the structures in some sectors. Most of the structures have an average size of 15–20 m
2; there are a couple of larger structures measuring approximately 75–80 m
2 and some smaller ones of 4–6 m
2.
The identified structures are concentrated in the eastern part, where the flat area has a greater extension. Three groups of conglomerate structures and some scattered enclosures are recognizable. The most densely structured part coincides with the SE corner, a point from which it is possible to check part of the path coming from the south and the portion of the site that is at the foot of the two outcrops. In addition to the buildings, it was also possible to map a series of rocks with mortars, whose position had been recorded with a handheld GPS by Williams during her campaigns. It is interesting to note that the Raffino map indicated an area where 23 mortars were visible in the NW sector and that, in the same area, a group of 5 rocks with a total of 23 mortars was recorded by Williams. Almost certainly, they correspond to the same group of mortars. In addition to these, Williams recorded other 16 rocks with mortars.
This type of evidence is also present on Pukara 2, albeit to a lesser extent. A total of 16 mortars were recorded and detected. Three mortars were found on a stone, which is part of the structure wall, C7; all the others were on isolated stones. The top surface of Pukara 2 has an extension of approximately 6780 m2. A total of 15 structures were identified and surveyed on Pukara 2: 12 have a sub-circular plan and the 3 northernmost ones have a sub-rectangular plan with rounded corners. The structures occupy the NE portion of the top flat area, offering a good view over the area beneath and the northern part of the valley, toward the valley of La Hoyada. The average size of the structures is 10 m2; the smallest structures measure 4–6 m2 and the largest 20–25 m2.
4.3. Hiding, Showing, Making Invisible: Visibility Analysis Results
The analysis shows significant differences when visibility from Pukara 1 and 2 are compared, since Pukara 1 allows the control of a vast southern sector not reachable from an observer located in Pukara 2.
From Pukara 1 is possible to enjoy a great control over the entire southern portion of the valley, that is, where the
cuenca is wide open and is more visible and accessible, as well as over the confluence of the rivers. Southward, even the Pukara of Mayuko, most probably built during the same period, can be seen
Figure 2 [
37]. Northward, the view spans over a good part of the La Hoyada Valley up to an archaeological site known as LH 17. Numerous archaeological sites from various epochs soar in this area [
28]. Likewise, both
pukaras of Tacuil can be seen from many of the sites of La Hoyada: they stand out distinctly as two geo-symbols of great importance in this territory.
The visibility analysis at local scale revealed the mutual visibility between Pukara 1 and 2 while the structures placed on them, in their original settings, are not visible by observers located in the surrounding areas at lower altitudes (see, for instance, the valley where the site of Tacuil was settled).
Things change when one considers an observer placed along the external perimeter of the top of Pukara 1 of Tacuil. From this position, one can observe all the structures located in the lower portion of the site. It is interesting to notice that visibility is limited to the sole external perimeters of the pukaras, whether from below looking up or from up looking down. Since the structures are grouped in the central part of the hilltop pukaras, it was not possible to understand how many structures (or how many people) were present on either hilltop site from the fences in the Lower Hamlet. At such a level of detail, the visibility analysis can only be performed over areas covered by the UAV flights and derived elevation model. Thus, the photogrammetric flight by UAVs must be carefully designed depending on the extent of the visibility analysis and depending on the theoretical question we want to solve. In our particular case, to achieve a reliable, 3D, fine representation of archaeological features, the flight altitude and image density had to be properly designed. In addition, a camera able to reach the wanted ground resolution of the photogrammetric products was also used.
5. Conclusions
The topographic survey and the use of UAV enabled us to obtain a faithful, measurable, and objective representation of the Tacuil archaeological complex and its neighborhood, and to reach portions of the site that it would otherwise be difficult to examine with cumbersome equipment, given their arduous access. This work also highlights that the use of drones is extremely useful in archaeological contexts of multi-component sites with archaeological features scattered in an extremely vertical and “mimetic” landscape. In a relatively short time, it was possible to obtain a large set of multiscale data.
We also demonstrated that the terrestrial photogrammetry, combined with the aerial photogrammetry, is very effective in order to perform a visibility analysis.
Among the various possible outputs, we decided to rely on the model generated by topographic surveys to carry out multiscale visibility analyses, since these are particularly relevant to debate and assess some of the possible functions of the Tacuil Pukaras. As said above, the two pukaras are imposing structures that can be seen from a far distance (even miles), both southward and northward, which was verified during our on-site inspections in the La Hoyada Valley. Today, any archaeologist with minimum expertise in this Andean area knows that the probability of finding structures identifiable as pukaras in the plateaus of the Calchaquí area is quite high. This might have been ever more evident for the populations living in that area in the pre-Hispanic era who, most probably, alternated periods of war with periods of peace and commercial trade. Instead, the questions of how many dwellers inhabited those settlements, whether they were ready to face an enemy attack, or how many resources were stored to withstand an enemy attack, was less predictable and, accordingly, those settlements were strategically important. For example, in Tacuil, where the structures were concentrated in the inner portion of the hilltop settlements, an enemy could not figure out how many people were present in a specific moment inside the two strongholds, even when approaching the site, and this would guarantee a remarkable strategic advantage to its dwellers. Our analysis thus confirmed the strategic importance of the settlement pattern adopted in Tacuil.
However, beyond their defensive function, the Tacuil Pukaras also probably served as important geo-symbols, widely recognized by the local population as multi-functional fortresses, literally dominating—physically and symbolically—the surroundings areas. This may explain why they were also inhabited in periods of peace and why they continued to be developed in terms of economic activities. In fact, the investigations carried out in Pukara 1 of Tacuil showed that many daily operations were carried out inside this type of settlement, including grain processing [
28,
38].
The Tacuil complex is a very peculiar site, and this study was designed specifically to solve its interpretation problems. However, while some approaches we adopted were highly customized, the wider application of such an approach should be considered every time a multi-scale analysis can help the interpretation of archaeological features in a complex, socially constructed landscape.
Author Contributions
Conceptualization, C.O., E.B. and F.M.; methodology, P.R. and F.M.; investigation, C.O., E.B., F.M. and V.W.; data curation, P.R. and F.M.; writing—original draft preparation, C.O., E.B., P.R. and F.M.; writing—review and editing, all authors; supervision, F.M.; project administration, C.O.; funding acquisition, C.O. and V.W. All authors have read and agreed to the published version of the manuscript.
Funding
This work was supported by the Italian Ministry of Foreign Affair and Museo delle Culture of Milan; by Consejo Nacional de Investigaciones Científicas y Técnicas grants PIP 2011/0059 and PIP 2015/0379; and by Agencia Nacional de Promoción Científica y Tecnológica (ANPCyT)grants PICT 2013/0042 and 2018/02005.
Acknowledgments
Rafael Jorge Ocampo (Eng.) supported the GNSS and photogrammetric. The Diaguita-Calchaqui local community provided logistic facilities and general support to the campaigns.
Conflicts of Interest
The authors declare no conflict of interest.
References
- Westoby, M.J.; Brasington, J.; Glasser, N.F.; Hambrey, M.J.; Reynolds, J.M. Structure-from-Motion’ Photogrammetry: A Low-Cost, Effective Tool for Geoscience Applications. Geomorphology 2012, 179, 300–314. [Google Scholar] [CrossRef] [Green Version]
- James, M.R.; Robson, S.; d’Oleire-Oltmanns, S.; Niethammer, U. Optimising UAV Topographic Surveys Processed with Structure-from-Motion: Ground Control Quality, Quantity and Bundle Adjustment. Geomorphology 2017, 280, 51–66. [Google Scholar] [CrossRef] [Green Version]
- Rossi, P.; Mancini, F.; Dubbini, M.; Mazzone, F.; Capra, A. Combining Nadir and Oblique UAV Imagery to Reconstruct Quarry Topography: Methodology and Feasibility Analysis. Eur. J. Remote Sens. 2017, 50, 211–221. [Google Scholar] [CrossRef] [Green Version]
- James, M.R.; Robson, S.; Smith, M.W. 3-D Uncertainty-Based Topographic Change Detection with Structure-from-Motion Photogrammetry: Precision Maps for Ground Control and Directly Georeferenced Surveys: 3-D Uncertainty-Based Change Detection for SfM Surveys. Earth Surf. Process. Landf. 2017, 42, 1769–1788. [Google Scholar] [CrossRef]
- Álvarez Larrain, A.; Greco, C.; Wynveldt, F. Introduction. In Political Landscapes of the Late Intermediate Period in the Southern Andes; Álvarez Larrain, A., Greco, C., Eds.; The Latin American Studies Book Series; Springer International Publishing: Cham, Switzerland, 2018; pp. 1–9. ISBN 978-3-319-76728-4. [Google Scholar]
- Carvajal-Ramírez, F.; Navarro-Ortega, A.D.; Agüera-Vega, F.; Martínez-Carricondo, P.; Mancini, F. Virtual Reconstruction of Damaged Archaeological Sites Based on Unmanned Aerial Vehicle Photogrammetry and 3D Modelling. Study Case of a Southeastern Iberia Production Area in the Bronze Age. Measurement 2019, 136, 225–236. [Google Scholar] [CrossRef]
- Pierdicca, R. Mapping Chimu’s Settlements for Conservation Purposes Using UAV and Close Range Photogrammetry. The Virtual Reconstruction of Palacio Tschudi, Chan Chan, Peru. Digit. Appl. Archaeol. Cult. Herit. 2018, 8, 27–34. [Google Scholar] [CrossRef]
- Ostrowski, W.; Hanus, K. Budget UAV Systems for the Prospection of Small- and Medium-Scale Archaeological Sites. Int. Arch. Photogramm. Remote Sens. Spat. Inf. Sci. 2016, 41, 971–977. [Google Scholar] [CrossRef] [Green Version]
- Vella, M.-A.; Ernenwein, E.G.; Janusek, J.W.; Koons, M.; Thiesson, J.; Sanchez, C.; Guérin, R.; Camerlynck, C. New Insights into Prehispanic Urban Organization at Tiwanaku (NE Bolivia): Cross Combined Approach of Photogrammetry, Magnetic Surveys and Previous Archaeological Excavations. J. Archaeol. Sci. Rep. 2019, 23, 464–477. [Google Scholar] [CrossRef]
- Farella, E.M.; Torresani, A.; Remondino, F. Quality features for the integration of terrestrial and UAV images. Int. Arch. Photogramm. Remote Sens. Spat. Inf. Sci. 2019, 2019, 339–346. [Google Scholar] [CrossRef] [Green Version]
- Carbonell-Rivera, J.P.; Estornell, J.; Ruiz, L.A.; Torralba, J.; López-Cortés, I.; Salazar, D. Comparación de medidas de Nerium oleander L. mediante medición clásica, láser escáner terrestre (TLS) e imágenes derivadas de drones (UAV). In Teledetección: Hacia una Visión Global del Cambio Climático; Ruiz, L.A., Estornell, J., Calle, A., Antuña-Sánchez, J.C., Eds.; Ediciones Universidad de Valladolid: Valladolid, Spain, 2019; pp. 81–84. [Google Scholar]
- Megarry, W.; Graham, C.; Gilhooly, B.; O’Neill, B.; Sands, R.; Nyland, A.; Cooney, G. Debitage and Drones: Classifying and Characterising Neolithic Stone Tool Production in the Shetland Islands Using High Resolution Unmanned Aerial Vehicle Imagery. Drones 2018, 2, 12. [Google Scholar] [CrossRef]
- Ruiz, M.; Albeck, M.E. El Fenómeno “Pucara” Visto Desde La Puna Jujeña. Estud. Atacameños 1997, 12, 75–87. [Google Scholar] [CrossRef] [Green Version]
- Farrington, I.; Moyano, R.; Díaz, G. El paisaje ritual en el Shincal de Quimivil. la importancia de los estudios arqueoastronómicos. In Una Capital Inka al Sur del Kollasuyu: El Shincal de Quimivil; Raffino, R., Iácona, L.A., Moralejo, R.A., Gobbo, J.D., Couso, M.G., Eds.; Ciudad Autónoma de Buenos Aires: Buenos Aires, Argentina, 2015; pp. 41–62. [Google Scholar]
- Rex González, A. Patrones de asentamiento incaico en una provincia marginal del imperio. Relac. De La Soc. Argent. De Antropol. 1980, 14, 63–82. [Google Scholar]
- Madrazo, G.B.; Ottonello, M.M. Tipos de Instalación Prehispánica En La Región de La Puna y Su Borde; Monografias (Museo Etnografico Municipal Damaso Arce); Museo Etnográfico Municipal Dámaso Arce: Olavarría, Argentina, 1966. [Google Scholar]
- Nielsen, A.E. Asentamientos, Conflicto y Cambio Social En El Altiplano de Lípez (Potosí). Rev. Española De Antropol. Am. 2002, 32, 179–205. [Google Scholar]
- Raffino, R.A. Poblaciones Indígenas En Argentina: Urbanismo y Proceso Social Precolombino; Universidad Nacional de La Plata. Facultad de Ciencias Naturales y Museo: La Plata, Argentina, 1991. [Google Scholar]
- Tarragó, M. Nueva Historia Argentina. In Chacras y Pukara. Desarrollos Sociales Tardíos; Tarragó, M., Ed.; Sudamericana: Buenos Aires, Argentina, 2000; pp. 257–300. [Google Scholar]
- Arkush, E. War, Chronology, and Causality in the Titicaca Basin. Lat. Am. Antiq. 2008, 19, 339–373. [Google Scholar] [CrossRef]
- Williams, V.I. Nuevos datos sobre las Quebradas altas del Calchaquí madio, Salta, noroeste de Argentina (NOA). Reprodicción local entre los siglos XI a XV. Rev. Del Mus. De La Plata 2019, 4, 183–208. [Google Scholar] [CrossRef]
- Williams, V.I.; Villegas, M.P.; Castellanos, M.C. Pukaras en el Valle Calchaquí medio (Salta, Argentina): Algunas respuestas a viejas preguntas. An. De Arquología Y Etnol. 2020, 75, 79–114. [Google Scholar]
- Baldini, L.N.; de Feo, C.A. Hacia un modelo de ocupación del Valle Calchaquí Central (Salta) durante los desarrollos regionales. Relac. De La Soc. Argent. De Antropol. 2000, 25, 75–98. [Google Scholar]
- Raffino, R.; Baldini, L. Sitios Arqueológicos del Valle Calchaquí Medio; Estudios de Arqueología: Buenos Aires, Argentina, 1983; pp. 3–4. [Google Scholar]
- Williams, V.I. Materialidad y prácticas agrícolas en el Calchaquí Medio, Salta, Argentina. In Personas, Cosas, Relaciones. Reflexiones Arqueológicas Sobre las Materialidades Pasadas y Presents; Acuto, F., Franco Salvi, V., Eds.; Ediciones Abya-Yala: Quito, Perù, 2015; pp. 35–76. [Google Scholar]
- Oyarzabal, M.; Clavijo, J.; Oakley, L.; Biganzoli, F.; Tognetti, P.; Barberis, I.; Maturo, H.M.; Aragón, R.; Campanello, P.I.; Prado, D.; et al. Unidades de vegetación de la Argentina. Ecol. Austral. 2018, 28, 40–63. [Google Scholar] [CrossRef] [Green Version]
- Williams, V.I. Formaciones sociales en el noroeste argentino. Variabilidad prehispánica en el surandino durante el Periodo de Desarrollos Regionales y el estado Inca. Rev. Haucaypata Investig. Arqueol. Del Tahuantinsuyo 2015, 4, 62–76. [Google Scholar]
- Orsini, C.; Williams, V.; Benozzi, E.; Lañe, K.; Castellanos, M.C. Proyecto arqueológico argentino-italiano en el sector medio del valle Calchaquí. Avances y perspectivas. Cuad. De Humanid. 2020, 32, 158–185. [Google Scholar]
- Villegas, M.P. Teledetección arqueológica en el valle Calchaquí medio (Salta, Argentina). In Tesis de Licenciatura. Manuscrito Sin Publicar; Facultad de Filosofía y Letras, Universidad de Buenos Aires: Buenos Aires, Argentina, 2006. [Google Scholar]
- Agüera-Vega, F.; Agüera-Puntas, M.; Martínez-Carricondo, P.; Mancini, F.; Carvajal, F. Effects of Point Cloud Density, Interpolation Method and Grid Size on Derived Digital Terrain Model Accuracy at Micro Topography Level. Int. J. Remote Sens. 2020, 41, 8281–8299. [Google Scholar] [CrossRef]
- Fonstad, M.A.; Dietrich, J.T.; Courville, B.C.; Jensen, J.L.; Carbonneau, P.E. Topographic Structure from Motion: A New Development in Photogrammetric Measurement: Topographic Structure from Motion. Earth Surf. Process. Landf. 2013, 38, 421–430. [Google Scholar] [CrossRef] [Green Version]
- Murtiyoso, A.; Grussenmeyer, P.; Börlin, N.; Vandermeerschen, J.; Freville, T. Open Source and Independent Methods for Bundle Adjustment Assessment in Close-Range UAV Photogrammetry. Drones 2018, 2, 3. [Google Scholar] [CrossRef] [Green Version]
- Haala, N.; Cavegn, S. High Density Aerial Image Matching: State-of-the-Art and Future Prospects. Int. Arch. Photogramm. Remote Sens. Spat. Inf. Sci. 2016, 41, 625–630. [Google Scholar] [CrossRef] [Green Version]
- Cigliano, E.M.; Raffino, R.A. Arqueología en la vertiente occidental del Valle Calchaquí medio. Relac. De La Soc. Argent. De Antropol. 1975, 9, 47–58. [Google Scholar]
- Williams, V.I. Informe de Actividades de Campo Realizadas en las Localidades de Tacuil y Gualfín; Presentado en el Museo de Antropología de Salta; Departamento de Molinos: Salta, Argentina: Salta, Argentina, 2017. [Google Scholar]
- Williams, V.I. El uso del espacio a nivel estatal. In El Hábitat Prehispánico: Arqueología de la Arquitectura y de la Construcción del Espacio Organizado; Albeck, M.E., Scattolin, M.C., Korstanje, M.A., Eds.; Facultad de Humanidades y Ciencias Sociales, Universidad Nacional de Jujuy: San Salvador de Jujuy, Argentina, 2010; pp. 77–114. [Google Scholar]
- Williams, V.I.; Villegas, M.P. Rutas y senderos prehispanicos como paisaje. Las quebradas altas del Valle Calchaqui Medio (Salta). Bol. Del Mus. Chil. De Arte Precolomb. 2017, 22, 71–94. [Google Scholar] [CrossRef] [Green Version]
- Villegas, M.P. Del Valle a la Puna: Articulación Social y Económica Entre los Poblados Prehispánicos Tardíos y los Asentamientos Inkas en la Quebrada de Angastaco (Valle Calchaquí Medio, Salta). Tesis Doctoral, Universidad de Buenos Aires, Buenos Aires, Argentina, 2015. [Google Scholar]
Figure 1.
(a) Location map of the study area, the rectangle encloses the extent investigated by UAV-based and terrestrial photogrammetry; (b) top view of a hamlet of Tacuil, long shadows point out some remains and the presence of only sparse and low vegetation; (c,d) panoramic views of the site, the two hilltops, the topography, and the surrounding vegetation.
Figure 2.
(a) Map of the Tacuil archaeological area; dashed polygons state the location and names of sites investigated within this study; (b) panoramic view of Pukara 1; (c) panoramic view of Pukara 2; (d) focus on Pukara 1 archaeological remains (frame extracted by panoramic UAV flight).
Figure 2.
(a) Map of the Tacuil archaeological area; dashed polygons state the location and names of sites investigated within this study; (b) panoramic view of Pukara 1; (c) panoramic view of Pukara 2; (d) focus on Pukara 1 archaeological remains (frame extracted by panoramic UAV flight).
Figure 3.
Acquired datasets: (a) UAV dataset (images and GCPs), representation of errors on GCPs after the orientation of acquired images; (b) ground dataset, example of images acquisition scheme and targets—GCPs positioning.
Figure 3.
Acquired datasets: (a) UAV dataset (images and GCPs), representation of errors on GCPs after the orientation of acquired images; (b) ground dataset, example of images acquisition scheme and targets—GCPs positioning.
Figure 4.
Workflow of data processing dived into field operations, photogrammetric processing, and GIS analysis steps.
Figure 4.
Workflow of data processing dived into field operations, photogrammetric processing, and GIS analysis steps.
Figure 5.
Sectors of the investigated areas as represented in the virtual model: (a) view of the textured 3D model obtained for the Tacuil area; (b,c) views of two structures in the lower hamlet documented through a ground photogrammetry approach.
Figure 5.
Sectors of the investigated areas as represented in the virtual model: (a) view of the textured 3D model obtained for the Tacuil area; (b,c) views of two structures in the lower hamlet documented through a ground photogrammetry approach.
Figure 6.
High resolution orthophoto (left) for the lower hamlet with interpretation of archaeological features. Digital elevation models of a couple of sectors belonging to Pukara 1 (right, below) and 2 (right, above) with visible, 3D, human-made structures.
Figure 6.
High resolution orthophoto (left) for the lower hamlet with interpretation of archaeological features. Digital elevation models of a couple of sectors belonging to Pukara 1 (right, below) and 2 (right, above) with visible, 3D, human-made structures.
Figure 7.
Visibility analysis performed on large extents with respect to Pukara 1 (left) and Pukara 2 (right) at distances of 8 km (yellow areas) and 15 km (orange areas), respectively.
Figure 7.
Visibility analysis performed on large extents with respect to Pukara 1 (left) and Pukara 2 (right) at distances of 8 km (yellow areas) and 15 km (orange areas), respectively.
Figure 8.
Visibility analysis at local scale, based on the high-resolution digital elevation models from the UAV photogrammetry. Red triangles labelled from 1 to 4 locate the points from which the analysis is carried out. Areas of visibility from the observation points are represented as grey polygons with transparencies.
Figure 9.
General map of the site with the structures mentioned in the text.
Figure 9.
General map of the site with the structures mentioned in the text.
| Publisher’s Note: MDPI stays neutral with regard to jurisdictional claims in published maps and institutional affiliations. |
© 2022 by the authors. Licensee MDPI, Basel, Switzerland. This article is an open access article distributed under the terms and conditions of the Creative Commons Attribution (CC BY) license (https://creativecommons.org/licenses/by/4.0/).


