
Mapping the Leaf Area Index of Castanea sativa Miller Using UAV-Based Multispectral and Geometrical Data
by
 , , , and
Luís Pádua
1,2,*,
Pamela M. Chiroque-Solano
1,2,
Pedro Marques
1 ,
,
Joaquim J. Sousa
3,4 and
Emanuel Peres
1,2,3 1
Centre for the Research and Technology of Agro-Environmental and Biological Sciences, University of Trás-os-Montes e Alto Douro, 5000-801 Vila Real, Portugal
2
Institute for Innovation, Capacity Building and Sustainability of Agri-Food Production, University of Trás-os-Montes e Alto Douro, 5000-801 Vila Real, Portugal
3
Engineering Department, School of Science and Technology, University of Trás-os-Montes e Alto Douro, 5000-801 Vila Real, Portugal
4
Centre for Robotics in Industry and Intelligent Systems (CRIIS), Institute for Systems and Computer Engineering, Technology and Science (INESC TEC), 4200-465 Porto, Portugal
*
Author to whom correspondence should be addressed.
Drones 2022, 6(12), 422; https://doi.org/10.3390/drones6120422
Submission received: 24 November 2022
/
Revised: 9 December 2022
/
Accepted: 11 December 2022
/
Published: 16 December 2022
(This article belongs to the Section Drones in Agriculture and Forestry)
Abstract
:Remote-sensing processes based on unmanned aerial vehicles (UAV) have opened up new possibilities to both map and extract individual plant parameters. This is mainly due to the high spatial data resolution and acquisition flexibility of UAVs. Among the possible plant-related metrics is the leaf area index (LAI), which has already been successfully estimated in agronomy and forestry studies using the traditional normalized difference vegetation index from multispectral data or using hyperspectral data. However, the LAI has not been estimated in chestnut trees, and few studies have explored the use of multiple vegetation indices to improve LAI estimation from aerial imagery acquired by UAVs. This study uses multispectral UAV-based data from a chestnut grove to estimate the LAI for each tree by combining vegetation indices computed from different segments of the electromagnetic spectrum with geometrical parameters. Machine-learning techniques were evaluated to predict LAI with robust algorithms that consider dimensionality reduction, avoiding over-fitting, and reduce bias and excess variability. The best achieved coefficient of determination () value of 85%, which shows that the biophysical and geometrical parameters can explain the LAI variability. This result proves that LAI estimation is improved when using multiple variables instead of a single vegetation index. Furthermore, another significant contribution is a simple, reliable, and precise model that relies on only two variables to estimate the LAI in individual chestnut trees.
1. Introduction
The leaf area index (LAI) is the most common parameter used to assess the conditions and development of plants. It can be generally defined as the ratio of total leaf surface area to ground surface area [1]. This crop-related parameter can be used to assess the nutrient supply and biomass [2] as well as to estimate several biological and physical processes [3] and is strongly correlated with the canopy structure [4]. Optical canopy instruments with a hemispherical view, linear photosynthetically active radiation (PAR) sensors, and digital hemispherical photography are among the most-used tools to retrieve accurate in situ indirect LAI measurements [5].
In turn, traditional direct LAI measurements made to trees in chestnut groves are destructive and time-consuming. Thus, the use of such ground-based instruments has obtained wide admission [6]. However, indirect LAI measurements, despite providing fast and less complex LAI estimations, are conducted below the canopy and in each tree. This level of detail depends on the measurement type. Therefore, this indirect process is still regarded as being laborious and time-consuming. Moreover, sometimes the whole chestnut grove is not covered, and the process becomes increasingly challenging when conducted over a longer span of time.
Remote sensing platforms can be used to acquire vegetation data with both high spatial and temporal resolution. That data can then be user to estimate several crop-related parameters [7]. Remote-sensed data and geographical information systems (GIS) are key in precision agriculture (PA) applications [8], as they not only provide decision support to farmers but also enable the retrieval or estimation of crop-related parameters in a fast, reliable, cost-effective and less-laborious manner [9].
Regarding LAI estimation from remote-sensed data, this is widely explored from different sensing platforms and sensors, using both direct and indirect LAI measurement approaches for validating remote-sensed acquisitions [10]. Different LAI models have been proposed in the literature for several satellite imagery platforms [11] and different crops, based on vegetation indices: vineyards and row crops [12,13], wheat and maize [13,14], mangrove forests [15], and for other species [13,16,17,18].
Some of these studies were based on empirical models using linear regression [12,18,19] or machine-learning approaches [20,21]. More recently, small-sized unmanned aerial vehicles (UAVs) brought the capability to acquire remote-sensed data from different sensors with high spatial resolution and good temporal flexibility [22]. Studies were performed using UAV-based imagery to correlate the LAI in vineyards [10,23,24,25,26], olives [27], wheat [28], maize [29,30], mangrove forests [15], and rice [31,32].
Similarly to other tree species, chestnut trees (Castanea sativa Mill.) can be affected by several biotic and abiotic phytosanitary issues that may influence the tree development and chestnut yield [33]. These issues inckude chestnut ink disease (Phytophthora cinnamomi Rands) [34], chestnut blight (Cryphonectria parasitica (Murr.) Barr.) [35], nutritional deficiencies [36], and the chestnut gall wasp (Dryocosmus kuriphilus Yasumatsu) [37,38]. Thus, it is important to monitor chestnut groves to assess the tree condition, thereby, preserving the health status and yield.
LAI equations for chestnut trees were already proposed [39]; they are based on the leaf length and width and provide almost perfect agreement. These equations were tested in different chestnut genotypes (for other trees, see Demirsoy et al. [40]). Within this context, LAI proved to be useful to assess a variety of thinning treatments at different periods [41,42,43], to monitor the effects of different plantation types and distinct climatic conditions [44,45], to monitor differences in chestnut coppaces (for timber production) at different plantation styles [46], to assess changes in abandoned chestnut groves [47], and to assess magnesium deficiencies [36].
While remote sensing platforms can be considered to provide data for decision support tools in chestnut groves, there is a surprisingly low number of studies addressing this when compared with other orchard trees [9]. Researchers have presented studies in which aerial imagery is used. For example, using manned aircraft to acquire small format aerial photography to assess chestnut ink disease and chestnut blight [48,49,50,51,52] as well as the general phytosanitary status of the chestnut trees [53]. Airborne low-density LIDAR data was used to estimate biomass [54]. Satellite data was used to assess canopy thinning responses using time-series vegetation indices from Landsat-8 and Sentinel-2 data [55].
Moreover, satellite imagery is also the basis to classify chestnut stands within a heterogeneous land plot [56] using high-resolution multispectral satellite data (WorldView 2 and 3). Regarding the use of UAVs, studies encompassing chestnut trees include the use of orthorectified UAV-based data to monitor the decline of chestnut trees [57,58], the automatic monitoring of chestnut trees and the estimation of tree geometrical parameters [59] for the multi-temporal analysis of chestnut stands, the estimation of pruning wood biomass, the extraction of the tree height and crown diameter from different UAV flight parameters [60], the estimation of phytosanitary issues [61], and the mapping of chestnut blight severity [62].
The main objective of this study is to evaluate the use of several individual tree parameters retrieved from aerial data acquired using an UAV to estimate the LAI in a chestnut grove. For this purpose, geometric parameters—the tree height, tree crown area and crown diameter—were extracted for each tree along with the mean value of several vegetation indices commonly used for PA applications [63]. A chestnut grove in the north of Portugal (a region with high chestnut production [64]) was used. Another goal is to assess the performance of each parameter driven from the UAV-based data for LAI estimation in different periods and when used individually or combined. The resulting analysis can be used as a new approach for LAI estimation and is a novel application to UAV-based remote sensing in chestnut trees monitoring.
2. Materials and Methods
2.1. Study Area Characterization and Field Measurements
The chestnut grove used in this study is located in northeastern Portugal (Figure 1, 41°22–42.8 N, 7°35–01.4 W, altitude 760 m). It is composed of by 46 chestnut trees, within a total of 52 trees (other six almond and peach trees). Regarding this study, field measurements were taken in the 2018 growing season.
Several measurements and observations were made to allow for a better understanding and characterization of these chestnut trees. Dendrometric measurements were conducted in July 2018. The tree crown diameter and tree height were used within this study’s scope. To measure H, a laser rangefinder (TruPulse 200, Laser Technology, Inc., Centennial, CO, USA) was used, with precision of ±20 cm (sufficient accuracy for measurements in this type of trees).
The same tool was used to obtain each tree canopy diameter. Two diameter measurements were taken for each tree. Moreover, the LAI was measured using the LAI-2200C Plant Canopy Analyzer (LI-COR Biosciences, Lincoln, NE, USA) using a view cap of 90°. For each tree, one measurement was taken outside the tree crown while facing direct sunlight. Another four measurements were taken within the tree crown (around each quadrant of the tree trunk). Individual tree LAI measurements were conducted three times: in August, September, and October 2018.
2.2. Multispectral Data Acquisition from Unmanned Aerial Vehicles
Multispectral imagery acquisition was performed using the Sequoia multispectral sensor (Parrot SA, Paris, France) coupled—through a custom mount—in a Phantom 4 (DJI, Shenzhen, China). With this setup, georeferenced 12.4 MP RGB imagery from the Phantom 4 native camera was acquired during flight missions, along with 1.2 MP single-band images of green (550 nm ± 40 nm), red (660 nm ± 40 nm), red-edge (RE) (735 nm ± 10 nm), and near-infrared (NIR, 790 nm ± 40 nm) bands of the multispectral sensor. Moreover, irradiance data was acquired during flight from a sensor positioned at the top of the UAV, and reflectance data was acquired using a calibration target. Both irradiance and reflectance data was used during radiometric calibration (see Section 2.3).
The flight campaigns were conducted in the 2018 growing season. Flight missions were performed to survey the chestnut grove and its surroundings. The images were acquired with 80% longitudinal overlap and 70% lateral overlap at a flight height of 60 m. Flight campaigns at 8 August, 25 September and 16 October 2018 were used, which corresponded to the chestnut maturation period and were at the same time as the LAI measurements taken in the field.
2.3. Data Processing
2.3.1. Photogrammetric Processing
The acquired UAV-based imagery was processed using Pix4Dmapper (Pix4D SA, Lausanne, Switzerland) to compute orthorectified raster products. RGB and multispectral data was processed into different projects. From the RGB imagery (approximately 0.03 m spatial resolution), orthophoto mosaics, digital surface models (DSMs), and digital terrain models (DTMs) were computed. From the multispectral data (0.06 m spatial resolution) and after radiometric calibration, reflectance maps computed for each band were used to compute several vegetation indices (Table 1).
These indices have been proposed in the literature to monitor variations in several biophysical parameters (the biomass, leaf pigments, and yield) [61,65]. It is important to be aware that data from both sensors are aligned to each other using clearly identifiable points through ground control points by relying on natural features and artificial targets within the survey area. The DSM and DTM are used to compute the canopy height model (CHM). This process is conducted by subtracting DTM altitude values from the DSM.

Table 1.
List of the vegetation indices used in this study.
| Vegetation Index | Equation | Reference |
|---|---|---|
| Normalized Difference Vegetation Index | [66] | |
| Green Normalized Difference Vegetation Index | [67] | |
| Green Red Vegetation Index | [68] | |
| Normalized Difference Red Edge | [69] | |
| Soil Adjusted Vegetation Index | [70] | |
| Renormalized Difference Vegetation Index | [71] | |
| Ratio Vegetation Index | [72] | |
| Normalized Difference Excess Near Infrared | [61] | |
| Normalized Difference Excess Red Edge | [61] |
G: Green; R: Red; RE: Red edge; N: NIR; L = 0.5; Gn = G/(G + R + RE + N); Rn = R/(G + R + RE + N); REn = RE/(G + R + RE + N); and Nn = N/(G + R + RE + N).
2.3.2. Individual Tree Crown Detection and Parameter Extraction
An individual tree crown segmentation and delineation method was employed for the tree parameter extraction. To achieve this, the method begins with pixel-wise analysis to separate vegetation belonging to chestnut trees from other elements (soil and undergrowth vegetation). Then, as the usual planting space results in connected tree crowns, a tree crown isolation procedure must be applied.
With every tree conveniently isolated, individual tree crown parameter extraction can take place. To achieve this, we used previously proposed methods [59,61]. To segment the chestnut tree vegetation, we used the NIR band and the CHM raster products to compute a binary mask of the chestnut grove. As reported in Pádua et al. [61], a locally adaptive threshold [73] was used to binarize the NIR band, and a 0.2 m threshold was applied to the CHM. After the computation of the NIR and CHM binary masks, both were merged to form a new mask with vegetation above the specified height.
The binary mask containing all tree vegetation was used to compute a distance transform based on the Euclidean distance transform [74]. In this way, to each non-zero pixel, a new value was assigned according to the distance to the closest zero value pixel, and the watershed transform [75] was applied to its complement image. This results in the previously connected tree crowns being individually separated with each cluster of pixels enabling the extraction of several parameters. For each tree, its crown diameter, area, and height (the maximum CHM value within the tree cluster) were extracted along with the mean value of each vegetation index (Table 1).
2.4. Data Analysis
The R 4.2.0 environment [76] was used to implement the data analysis performed in this study. Individual tree LAI values over time were analyzed. An exploratory comparison analysis of variance and Tukey’s honest significance test were implemented to understand the difference in the observed LAI values by month when using the aerial imagery extracted parameters. LAI values were fitted and predicted by applying well-known machine-learning approaches from the caret package, version. 6.0-93 [77]. A cross-validation analysis was performed to evaluate the predictor quality by applying the metrics package, ver. 0.1.4 [78].
To assess how close the estimated LAI values were to the observed LAI, the goodness-of-fit statistics root mean square error (RMSE), coefficient of determination (), and mean absolute error (MAE) were obtained. Moreover, the estimated tree height and crown diameter were also compared with the field measurements. To recover the predicted LAI value, an equation was developed based on fitting the multiple linear model (1) using a leap-backward algorithm.
where follows the Gaussian distribution with a zero mean and as the variance; .
3. Results
3.1. Data Characterization
The highest observed LAI values were obtained at the final stage in October with mean, minimum, and maximum values of 2.02, 0.13, and 4.21, respectively. For August and September, the mean LAI values were around 1.5, the minimum values were 0.14, and the maximum values were approximately 3.5. According to the coefficient of variation of LAI that varied about 50%, and the q0.975–q0.25 amplitude, the LAI values for all periods were not homogeneous—in particular, for August and September (Table 2).
The density distribution of the LAI variable varying from 0.10 to 4.21 m is presented in Figure 2a. There are two peaks, around 1 and 2.5 m, thereby, indicating bi-modality. The LAI distribution demonstrated asymmetry with a heavy tail for high values. This bi-modality is more evident from September 2018. The spatial distribution of the LAI values within the chestnut grove are presented in Figure 2b.
Regarding the differences in the LAI values by month, we calculated the Tukey multiple comparisons of means with a 95% family-wise confidence level. The confidence level for the difference between September and August is , for October and August is , and for October and September is . These outputs indicate that the mean levels of the LAI values for August, September, and October are not different since the zero value is contained within the confidence intervals.
3.2. Tree Height and Crown Diameter Estimation
To assess the viability of using individual tree geometric parameters, the linear relationships of the tree height and crown diameter were evaluated. These results are presented in Figure 3. The agreement between ground-truth data and the automatically estimated values using the UAV-based data where high. The estimated height values, calculated from the CHM, ranged 0.2 to 7.5 m with a mean value of 5 m. The linear regression presents an = 0.93 and an RMSE of 0.99 m (Figure 3a).
When referring to the ground-truth data, differences of –0.8, –1.5, and –0.6 m were verified, respectively, for the mean, minimum, and maximum values. Moreover, the absolute mean difference was 0.85 m. Regarding the tree crown diameter (Figure 3b), the mean value was 5.3 m, and the estimates ranged from 0.9 to 7.8 m with an = 0.91 and an RMSE of 0.55 m. With the differences in the mean, minimum and maximum values observed in-field at –0.3, 0.4, and –0.2 m, an absolute mean difference of 0.45 m was observed.
3.3. Leaf Area Index: Single Variable Correlation
To evaluate the relationships between the LAI and each estimated UAV-based biophysical and geometrical parameter (used as predictors), the Pearson correlation coefficient was calculated. All these interactions displayed significant and positive coefficients as presented in Table 3. The highest correlation with log(LAI) was obtained by the GNDVI. This was verified in the evaluated periods (September ans October using all values) except for August. These linear correlations were positive and strong in September. The results also showed that the NDExRE reported the second strongest correlation with the log(LAI). This interaction achieved a higher value in September 2018. The same occurred with the NDVI, tree crown area, tree height, RVI, NDExNIR, tree crown diameter, GRVI, and NDRE. RDVI interaction achieved a higher value in October 2018, and the same occurred with the SAVI.
Non-linear correlations were also explored. Figure 4 displays the trends between LAI and the different predictor variables along with their equations for each period. Second-degree polynomial linear regressions by month achieved higher explained variance. Regarding the performance of each month, RVI obtained the best performance in August (), followed by NDExNIR, NDVI, RDVI, and the tree crown area (). In September, GNDVI reached , followed by NDExNIR () and tree crown area (). For October, the GNDVI also provided the best performance (), followed by NDExNIR and SAVI both with . Moreover, the parameters GNDVI, NDExNIR, NDExRE, and NDVI obtained 0.73 for all months.
3.4. Leaf Area Index Estimation Based on Regression Modeling Strategies with Dimensionality Reduction
Regression model training was conducted to obtain LAI prediction values. Thirty four models were implemented using the vegetation indices and geometry parameters as predictors. Thirty percent of the data were randomly selected and removed from the training procedures to assess the prediction accuracy with reduced bias. The goodness-of-fit summaries are shown in Table 4 for the models with . The Relevance Vector Machine with Polynomial Kernel (rvmPoly) is an extension of Support Vector Machine (SVM) that considers a Bayesian treatment of a generalized linear model of identical functional form to the SVM [79].
The rvmPoly achieved the highest value (0.833) with a 0.273 MAE and an RMSE of 0.343. The robust Bayesian Regularized Neural Network model also reached good performance (), the smallest MAE (), and an RMSE of 0.348. This kind of regression models converts a nonlinear regression into a “well-posed” statistical problem in the manner of a ridge regression by applying the Bayesian regularization process [80]. The linear model with leap backward incorporates a leap step that chooses the best set of variables in the selection model performance. This model obtained an RMSE of 0.367, , and an MAE of .
The same value of MAE and an equivalent but higher RMSE values (0.373) were obtained by the Spike and Slab Regression model. This is a linear regression model following a Bayesian approach considering a specific hierarchical prior distribution [81]. Several other regression models obtained an as in the case of the Cubist regression tree technique, projection pursuit regression, booted regression tree, ridge regression, Bayesian regression lass, elastic net, and lm with forward. The remainder models obtained .
The predicted LAI values for those models had the highest adjusted values compared with their respective field observations, and a graphical representation is presented in Figure 5. The highest was obtained using Bayesian Regularized Neural Network regression (Figure 5b) followed by the linear model with leap backward (Figure 5c), both with .
To illustrate the leap backward selection algorithm performance, the multiple linear regression model shown in Section 2.4 was implemented. The output indicates that the tree crown area (Area), NDExRE, and NDRE are adequate predictors. The adjusted for the reduced model was 0.85 with a residual standard error of 0.39 (p-value: <2.2 × ). On the other hand, when considering the combination of the tree crown area and GNDVI, the adjusted for the reduced model was 0.84, and its residual standard error was 0.36 (p-value: <2.2 × ). The final linear equations to estimate the LAI are given in (2) and (3).
With the different approaches explored in this study, it is possible to provide the capability to obtain LAI estimations through UAV-based parameter(s). The implementation of different approaches was conducted, and the results are presented in Figure 6. When compared with the ground-truth (Figure 2b), the estimated LAI values and the observed ones demonstrated high correlation values. Most LAI estimations are within the same range of values—particularly in the results from the equations proposed based on the leap backward selection algorithm (2) and (3), which show similar overall results (Figure 6b,c).
4. Discussion
The LAI values registered in this study (Table 2 and Figure 2), varied between 0.10 (August) and 4.21 (October). Such amplitude is justified with the fact that some trees were planted more recently. This is also corroborated with the tree crown diameter and tree height data (Figure 3). A similar trend was verified in Covone et al. [45], where the LAI values ranged between 0.18 and 5.00 for one year old and 12 year old stands, respectively. The mean LAI values in August, September, and October were, respectively, 1.58, 1.66, and 2.02 (Table 2). Similar variations were also reported in Portela et al. [36], where the authors obtained LAI values of 2.04, 1.53, and 0.97, respectively, for healthy trees and for trees with slight and acute leaf chlorosis symptoms.
Gondard et al. [47] found a lower mean LAI (2.1) in cultivated groves, while a higher value was observed in abandoned groves (4.2). In chestnut coppices, Prada et al. [55] reported mean LAI values between 1.57 and 2.78, while Cutini et al. [43] obtained mean LAI values of 5.3 and 4.7 for control and thinned chestnut coppices. The temporal differences observed in the monitored trees were justified with the fruit set maturation process, which accounts for the higher occupation area and changes in the tree crown and leaf fall (there were even cases of broken tree branches due to high winds).
The UAV-based estimates of the tree crown diameter and height revealed a good agreement with the field-measured values (Figure 3) and were in accordance with previous works [59,60]. Thus, these parameters alongside the tree crown projected area are suitable to be used given the high correlation. This advantage guarantees additional information for data fusion with the vegetation indices as full explanations. According to Wu et al. [26], the combination of UAV-based multi-sensor synchronous observation data products can bring higher accuracy in the prediction process.
Several regression methods to estimate the LAI in chestnut trees were explored using the different parameters derived from UAV-based data. From the UAV-based extracted metrics, it was possible to conduct LAI estimation using a single parameter. It can be said that the best performance was achieved by GNDVI (Table 3 and Figure 4), exceeding the performance of the commonly used NDVI. For instance, the exploratory chestnut LAI regression previously conducted in Pádua et al. [82] showed a positive correlation in the individual tree height, crown area, and mean NDVI, with values of 0.51, 0.64, and 0.76, respectively.
In that study, the reported results demonstrated that the mean NDVI exponentially fit the LAI data, showing saturation in trees with higher LAI values when the NDVI values were slightly above 0.8. Saturation effects were also observed in the plot-level LAI estimation of a mangrove forest [15] but with high values (0.817). In other studies, different vegetation indices also provided good performance as in the case of the visible atmospherically resistant index (VARI) [83] in Li et al. [31] ( 0.76); the enhanced vegetation index (EVI) [84] that outperformed NDVI, OSAVI, GNDVI, EVI2, and MSAVI2 in Peng et al. [29] ( 0.877); the enhanced vegetation index 2 (EVI2) [85], which outperformed SAVI, NDVI, and Sentinel-2 LAI [11]; and the modified chlorophyll absorption ratio index (MCARI2) [86] in Prada et al. [55] with values between 0.61 and 0.75 (RMSE between 0.20 and 0.24).
Among the three geometric parameters included in this study, the chestnut tree crown area revealed the best performance. Moreover, when combined, vegetation indices using red edge (NDExRE and NDRE) along with the tree crown area provided the highest contribution (Figure 6). On the other hand, as the red edge band is not broadly available in most sensors and as it can be easier to find sensors that can acquire the NIR and green parts of the electromagnetic spectrum (e.g., RGB cameras modified to acquire NIR), another equation is presented (3) based on the tree crown area and GNDVI.
For maize, Qiao et al. [30] reported that the combined use of geometrical parameters (the canopy height, canopy coverage, and canopy volume) along with vegetation indices (NDVI and VARI) improved the dynamic LAI estimation using partial least squares regression. For rice, in Gong et al. [32], the models relying only on a single vegetation index presented problems when working with different phenological stages; however, when combining them with height values, an improvement was verified as the RMSE decreased. Moreover, the use of multiple measurement periods aided the stability. Improvements were verified in LAI modeling for rice [32] and maize [30] when using LAI measurements throughout the season and UAV-based vegetation indices.
The use of different regression models (Table 4) improved the overall accuracy (Figure 5) when compared with the single use of UAV-based parameters with a high accuracy ( and an RMSE of 0.34). This was also revealed in other studies. Li et al. [31] used different indices computed from UAV-based RGB imagery to evaluate different approaches (simple linear regression, multiple linear regression, principal component regression, partial least squares regression, random forest, and support vector machine) to estimate the LAI with improvements when using machine learning. These were verified with random forest presenting the highest performance ( = 0.84 and RMSE of 0.84).
Vélez et al. [24] applied k-means clustering and random forest to detect shadowed areas in a vineyard with an and RMSE of 0.16 for the LAI. Ilniyaz et al. [25] estimated the LAI in pergola-trained vineyards through the use of vegetation indices to train five machine-learning models (support vector regression, random forest, partial least square, gradient boosting, and K-nearest neighbors) and an ensemble model that used the five models as base learners. The ensemble model outperformed the machine learning models with an and an RMSE of 0.434 using multispectral indices, while lower performance was obtained using RGB vegetation indices ( and RMSE of 0.547).
Despite the obtained results, other approaches could be explored in the future using only UAV-based RGB imagery as the case of the analysis of projected shadows to estimate the LAI. Such methods can be explored in flights with certain solar angles (similar to Vélez et al. [24]). Another alternative is to use indices computed from the red, green, and blue bands (RGB) as a cost-effective approach for LAI estimation [31], despite studies reporting that multispectral indices have shown higher correlations than the ones computed from RGB imagery [25]. Moreover, UAV-based LAI estimation can be used to evaluate the temporal effects of Dryocosmus kuriphilus on chestnut tree branches and, consequently, their growth [38] and can be used for yield estimation [29]. The use of hyperspectral imagery [87,88] should also be considered, as it can allow the exploration of different parts of the electromagnetic spectrum.
5. Conclusions
In this study, several regression methods to estimate the the LAI in chestnut trees were presented following a non-destructive approach using high-resolution aerial multispectral and geometrical data. In this way, depending on the available data (geometrical, multispectral, or both), the LAI was estimated to assess different aspects of chestnut trees from their overall health status or as a yield indicator. The monthly changes in the observed LAI values were examined using the Tukey post hoc test.
The Tukey multiple comparisons considering a 95% confidence interval confirmed the homogeneous dispersion of samples between months. Moreover, the geometry indicators (the crown area, diameter, and tree height) fit the LAI values satisfactorily. On the other hand, following the linear model with the selection leap backward, the tree crown area indicator showed superior performance in predicting the LAI along with NDRE and NDExRE or with GNDVI.
The findings reported in this study indicated that the second-degree polynomial linear regressions by month fit the LAI values satisfactorily. However, this approach does not contemplate characteristics such as multicollinearity, high variability, and bias in the estimation procedure that could be present when modeling multiple vegetation indices and geometric variables as predictors. The evaluated algorithms that contained robust ensemble meta-Bayesian approaches that incorporate regularization techniques to prevent overfitting were preferred, and they showed suitable performance. The techniques that we used are easy to understand and can potentially be applied to other areas with agricultural structures that are similar to chestnut tree planting.
Author Contributions
Conceptualization, L.P.; methodology, L.P. and P.M.C.-S.; software, L.P., P.M.C.-S. and P.M.; validation, L.P. and P.M.C.-S.; formal analysis, P.M.C.-S.; investigation, L.P., P.M.C.-S. and P.M.; resources, J.J.S., E.P. and P.M.; data curation, L.P. and P.M.C.-S.; writing—original draft preparation, L.P. and P.M.C.-S.; writing—review and editing, E.P. and J.J.S.; visualization, L.P. and P.M.C.-S.; supervision, L.P., E.P. and J.J.S.; project administration, L.P.; funding acquisition, E.P. and J.J.S. All authors have read and agreed to the published version of the manuscript.
Funding
This research activity was supported by National Funds from the FCT-Portuguese Foundation for Science and Technology under the projects UIDB/04033/2020 and LA/P/0126/2020.
Data Availability Statement
The data that support the findings of this study are available from the corresponding author upon reasonable request.
Acknowledgments
The authors would like to thank to the owner of the chestnut grove for the authorization to conduct this study.
Conflicts of Interest
The authors declare no conflict of interest. The funders had no role in the design of the study; in the collection, analyses, or interpretation of data; in the writing of the manuscript; or in the decision to publish the results.
Abbreviations
The following abbreviations are used in this manuscript:
| UAV | unmanned aerial vehicle |
| LAI | leaf area index |
| PAR | photosynthetically active radiation |
| GIS | geographical information systems |
| PA | precision agriculture |
| SNIG | National Geographic Information System |
| NIR | near infrared |
| DSM | digital surface model |
| DTM | digital terrain model |
| CHM | canopy height model |
| NDVI | Normalized Difference Vegetation Index |
| GNDVI | Green Normalized Difference Vegetation Index |
| GRVI | Green Red Vegetation Index |
| NDRE | Normalized Difference Red Edge |
| SAVI | Soil Adjusted Vegetation Index |
| RDVI | Renormalized Difference Vegetation Index |
| RVI | Ratio Vegetation Index |
| NDExNIR | Normalized Difference Excess Near Infrared |
| NDExRE | Normalized Difference Excess Red Edge |
| RMSE | root mean square error |
| MAE | mean absolute error |
| coefficient of determination | |
| r | Pearson correlation coefficient |
| rvmPoly | Relevance Vector Machines with Polynomial Kernel |
| SVM | Support Vector Machine |
| VARI | Visible Atmospherically Resistant Index |
| EVI | Enhanced Vegetation Index |
| EVI2 | Enhanced Vegetation Index 2 |
| MCARI2 | Modified Chlorophyll Absorption Ration Index 2 |
References
- Watson, D.J. Comparative physiological studies on the growth of field crops: I. Variation in net assimilation rate and leaf area between species and varieties, and within and between years. Ann. Bot. 1947, 11, 41–76. [Google Scholar] [CrossRef]
- Song, C. Optical remote sensing of forest leaf area index and biomass. Prog. Phys. Geogr. 2013, 37, 98–113. [Google Scholar] [CrossRef]
- Doughty, C.E.; Goulden, M.L. Seasonal patterns of tropical forest leaf area index and CO2 exchange. J. Geophys. Res. Biogeosci. 2008, 113. [Google Scholar] [CrossRef] [Green Version]
- Chason, J.W.; Baldocchi, D.D.; Huston, M.A. A comparison of direct and indirect methods for estimating forest canopy leaf area. Agric. For. Meteorol. 1991, 57, 107–128. [Google Scholar] [CrossRef]
- Nilson, T. A theoretical analysis of the frequency of gaps in plant stands. Agric. Meteorol. 1971, 8, 25–38. [Google Scholar] [CrossRef]
- Bréda, N.J. Ground-based measurements of leaf area index: A review of methods, instruments and current controversies. J. Exp. Bot. 2003, 54, 2403–2417. [Google Scholar] [CrossRef] [Green Version]
- Berni, J.; Zarco-Tejada, P.; Suarez, L.; González-Dugo, V.; Fereres, E. Remote sensing of vegetation from UAV platforms using lightweight multispectral and thermal imaging sensors. Int. Arch. Photogramm. Remote Sens. Spat. Inform. Sci. 2009, 38, 6. [Google Scholar]
- Sishodia, R.P.; Ray, R.L.; Singh, S.K. Applications of remote sensing in precision agriculture: A review. Remote Sens. 2020, 12, 3136. [Google Scholar] [CrossRef]
- Pádua, L.; Adão, T.; Hruška, J.; Sousa, J.J.; Peres, E.; Morais, R.; Sousa, A. Very high resolution aerial data to support multi-temporal precision agriculture information management. Procedia Comput. Sci. 2017, 121, 407–414. [Google Scholar] [CrossRef]
- White, W.A.; Alsina, M.M.; Nieto, H.; McKee, L.G.; Gao, F.; Kustas, W.P. Determining a robust indirect measurement of leaf area index in California vineyards for validating remote sensing-based retrievals. Irrig. Sci. 2019, 37, 269–280. [Google Scholar] [CrossRef]
- Mourad, R.; Jaafar, H.; Anderson, M.; Gao, F. Assessment of leaf area index models using harmonized landsat and sentinel-2 surface reflectance data over a semi-arid irrigated landscape. Remote Sens. 2020, 12, 3121. [Google Scholar] [CrossRef]
- Johnson, L.; Roczen, D.; Youkhana, S.; Nemani, R.; Bosch, D. Mapping vineyard leaf area with multispectral satellite imagery. Comput. Electron. Agric. 2003, 38, 33–44. [Google Scholar] [CrossRef]
- Kang, Y.; Özdoğan, M.; Zipper, S.C.; Román, M.O.; Walker, J.; Hong, S.Y.; Marshall, M.; Magliulo, V.; Moreno, J.; Alonso, L.; et al. How universal is the relationship between remotely sensed vegetation indices and crop leaf area index? A global assessment. Remote Sens. 2016, 8, 597. [Google Scholar] [CrossRef] [Green Version]
- González Piqueras, J. Evapotranspiración de la Cubierta Vegetal Mediante la Determinación del Coeficiente de Cultivo por Teledetección. Extensión a Escala Regional: Acuífero 08.29 Mancha Oriental; Facultat de Física, Universitat de València: Barcelona, Spain, 2006. [Google Scholar]
- Tian, J.; Wang, L.; Li, X.; Gong, H.; Shi, C.; Zhong, R.; Liu, X. Comparison of UAV and WorldView-2 imagery for mapping leaf area index of mangrove forest. Int. J. Appl. Earth Obs. Geoinf. 2017, 61, 22–31. [Google Scholar] [CrossRef]
- Myneni, R.B.; Ramakrishna, R.; Nemani, R.; Running, S.W. Estimation of global leaf area index and absorbed PAR using radiative transfer models. IEEE Trans. Geosci. Remote Sens. 1997, 35, 1380–1393. [Google Scholar] [CrossRef] [Green Version]
- Pôças, I.; Paço, T.A.; Cunha, M.; Andrade, J.A.; Silvestre, J.; Sousa, A.; Santos, F.L.; Pereira, L.S.; Allen, R.G. Satellite-based evapotranspiration of a super-intensive olive orchard: Application of METRIC algorithms. Biosyst. Eng. 2014, 128, 69–81. [Google Scholar] [CrossRef] [Green Version]
- Pasqualotto, N.; Delegido, J.; Van Wittenberghe, S.; Rinaldi, M.; Moreno, J. Multi-crop green LAI estimation with a new simple Sentinel-2 LAI Index (SeLI). Sensors 2019, 19, 904. [Google Scholar] [CrossRef] [Green Version]
- Sun, L.; Gao, F.; Anderson, M.C.; Kustas, W.P.; Alsina, M.M.; Sanchez, L.; Sams, B.; McKee, L.; Dulaney, W.; White, W.A.; et al. Daily mapping of 30 m LAI and NDVI for grape yield prediction in California vineyards. Remote Sens. 2017, 9, 317. [Google Scholar] [CrossRef] [Green Version]
- Chen, Z.; Jia, K.; Xiao, C.; Wei, D.; Zhao, X.; Lan, J.; Wei, X.; Yao, Y.; Wang, B.; Sun, Y.; et al. Leaf area index estimation algorithm for GF-5 hyperspectral data based on different feature selection and machine learning methods. Remote Sens. 2020, 12, 2110. [Google Scholar] [CrossRef]
- Wang, T.; Xiao, Z.; Liu, Z. Performance evaluation of machine learning methods for leaf area index retrieval from time-series MODIS reflectance data. Sensors 2017, 17, 81. [Google Scholar] [CrossRef] [Green Version]
- Pajares, G. Overview and current status of remote sensing applications based on unmanned aerial vehicles (UAVs). Photogramm. Eng. Remote Sens. 2015, 81, 281–330. [Google Scholar] [CrossRef]
- Kalisperakis, I.; Stentoumis, C.; Grammatikopoulos, L.; Karantzalos, K. Leaf area index estimation in vineyards from UAV hyperspectral data, 2D image mosaics and 3D canopy surface models. Int. Arch. Photogramm. Remote Sens. Spat. Inf. Sci. 2015, 40, 299. [Google Scholar] [CrossRef] [Green Version]
- Vélez, S.; Poblete-Echeverría, C.; Rubio, J.A.; Vacas, R.; Barajas, E. Estimation of Leaf Area Index in vineyards by analysing projected shadows using UAV imagery. OENO One 2021, 55, 159–180. [Google Scholar] [CrossRef]
- Ilniyaz, O.; Kurban, A.; Du, Q. Leaf Area Index Estimation of Pergola-Trained Vineyards in Arid Regions Based on UAV RGB and Multispectral Data Using Machine Learning Methods. Remote Sens. 2022, 14, 415. [Google Scholar] [CrossRef]
- Wu, S.; Deng, L.; Guo, L.; Wu, Y. Wheat leaf area index prediction using data fusion based on high-resolution unmanned aerial vehicle imagery. Plant Methods 2022, 18, 1–16. [Google Scholar] [CrossRef]
- Caruso, G.; Zarco-Tejada, P.J.; González-Dugo, V.; Moriondo, M.; Tozzini, L.; Palai, G.; Rallo, G.; Hornero, A.; Primicerio, J.; Gucci, R. High-resolution imagery acquired from an unmanned platform to estimate biophysical and geometrical parameters of olive trees under different irrigation regimes. PLoS ONE 2019, 14, e0210804. [Google Scholar] [CrossRef] [Green Version]
- Yao, X.; Wang, N.; Liu, Y.; Cheng, T.; Tian, Y.; Chen, Q.; Zhu, Y. Estimation of wheat LAI at middle to high levels using unmanned aerial vehicle narrowband multispectral imagery. Remote Sens. 2017, 9, 1304. [Google Scholar] [CrossRef] [Green Version]
- Peng, X.; Han, W.; Ao, J.; Wang, Y. Assimilation of LAI derived from UAV multispectral data into the SAFY model to estimate maize yield. Remote Sens. 2021, 13, 1094. [Google Scholar] [CrossRef]
- Qiao, L.; Gao, D.; Zhao, R.; Tang, W.; An, L.; Li, M.; Sun, H. Improving estimation of LAI dynamic by fusion of morphological and vegetation indices based on UAV imagery. Comput. Electron. Agric. 2022, 192, 106603. [Google Scholar] [CrossRef]
- Li, S.; Yuan, F.; Ata-UI-Karim, S.T.; Zheng, H.; Cheng, T.; Liu, X.; Tian, Y.; Zhu, Y.; Cao, W.; Cao, Q. Combining color indices and textures of UAV-based digital imagery for rice LAI estimation. Remote Sens. 2019, 11, 1763. [Google Scholar] [CrossRef] [Green Version]
- Gong, Y.; Yang, K.; Lin, Z.; Fang, S.; Wu, X.; Zhu, R.; Peng, Y. Remote estimation of leaf area index (LAI) with unmanned aerial vehicle (UAV) imaging for different rice cultivars throughout the entire growing season. Plant Methods 2021, 17, 1–16. [Google Scholar] [CrossRef] [PubMed]
- Martins, L.; Castro, J.P.; Gouveia, M.E. Biological control of chestnut blight in Portugal. In Proceedings of the II European Congress on Chestnut 1043, Debrecen, Hungary, 9–12 October 2013; pp. 51–56. [Google Scholar]
- Valverde, A.; González-Tirante, M.; Medina-Sierra, M.; Rivas, R.; Santa-Regina, I.; Igual, J.M. Culturable bacterial diversity from the chestnut (Castanea sativa Mill.) phyllosphere and antagonism against the fungi causing the chestnut blight and ink diseases. AIMS Microbiol. 2017, 3, 293. [Google Scholar] [CrossRef] [PubMed] [Green Version]
- Rigling, D.; Prospero, S. Cryphonectria parasitica, the causal agent of chestnut blight: Invasion history, population biology and disease control. Mol. Plant Pathol. 2018, 19, 7–20. [Google Scholar] [CrossRef] [PubMed] [Green Version]
- Portela, E.; Roboredo, M.; Louzada, J. Assessment and description of magnesium deficiencies in chestnut groves. J. Plant Nutr. 2003, 26, 503–523. [Google Scholar] [CrossRef]
- Aebi, A.; Schönrogge, K.; Melika, G.; Alma, A.; Bosio, G.; Quacchia, A.; Picciau, L.; Abe, Y.; Moriya, S.; Yara, K.; et al. Parasitoid recruitment to the globally invasive chestnut gall wasp Dryocosmus kuriphilus. In Galling Arthropods and Their Associates; Springer: Berlin/Heidelberg, Germany, 2006; pp. 103–121. [Google Scholar]
- Gehring, E.; Bellosi, B.; Quacchia, A.; Conedera, M. Assessing the impact of Dryocosmus kuriphilus on the chestnut tree: Branch architecture matters. J. Pest Sci. 2018, 91, 189–202. [Google Scholar] [CrossRef]
- Serdar, Ü.; Demirsoy, H. Non-destructive leaf area estimation in chestnut. Sci. Hortic. 2006, 108, 227–230. [Google Scholar] [CrossRef]
- Demirsoy, H. Leaf area estimation in some species of fruit tree by using models as a non-destructive method. Fruits 2009, 64, 45–51. [Google Scholar] [CrossRef] [Green Version]
- Tokár, F. Leaf area index (LAI), production and silvicultural practice in European chestnut (Castanea sativa Mill.) monocultures. Folia Oecologica 2004, 31, 111. [Google Scholar]
- Chianucci, F.; Macfarlane, C.; Pisek, J.; Cutini, A.; Casa, R. Estimation of foliage clumping from the LAI-2000 Plant Canopy Analyzer: Effect of view caps. Trees 2015, 29, 355–366. [Google Scholar] [CrossRef]
- Cutini, A. New management options in chestnut coppices: An evaluation on ecological bases. For. Ecol. Manag. 2001, 141, 165–174. [Google Scholar] [CrossRef]
- Tokár, F. Production of the aboveground dendromass of European chestnut (Castanea sativa Mill.) in relation to leaf area index and climatic conditions. Folia Oecologica 2005, 32, 116. [Google Scholar]
- Covone, F.; Gratani, L. Age-related physiological and structural traits of chestnut coppices at the Castelli Romani Park (Italy). Ann. For. Sci. 2006, 63, 239–247. [Google Scholar] [CrossRef] [Green Version]
- Manetti, M.; Pelleri, F.; Becagli, C.; Conedera, M.; Schleppi, P.; Zingg, A. Growth dynamics and leaf area index in chestnut coppices subjected to a new silvicultural approach: Single-tree-oriented management. In Proceedings of the II European Congress on Chestnut 1043, Debrecen, Hungary, 9–12 October 2013; pp. 121–128. [Google Scholar]
- Gondard, H.; Romane, F.; Grandjanny, M.; Li, J.; Aronson, J. Plant species diversity changes in abandoned chestnut (Castanea sativa) groves in southern France. Biodivers. Conserv. 2001, 10, 189–207. [Google Scholar] [CrossRef]
- Martins, L.M.; Lufinha, M.I.; Marques, C.P.; Abreu, C.G. Small format aerial photography to assess chestnut ink disease. For. Snow Landsc. Res 2001, 73, 357–360. [Google Scholar]
- Vannini, A.; Vettraino, A.; Fabi, A.; Montaghi, A.; Valentini, R.; Belli, C. Monitoring ink disease of chestnut with the airborne multispectral system ASPIS. In Proceedings of the III International Chestnut Congress 693, Chaves, Portugal, 20–23 October 2004; pp. 529–534. [Google Scholar]
- Ambrosini, I.; Gherardi, L.; Viti, M.L.; Maresi, G.; Turchetti, T. Monitoring diseases of chestnut stands by small format aerial photography. Geocarto Int. 1997, 12, 41–46. [Google Scholar] [CrossRef]
- Martins, L.; Castro, J.; Macedo, W.; Marques, C.; Abreu, C. Assessment of the spread of chestnut ink disease using remote sensing and geostatistical methods. Eur. J. Plant Pathol. 2007, 119, 159–164. [Google Scholar] [CrossRef]
- Castro, J.; Azevedo, J.; Martins, L. Temporal analysis of sweet chestnut decline in northeastern Portugal using geostatistical tools. In Proceedings of the I European Congress on Chestnut-Castanea 2009 866, Cuneo-Torino, Italy, 13–16 October 2009; pp. 405–410. [Google Scholar]
- Martins, L.; Castro, J.P.; Macedo, F.; Marques, C.; Abreu, C.G. Índices espectrais em fotografia aérea de infravermelho próximo na monitorização da doença tinta do castanheiro. In Proceedings of the 5º Congresso Florestal Nacional. SPCF-Sociedade Portuguesa de Ciências Florestais, Instituto Politécnico de Viseu, Viseu, Portugal, 16 May 2005. [Google Scholar]
- Montagnoli, A.; Fusco, S.; Terzaghi, M.; Kirschbaum, A.; Pflugmacher, D.; Cohen, W.B.; Scippa, G.S.; Chiatante, D. Estimating forest aboveground biomass by low density lidar data in mixed broad-leaved forests in the Italian Pre-Alps. For. Ecosyst. 2015, 2, 1–9. [Google Scholar] [CrossRef] [Green Version]
- Prada, M.; Cabo, C.; Hernández-Clemente, R.; Hornero, A.; Majada, J.; Martínez-Alonso, C. Assessing Canopy Responses to Thinnings for Sweet Chestnut Coppice with Time-Series Vegetation Indices Derived from Landsat-8 and Sentinel-2 Imagery. Remote Sens. 2020, 12, 3068. [Google Scholar] [CrossRef]
- Marchetti, F.; Waske, B.; Arbelo, M.; Moreno-Ruíz, J.A.; Alonso-Benito, A. Mapping Chestnut stands using bi-temporal VHR data. Remote Sens. 2019, 11, 2560. [Google Scholar] [CrossRef] [Green Version]
- Martins, L.; Castro, J.; Bento, R.; Sousa, J. Chestnut health monitoring by aerial photographs obtained by unnamed aerial vehicle. Rev. De Ciências Agrárias 2015, 38, 184–190. [Google Scholar]
- Pádua, L.; Hruška, J.; Bessa, J.; Adão, T.; Martins, L.M.; Gonçalves, J.A.; Peres, E.; Sousa, A.M.; Castro, J.P.; Sousa, J.J. Multi-temporal analysis of forestry and coastal environments using UASs. Remote Sens. 2017, 10, 24. [Google Scholar] [CrossRef] [Green Version]
- Marques, P.; Pádua, L.; Adão, T.; Hruška, J.; Peres, E.; Sousa, A.; Sousa, J.J. UAV-based automatic detection and monitoring of chestnut trees. Remote Sens. 2019, 11, 855. [Google Scholar] [CrossRef] [Green Version]
- Pádua, L.; Marques, P.; Adão, T.; Hruška, J.; Peres, E.; Morais, R.; Sousa, A.; Sousa, J.J. UAS-based imagery and photogrammetric processing for tree height and crown diameter extraction. In Proceedings of theInternational Conference on Geoinformatics and Data Analysis, Prague, Czech Republic, 20–22 April 2018; pp. 87–91. [Google Scholar]
- Pádua, L.; Marques, P.; Martins, L.; Sousa, A.; Peres, E.; Sousa, J.J. Monitoring of chestnut trees using machine learning techniques applied to UAV-based multispectral data. Remote Sens. 2020, 12, 3032. [Google Scholar] [CrossRef]
- Fernandez-Manso, A.; Cifuentes, J.; Sanz-Ablanero, E.; Quintano, C. Forest damage monitoring in South-Western Europe based on data from Unmanned Aerial Vehicles (UAV). In Proceedings of the Applications of Digital Image Processing XLIV, San Diego, CA, USA, 1–5 August 2021; Volume 11842, pp. 631–637. [Google Scholar]
- Candiago, S.; Remondino, F.; De Giglio, M.; Dubbini, M.; Gattelli, M. Evaluating multispectral images and vegetation indices for precision farming applications from UAV images. Remote Sens. 2015, 7, 4026–4047. [Google Scholar] [CrossRef] [Green Version]
- Instituto Nacional de Estatística, I. P. Estatísticas Agrícolas 2018; Instituto Nacional de Estatística, I.P.: Lisbon, Portugal, 2019.
- Albetis, J.; Duthoit, S.; Guttler, F.; Jacquin, A.; Goulard, M.; Poilvé, H.; Féret, J.B.; Dedieu, G. Detection of Flavescence dorée grapevine disease using unmanned aerial vehicle (UAV) multispectral imagery. Remote Sens. 2017, 9, 308. [Google Scholar] [CrossRef]
- Rouse, J.W., Jr.; Haas, R.H.; Schell, J.; Deering, D. Monitoring the Vernal Advancement and Retrogradation (Green Wave Effect) of Natural Vegetation; Contractor Report; Texas A & M University, Remote Sensing Center: College Station, TX, USA, 1973. [Google Scholar]
- Gitelson, A.A.; Kaufman, Y.J.; Merzlyak, M.N. Use of a green channel in remote sensing of global vegetation from EOS-MODIS. Remote Sens. Environ. 1996, 58, 289–298. [Google Scholar] [CrossRef]
- Tucker, C.J. Red and photographic infrared linear combinations for monitoring vegetation. Remote Sens. Environ. 1979, 8, 127–150. [Google Scholar] [CrossRef] [Green Version]
- Barnes, E.; Clarke, T.; Richards, S.; Colaizzi, P.; Haberland, J.; Kostrzewski, M.; Waller, P.; Choi, C.; Riley, E.; Thompson, T.; et al. Coincident detection of crop water stress, nitrogen status and canopy density using ground based multispectral data. In Proceedings of the Fifth International Conference on Precision Agriculture, Bloomington, MN, USA, 16–19 July 2000; Volume 1619, p. 6. [Google Scholar]
- Huete, A.R. A soil-adjusted vegetation index (SAVI). Remote Sens. Environ. 1988, 25, 295–309. [Google Scholar] [CrossRef]
- Roujean, J.L.; Breon, F.M. Estimating PAR absorbed by vegetation from bidirectional reflectance measurements. Remote Sens. Environ. 1995, 51, 375–384. [Google Scholar] [CrossRef]
- Richardson, A.J.; Wiegand, C. Distinguishing vegetation from soil background information. Photogramm. Eng. Remote Sens. 1977, 43, 1541–1552. [Google Scholar]
- Bradley, D.; Roth, G. Adaptive thresholding using the integral image. J. Graph. Tools 2007, 12, 13–21. [Google Scholar] [CrossRef]
- Maurer, C.R.; Qi, R.; Raghavan, V. A linear time algorithm for computing exact Euclidean distance transforms of binary images in arbitrary dimensions. IEEE Trans. Pattern Anal. Mach. Intell. 2003, 25, 265–270. [Google Scholar] [CrossRef]
- Meyer, F. Topographic distance and watershed lines. Signal Process. 1994, 38, 113–125. [Google Scholar] [CrossRef]
- R Development Core Team. R: A Language and Environment for Statistical Computing; R Foundation for Statistical Computing: Vienna, Austria, 2022. [Google Scholar]
- Kuhn, M. Caret: Classification and Regression Training; R Package Version 6.0-93; 2022; Available online: https://cran.r-project.org/package=caret (accessed on 25 November 2022).
- Hamner, B.; Frasco, M. Metrics: Evaluation Metrics for Machine Learning; R Package Version 0.1.4; 2018; Available online: https://cran.r-project.org/package=Metrics (accessed on 25 November 2022).
- Tipping, M. The Relevance Vector Machine. In Proceedings of the Advances in Neural Information Processing Systems; Solla, S., Leen, T., Müller, K., Eds.; MIT Press: Cambridge, MA, USA, 1999; Volume 12. [Google Scholar]
- Burden, F.; Winkler, D. Bayesian Regularization of Neural Networks. In Artificial Neural Networks: Methods and Applications; Livingstone, D.J., Ed.; Humana Press: Totowa, NJ, USA, 2009; pp. 23–42. [Google Scholar] [CrossRef]
- Ishwaran, H.; Rao, J.S. Spike and slab variable selection: Frequentist and Bayesian strategies. Ann. Stat. 2005, 33, 730–773. [Google Scholar] [CrossRef] [Green Version]
- Pádua, L.; Marques, P.; Martins, L.; Sousa, A.; Peres, E.; Sousa, J.J. Estimation of Leaf Area Index in Chestnut Trees using Multispectral Data from an Unmanned Aerial Vehicle. In Proceedings of the IGARSS 2020–2020 IEEE International Geoscience and Remote Sensing Symposium, Waikoloa, HI, USA, 26 September–2 October 2000; IEEE: Piscataway Township, NJ, USA, 2020; pp. 6503–6506. [Google Scholar]
- Gitelson, A.A.; Kaufman, Y.J.; Stark, R.; Rundquist, D. Novel algorithms for remote estimation of vegetation fraction. Remote Sens. Environ. 2002, 80, 76–87. [Google Scholar] [CrossRef]
- Huete, A.; Didan, K.; Miura, T.; Rodriguez, E.P.; Gao, X.; Ferreira, L.G. Overview of the radiometric and biophysical performance of the MODIS vegetation indices. Remote Sens. Environ. 2002, 83, 195–213. [Google Scholar] [CrossRef]
- Jiang, Z.; Huete, A.R.; Didan, K.; Miura, T. Development of a two-band enhanced vegetation index without a blue band. Remote Sens. Environ. 2008, 112, 3833–3845. [Google Scholar] [CrossRef]
- Haboudane, D.; Miller, J.R.; Pattey, E.; Zarco-Tejada, P.J.; Strachan, I.B. Hyperspectral vegetation indices and novel algorithms for predicting green LAI of crop canopies: Modeling and validation in the context of precision agriculture. Remote Sens. Environ. 2004, 90, 337–352. [Google Scholar] [CrossRef]
- Liang, L.; Di, L.; Zhang, L.; Deng, M.; Qin, Z.; Zhao, S.; Lin, H. Estimation of crop LAI using hyperspectral vegetation indices and a hybrid inversion method. Remote Sens. Environ. 2015, 165, 123–134. [Google Scholar] [CrossRef]
- Tian, M.; Ban, S.; Chang, Q.; You, M.; Luo, D.; Wang, L.; Wang, S. Use of hyperspectral images from UAV-based imaging spectroradiometer to estimate cotton leaf area index. Trans. Chin. Soc. Agric. Eng. 2016, 32, 102–108. [Google Scholar]
Figure 1.
Studied plot, with the location of the evaluated chestnut trees according to its approximate tree crown diameter. Color-infrared 2018 othophoto mosaic from Portugal mainland (0.25 m spatial resolution), obtained from the National Geographic Information System (SNIG).
Figure 1.
Studied plot, with the location of the evaluated chestnut trees according to its approximate tree crown diameter. Color-infrared 2018 othophoto mosaic from Portugal mainland (0.25 m spatial resolution), obtained from the National Geographic Information System (SNIG).
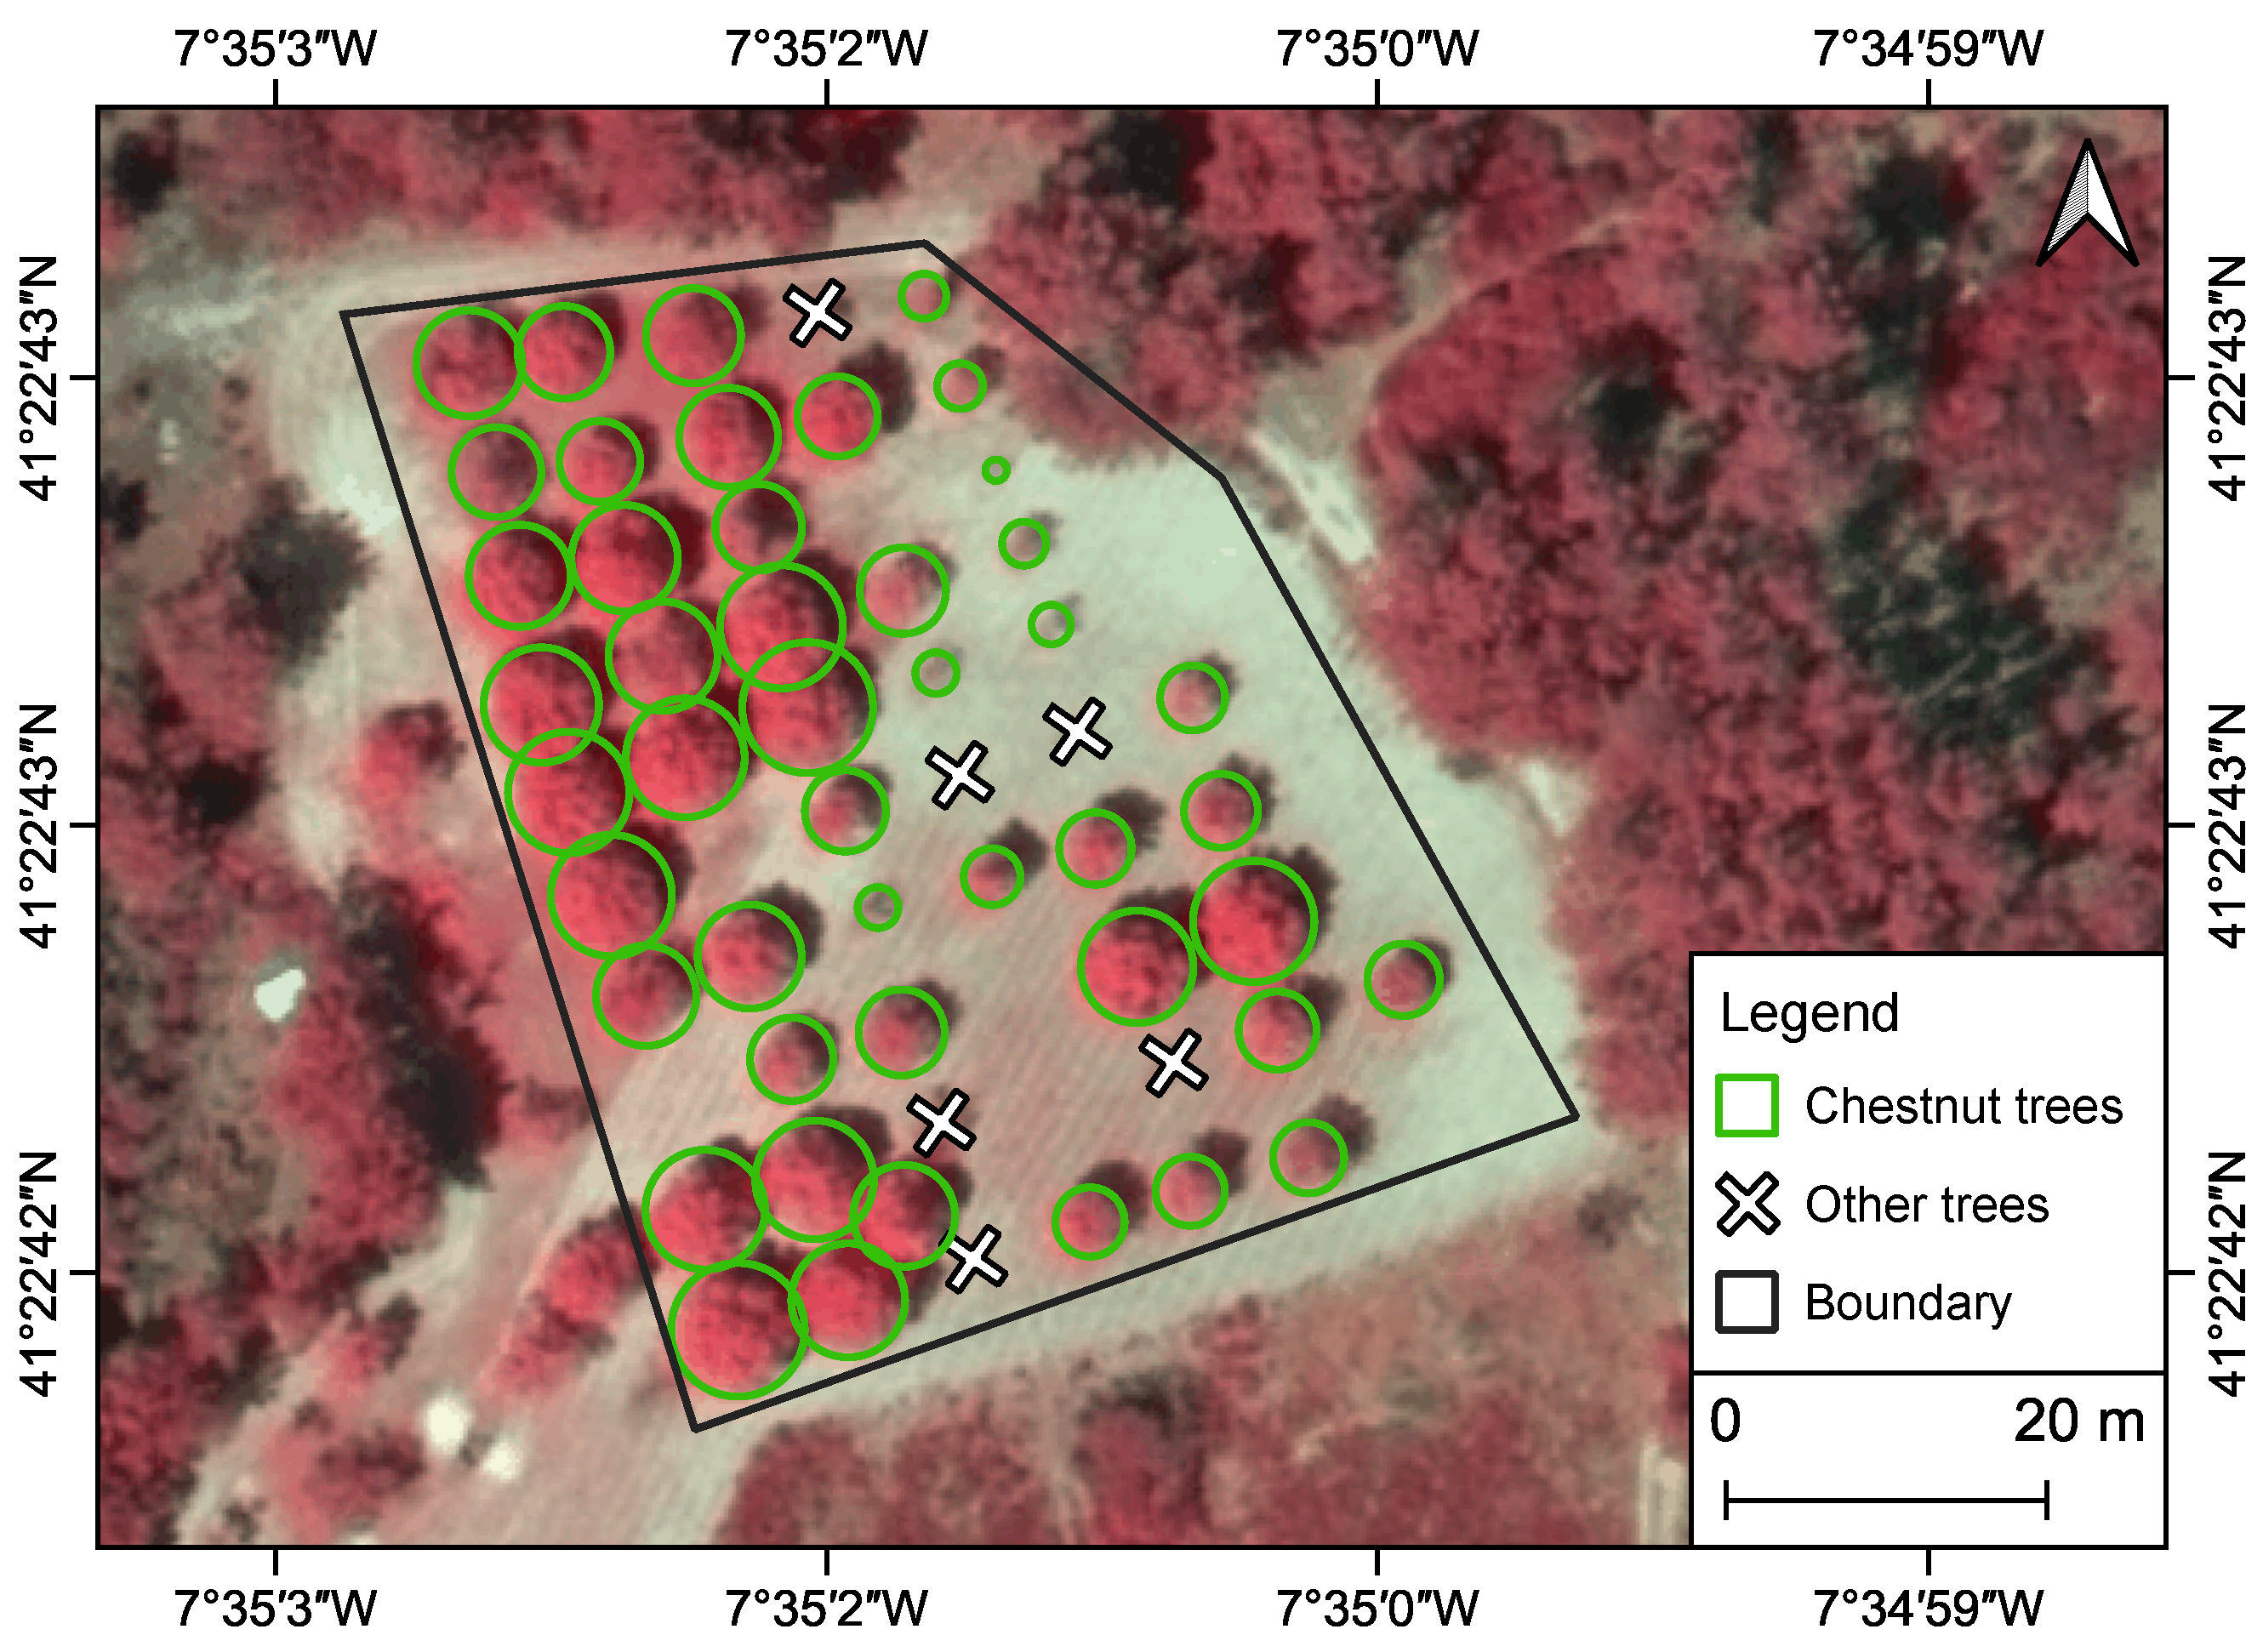
Figure 2.
Leaf area index (LAI) distribution (a) and the individual tree value (b) at each measurement period and when considering all measurements.
Figure 2.
Leaf area index (LAI) distribution (a) and the individual tree value (b) at each measurement period and when considering all measurements.

Figure 3.
The observed and estimated tree height (a) and crown diameter values (b) obtained from the orthorectified raster products of the data acquired by the unmanned aerial vehicle.
Figure 3.
The observed and estimated tree height (a) and crown diameter values (b) obtained from the orthorectified raster products of the data acquired by the unmanned aerial vehicle.

Figure 4.
Regressions between the logarithm of the leaf area index (LAI) and vegetation indices by month. August (red), September (green), and October (blue).
Figure 4.
Regressions between the logarithm of the leaf area index (LAI) and vegetation indices by month. August (red), September (green), and October (blue).
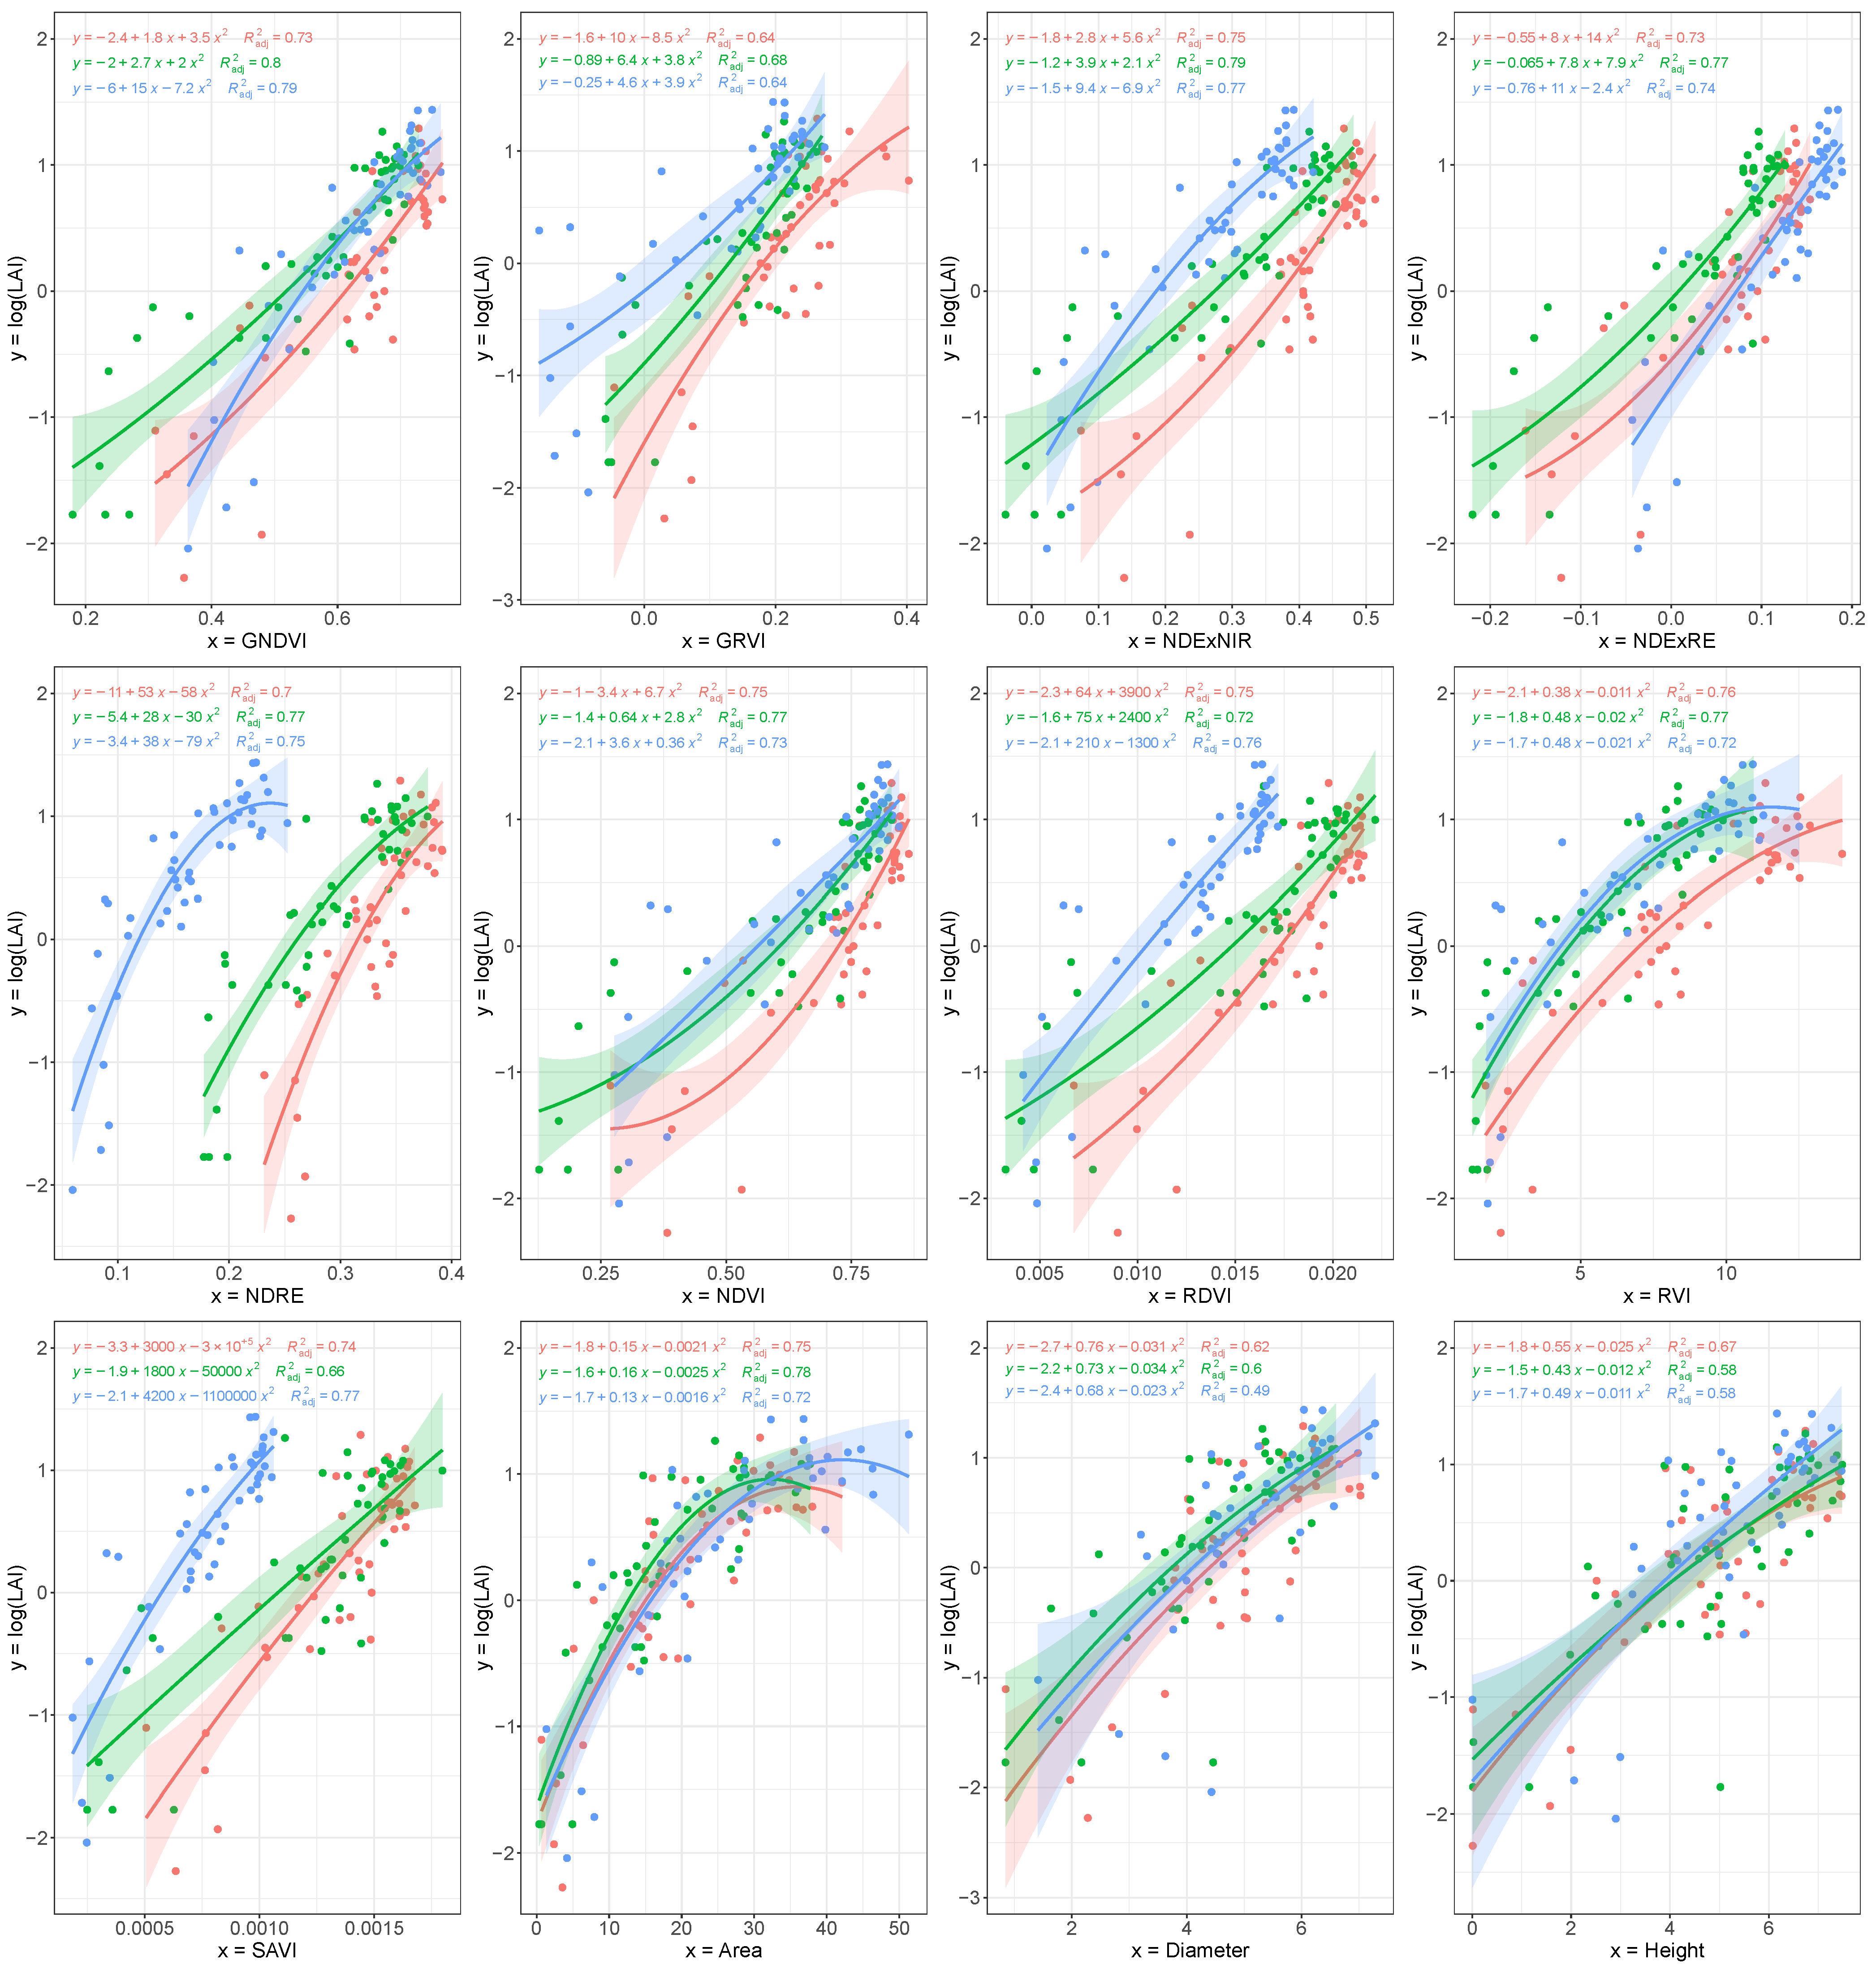
Figure 5.
Observed and predicted leaf area index (LAI) when using: (a) Relevance Vector Machines with Polynomial Kernel, (b) Bayesian Regularized Neural Networks, and (c) the linear model with leap backward.
Figure 5.
Observed and predicted leaf area index (LAI) when using: (a) Relevance Vector Machines with Polynomial Kernel, (b) Bayesian Regularized Neural Networks, and (c) the linear model with leap backward.
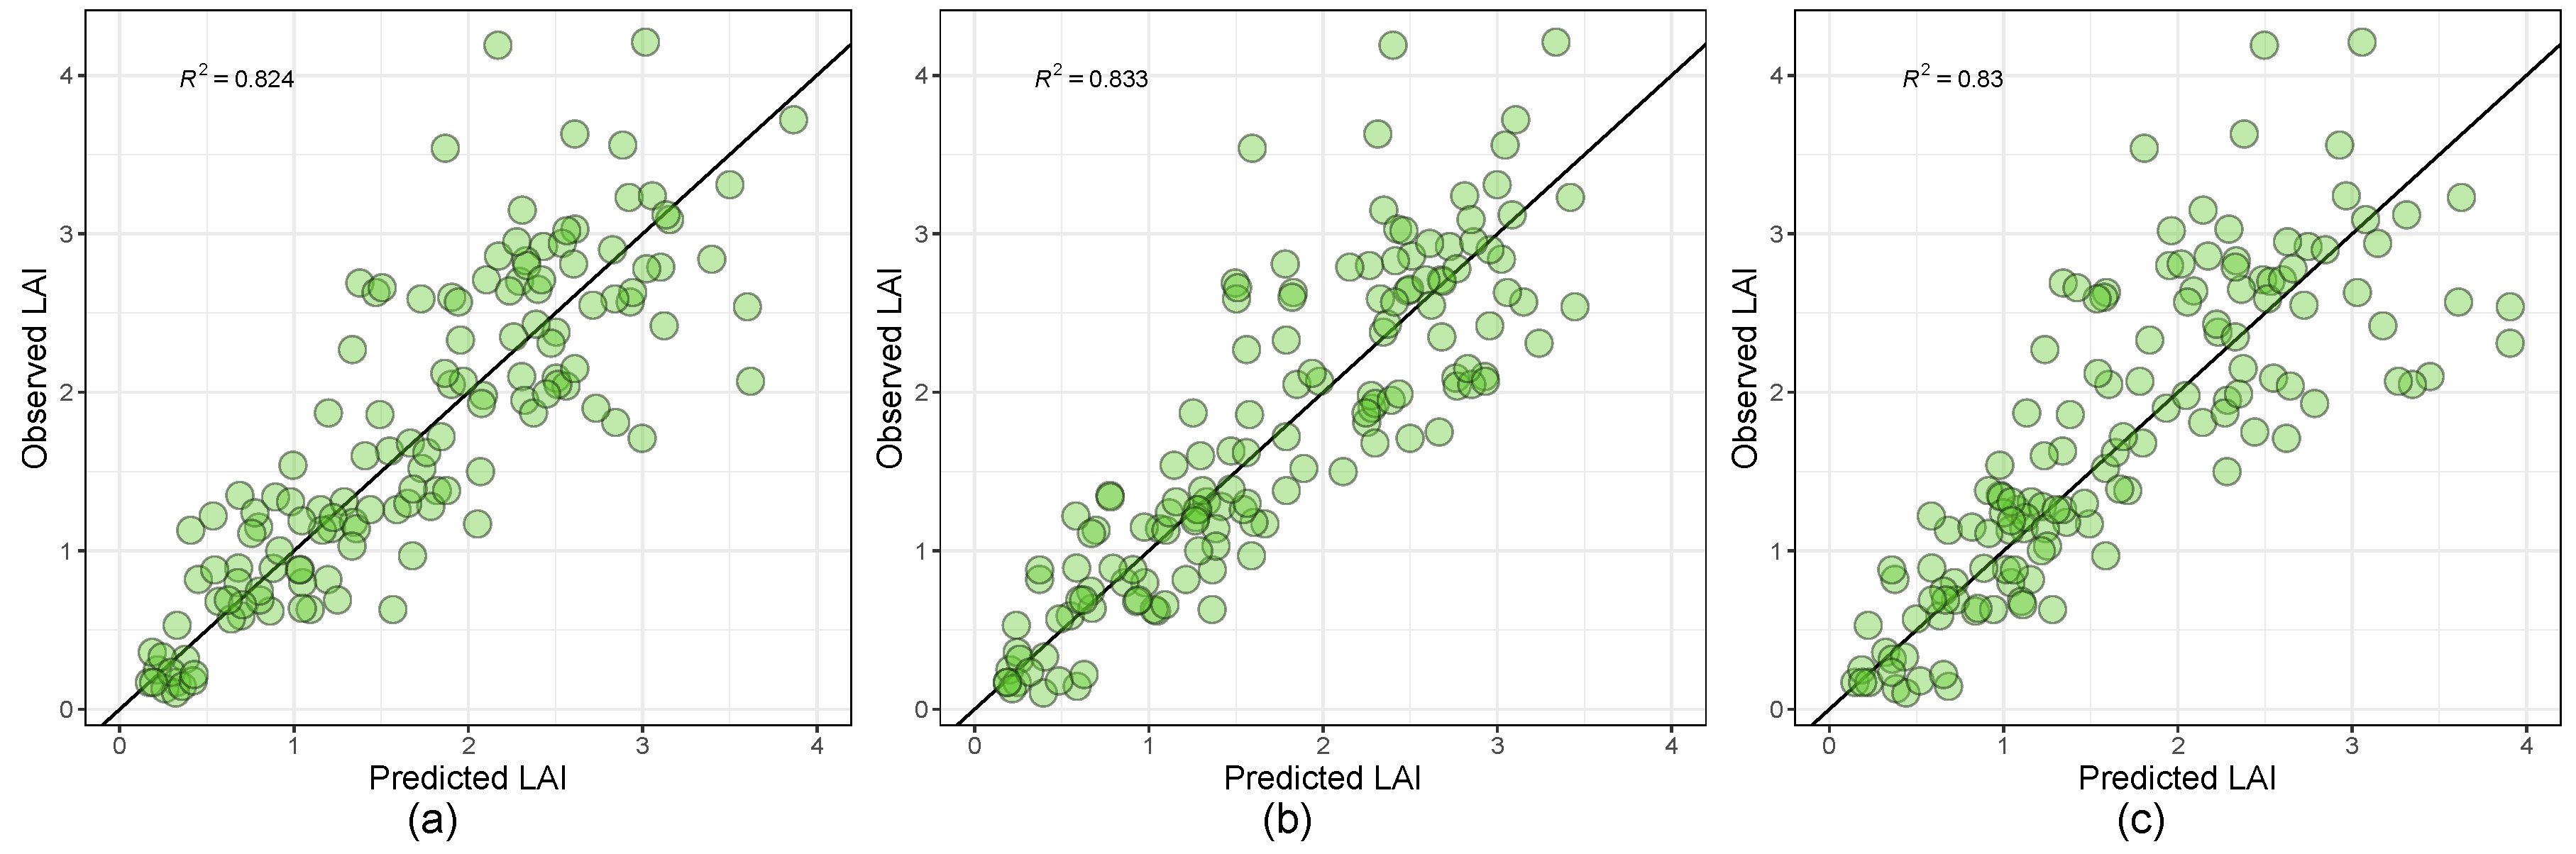
Figure 6.
The estimated leaf area index (LAI) for each surveyed period of the chestnut grove when using: (a) Bayesian Regularized Neural Networks, (b) the leap backward selection algorithm model using the tree crown area, NDExRE, and NDRE, and (c) and using the tree crown area and GNDVI.
Figure 6.
The estimated leaf area index (LAI) for each surveyed period of the chestnut grove when using: (a) Bayesian Regularized Neural Networks, (b) the leap backward selection algorithm model using the tree crown area, NDExRE, and NDRE, and (c) and using the tree crown area and GNDVI.
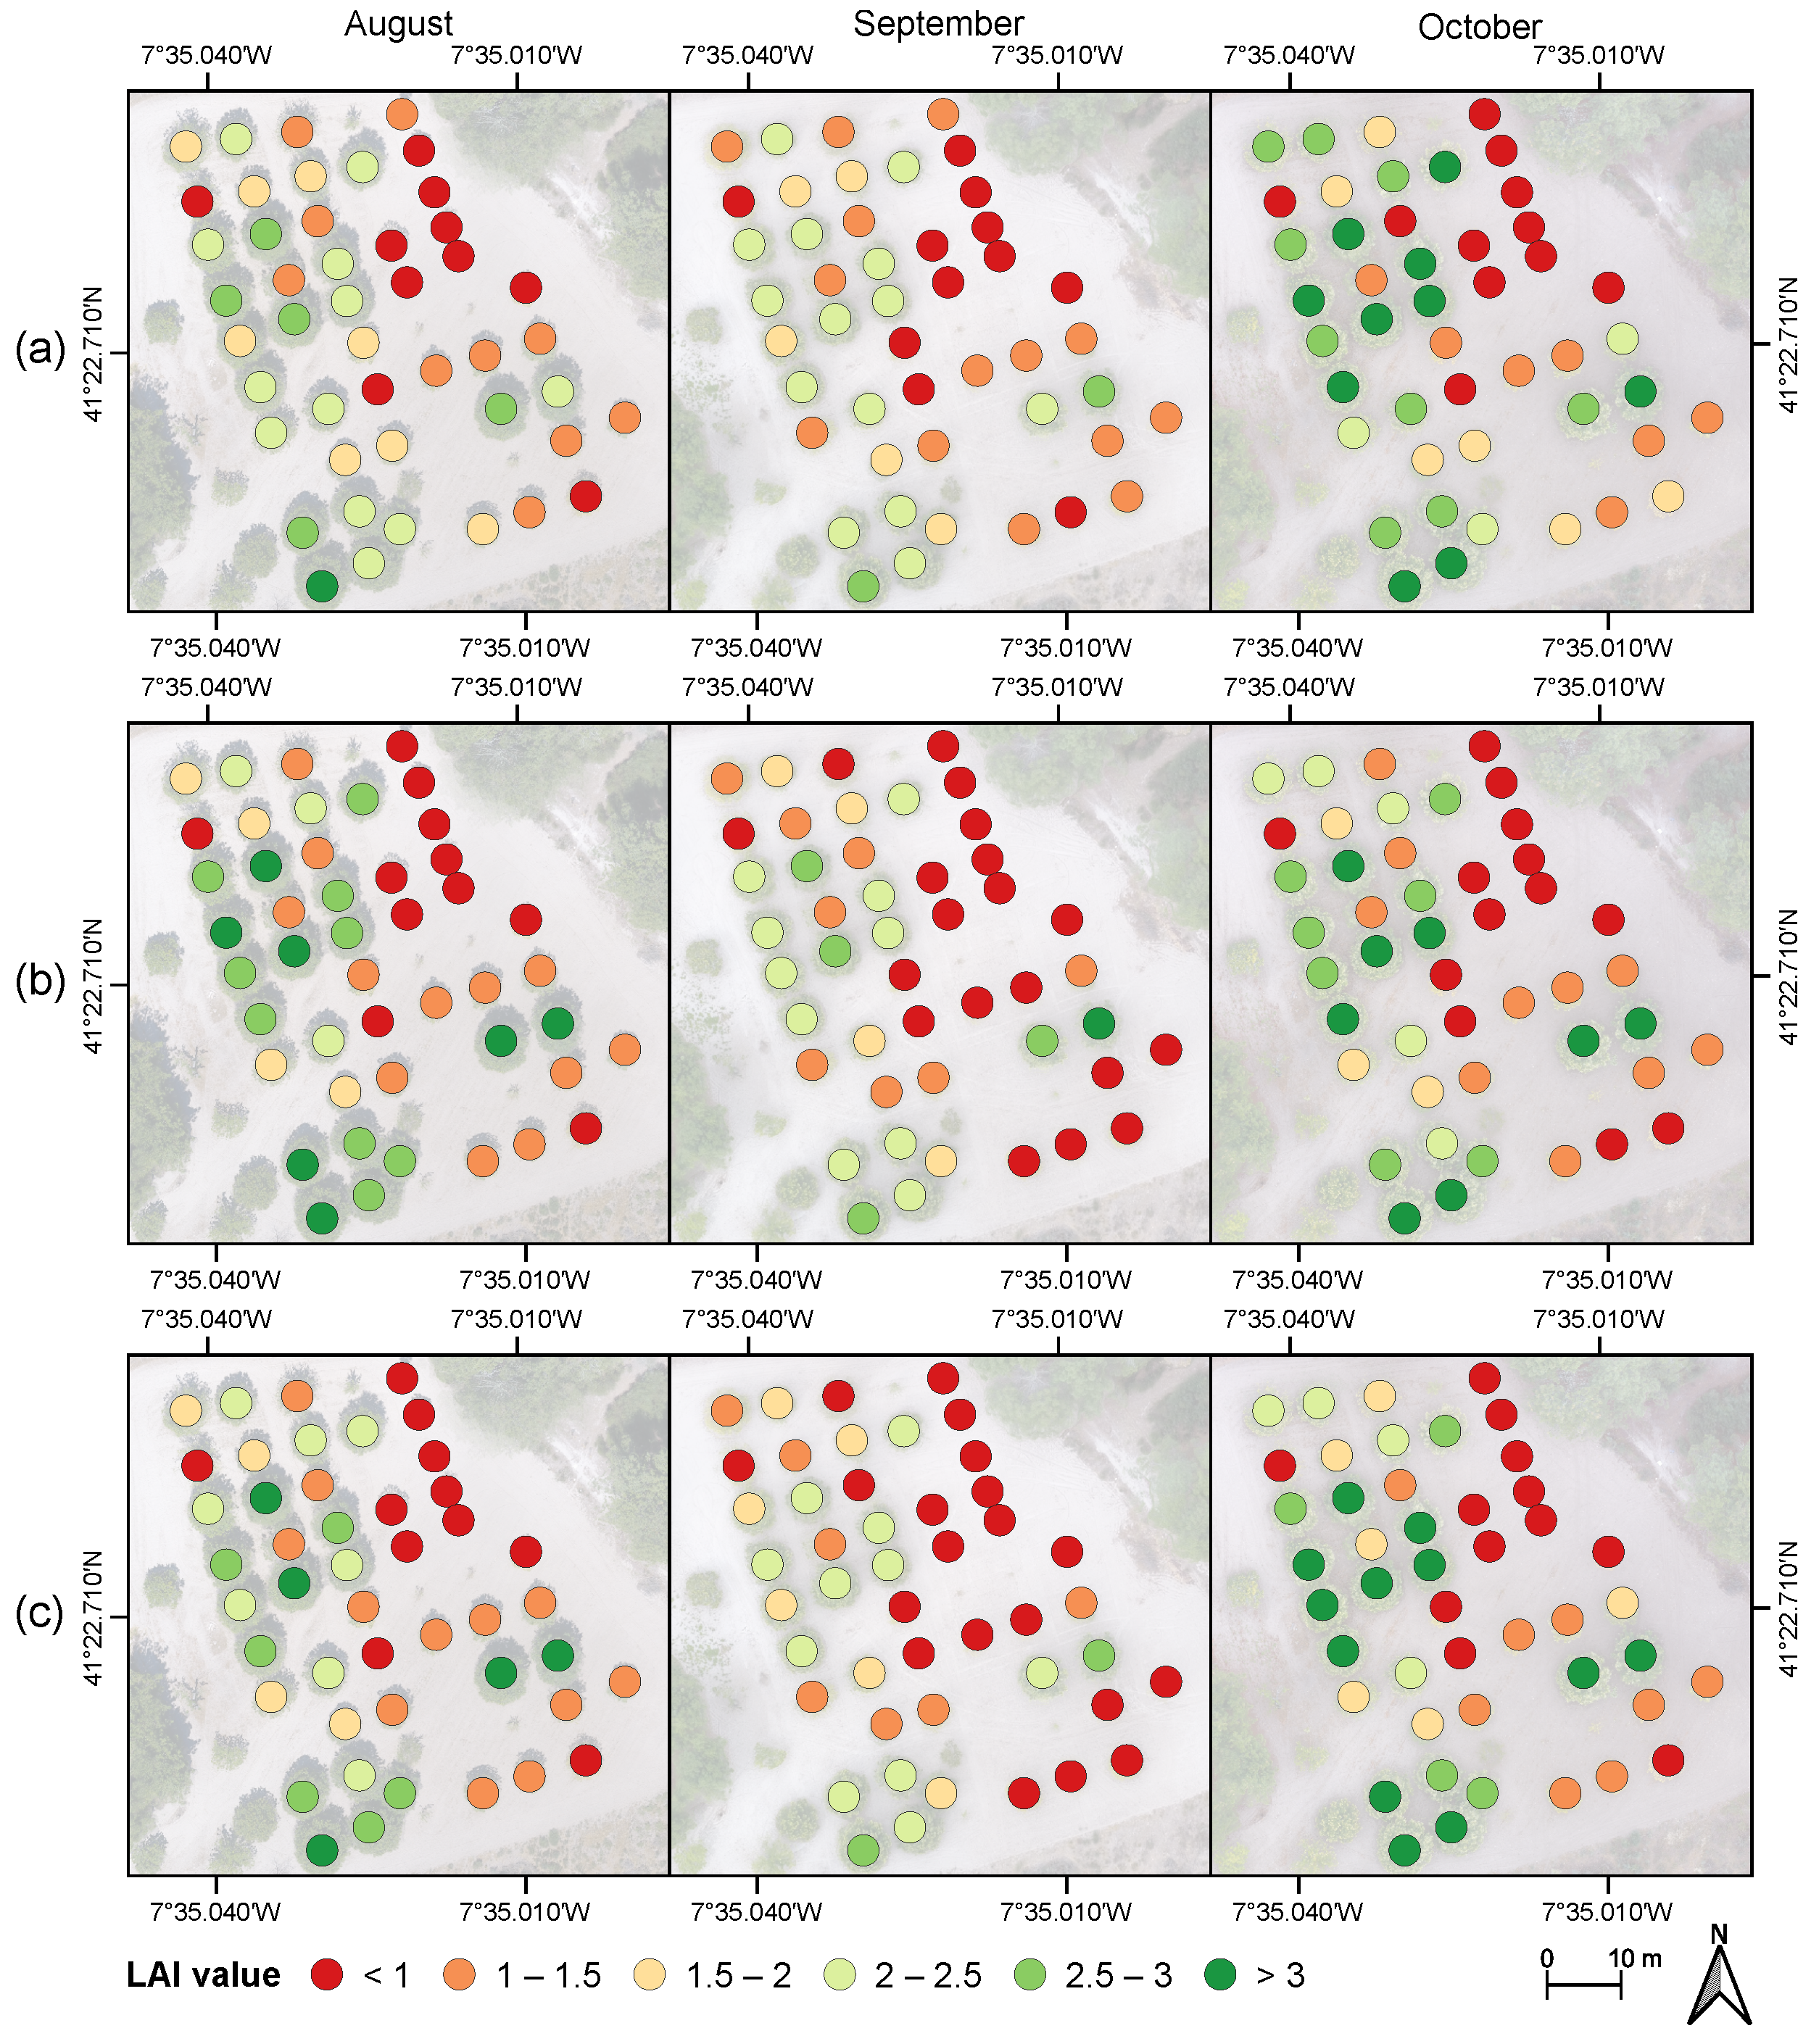
Table 2.
Leaf area index (LAI) characterization and summary based on the 46 observations made in each period.
Table 2.
Leaf area index (LAI) characterization and summary based on the 46 observations made in each period.
| Period | Mean | SD | CV | q0.25 | q0.75 | Min | Max |
|---|---|---|---|---|---|---|---|
| August | 1.581 | 0.909 | 0.575 | 0.156 | 3.214 | 0.103 | 3.630 |
| September | 1.657 | 0.951 | 0.574 | 0.170 | 3.125 | 0.170 | 3.540 |
| October | 2.018 | 1.061 | 0.526 | 0.185 | 4.131 | 0.130 | 4.210 |
Statistics calculated related to the LAI variable, mean; SD: standard deviation; CV: coefficient of variation; q0.25 and q0.75 describe the 25th and 75th LAI percentile; Min: minimum; and Max: maximum.
Table 3.
Assessment of linear regressions through significant Pearson correlation coefficients () between the log(LAI) and the vegetation indices and geometry parameters by month.
Table 3.
Assessment of linear regressions through significant Pearson correlation coefficients () between the log(LAI) and the vegetation indices and geometry parameters by month.
| Covariate | August | September | October | All Values |
|---|---|---|---|---|
| GNDVI | 0.858 | 0.896 | 0.889 | 0.842 |
| NDExRE | 0.852 | 0.877 | 0.868 | 0.822 |
| NDVI | 0.856 | 0.875 | 0.863 | 0.820 |
| Crown area | 0.816 | 0.834 | 0.788 | 0.803 |
| Height | 0.819 | 0.769 | 0.773 | 0.784 |
| RVI | 0.862 | 0.870 | 0.825 | 0.780 |
| NDExNIR | 0.869 | 0.895 | 0.876 | 0.758 |
| Crown diameter | 0.795 | 0.778 | 0.710 | 0.754 |
| RDVI | 0.870 | 0.852 | 0.879 | 0.703 |
| GRVI | 0.799 | 0.831 | 0.805 | 0.700 |
| SAVI | 0.867 | 0.824 | 0.878 | 0.562 |
| NDRE | 0.837 | 0.876 | 0.837 | 0.364 |
NDVI: Normalized Difference Vegetation Index; GNDVI: Green Normalized Difference Vegetation Index; GRVI: Green Red Vegetation Index; NDRE: Normalized Difference Red Edge; SAVI: Soil Adjusted Vegetation Index; RDVI: Renormalized Difference Vegetation Index; RVI: Ratio Vegetation Index; ExNIR: Excess Near Infrared; ExRE: Excess Red Edge; NDExNIR: Normalized Difference ExNIR; and NDExRE: Normalized Difference ExRE.
Table 4.
Accuracy metrics of the evaluated regression models (with a coefficient of determination above 0.80).
Table 4.
Accuracy metrics of the evaluated regression models (with a coefficient of determination above 0.80).
| Regression Model Type | RMSE | MAE | sd | RMSEsd | MAEsd | |
|---|---|---|---|---|---|---|
| Relevance Vector Machines with Polynomial Kernel | 0.833 | 0.343 | 0.273 | 0.098 | 0.082 | 0.076 |
| Bayesian Regularized Neural Networks | 0.830 | 0.348 | 0.267 | 0.093 | 0.080 | 0.065 |
| Linear model with leap backward | 0.824 | 0.367 | 0.285 | 0.097 | 0.109 | 0.088 |
| Spike and Slab Regression | 0.823 | 0.373 | 0.285 | 0.090 | 0.088 | 0.074 |
| Cubist | 0.818 | 0.366 | 0.281 | 0.112 | 0.083 | 0.059 |
| Projection Pursuit Regression | 0.815 | 0.354 | 0.276 | 0.110 | 0.083 | 0.059 |
| Boosted Regression Tree | 0.815 | 0.341 | 0.270 | 0.107 | 0.072 | 0.056 |
| Ridge Regression | 0.814 | 0.371 | 0.291 | 0.130 | 0.122 | 0.096 |
| The Bayesian Regression Lasso | 0.812 | 0.373 | 0.290 | 0.100 | 0.093 | 0.062 |
| Elastic net | 0.811 | 0.364 | 0.286 | 0.118 | 0.118 | 0.091 |
| Lm with Forward | 0.810 | 0.367 | 0.285 | 0.111 | 0.115 | 0.095 |
| Bayesian Ridge Regression | 0.809 | 0.369 | 0.284 | 0.110 | 0.087 | 0.064 |
| Boosted Generalized Linear Model | 0.807 | 0.370 | 0.286 | 0.106 | 0.102 | 0.082 |
| The Lasso Regression | 0.806 | 0.379 | 0.292 | 0.131 | 0.104 | 0.075 |
| Bayesian Ridge Regression (Model Averaged) | 0.805 | 0.372 | 0.288 | 0.128 | 0.096 | 0.077 |
| Bayesian Generalized Linear Model | 0.805 | 0.375 | 0.292 | 0.094 | 0.103 | 0.079 |
| Linear Regression with Stepwise Selection | 0.805 | 0.371 | 0.285 | 0.116 | 0.090 | 0.070 |
R2: coefficient of determination; RMSE: Root-mean-square deviation; MAE: Mean absolute error; and Adjusted-R2: Adjusted coefficient of determination. The term sd indicates standard deviation of a given metric.
Publisher’s Note: MDPI stays neutral with regard to jurisdictional claims in published maps and institutional affiliations. |
© 2022 by the authors. Licensee MDPI, Basel, Switzerland. This article is an open access article distributed under the terms and conditions of the Creative Commons Attribution (CC BY) license (https://creativecommons.org/licenses/by/4.0/).
Share and Cite
MDPI and ACS Style
Pádua, L.; Chiroque-Solano, P.M.; Marques, P.; Sousa, J.J.; Peres, E. Mapping the Leaf Area Index of Castanea sativa Miller Using UAV-Based Multispectral and Geometrical Data. Drones 2022, 6, 422. https://doi.org/10.3390/drones6120422
AMA Style
Pádua L, Chiroque-Solano PM, Marques P, Sousa JJ, Peres E. Mapping the Leaf Area Index of Castanea sativa Miller Using UAV-Based Multispectral and Geometrical Data. Drones. 2022; 6(12):422. https://doi.org/10.3390/drones6120422
Chicago/Turabian StylePádua, Luís, Pamela M. Chiroque-Solano, Pedro Marques, Joaquim J. Sousa, and Emanuel Peres. 2022. "Mapping the Leaf Area Index of Castanea sativa Miller Using UAV-Based Multispectral and Geometrical Data" Drones 6, no. 12: 422. https://doi.org/10.3390/drones6120422