Proceeding Paper

Dynamic Monitoring of Multi-Concentrated Silica Nanoparticles Colloidal Environment with Optical Fiber Sensor †

by
Marco César Prado Soares
*,
Matheus Santos Rodrigues
,
Egont Alexandre Schenkel
,
Willian Hideak Arita Silva
,
Gabriel Perli
,
Matheus Kauê Gomes
,
Eric Fujiwara
and
Carlos Kenichi Suzuki
Laboratory of Photonic Materials and Devices, School of Mechanical Engineering, University of Campinas, São Paulo 13083-860, Brazil
*
Author to whom correspondence should be addressed.
Presented at the 6th International Electronic Conference on Sensors and Applications, 15–30 November 2019; Available online: https://ecsa-6.sciforum.net/.
Proceedings 2020, 42(1), 6; https://doi.org/10.3390/ecsa-6-06546
Published: 14 November 2019

Abstract

:
Colloids are metastable suspensions of particles dispersed in a base fluid, with high scientific and industrial importance, but the monitoring of these systems still demands expensive and large instrumentation. In this research, the measurement of concentration gradients in colloidal silica samples using an optical fiber sensor is reported. Silica nanoparticles (measuring 189 nm) were sedimented in test tubes for creating environments with different concentrations. The fiber probe was immersed in the assessed liquid, resulting in an increase in the dispersion of the reflected light intensity, which is caused by the particles Brownian motion. Therefore, the quasi-elastic light scattering phenomenon related to the diffusivity can be analyzed, providing information about the concentration gradients of the nanosystem with a straightforward, in situ, and non-destructive approach.

1. Introduction

Colloids are metastable suspensions of particles dispersed in a base fluid [1]. Despite their importance to different industrial and scientific applications, the detection and characterization of colloidal systems, especially those based on the dispersion of nanomaterials, are still challenging the researchers. The characterization of nanosystems is traditionally based on the measurement of size, morphology, and surface charge using techniques, such as atomic force microscopy (AFM), scanning electron microscopy (SEM) and transmission electron microscopy (TEM) [2,3]. Even though these methods are efficient for characterizing nanoparticles, they demand expensive instrumentation and laborious steps for samples preparation [1,2,3,4]. Furthermore, these techniques cannot analyze dynamic phenomena in situ, such as the nanoparticles progressive formation or decomposition [4].
In this context, optical fiber sensors (OFSs) emerge as promising technologies for the evaluation of physical and chemical phenomena in a fast, in situ, and sensitive way, providing insights into the intrinsic dynamics of the processes without disturbing the analyzed medium [4]. The advantages of using OFSs also include lightweight; remote sensing capability; and immunity to electromagnetic interference. Moreover, silica fibers are inert to a variety of chemical and biochemical agents [5,6].
In this work, we performed the synthesis and dispersion of silica nanoparticles to produce colloidal suspensions. Then, we performed the sedimentation of the colloidal silica in test tubes in order to create an environment with different concentration zones. Finally, we evaluated the sensor response by varying the position of the optical fiber probe along the test tube. Once each zone shows an approximately homogeneous concentration [7], this is equivalent to generate step profiles of concentrations, so the dynamic response of the sensor could be evaluated.

2. Materials and Methods

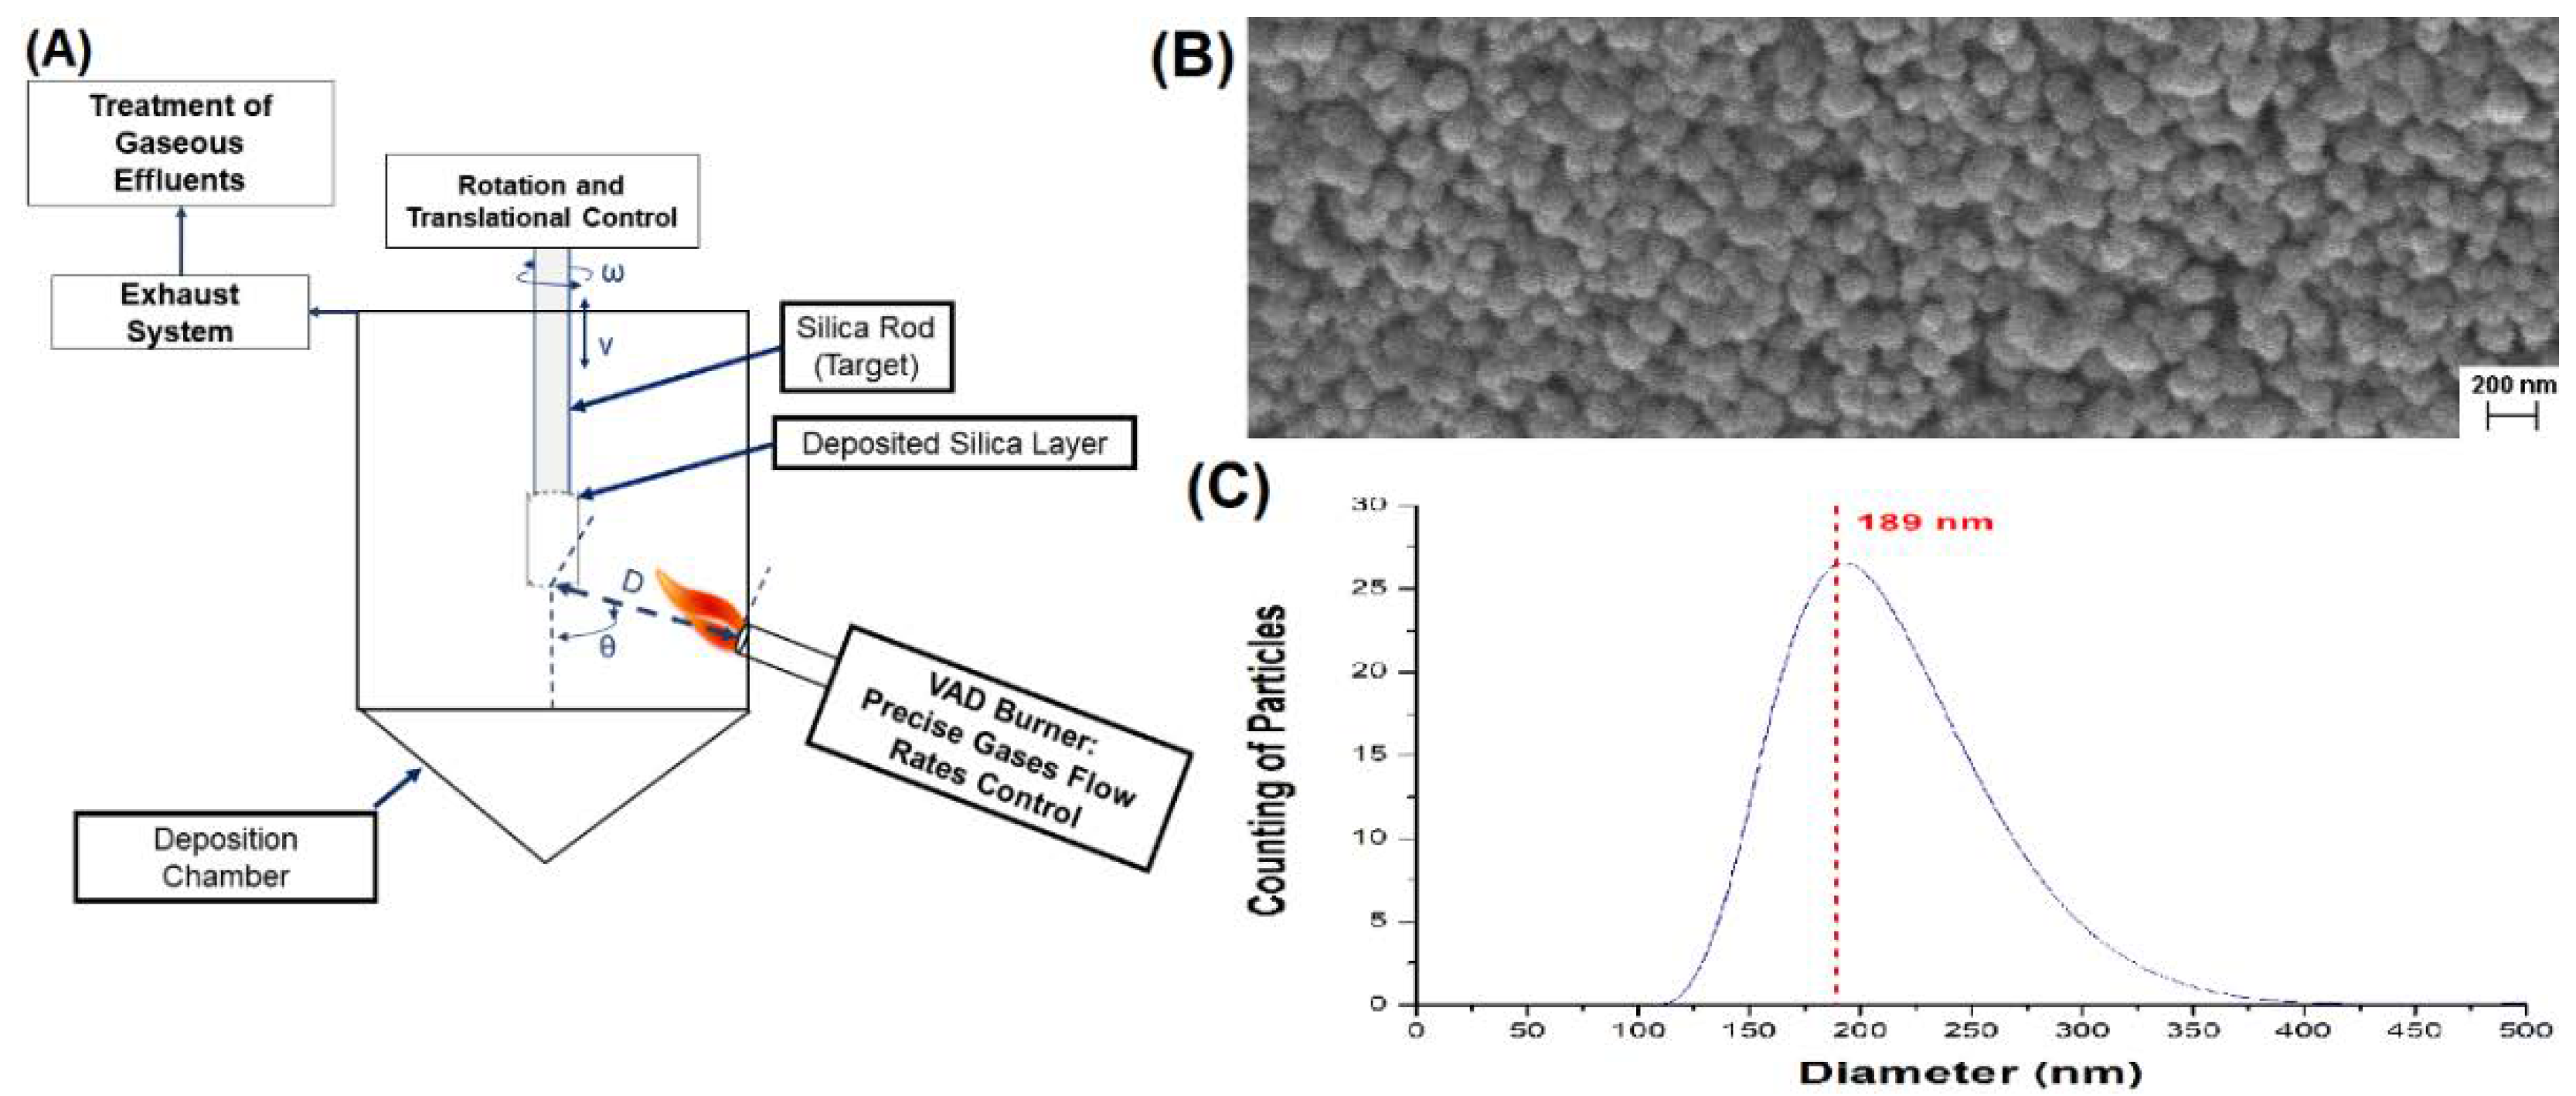
2.1. Preparation of the Colloidal Silica

Silica soot nanoparticles with high purity (optical fiber grade) were synthesized by the Vapor-phase Axial Deposition (VAD) method, in which a high-temperature O2-H2 flame promotes the hydrolysis and oxidation of the SiCl4 (Equation (1)), producing silica nanoparticles that are deposited on the surface of a rotating target. The particles are completely amorphous and spherical, as shown in previous studies [8]. Figure 1A shows the schematics of the VAD reactor. Both the diameters and the polydispersity of the synthesized particles can be tailored by controlling the process parameters, such as the burner-target distance D, burner-target inclination angle θ, target vertical translation speed v and rotation speed ω, and gases flow rates of N2, H2, O2 and SiCl4,
SiCl 4 ( g ) + 2 H 2 ( g ) + O 2 ( g ) SiO 2 ( s ) + 4 HCl ( g ) .
The particles were analyzed with a scanning electron microscope (SEM, EVO MA 15, Zeiss, Oberkochen, Germany) equipped with LaB6 thermoionic cannon for obtaining secondary electron images under high-vacuum conditions (Figure 1B). Their size distribution was evaluated with a Malvern Zetasizer Nano Zn-Zen 3600 (Malvern Panalytical, Malvern, UK), through Dynamic Light Scattering (DLS), resulting on an approximately Gaussian distribution of the hydrodynamic diameters, with an average value of 189 nm. Subsequently, the colloidal suspensions were produced by dispersing the silica nanoparticles in DI water, followed by mixing and sonication in a temperature-controlled ultrasound bath (5.9 L Ultrasound Bath, Ultronique Eco-Sonics, Indaiatuba, SP, Brazil) during 180 min, until no solid phase was visible under naked eye, forming the colloidal silica suspension with 1% (m/m) concentration.

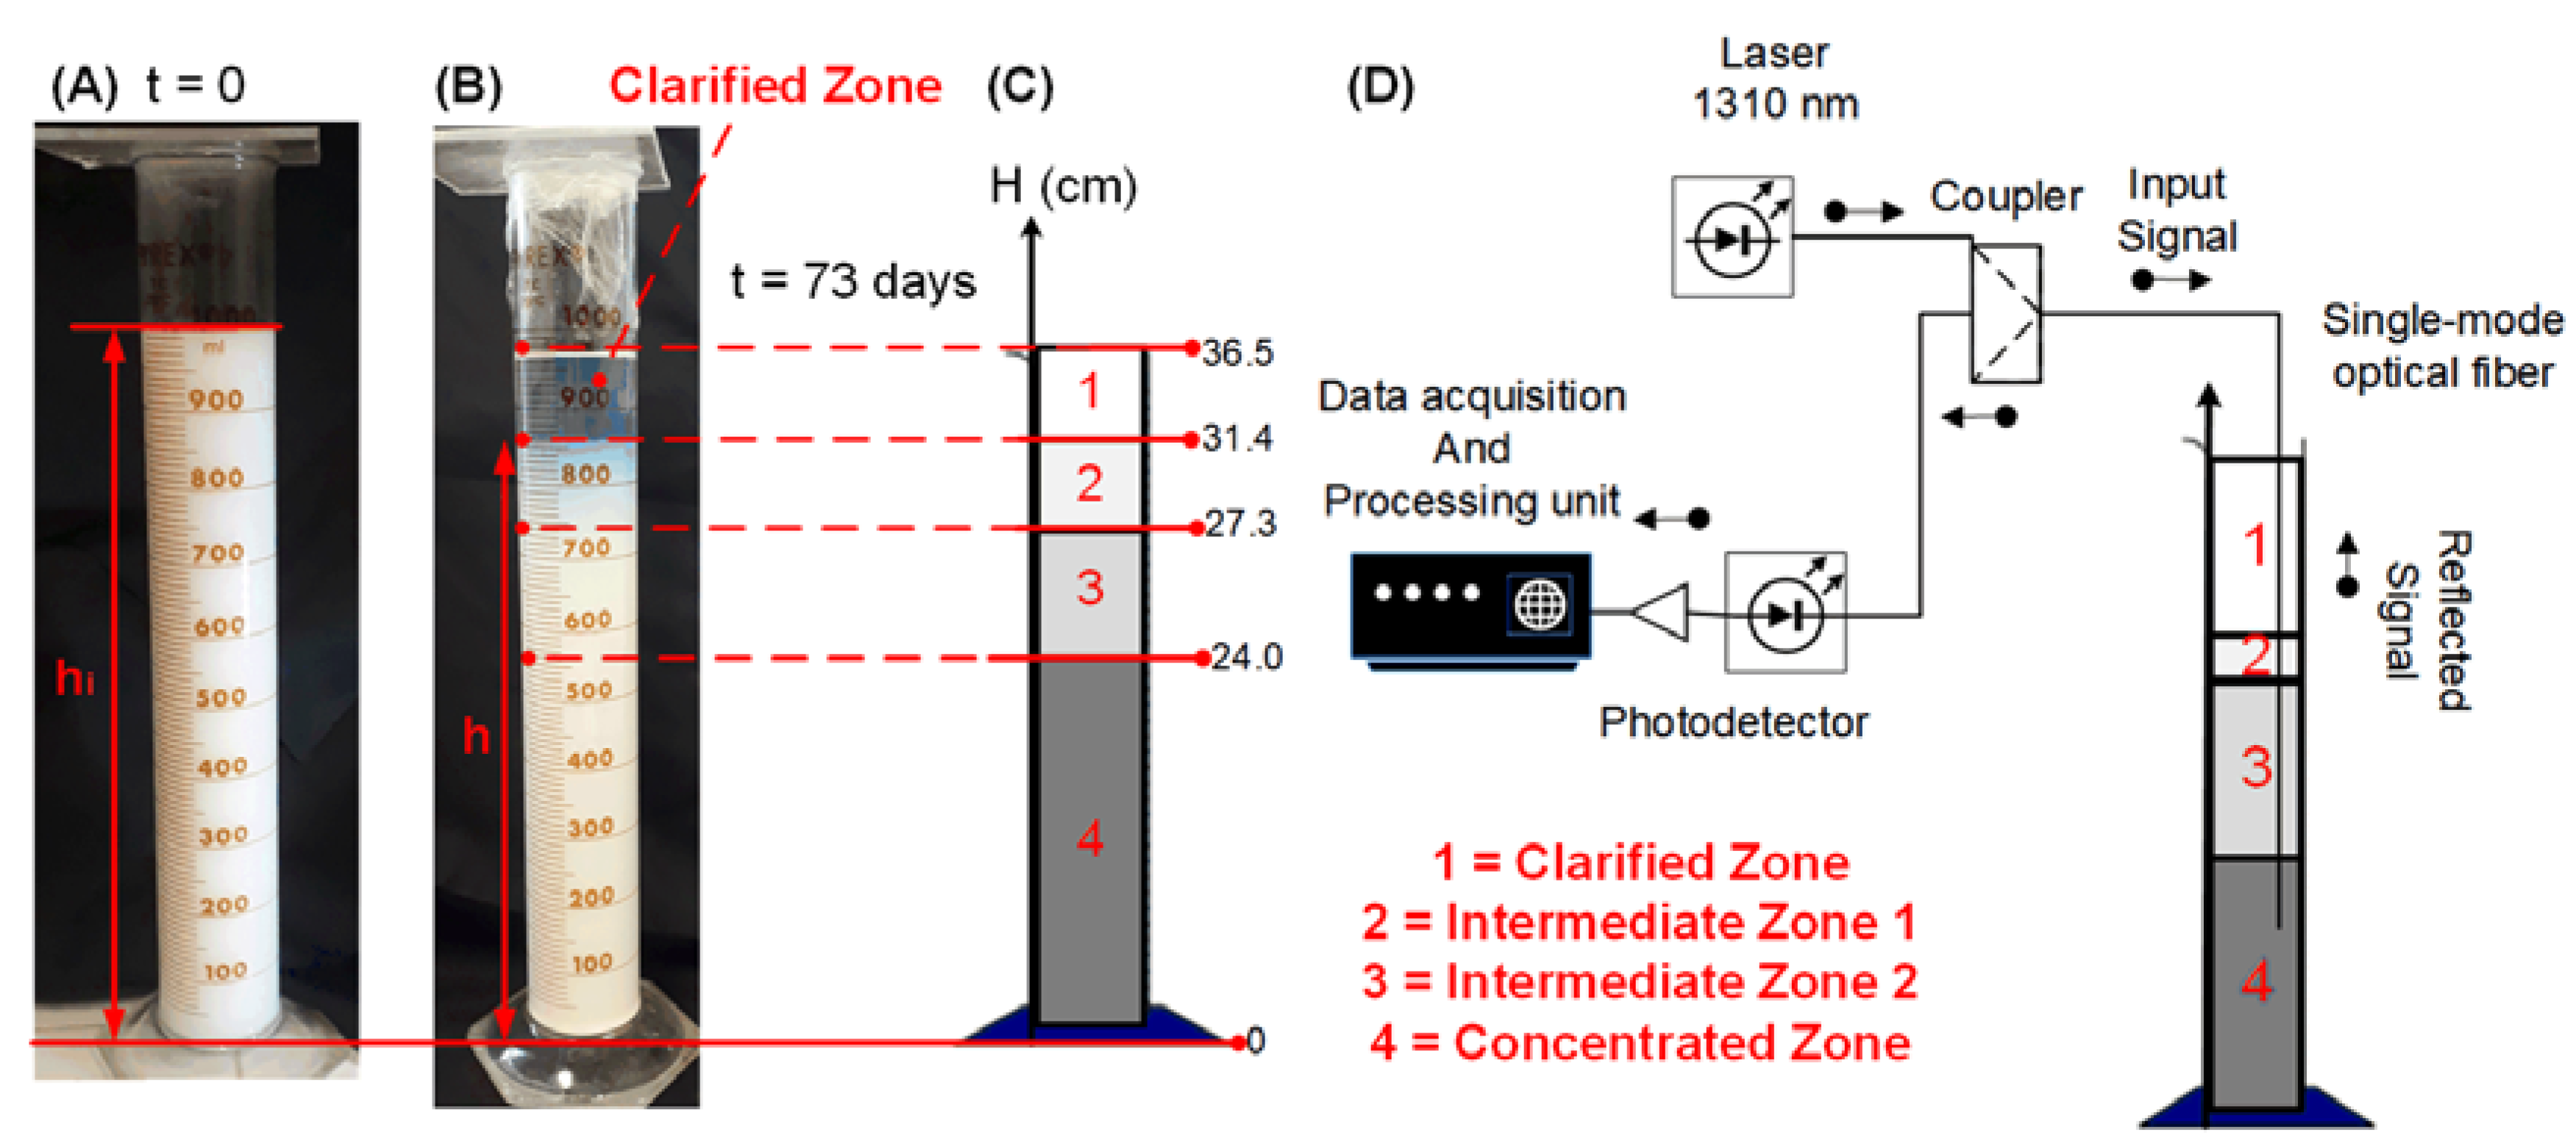
2.2. Optical Fiber Sensor

The optical fiber sensor is comprised of a laser source with emission at 1310 nm that launches the light into standard silica single mode fiber (SMF). Part of the light is divided by a coupler and then transmitted to the sample in which the fiber probe is immersed. Due to the difference of refractive indexes between the fiber core and the liquid medium, a fraction of the light is reflected back to the fiber and then monitored by a photodetector. All of the experiments were carried out by acquiring 20,000 reflected intensity values with a 1 kHz sampling rate [8].
The Brownian motion of the silica particles leads to quasi-elastic light scattering (QELS), increasing the dispersion of reflected light intensity values IR(t). The decay rate Γm of the autocorrelation function G2(τ) of IR(t) is calculated by fitting G2(τ) using the Siegert relation (Equation (2)) [9], where A and B are instrumental parameters. For a given particles average diameter, the Γm value can be correlated to the concentration and diffusivity of the silica particles, and it is known that the diffusivity increases as the particles average diameters decreases [10],
G 2 ( τ ) = A + B · exp ( 2 Γ m τ ) .

2.3. Assessment of Colloidal Concentration

In order to create an environment with different particles concentrations, two (1000 mL)-test tubes were filled with colloidal silica suspensions of 1% (m/m) of concentration. The suspensions were left in rest so the particles could slowly sediment, creating a clarified zone on the top of the flask, a concentrated zone on the bottom, and zones with intermediate concentration. Finally, the sensor response for the probe immersed in the regions of different concentrations was evaluated. All experiments were performed at room temperature (~25 °C).
The height h(t) from the bottom of the tube to the beginning of the clarified zone presents an initial value hi and progressively decreases with the time. If the initial concentration of particles is Ci (mass/volume), and assuming that the concentration in the clarified zone is negligible, so the particles are all on the most concentrated zone, the estimated concentration C(t) (on the bottom zone) is given by Equation (3), a direct consequence of the mass balance of solid particles [7],
C = h i h C i .
Figure 2 shows one of the test tubes on the first day of the experiment, and after 73 days of sedimentation (four concentration zones distinguishable), as well as the setup for evaluating the concentration disturbances.

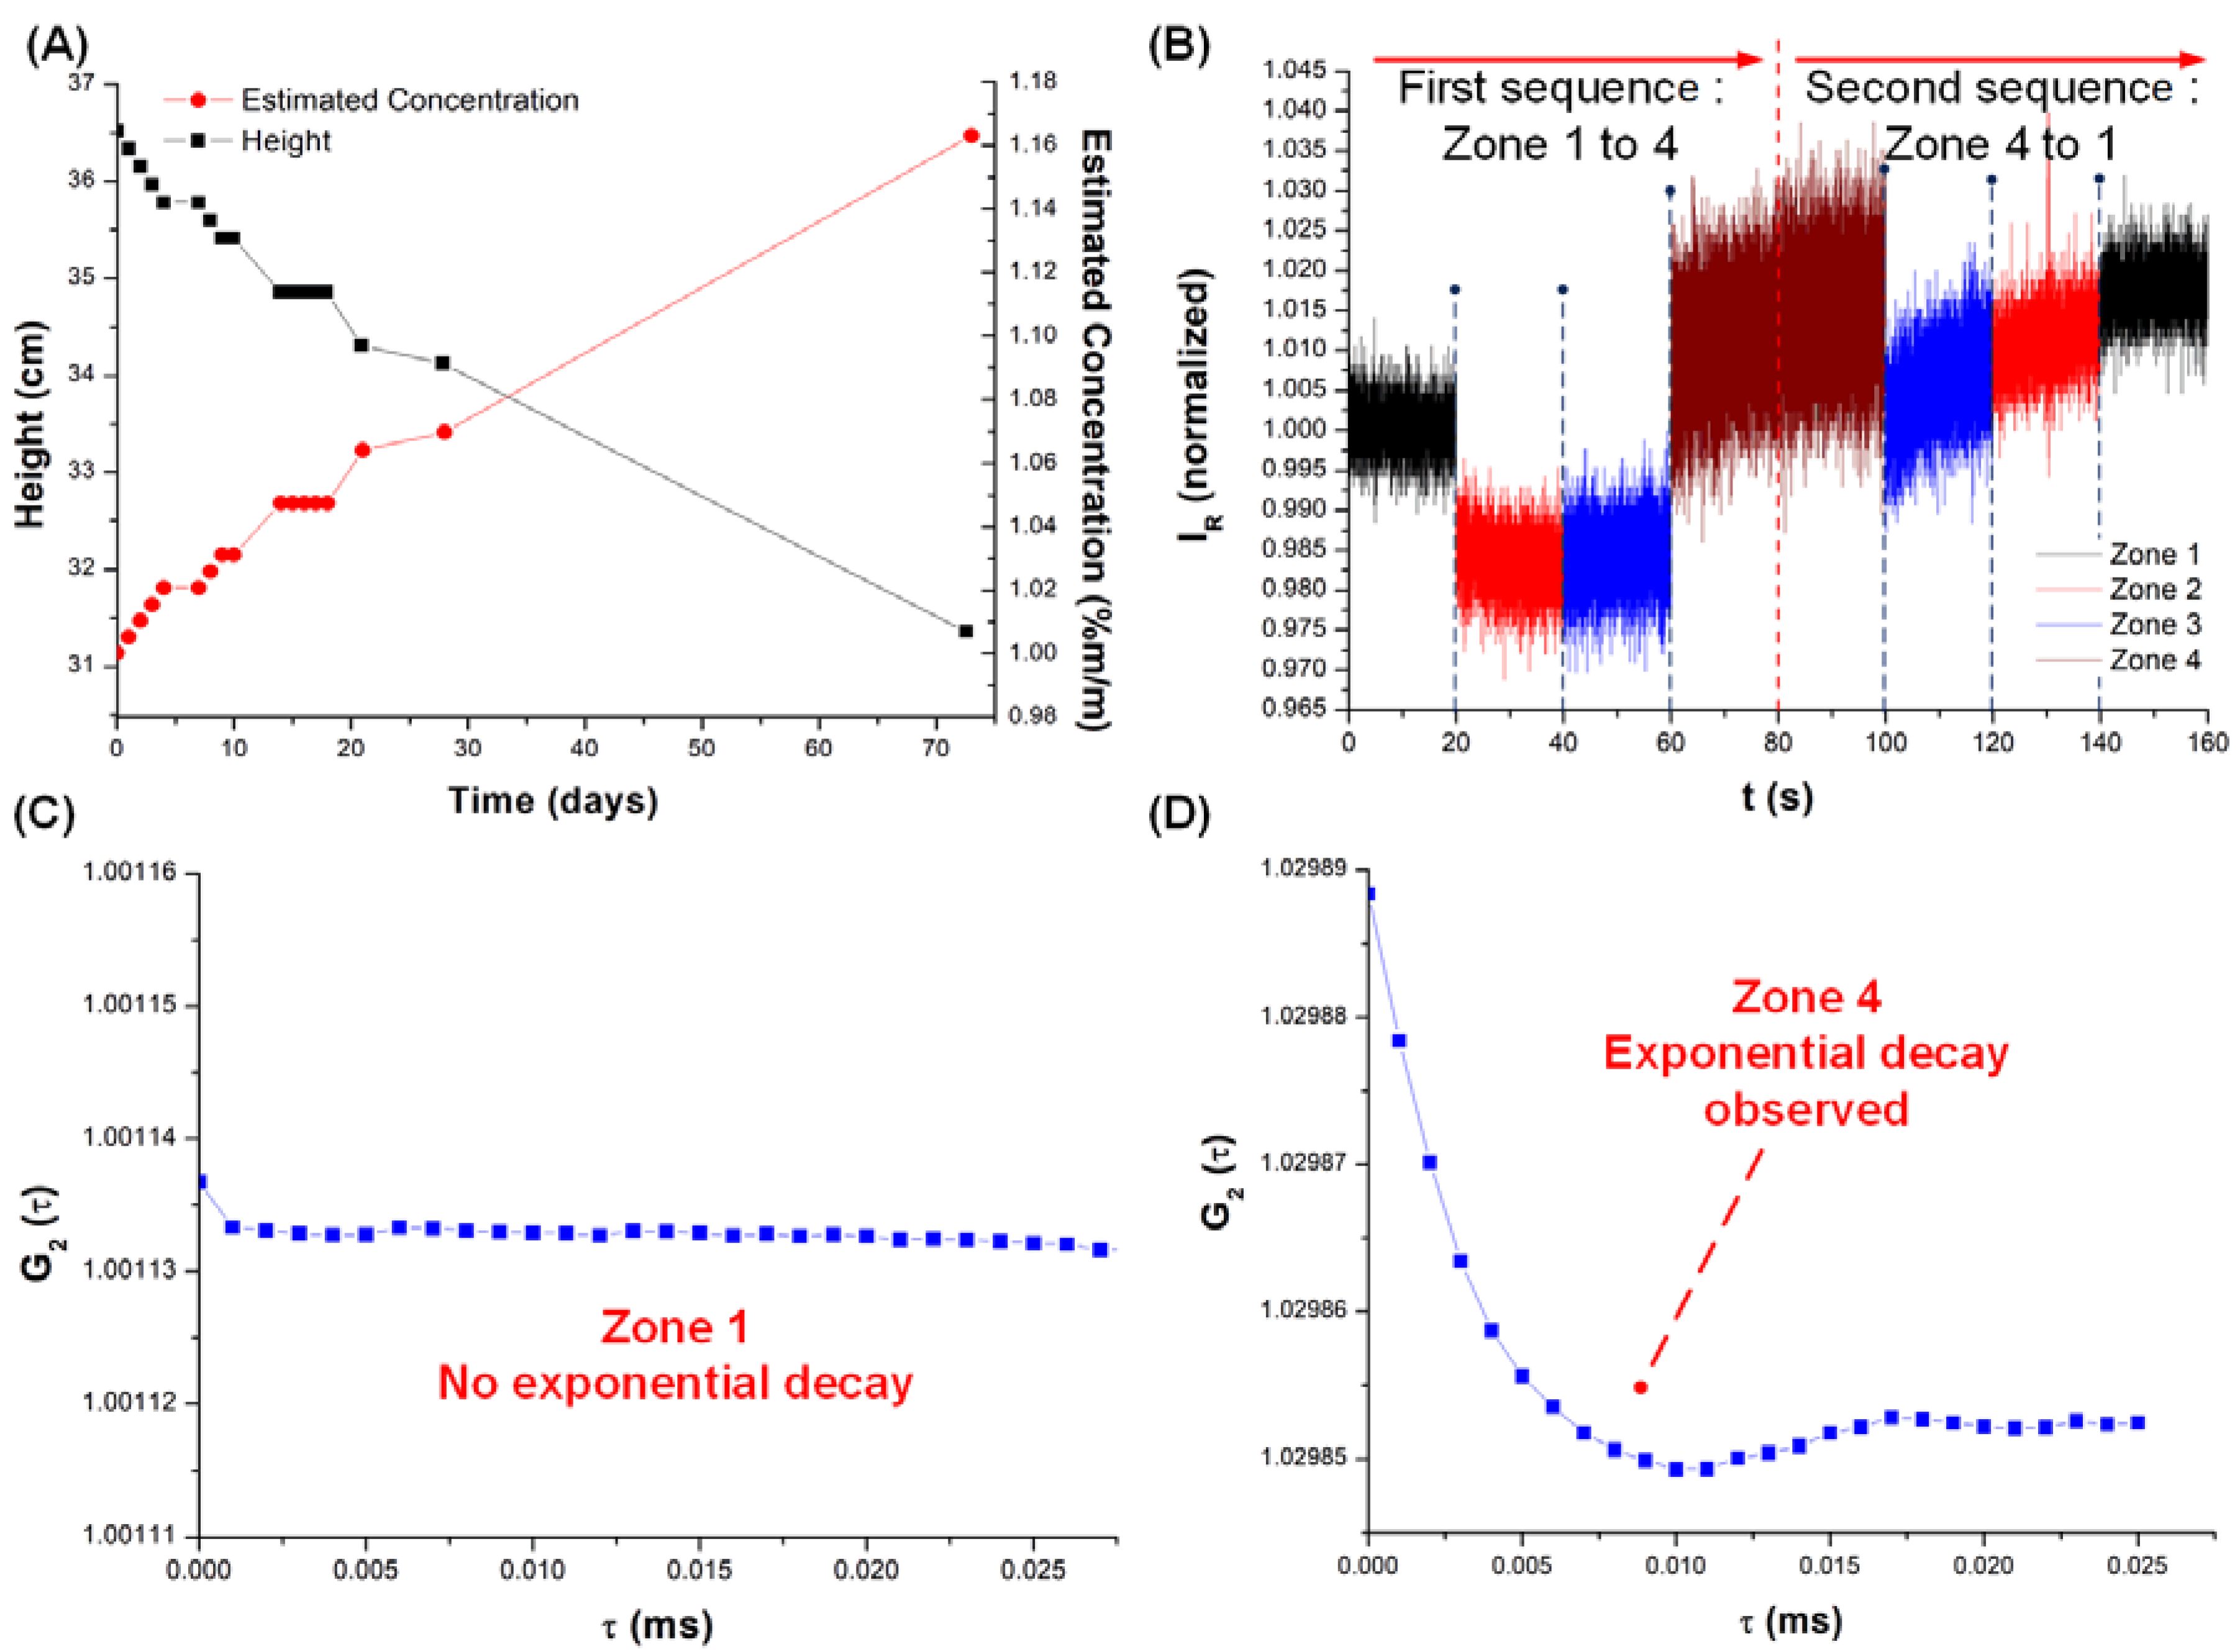
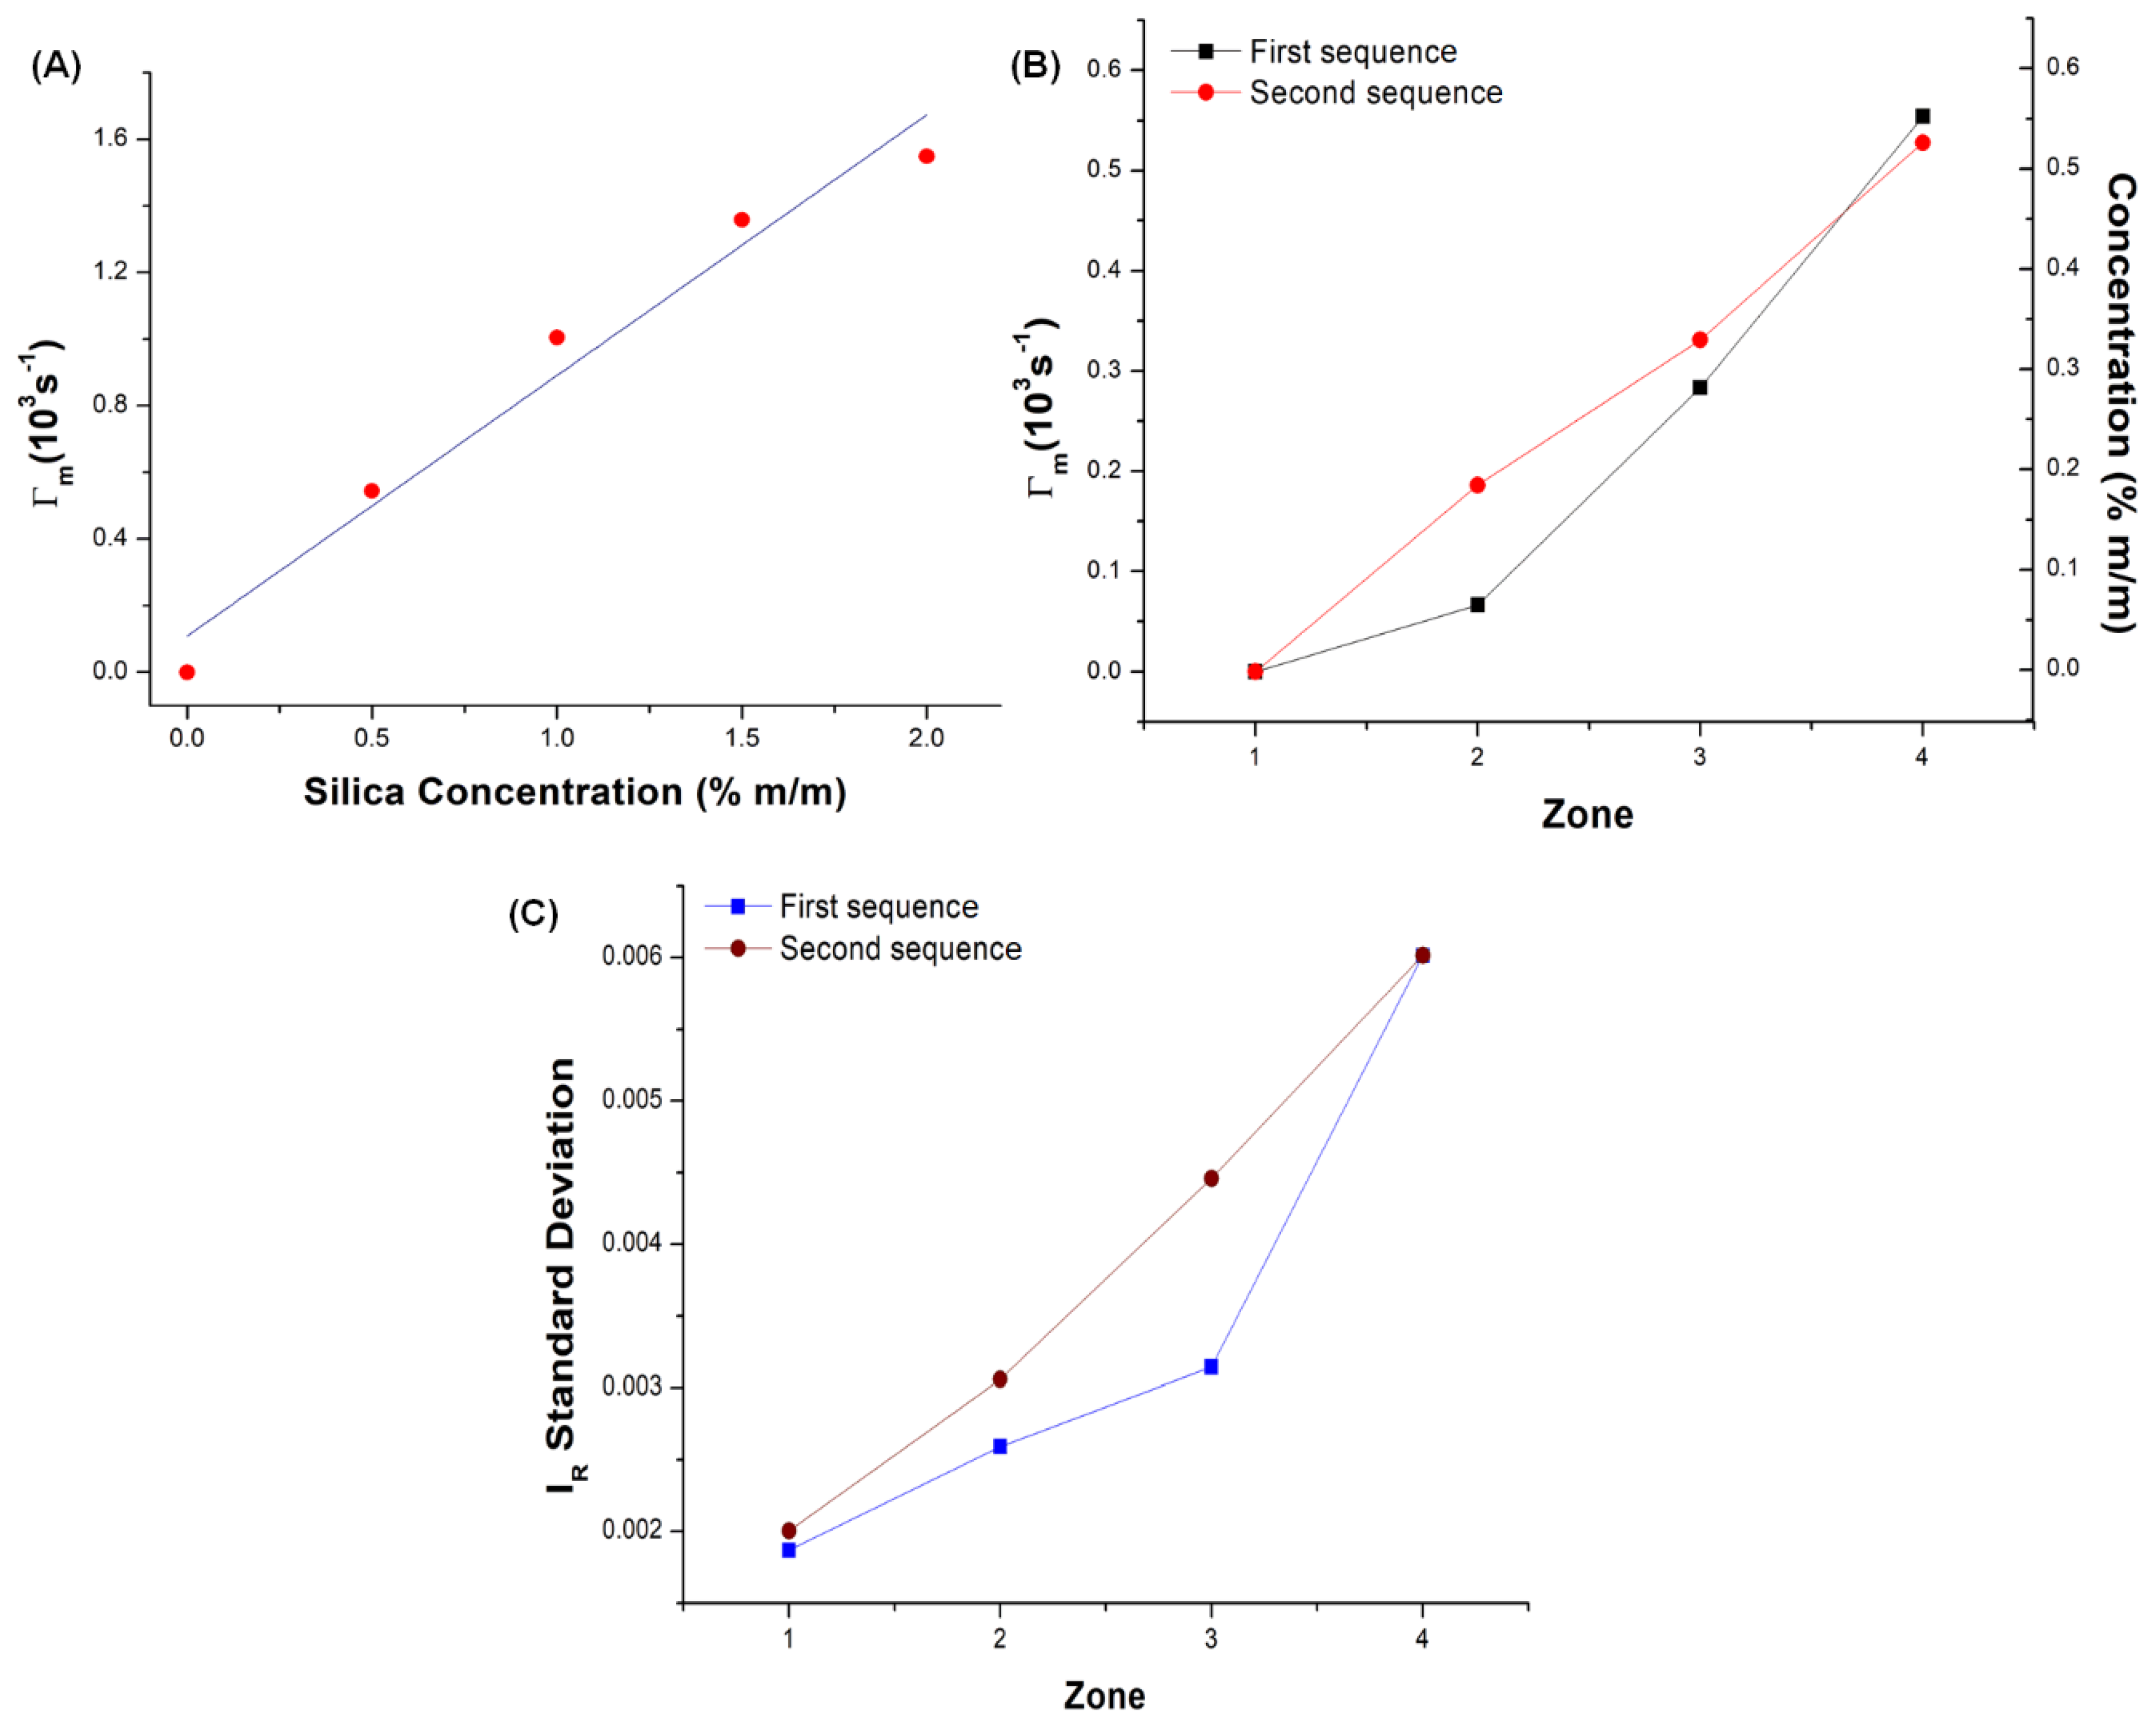
3. Results and Discussion

Figure 3A shows the heights h of the end of the clarified zone during 73 days of experiment and the concentrations estimated by Equation (3). The OFS was used for evaluating the clarified zone during all the experiment, but no QELS phenomenon was observed, showing that the clarified is approximately free of particles.
The sensor probe was sequentially moved from Zone 1 to Zone 4 (concentration of 1.16%, estimated from Equation (3)), in the first sequence of step disturbances, and then a second sequence was performed, from Zone 4 to Zone 1, as shown on Figure 3B. Figure 3C shows G2(τ) obtained for Zone 1 (clarified), with no exponential decay (no QELS detected), whereas, Figure 3D shows one of the G2(τ) obtained for Zone 4, with the exponential decay characteristic from the scattering (Equation (2)).
In order to assess the concentration in each zone, a calibration curve was obtained by calculating Γm for suspensions with a known concentration of silica, Figure 4A. The linear correlation of the experimental data (Γm = 0.78288C + 0.10898, C in % m/m, R2 = 0.95942), yielding 0.78288 × 10³ s−1 sensitivity. Figure 4B shows the Γm calculated for each zone and the concentration obtained with the calibration curve, and Figure 4C shows the standard deviations σ of the signals in each zone.
The results show the same tendencies between Γm and σ with similar behaviors for both sequences. Figure 3B shows small modifications of the average signal when the probe is moved from one zone to another, which is probably caused by fiber macrocurvature losses. It is also possible to evaluate the lowest and highest signal-to-noise ratios (SNRs) as μ22, where μ is the average signal [6]: 2.604 × 10⁴ (Zone 4, second sequence) and 2.869 × 10⁵ (Zone 1, first sequence), respectively.
A remarkable result is of the fact that the measured concentrations were substantially inferior to the traditional model of Equation (3): The particles are not all concentrated in the same zone, but distributed between them. The sensor showed itself a versatile and simple tool for measuring disturbances on the concentration of the particles, which result in variations of both Γm and the standard deviation.

4. Conclusions

In this research, it was shown how a simple optical fiber sensor could be used for the monitoring of a multi-concentrated colloidal system, by creating an environment comprised of different sedimentation zones, suitable for the simulation of concentration step disturbances. The method has showed itself reliable for the monitoring of such environment—providing data that can be interpreted both in terms of data dispersion, and of the decay rate of the autocorrelation function, allowing the evaluation of the concentration. The information collected with the system shows that the real concentration values are very different from the ones estimated by the simple sedimentation models traditionally applied. This fact is of great practical importance: Once these models are used not only for the monitoring, but for the project of industrial equipment, such as sedimentation tanks, which are applied to environmental procedures [7], the more precise information can save costs of fabrication and allow the obtention of more efficient equipment. Therefore, it is possible to figure out many applications on industries and laboratories which works with particulate liquid systems, from the control and monitoring to the engineering projects.

Author Contributions

Conceptualization, formal analysis and writing—original draft preparation, M.C.P.S.; preparation of the colloidal suspensions, setup and experimental procedure, M.S.R. and M.K.G.; synthesis, SEM and DLS analyses of SiO2, E.A.S. and G.P.; preparation of the computational routine for signal windowing, W.H.A.S.; supervision, project administration, funding acquisition and writing—review and editing, E.F. and C.K.S.

Funding

This research was funded by São Paulo Research Foundation (FAPESP), grant number 2017/20445-8.

Conflicts of Interest

The authors declare no conflict of interest.

References

  1. Hunter, R.J. Foundations of Colloid Science, 2nd ed.; Oxford University Press: Oxford, UK, 2004. [Google Scholar]
  2. Hall, J.B.; Dobrovolskaia, M.A.; Patri, A.K.; McNeil, S.E. Characterization of nanoparticles for therapeutics. Nanomedicine 2007, 2, 789. [Google Scholar] [CrossRef] [PubMed]
  3. Buhr, E.; Senftleben, N.; Klein, T.; Bergmann, D.; Gnieser, D.; Frase, C.G.; Bosse, H. Characterization of nanoparticles by scanning electron microscopy in transmission mode. Meas. Sci. Technol. 2009, 20, 084025. [Google Scholar] [CrossRef]
  4. Heurlin, M.; Anttu, N.; Camus, C.; Samuelson, L.; Borgström, M.T. In situ characterization of nanowire dimensions and growth dynamics by optical reflectance. Nano Lett. 2015, 15, 3597–3602. [Google Scholar] [CrossRef] [PubMed]
  5. Udd, E. Overview of Fiber Optic Sensors. In Fiber Optic Sensors; Yu, F.T.S., Yin, S., Eds.; Marcel Dekker (Taylor and Francis): Abingdon, UK, 2002. [Google Scholar]
  6. Soares, M.C.P.; Vit, F.F.; Suzuki, C.K.; de la Torre, L.G.; Fujiwara, E. Perfusion Microfermentor Integrated into a Fiber Optic Quasi-Elastic Light Scattering Sensor for Fast Screening of Microbial Growth Parameters. Sensors 2019, 19, 2493. [Google Scholar] [CrossRef] [PubMed]
  7. McCabe, W.L.; Smith, J.C.; Harriott, P. Unit Operations of Chemical Engineering, 5th ed.; McGraw-Hill: New York, NY, USA, 1993. [Google Scholar]
  8. Fujiwara, E.; Gomes, M.K.; Soares, M.C.P.; Rodrigues, M.S.; Schenkel, E.A.; Suzuki, C.K. Characterization of Colloidal Silica by Optical Fiber Sensor. In Proceedings of the 2018 SBFoton International Optics and Photonics Conference (SBFoton IOPC), Campinas, Brazil, 8–10 October 2018. [Google Scholar] [CrossRef]
  9. Finsy, R. Particle sizing by quasi-elastic light scattering. Adv. Coll. Interf. Sci. 1994, 52, 79–143. [Google Scholar] [CrossRef]
  10. Welty, J.R.; Wicks, C.E.; Wilson, R.E.; Rorrer, G.L. Fundamentals of Momentum, Heat and Mass Transfer, 5th ed.; John Wiley and Sons: Hoboken, NJ, USA, 2008. [Google Scholar]
Figure 1. (A) Schematics of the VAD system with the main processes parameters; (B) SEM image of silica nanoparticles; (C) Size distribution of particles (average diameter of 189 nm).
Proceedings 42 00006 g001
Figure 2. Test tube containing the colloidal silica: (A) First day of experiment; (B) 73 days after the beginning of sedimentation; (C) 4 different sedimentation zones that could be distinguished on day 73. Each zone presents a different value of particles concentration, creating an environment where it is possible to simulate concentration disturbances (heights expressed in cm units); (D) optical fiber sensor (OFS), used for evaluating the concentration disturbances.
Proceedings 42 00006 g002
Figure 3. (A) Average values of the heights verified for the two tubes and concentrations estimated from Equation (3) (secondary vertical axis); (B) sequential step disturbances on the concentration of the OFS probe; (C) G2(τ) obtained for Zone 1; (D) G2(τ) obtained for Zone 4, with an exponential decay.
Proceedings 42 00006 g003
Figure 4. (A) Calibration curve; (B) Γm and concentrations; (C) standard deviations in each zone.
Proceedings 42 00006 g004
Publisher’s Note: MDPI stays neutral with regard to jurisdictional claims in published maps and institutional affiliations.

