Proceeding Paper

Discrete Element Modelling of Compressive Strength Testing of No-Fines Concrete †

Department of Construction Materials and Technologies, Budapest University of Technology and Economics,1111 Budapest, Hungary
*
Author to whom correspondence should be addressed.
Presented at the 18th International Conference on Experimental Mechanics (ICEM18), Brussels, Belgium, 1–5 July 2018.
Proceedings 2018, 2(8), 555; https://doi.org/10.3390/ICEM18-05470
Published: 2 August 2018
(This article belongs to the Proceedings of The 18th International Conference on Experimental Mechanics)

Abstract

:
Discrete Element modelling of concrete requires the precise calibration of model parameters that is a long lasting and computationally expensive task in case of complex models. Present study introduces a method for estimating a model parameter (normal strength of parallel bonds) for concretes with different particle size distribution and aggregate type. The parameter estimation leads to an optimization problem based on physical measurement data. In the present paper, a model and its parameters are proposed to estimate normal strength of parallel bonds based on the density and compressive strength of concrete.

1. Introduction

Present research introduces a method for estimation of model parameters in a Discrete Element model, which can be applied for concretes with various aggregate type and particle size distribution, even for no-fines concrete.
No-fines concrete is obtained by eliminating the fine aggregate fraction from the normal concrete mix [1]. The coarse aggregates are surrounded and held together by only a thin layer of cement paste, which makes no-fines concrete economically and environmentally beneficial. In the presented research no-fines concretes made from different aggregates and with low cement amount were casted and tested for compressive strength. Crushed limestone, quartz gravel and expanded clay (lightweight aggregate) were used as aggregates in the mixes. Three different aggregate size distributions were applied in the mixes. The first distribution was close to the standard grading curve A (containing smaller particles in larger quantities), while the second was close to the standard grading curve C (containing higher amount of larger particles). The third was a no-fines concrete containing only coarse aggregate. Standard size (150 mm edge length) concrete cubes were casted from every mix and were subjected to uniaxial compressive strength test. The materials and the test were modelled using Discrete Element Method (DEM). In DEM the most challenging task is the calibration of the model parameters which can be supported by models estimating the DEM model parameters based on physical measurement data. In the present study the authors aim to give a calibration supporting function which can be applied for concretes with different particle size distribution and aggregate type.

2. Materials and Methods

2.1. Concrete Mixes and Laboratory Experiments

Seven different concrete mixes were designed for the experiments. The type of cement was the same for every mixes: CEM I 42.5 N and the water-to-cement ratio was the same as well (w/c = 0.67). The main differences among the mixes were the type and distribution of aggregates. Four nominal grading fractions according to European Standard EN 12620:2002 + A1:2008 [2] were used: fine sand 0/0.5, sand 0.5/4 mm, small gravel 4/8 mm and medium gravel 8/16 mm. The maximum particle size was 16 mm in case of gravel and crushed stone aggregate, while it was 8 mm in case of lightweight aggregate. Table 1 summarizes the different mixes and their corresponding particle size distribution.
Crushed stone and gravel aggregate were applied in the mixes with different particle size distribution according to grading curves C and A. Grading curves A and C are the limits of particle size distributions, between which normal concrete can be produced. In case of gravel aggregate the ideal particle size distribution is according to curve A generally (in case of self-compacting concrete according to curve B). Besides that a no-fines (N) concretes were mixed from both normal weight aggregate. A lightweight aggregate mix (Light N) containing expanded clay was produced as well. From every mix standard size (150 mm edge length) cube samples were casted and uniaxial compressive strength test was performed on them. The compressive strength of the concretes was determined at 28 days of age after wet curing of the 150 mm edge length specimens according to European Standard EN 12390-3:2009 [3]. The test was performed using an Alpha 3-3000 S hydraulic press with 11.25 kN/s (static) loading rate. Young’s modulus of the samples was measured as well, however it was not considered later in the study, because it was almost the same for all mixes.

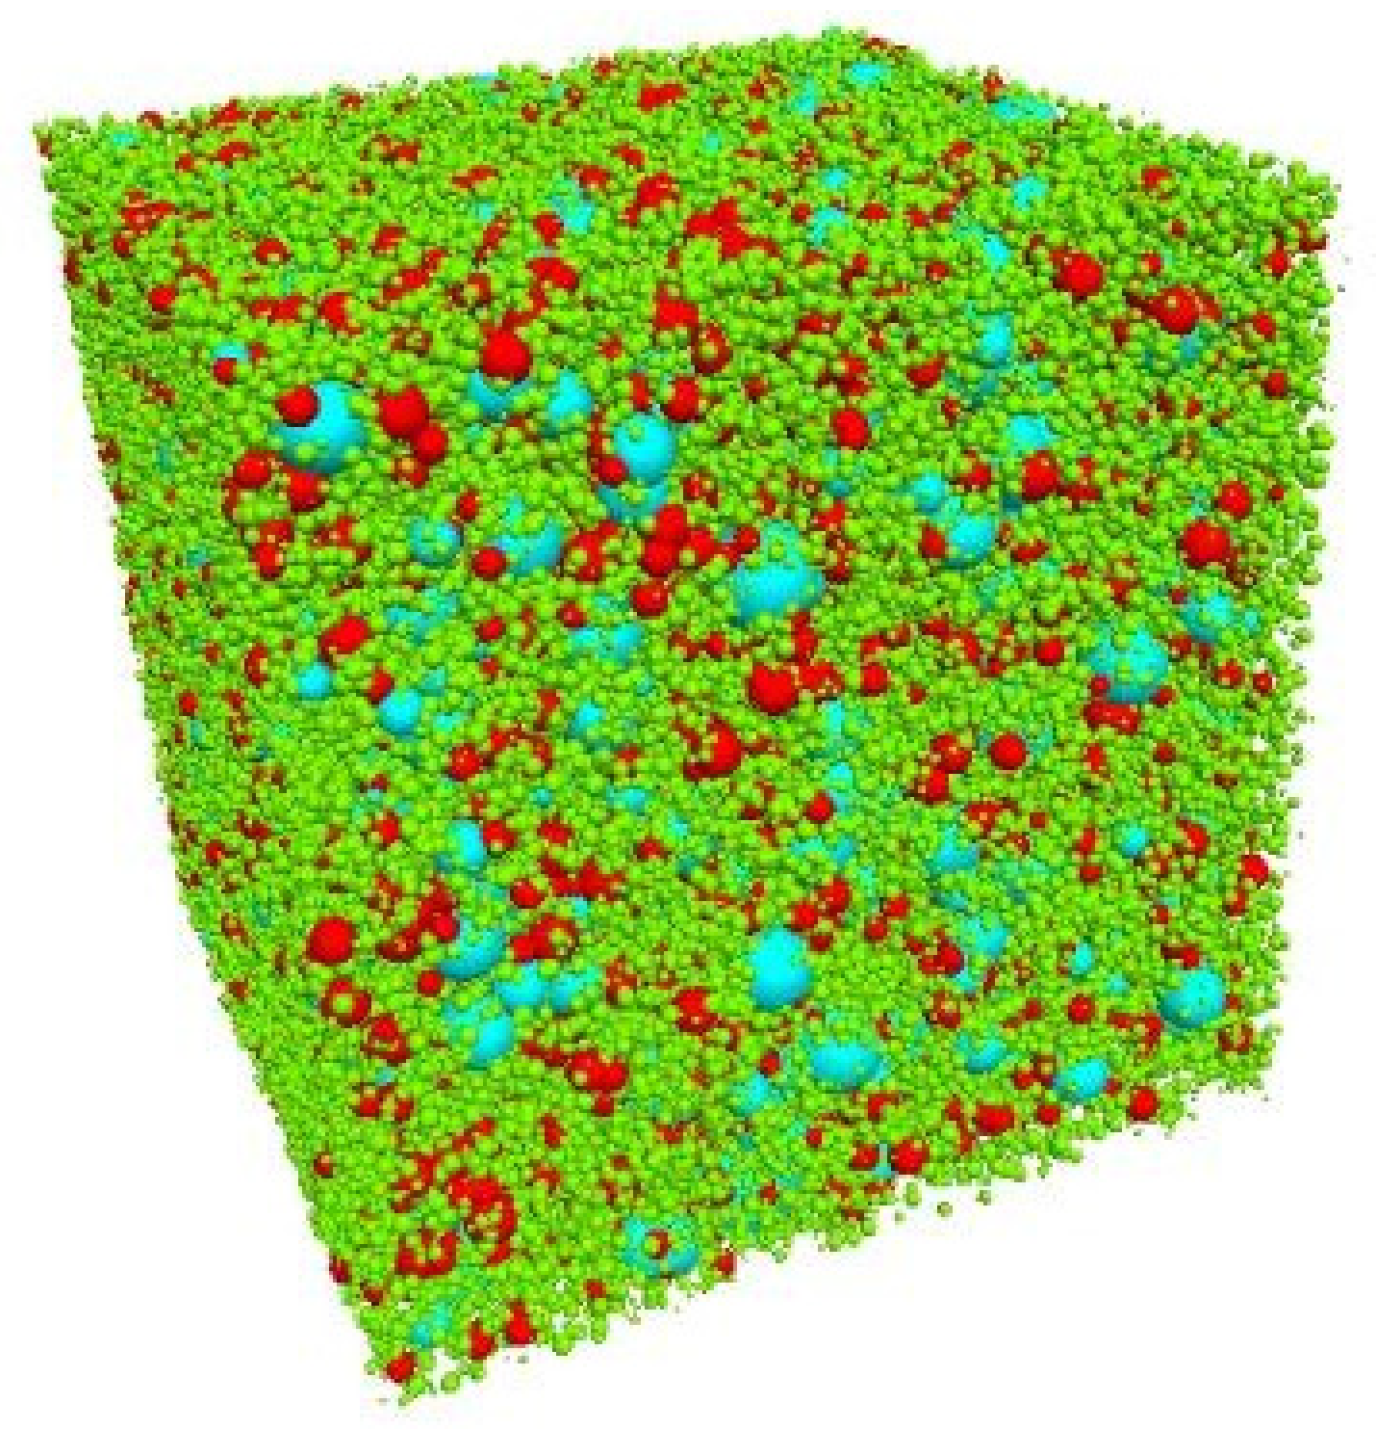
2.2. Numerical Simulation

Discrete Element Method (DEM) was used to model the concrete samples and their compressive strength test. In DEM the material is built up from rigid particles and contacts among the particles. The material model is described by the contacts and the rigid elements represent the aggregate of the concrete (the binder is not modelled by particles, its effect is taken into account by the contacts). The term DEM refers to a group of numerical methods. One of these methods is the distinct element method, introduced by Cundall, which is applied in present research [4]. This method uses only spherical particles to describe the material, however by using a clump logic, the method supports the creation of super-particles of arbitrary shape. Hence, a clump consists of a set of overlapping spherical particles, and behaves as a single rigid body with a deformable boundary. It was aimed to observe the effect of different particle shape (of the real material) on the parameters of the model. The quartz gravel aggregate in shape is closer to the modelled spherical particles, than the angular crushed stone. These differences can be taken into account in the model parameters. The particle size distribution of the aggregate can be considered in the model too, thus it was possible to investigate the effect of different particle size distribution as well, as it can be seen in Figure 1. From every mix at least 5 models with random particle arrangements were generated to take into account the effect of different failure modes in case of different geometrical arrangements of particles [5].
In the DEM model, the particles can have a density, which makes it possible to consider the lightweight and recycled aggregate as well. The most challenging part is the calibration of model parameters. To set up DEM model parameters, usually an iterative approach is used, during which the chosen parameter is changed and its effect is observed on the outcome of a chosen material test (in our case on the compressive strength test). The iteration process has the following steps:
  • Set the parameters (in our case the strength of parallel bonds) of the model to a given value.
  • Generate the model with a dense packing.
  • Run a uniaxial compression test.
  • Compare the value of the test with the result of the laboratory tests. If the difference between the model and the laboratory results is smaller than a given threshold then the model is considered to be set up.
However, in DEM the most time consuming task is to generate a new model with dense packing, which has to be done in every iteration step. Depending on the size of the model (the number of particles) it could take a long time, which strongly decreases the productivity of the method. Therefore, it is beneficial if the model parameters could be estimated to calibrate the model.
Most of the calibrations are performed using a “trial and error” method [6]. However, most researchers develop a systematic method to vary each input parameters, and some of them developed sophisticated calibration strategies [7]. As an example, in the study of Kulatilake, et al., the calibration of the model against the laboratory test data was done by making an initial guess that the contact normal stiffness of the model (kn) is proportional to the Young’s modulus (E) of the rock [8]. The guess was that E = kn × 4R, where R is the particle radius. Based on this assumption they carried out a parametric study to introduce calibration curves to select the optimal contact parameters. Similar method was presented by Cheung to set up a DEM model of a reservoir sandstone [9]. Besides that, there were studies that dealt with the calibration of rocks in DEM and illustrated that the rock mass response strongly depends on the particle size distribution [10,11,12]. Other approaches that proved to be useful in other areas, like Design of Experiment (DOE) method, were applied to DEM model calibration as well [13,14]. DOE is a well organized approach to determine the relationship between parameters affecting a process and the outcome; it was used by Favier to calibrate a DEM model of unbonded particles.
Potyondy and Cundall (2004) studied which parameters have the most significant influence on the overall material response for a bonded particle model [15]:
  • particle size distribution,
  • packing of the particles
  • and the contact model.
In the present study the particle size distribution of the material was followed in the model, a sufficiently dense packing was applied and the contact model was calibrated against physical tests. The system of a DEM contact model is complex and many parameters influence it and there can be even interaction between the various parameters. However, it can be determined which parameters have major and minor effects on the outcome of a given test. For example the main parameter in DEM affecting the compressive strength of the modelled material is the mean normal strength of the parallel bonds. In our research the normal strength of the parallel bonds was modified in every iteration until the modelled compressive strength did not match with the measured.

2.3. Parameter Estimation

Present study aims to find a way to estimate the normal strength of the parallel bonds of the DEM model based on the compressive strength and the density of the real material. A set of parameters are applied, which has to be optimized based on the experimental data. The solution of the optimization problem is the estimated parameter values set. Numerous methods can be found in the literature to solve a multi-parameter optimization problem [16]. The most widely used methods are Nonlinear Least Squares method, Gradient Descent method and Simplex search method. All these estimation methods minimize a cost function (an error or objective function, which is the measure of the difference between the simulated and measured response) like the sum of squared errors (SSE) or the sum of absolute errors (SAE). The optimization is performed on an iterative way, where in every iteration step the parameters are tuned (based on the minimized cost function) to obtain a simulated response that tracks the measured response. Based on the knowledge on the system the initial state, limits and constraints of the parameters could be approximated. Appropriate choice of these could lead to better performance and less iteration steps. Optimization terminates when successive parameter values change less than the parameter tolerance (a predefined threshold value) or the maximum number of iteration is reached. In the present research Nonlinear Least Squares (Levenberg-Marquardt) method were used, applying SSE cost function.
This study aims to describe the relationship between the normal strength of the parallel bonds (σpb—DEM model variable), the density ( ρ ) and the compressive strength (σcomp) of the real material. The relationship can be formulated as:
σ p b = f ( σ c o m p ,   ρ )
The proposed function can be expressed as follows:
σ p b = f L i g t h w e i g t h · f C r u s h e d · f N o F i n e s · f R a t i o · f D e n s i t y · σ c o m p
where:
  • fligthweigth is the lightweight factor, taking into account the effect of lightweight aggregate and it is expressed as follows:
f L i g t h w e i g t h = c l i g h t w e i g h t ρ
where clightweiht is a parameter.
  • fcrushed is a parameter.
  • fnofines is the no-fines factor, taking into account the effect of the absence of fine aggregate and it is expressed as follows:
f N o F i n e s = ( ρ c n o f i n e s ) 2 ,
where cnofines is a parameter.
  • fRatio is a multiplier parameter, which describes the relationship of the bond strength and the compressive strength.
  • fDensity is the density factor, taking into account the effect of different densities:
f D e n s i t y = c d e n s i t y ρ
where cdensity is a parameter.
The model parameters below were optimized where the following initial conditions were used:
  • clightweiht —2000 (kg/m3)
  • fcrushed —1 (-)
  • cnofines—2000 (kg/m3)
  • fRatio —1 (-)
  • cdensity —2000 (kg/m3)
All parameters must be larger than zero by definition. Using the above described model, the parameters were optimized. There are many further parameters (size effect, cement type, w/c ratio, etc.), which can influence the estimation of DEM model parameters, however present research is only aiming to consider different aggregate types and particle size distributions.

3. Results and Discussion

Table 2 contains the results of the laboratory experiments and the final mean normal strength of the parallel bonds from the DEM model.
Table 2 shows that as it was expected the Gravel A mix has higher compressive strength than Gravel C, because in case of quartz gravel aggregate the A curve (containing more fine particles) is more beneficial. It can also be seen that no-fines concretes (N) have lower compressive strength compared to the other mixes, which is caused by their low cement content. The final values of the normal strength of parallel bonds were reached after more than 12 iteration steps. As it can be seen from the table, there is no obvious connection between the values of compressive strength and bond strength. The model described in Section 2.3 was applied on the results and the parameters were estimated. The final values that resulted the best fit are the following.
By applying the parameters described in Table 3, the error of the estimation (in average) became less than 2%, while the maximum error was less than 3.5%. These error values are below the accuracy of the physical measurement, which is around 5%. The derived equation with the optimized parameters were tested on another data set as well, containing different gravel aggregate concretes, lightweight concretes and no-fines concretes. The error of the estimation was less than 8% in this case. It is worth to mention that by just random picking the initial value for the mean bond strength of the parallel bonds at least 12 iterations were needed to calibrate the model, while using the above described estimation model the number of iterations were maximum 4. Thus, the computational time was decreased significantly and the application of DEM became more productive.

4. Conclusions

In the present study a parameter estimation method was introduced for Discrete Element models. The normal strength of parallel bonds was estimated by using an estimation model, which is able to consider the effect of different aggregate types and particle size distribution. By applying the proposed model the normal strength of parallel bonds can be estimated and thus the number of iterations required to calibrate a DEM model can be significantly decreased. It has to be mentioned that many further parameters (like size effect, cement type, w/c ratio, etc.) affect the estimation which was not taken into account in this study, therefore they are subjects of further research.

Author Contributions

Z.G. and R.N. conceived, designed and performed the experiments; Z.G. designed the numerical models; Z.G. and R.N. analyzed the data and results; Z.G. wrote the paper.

Funding

This research was funded by the Hungarian Scientific Research Fund (OTKA) grant number K 109233.

Acknowledgments

Authors are grateful to the Hungarian Scientific Research Fund (OTKA) for the financial support of OTKA K 109233 research project and to Itasca Consulting Group for providing the software PFC3D.

Conflicts of Interest

The authors declare no conflict of interest. The founding sponsors had no role in the design of the study; in the collection, analyses, or interpretation of data; in the writing of the manuscript, and in the decision to publish the results.

References

  1. Carsana, M.; Tittarelli, F.; Bertolini, L. Use of no-fines concrete as a building material: Strength, durability properties and corrosion protection of embedded steel. Cem. Concr. Res. 2013, 48, 64–73. [Google Scholar] [CrossRef]
  2. European Committee for Standardization (CEN). Aggregates for Concrete; EN 12620:2002+A1:2008 European Standard: Brussels, Belgium, 2002. [Google Scholar]
  3. European Committee for Standardization (CEN). Testing hardened concrete, Compressive Strength of Test Specimens; EN 12390-3:2009 European Standard: Brussels, Belgium, 2002. [Google Scholar]
  4. Cundall, P.A. A computer model for simulating progressive large scale movements in blocky rock systems. In Proceedings of the International Symposium on Rock Mechanics, Nancy, France, 4–6 October 1971; Volume 1, p. II-8. [Google Scholar]
  5. Bagi, K.; Bojtár, I.; Gálos, M. A note on the role of internal structure of rocks in the deviations of compression strength results. Period. Polytech. Ser. Civ. Eng. 1999, 43, 169–178. [Google Scholar]
  6. O’Sullivan, C. Particulate Discrete Element Modelling: A Geomechanics Perspective, 1st ed.; Spoon Press: London, UK, 2011; pp. 422–431. [Google Scholar]
  7. Wang, Y.; Tonon, F. Calibration of a discrete element model for intact rock up to its peak strength. Int. J. Numer. Anal. Methods Geomech. 2010, 34, 447–469. [Google Scholar] [CrossRef]
  8. Kulatilake, P.H.S.W.; Liang, J.; Gao, H. Experimental and numerical simulations of jointed rock block strength under uniaxial loading. J. Eng. Mech. 2001, 127, 1240–1247. [Google Scholar] [CrossRef]
  9. Cheung, G. Micromechanics of Sand Production in Oil Wells. Ph.D. Thesis, Imperial College, London, UK, 2010. [Google Scholar]
  10. Schöpfer, M.P.; Abe, S.; Childs, C.; Walsh, J.J. The impact of porosity and crack density on the elasticity, strength and friction of cohesive granular materials: Insights from DEM modelling. Int. J. Rock Mech. Min. Sci. 2007, 46, 250–261. [Google Scholar] [CrossRef]
  11. Cho, N.; Martin, C.; Sego, D.C. A clumped particle model for rock. Int. J. Rock Mech. Min. Sci. 2007, 44, 997–1010. [Google Scholar] [CrossRef]
  12. Camusso, M.; Barla, M. Microparameters calibration for loose and cemented soil when using particle methods. Int. J. Geomech. 2009, 9, 217–229. [Google Scholar] [CrossRef]
  13. Yoon, J. Application of experimental design and optimization to PFC model calibration in uniaxial compression simulation. Int. J. Rock Mech. Min. Sci. 2007, 44, 871–889. [Google Scholar] [CrossRef]
  14. Favier, J.F.; Abbaspour-Fard, M.H.; Kremmer, M. Modeling nonspherical particles using multisphere discrete elements. ASCE J. Eng. Mech. 2001, 127, 969–1074. [Google Scholar] [CrossRef]
  15. Potyondy, D.O.; Cundall, P.A. A bonded-particle model for rock. Int. J. Rock Mech. Min. Sci. 2004, 41, 1329–1364. [Google Scholar] [CrossRef]
  16. Pollard, D.; Radchenko, P. Nonlinear least-squares estimation. J. Multivar. Anal. 2006, 97, 548–562. [Google Scholar] [CrossRef]
Figure 1. Discrete Element model of a 150 mm edge length concrete cube. Each color marks a different fraction (green: 0/4; red: 4/8; cyan: 8/16).
Proceedings 02 00555 g001
Table 1. Particle size distribution (given in percentage (%)) of the concrete mixes.
Name/Particle Size (mm)8/164/80.5/40/0.5
Gravel C 115153040
Gravel A 130302515
Gravel N 1505000
Light N010000
Crushed C15153040
Crushed A30302515
Crushed N505000
1 C—grading curve C; A—grading curve A; N—no-fines.
Table 2. Experimental (density and compressive strength) and numerical (Normal strength of parallel bonds) results.
Name/PropertyDensity (kg/m3)Compressive Strength (N/mm2)Normal Strength of Parallel Bonds (N/mm2)
Gravel C225726.720.8
Gravel A234332.024.5
Gravel N209522.521.2
Light N120016.017.5
Crushed C236453.342.3
Crushed A243040.632.4
Crushed N185410.78.9
Table 3. Optimized model parameters.
clightweightfcrushedcnofinesfratiocdensity
2438.11.042022.90.8452153.9
Publisher’s Note: MDPI stays neutral with regard to jurisdictional claims in published maps and institutional affiliations.

