Non-Destructive Testing of Composites by Ultrasound, Local Defect Resonance and Thermography †
by
 ,
,
Mathias Kersemans
1,* ,
,
Erik Verboven
1,
Joost Segers
1,
Saeid Hedayatrasa
1,2 and
Wim Van Paepegem
1 1
Mechanics of Materials and Structures (UGent-MMS), Department of Materials, Textiles and Chemical Engineering (MaTCh), Ghent University, Technologiepark-Zwijnaarde 903, 9052 Zwijnaarde, Belgium
2
SIM Program M3 DETECT-IV, Technologiepark-Zwijnaarde 935, B-9052 Zwijnaarde, Belgium
*
Author to whom correspondence should be addressed.
†
Presented at the 18th International Conference on Experimental Mechanics (ICEM18), Brussels, Belgium, 1–5 July 2018.
Proceedings 2018, 2(8), 554; https://doi.org/10.3390/ICEM18-05464
Published: 30 July 2018
(This article belongs to the Proceedings of The 18th International Conference on Experimental Mechanics)
Abstract
:Different non-destructive testing techniques have been evaluated for detecting and assessing damage in carbon fiber reinforced plastics: (i) ultrasonic C-scan, (ii) local defect resonance of front/back surface and (iii) lock-in infrared thermography in reflection. Both artificial defects (flat bottom holes and inserts) and impact damage (barely visible impact damage) have been considered. The ultrasonic C-scans in reflection shows good performance in detecting the defects and in assessing actual defect parameters (e.g., size and depth), but it requires long scanning procedures and water coupling. The local defect resonance technique shows acceptable defect detectability, but has difficulty in extracting actual defect parameters without a priori knowledge. The thermographic inspection is by far the fastest technique, and shows good detectability of shallow defects (depth < 2 mm). Lateral sizing of shallow damage is also possible. The inspection of deeper defects (depth > 3–4 mm) in reflection is problematic and requires advanced post-processing approaches in order to improve the defect contrast to detectable limits.
1. Introduction
Fiber reinforced plastics (or composites) are widely used in many advanced engineering structures because of their high specific stiffness and strength. A major drawback of composites is their sensitivity to internal damage features. Especially for carbon fiber reinforced plastics (CFRP) laminates, a small impact event could lead to large internal delaminations affecting the structural integrity [1]. To assure the structural performance of composite components, several non-destructive testing (NDT) techniques have been developed and implemented over the last decades [2,3,4,5,6,7,8]. Each of these NDT techniques has its advantages, but equally has its disadvantages, and even its limitations.
In this study, the following advanced NDT techniques are considered and investigated:
- Ultrasound: C-scan
- Vibrometry: Local Defect Resonance
- Infrared Thermography: lock-in optical stimulation
1.1. Ultrasonic C-Scan
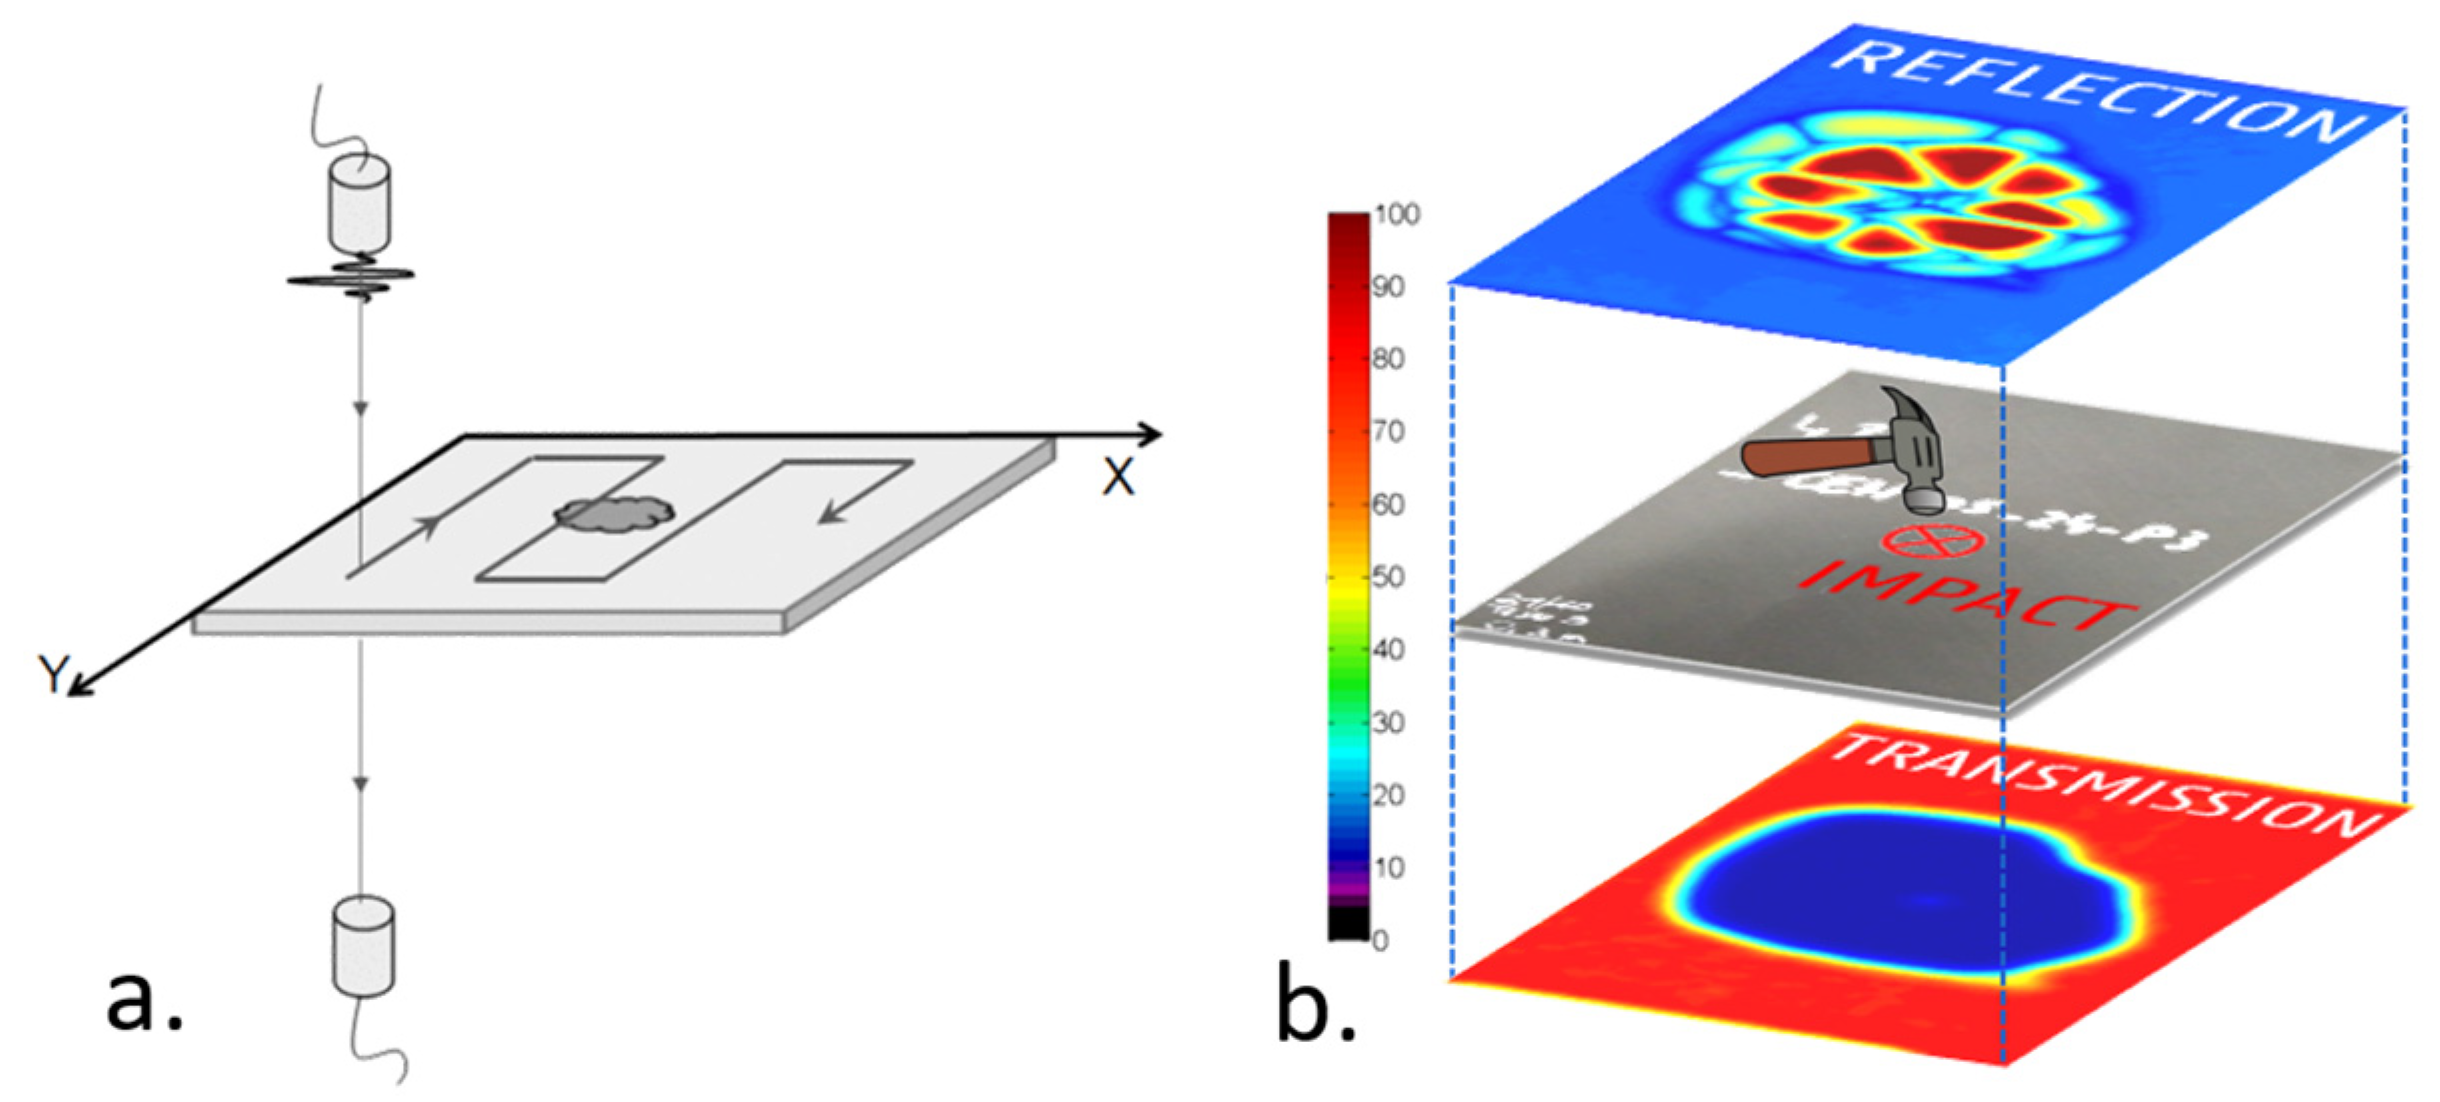
The ultrasonic C-scan is perhaps the most widespread NDT technique [2]. In this technique, the surface of an immersed sample is scanned (see Figure 1), and a projection of the reflected and/or transmitted ultrasound is analyzed. Hence, it is a volumetric inspection method. The transmission C-scan leads to an integrated view of the damage zone, while the reflection C-scan provides details on the depth distribution of the damage zone (see Figure 1b). Typical frequencies are in the low MHz range (1–10 MHz) for composite materials. Lowering the frequency leads to poor spatial resolution as depth profiling is directly related to the ultrasonic wavelength. Increasing the frequency leads to excessive attenuation of the ultrasonic signal in composite materials due to high damping properties of the polymer matrix and scattering at fiber bundles and porosities.
Currently, ultrasonic inspection is a mature NDT technique, and as such is often used to benchmark other techniques. Unfortunately, ultrasonic inspection has some disadvantages concerning inspection speed (point scan) and the requirement of a coupling liquid. Note however that there are several research labs exploring phased array applications to speed up the C-scanning procedure and to extend the inspection capabilities [3], while others focus on novel air-coupled ultrasonic transducers with increased signal-to-noise ratio (SNR) in order to exclude the coupling liquid [4].
1.2. Local Defect Resonance
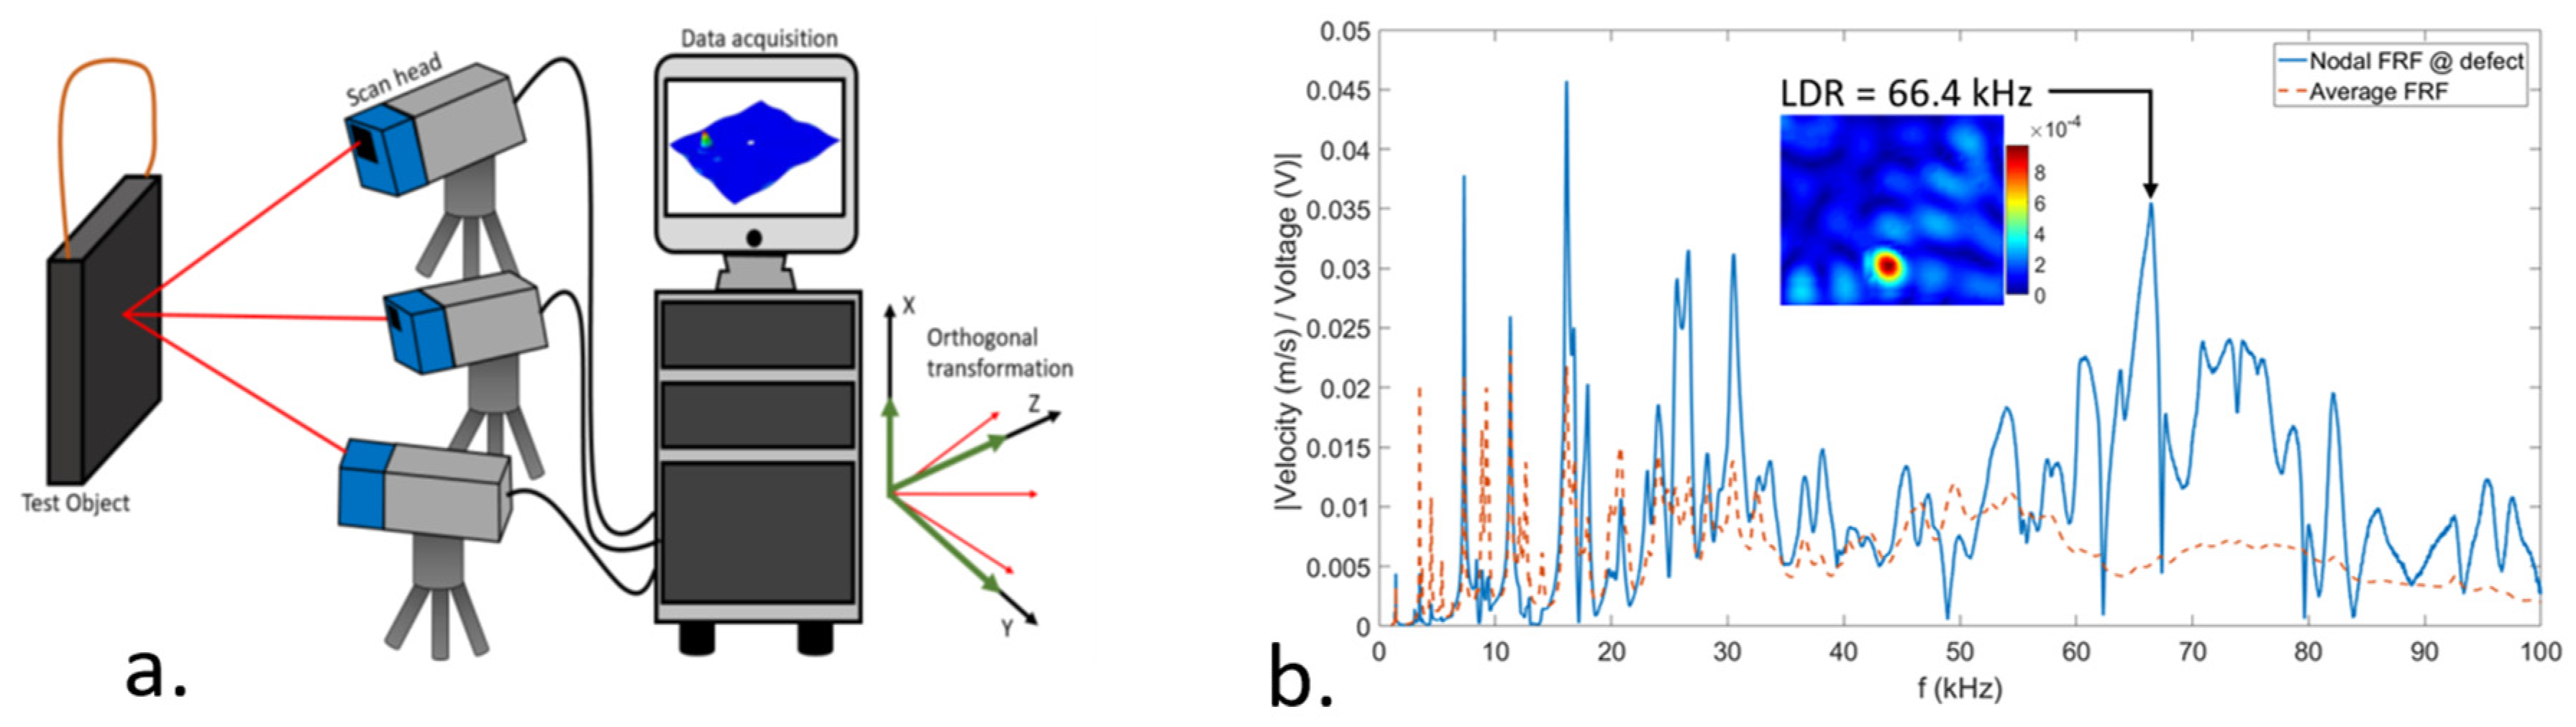
Local defect resonance (LDR) has already been described in the early 1990s [9], though it is only recently that the technique has been explored extensively through the work of Solodov [5,10]. Instead of classical vibration testing of components at low frequencies, the LDR technique rather employs elevated frequencies. Considering that a defective area has a locally different stiffness and/or mass, it will behave as a local resonator at specific elevated frequencies. The vibrational surface response can then be measured with scanning laser Doppler vibrometry (see Figure 2a). Hence, it is not a volumetric method, but rather a surface inspection method. In various research papers, the potential of the LDR technique has been demonstrated for a range of defects [5,6,10,11,12,13]. Recently, the LDR phenomenon has also been extended towards in-plane resonances, and it was shown that the concept of in-plane LDR is advantageous for detecting specific defect types [14]. Though, a current difficulty with the LDR technique concerns the fact that it is often not easy to actually identify the LDR response and the LDR frequency in measurement data. This is demonstrated in Figure 2b which displays the frequency response function (FRF) for a [45/0/-45/90]3S CFRP with a flat bottom hole (FBH). The orange curve is the average FRF of the CFRP, while the blue curve represents the nodal FRF at the FBH’s location. This figure indicates the difficulty to distinguish between global mode shapes and LDR behavior by analysis of the average FRF, or even the nodal FRF in the defected zone. However, by careful manual inspection of the operational deflection shapes (ODS) over the full frequency range, a clear LDR of the FBH was found at 66.4 kHz. Our current research is focused towards automated identification of LDR features in a set of FRFs, and will be presented at the EWSHM 2018 conference. Though, it may be clear that the actual opportunities and limitations of the LDR technique for NDT of composites are not yet fully known.
1.3. Infrared Thermography
There are many excitation possibilities in active infrared thermography (e.g., optical, vibrational, eddy current, etc.) [5,8,15,16,17]. In this study, the focus is on infrared thermography (IRT) through optical stimulation. The idea is quite simple: optical heating is applied to the sample of interest, and the thermal response of the surface is evaluated over time by capturing the infrared radiation with a sensitive infrared sensor. In the presence of a defect, the induced heat will locally build up and will be seen as a hot spot in reflection or a cold spot in transmission. Hence, it is a volumetric inspection approach. Roughly said, this principle can be regarded as the analogue of an ultrasonic C-scan, though with highly damped thermal waves. This immediately exposes the main problem with IRT: it has limited depth probing (especially in reflection setup) due to high damping characteristics. Apart from this, the anisotropic 3D thermal diffusion in composites makes defect assessment (e.g., estimation of size and depth) far from straightforward. For the optical heating, there are 2 often used inspection regimes: lock-in and flash (or pulse) thermography.
The lock-in thermography employs an amplitude modulated heating in order to induce a thermal wave with a specific frequency. Considering that thermal waves are highly dispersive, the applied frequency will induce a certain wavelength, and in consequence impose the inspection depth. The general rule is that lowering the frequency leads to deeper inspection depth. Though there is a clear limitation in inspection depth due to 3D thermal diffusion. By locking the excitation frequency, data can be obtained with excellent thermal resolution (<mK) and sufficiently high SNR for extracting useful information. Analysis of the phase images often leads to better results (compared to amplitude images) as non-uniform heating conditions and environmental parameters are excluded to a large extent.
The flash thermography on the other hand considers a short (typically a few ms) powerful flash. The advantage is that thermal waves in a broad frequency range are stimulated, and thus information at different depths can be retrieved in a single experiment. Of course, this is at the expense of the SNR. Appropriate post-processing algorithms (e.g., fast Fourier transform FFT, principal component analysis PCA, thermal signal reconstruction TSR [18]) can be employed to improve the defect’s contrast.
These three NDT techniques, i.e., C-scan, LDR and lock-in IRT, are applied on CFRP’s with idealized defects, i.e., FBHs and inserts, as well as on impacted CFRP with barely visible impact damage (BVID). It is investigated how the various NDT techniques perform in detecting the defects and in evaluating defect parameters.
2. Materials
CFRPs with different stacking sequence are considered in this study. Coupons have been manufactured in an autoclave (temperature- and pressure controlled) according to the guidelines of the supplier, and different types of (artificial) defects have been introduced. The ratio of the lateral size of the defect to the depth of the defect is higher than 3.
The first sample measures L × W × T = 150 × 90 × 5.52 mm3 and is manufactured from unidirectional carbon fibers according to layup [45/0/-45/90]3S. A FBH with diameter of 10 mm has been introduced by milling at sufficiently high rotational speed. The remaining material thickness is 2.06 mm. In the remainder of the text, this sample is indicated with CFRPFBH (see Table 1).
The second sample measures L × W × T = 150 × 150 × 2.6 mm3 and is manufactured from unidirectional carbon fibers according to layup [(0/90)2/0]S. A square ethylene-tetrafluorethylene (ETFE) insert with thickness of 60 μm and lateral size of 20 mm has been introduced at a depth of 0.8 mm. In the remainder of the text, this sample is indicated with CFRPINSERT (see Table 1).
The third sample measures L × W × T = 150 × 100 × 5.54 mm3 and is manufactured from unidirectional carbon fibers according to layup [45/0/-45/90]3S. The sample has been impacted with a low velocity drop weight according to ASTM D7136 [19]. The impact event was done with a fully instrumented in-house developed drop tower with anti-rebound system (to prevent double hits), a 7.72 kg impactor with 16 mm impactor-tip was mounted. The measured impact energy was 6.3 J, resulting in barely visible impact damage for this type of composite [1]. In the remainder of the text, this sample is indicated with CFRPBVID (see Table 1).
3. Experimental Set-Up and Procedure
In this section, details on the measurement procedure and equipment are presented. For brevity, only the most important settings and procedures are presented.
3.1. Ultrasonic C-Scan
The ultrasonic C-scans have been obtained with an in-house developed 5 axis scanner (3 translational axes and 2 rotational axes), which is coupled to a PXIe system of National Instruments for (i) motion control, (ii) ultrasonic wave generation and subsequent acquisition, and (iii) data post-processing and visualization. Unfocused H5K (General Electric) immersion transducers, with a diameter of 13 mm and a central frequency of 5 MHz, have been employed. A Pulser-Receiver (USIP40, General Electric) feeds a 100 Vpp pulse signal to the transmitting transducer. The reflection and transmission signals are captured using a digitizer (NI PXIe-5172) at a sampling frequency of 1 Gs/s (interleaved sampling) and bit depth of 14 bit. The full time signals are captured and stored for subsequent data-analysis. The scanner is operated by a motion controller (NI PXI-7356) and has been programmed in LabVIEW® in order to scan a user-defined scanning path. Encoder feedback is provided in order to trigger the pulser and digitizer according to a predefined scan grid. The results shown in this study have been obtained with a grid size of 0.5 mm along the index axis, and 0.1 mm along the scanning axis. The scanning speed was set at 50 mm/s. The post-processing of the acquired time signals is done in LabVIEW® on-the-fly (e.g., maximum amplitude, time-of-flight (TOF), FFT, etc.). The TOF in reflection C-scans has been determined by cross-correlation of internal echoes to the top surface echo. Dynamic time-gating has been applied to compensate for (possibly) non-flat sample geometry.
3.2. Local Defect Resonance
The investigated samples have been suspended using four elastic bands at the corners and were excited using a low power piezoelectric (PZT) actuator (type EPZ-20MS64W from Ekulit, with a diameter of 15 mm) which was glued to the back surface. A burst chirp signal (i.e., fast swept sine with a duty cycle of 90%) is used as excitation signal (bandwidth of 100 kHz). This signal is amplified by a factor of 50 using a Falco System WMA-300 amplifier, resulting in a peak-to-peak voltage of 100 Vpp. The vibrational response is obtained by a 3D infrared scanning laser Doppler vibrometer (Polytec PSV-500-3D-HV XTRA) using a sampling frequency of 250 ks/s (the useful bandwidth is 100 kHz) and bit depth of 24 bit. The stand-off distance of the samples to the three lasers was around ~600 mm. Orthogonal projection is used to calculate the velocity of vibration in the X, Y and Z direction, where Z is defined as the out-of-plane component. A sufficiently fine grid (order of 1–1.5 mm) is considered in order to accurately capture the spatial characteristics of high order resonances. The infrared wavelength of the lasers (1550 nm) shows excellent sensitivity, even for black surfaces and large view angles. Hence, the surface of the samples has not been treated with spray paint (e.g., Ardrox 9D1B) or retroreflective tape. The time-domain vibrational data is processed in MATLAB® using a FFT scheme in order to go to the frequency domain. Accounting for the response signal of the PZT patch leads to the nodal FRFs and the average FRF (i.e., summed nodal FRF’s) of the inspected sample. Manual ‘peak-picking’ in the average FRF and/or nodal FRF, and subsequent evaluation of the associated ODS, then leads to the identification of the LDR. Note that we have put the word peak-picking between quotation marks because in reality the LDR is often not associated with a peak in the average FRF. This can be verified in Figure 2b. Apart from the ODS at a single frequency, the frequency band data (FBD) is used to present the vibrational amplitude of the sample over a certain frequency band. The FBD of a scan point at location is defined as:
where is the frequency resolution of the FFT data and must lie within the frequency bandwidth of the excitation signal. and represent respectively the out-of-plane velocity amplitude of the grid point with coordinates and the excitation’s voltage amplitude at frequency f. Because a damaged area is typically characterized by a local reduction in bending stiffness, and as a result an increased out-of-plane vibrational amplitude (especially at LDR), it shows a higher FBD value compared to an undamaged area.
3.3. Infrared Thermography
The various samples have been mounted at a stand-off distance of ~750 mm from the optical excitation and the infrared camera. The infrared camera (FLIR® A6750sc) has a cooled InSb photon detector with a pixel density of 640 × 512 pixels, Noise Equivalent Temperature Difference (NETD) of <20 mK and a bit depth of 14 bit. The infrared sensor is sensitive to the 1–5 μm range, additional filters further narrow down the effective spectral window to 3–5 μm. For the lock-in thermography, 2 Hedler® halogen lamps (H25s) with a nominal power of 2 kW each have been used. PMMA filters were installed to block direct infrared radiation to the camera. The halogen lamps are controlled by a signal generator (edevis®) in order to apply user-defined heating cycles. For the pulse thermography, a high power linear flash lamp (Hensel-visit, VH3-6000) with a nominal energy of 6 kJ has been used. The typical discharge time of the Xenon gas in the flash tube is in the order of a few ms.
The infrared camera (FLIR®) and the optical excitation are coupled to each other with hardware and software from edevis® (https://www.edevis.com/content/en/). This integrated thermographic system has the advantage that triggering and synchronization of the data stream is very accurate and robust. The post-processing of the data is done in DisplayIMG 6 Professional software (edevis®) and/or in MATLAB® (for further advanced post-processing). In this report, we limit ourselves to the analysis of data in frequency domain by application of a FFT scheme. The resulting amplitude and phase images are considered. Unfortunately, due to unforeseen circumstances the flash thermography could not be added to this manuscript.
4. Results
As discussed in Section 3, a limited number of post-processing approaches are used in this study. One could use different and more advanced analysis techniques, but this is not considered here as this would substantially lengthen this paper.
4.1. Flat Bottom Hole—CFRPFBH
The inspection results for the CFRPFBH sample are shown in Figure 3. The different inspections have been performed from the blind side of the FBH.
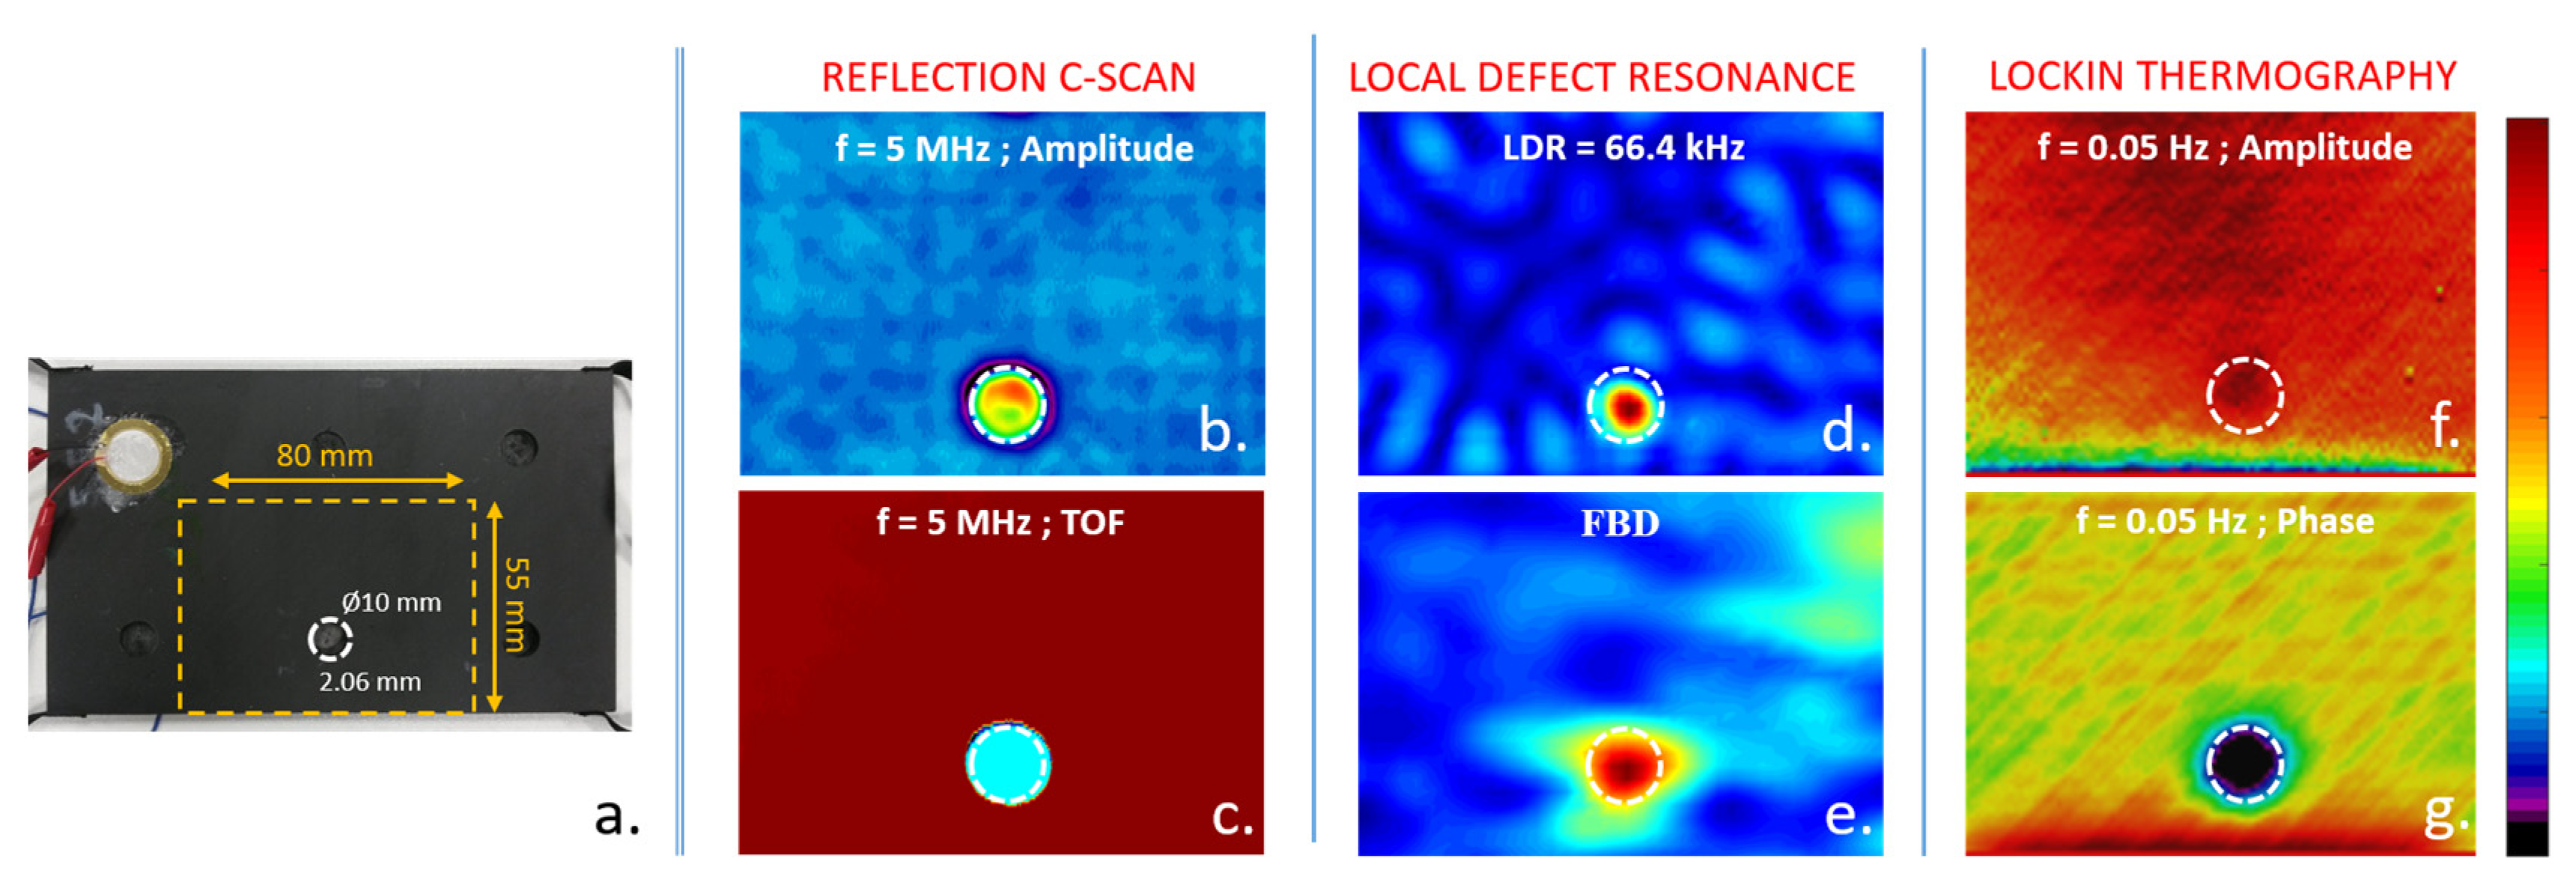
The ultrasonic C-scan in reflection (see Figure 3b,c) gives good estimation of the defect’s lateral characteristics. Additional analysis of the TOF signal gives a depth estimation of 1.95 mm (versus 2.06 mm measured).
The results for the LDR are shown in Figure 3d–e. The LDR frequency was determined at 64.4 kHz, and the defect shape is easily recognizable (see Figure 3d) but is underestimated. This could have been expected as the defect can be perceived as a clamped sub-component. Hence, the outer part of the defect has reduced vibrational mobility compared to the inner part of the defect. The depth of the defect can be estimated on the basis of a simplified analytical solution [6], but only on the condition that defect geometry, defect size and material parameters (density, anisotropic stiffness tensor) are known a priori. Unfortunately such a priori information is often unknown, even for this model sample. The frequency band data FBD over 50–100 kHz is shown in Figure 3e and also clearly reveals the location of defect (without the need to search for a LDR characteristic in the FRF data).
The lock-in thermography result in reflection is shown in Figure 3d. Four sinusoidal cycles with frequency of 0.05 Hz have been employed. The frequency of 0.05 Hz was proven to be the most sensitive for the particular depth of the FBH. The amplitude image give little to no quantitative information (at least without further post-processing). While the phase image succeeds in providing an image from which lateral defect parameters can be extracted. Extraction of the defect depth is not possible with the current dataset.
4.2. ETFE Insert—CFRPINSERT
Figure 4 presents the NDT results for the CFRPINSERT sample. For this case, the three NDT techniques provide indicative results on the lateral defect parameters.
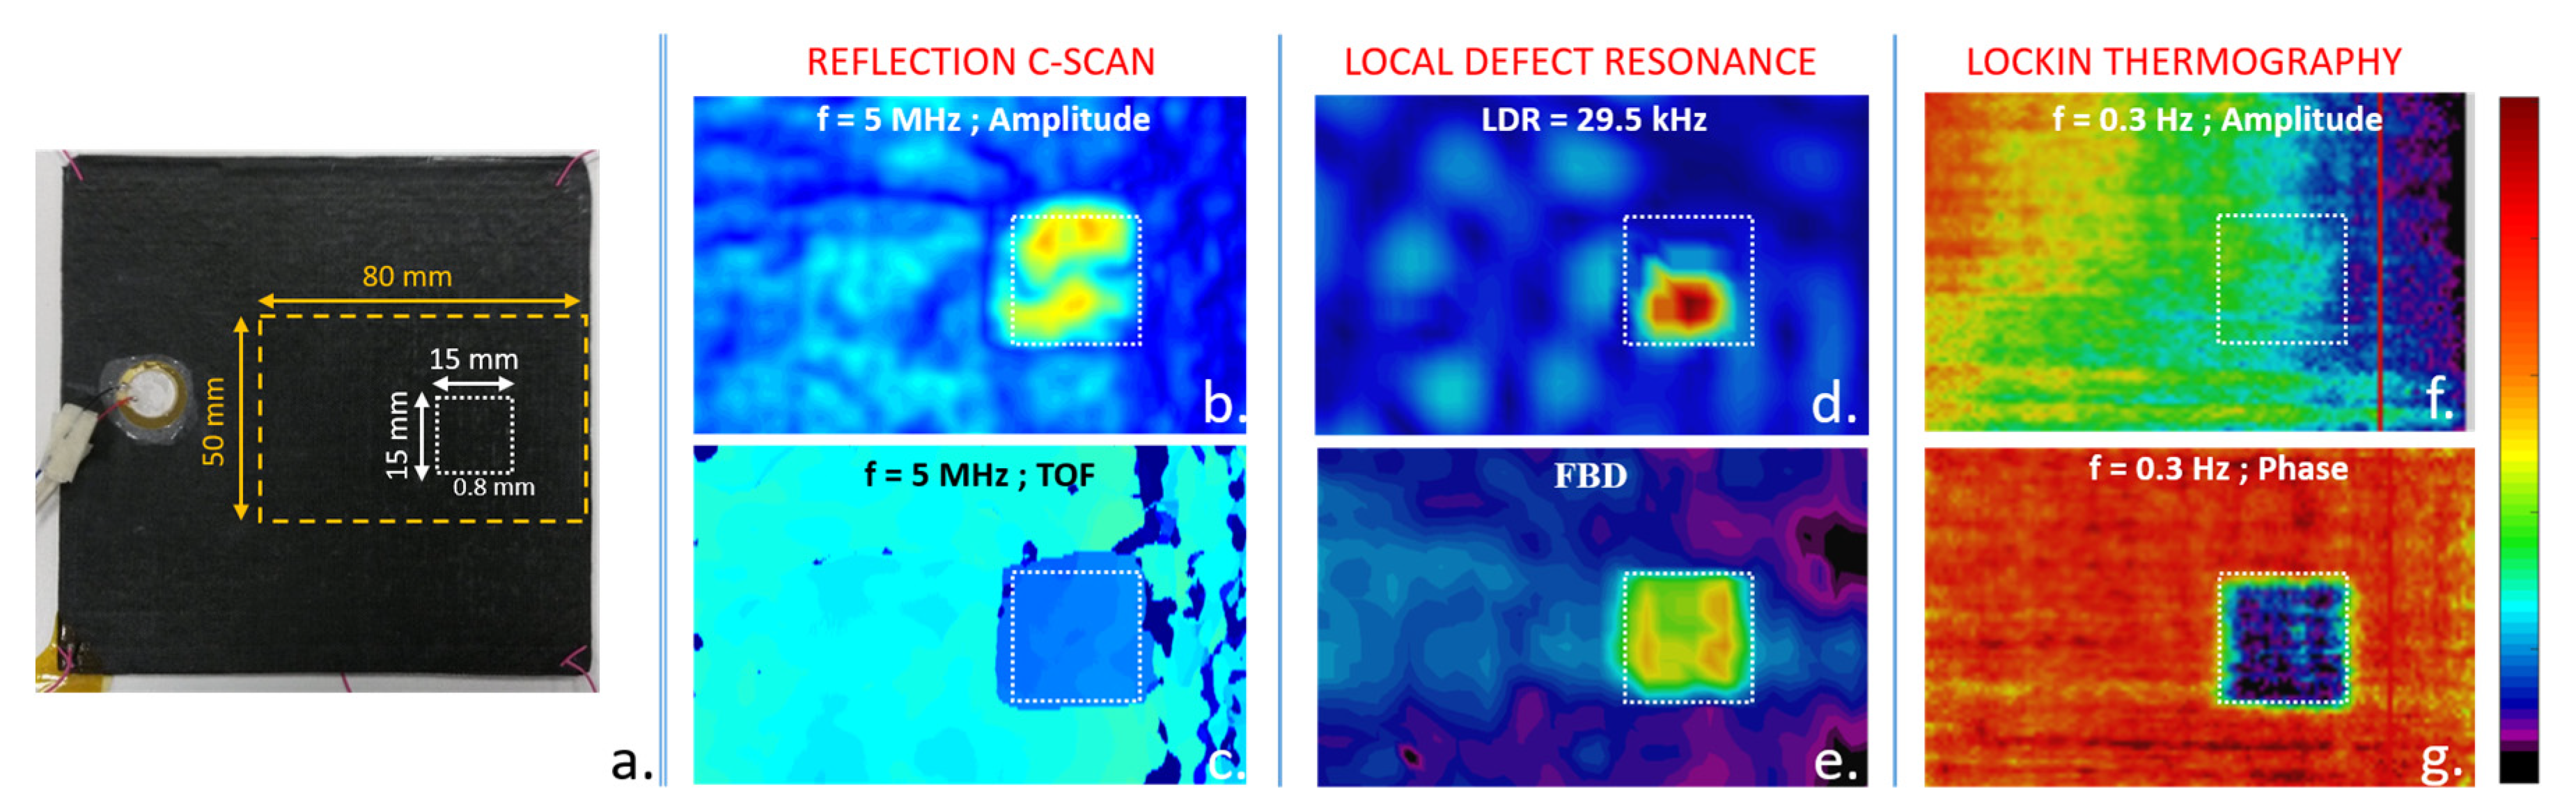
The ultrasonic C-scan nicely indicates the lateral dimensions of the defect. Though, the TOF image is of poor quality and makes it difficult to estimate the depth of the defect. This is due to the small ratio of defect-depth-to-wavelength, which makes accurate extraction of TOF troublesome, as well as to the significantly lower quality of the CFRPFBH sample (when compared to the other CFRP samples). Hence, the ultrasonic signal did not show good reflection on the ETFE insert, and was therefore difficult to capture in a steady and uniform way.
For the LDR at frequency of 29.5 kHz, we got a significant underestimation of lateral defect size (see Figure 4d). On the other hand, it is interesting to note that the frequency band data FBD over 5–100 kHz (Figure 4e) gives a good estimation of actual lateral defect size, without the need to search for LDR phenomena in the average or nodal FRF data.
The IRT results have been obtained at a lock-in frequency of 0.3 Hz as this provided best results for an inspection depth of 0.8 mm. It is clear that a good contrast is obtained for the phase image, giving a good estimation of lateral defect size.
4.3. Barely Visible Impact Damage—CFRPBVID
The damage type for the CFRPBVID sample (see Figure 5a) is far more complex compared to the previous two cases, and should be conceived as a combination of different defects (e.g., delamination, cracks, …) distributed through depth.
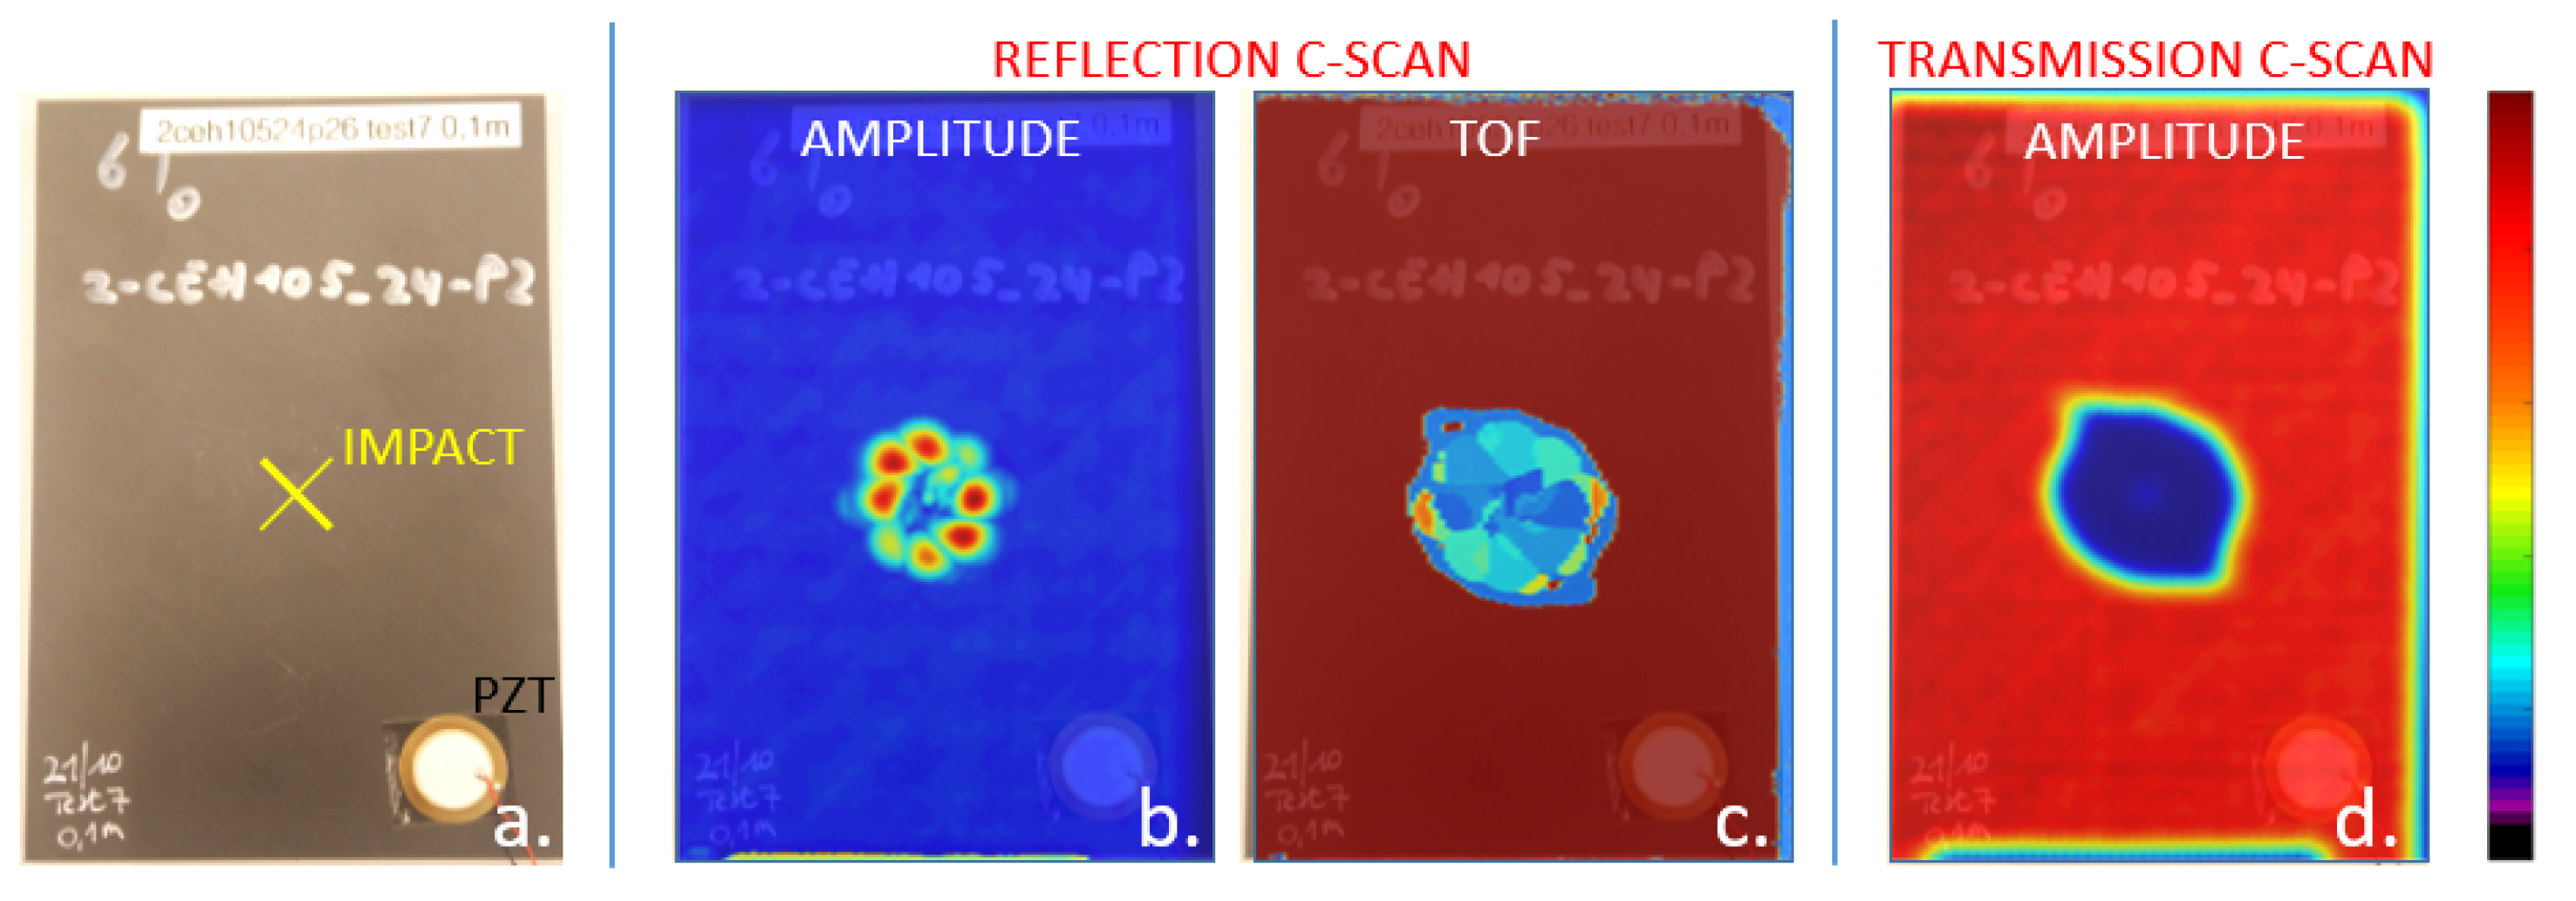
This is nicely indicated by the ultrasonic C-scan in reflection (see Figure 5b,c). The amplitude recording indicates multiple defects at the impact location, while the TOF indicates that these defects are distributed through thickness (blue = shallow defect, red = deep defect). Analysis of the damage zone indicates that the impactor has induced a delamination cone through thickness, which extends like a double helix through the sample (and thus clearly relates to the quasi-isotropic lay-up of the [45/0/-45/90]3S CFRP). Note that the upper delaminations have a shadowing effect on the lower delaminations. In reality, the deeper delaminations also extend until the impact location. The C-scan in transmission (Figure 5d) provides an integrated view of the delamination cone. Although the impact energy was only 6.3 J, the C-scan results indicate that considerable damage was induced in the CFRP laminate.
The LDR response for the CFRPBVID sample is displayed in Figure 6. In this case, it is difficult to identify 1 single LDR frequency, exactly because of the complexity of the damage zone. The fact that LDR is not a volumetric inspection method combined with the complex 3D damage zone (see Figure 5b,c) is not favourable for clear interpretation. Therefore, the CFRPBVID has been scanned at both the impact side and the backside, see Figure 6 (top row) and Figure 6 (bottom row) respectively. Additionally, the vibrational analysis was further extended towards in-plane LDR phenomena in order to get further insight on the structure of the complex 3D damage zone [14]. For clarity, the classical out-of-plane LDR is indicated by LDRZ, while in-plane LDR is indicated by LDRXY. By careful manual peak-picking, LDRZ and LDRXY modes have been identified. The results indicate that the extension towards in-plane vibrational characteristics give access to other defect parameters. As there are many higher-order LDRZ and LDRXY modes identified in the considered bandwidth, we opted to only show the fundamental LDR’s together with a representation of the out-of-plane frequency band data FBDZ and in-plane frequency band data FBDXY over the total frequency band of 2–100 kHz. The increased surface velocities of the many high order LDRs in the total frequency band should be hinted in the FBDZ and FBDXY, and thus should give a representation of zones with reduced stiffness (i.e., damaged zones). The results are displayed in Figure 6c-f, and qualitatively match the ultrasonic C-scans (see Figure 5). It is clear that this set of results provides useful information, but it is equally clear that further research is needed in order to interpret these results, and eventually to link them to quantitative defect parameters.
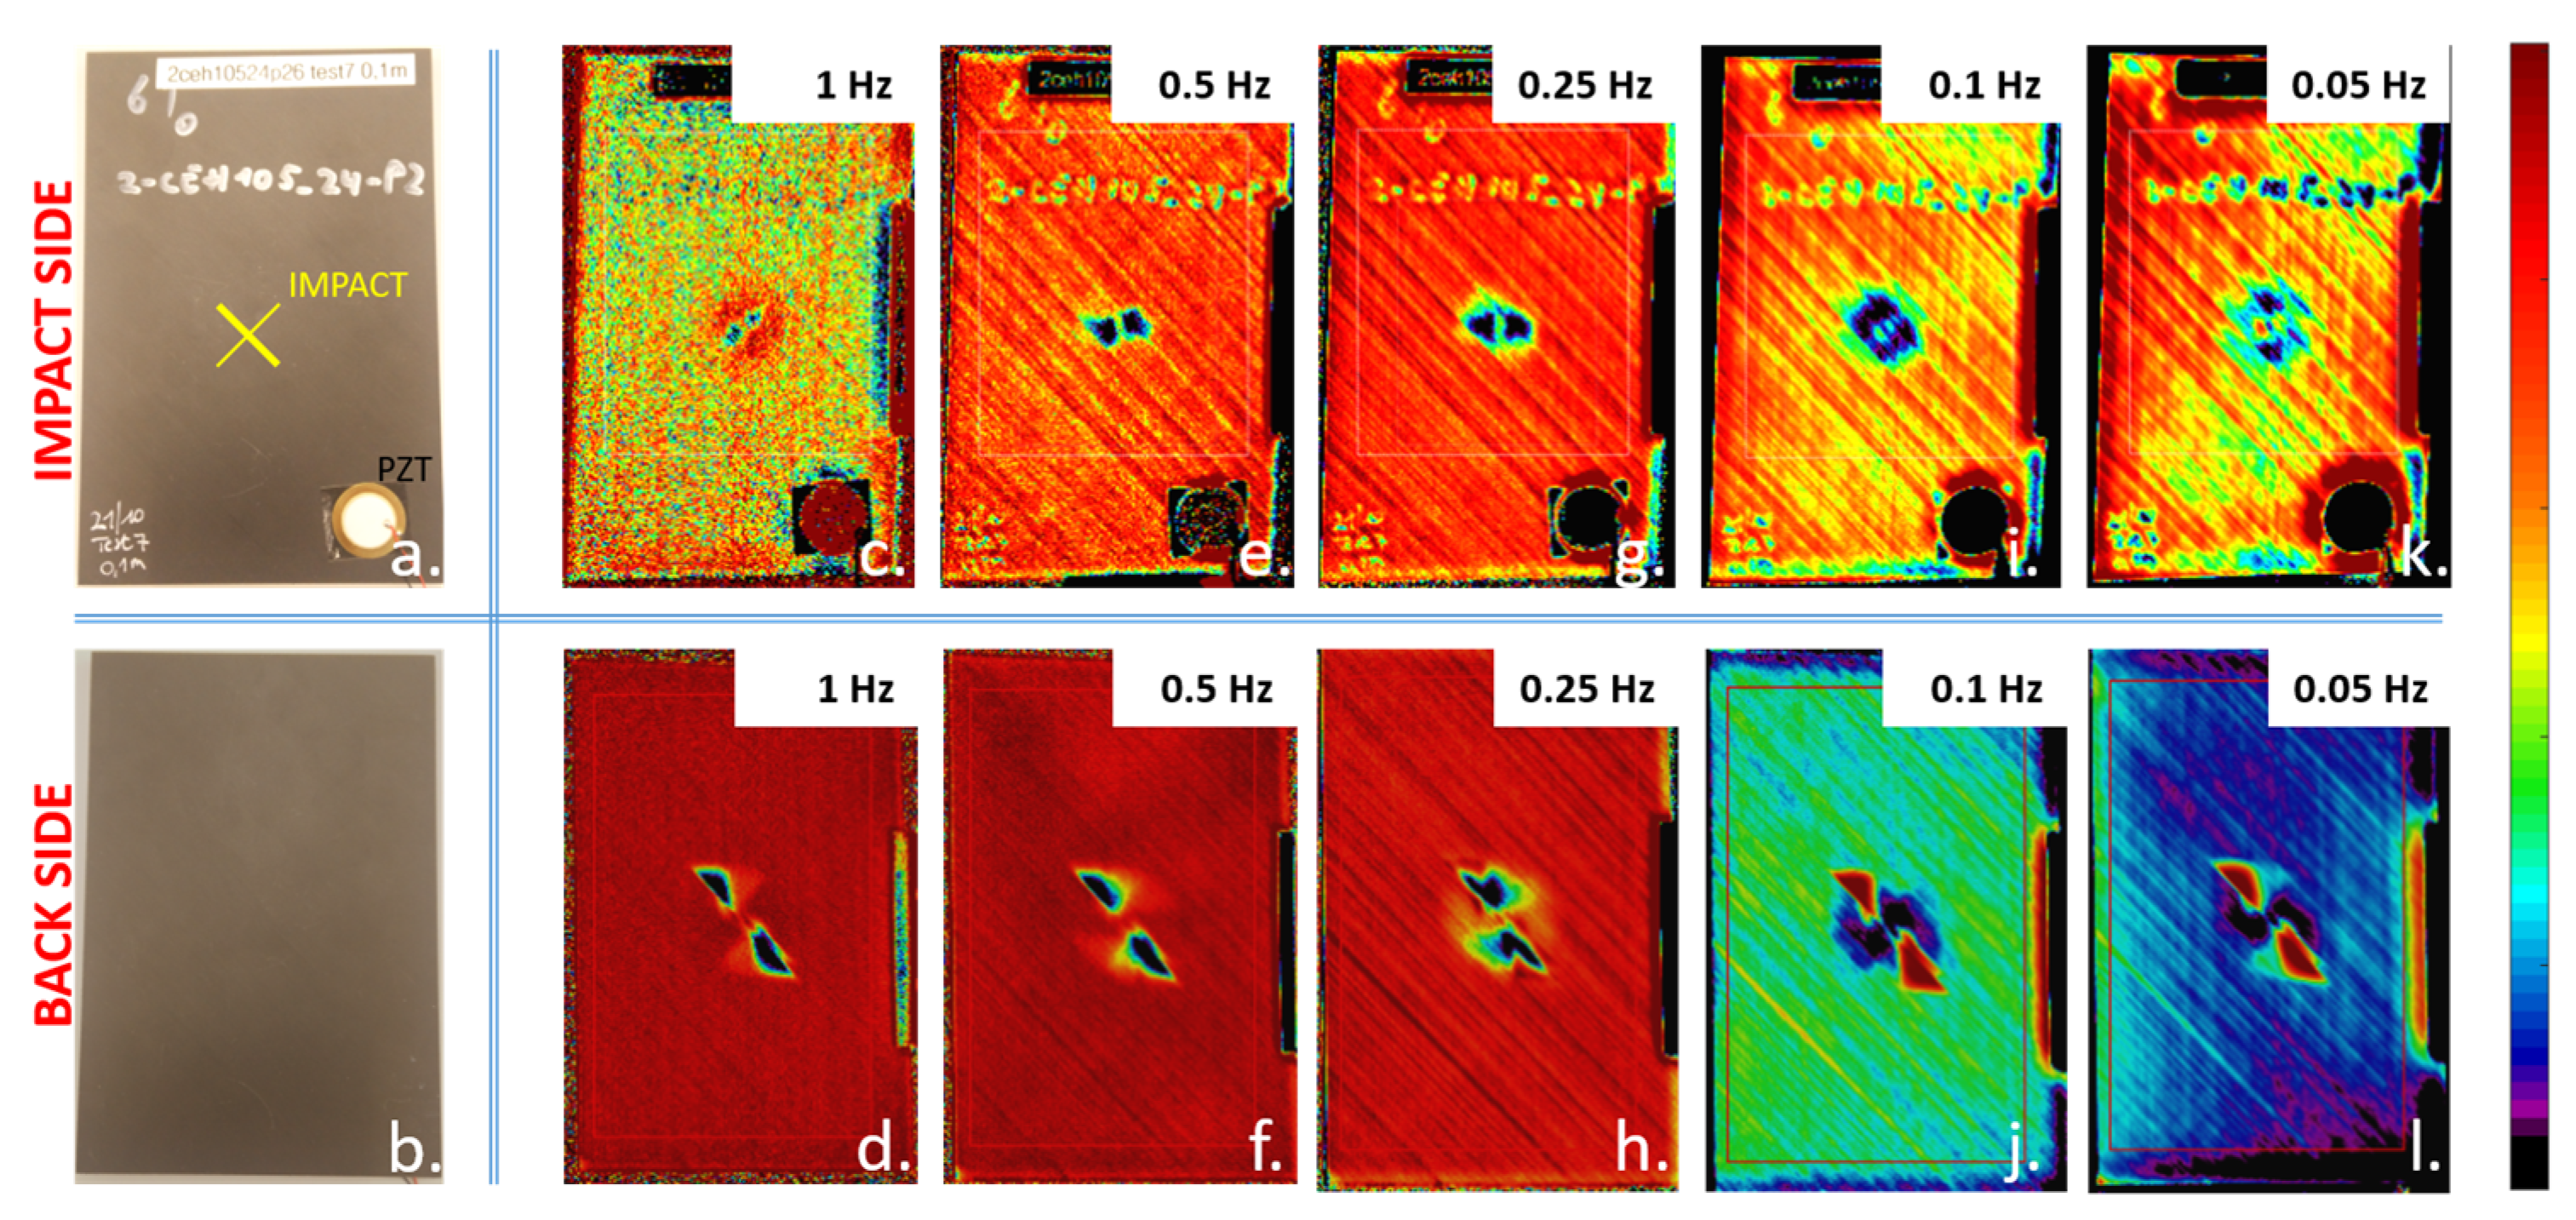
Finally, the lock-in thermography has been applied on the CFRPBVID sample. Considering that the delamination cone is distributed through thickness, various lock-in frequencies have been selected. As the CFRPBVID sample has a high thickness, one should select very low frequency to probe the complete sample in reflection mode (under the assumption that the SNR is still sufficient). Such low frequencies would result in unacceptable heating (T > 100 °C) of the front surface, and subsequent degradation of the thermoset matrix in the CFRPBVID. Instead, it was opted to perform IRT in reflection from both the impact side and the backside of the CFRPBVID sample. The IRT results are displayed in Figure 7, and cover the frequencies 1 Hz, 0.5 Hz, 0.25 Hz, 0.1 Hz and 0.05 Hz. The difference between inspection from impact side and backside is clear. The results globally indicate the extent of the damage, and provide (limited) detail on the depth distribution.
5. Conclusions
CFRPs with various defects (flat bottom hole, insert and barely visible impact damage) have been investigated by three different non-destructive inspection techniques: ultrasonic C-scans, local defect resonance and lock-in thermography. The obtained inspection results have been discussed and compared to each other.
Overall, the C-scan data gives the best indication of lateral defect size and defect depth, even for the sample with the complex barely visible impact damage. There it was found that the impact induced a delamination cone which extends like a double helix through the sample. This was linked to the quasi-isotropic stacking sequence of that CFRP.
The classical out-of-plane local defect resonance provides results which cannot be easily linked to quantitative damage parameters in a straightforward way. Extending the analysis with in-plane local defect resonance, and the concept of frequency band data could provide some opportunities in this regard. Though further research is needed in this regard.
The phase images of the lock-in thermography show good performance for assessing the lateral size of the different damages. By using different lock-in frequencies, the delamination cone of the BVID could be explored in thickness direction. However, due to the high damping of thermal waves and 3D thermal diffusion phenomena, it was not possible to probe the full thickness of the CFRP.
Author Contributions
All authors equally contributed to the presented results.
Acknowledgments
The authors acknowledge both the Research Foundation-Flanders (FWO grants 12T5418N, G0B9515N and 1148018N) and the SBO project DETECT-IV (Grant No. 160455), which fits in the SIM research program MacroModelMat (M3) funded by SIM (Strategic Initiative Materials in Flanders) and VLAIO (Flemish government agency Flanders Innovation & Entrepreneurship).
Conflicts of Interest
The authors declare no conflict of interest. The founding sponsors had no role in the design of the study; in the collection, analyses, or interpretation of data; in the writing of the manuscript, and in the decision to publish the results.
References
- Spronk, S.W.F.; Kersemans, M.; Gilabert, F.A.; Sevenois, R.D.B.; Garoz, D.; Kassapoglou, C.; Van Paepegem, W. Comparing damage from low-velocity impact and quasi-static indentation in automotive carbon/epoxy and glass/polyamide-6 laminates. Polym. Test. 2018, 65, 231–241. [Google Scholar] [CrossRef]
- Aymerich, F.; Meili, S. Ultrasonic evaluation of matrix damage in impacted composite laminates. Compos. Part B Eng. 2000, 31, 1–6. [Google Scholar] [CrossRef]
- Li, C.; Pain, D.; Wilcox, B.W.; Drinkwater, B.W. Imaging composite material using ultrasonic arrays. NDT E Int. 2013, 53, 8–17. [Google Scholar] [CrossRef]
- Neuenschwander, J.; Furrer, R.; Roemmeler, A. Application of air-coupled ultrasonics for the characterization of polymer and polymer-matrix composite samples. Polym. Test. 2016, 56, 379–386. [Google Scholar] [CrossRef]
- Solodov, I.; Rahammer, M.; Derusova, D.; Busse, G. Highly-efficient and noncontact vibro-thermography via local defect resonance. Quant. InfraRed Thermogr. J. 2015, 12, 98–111. [Google Scholar] [CrossRef]
- Solodov, I. Resonant acoustic nonlinearity of defects for highly-efficient nonlinear NDE. J. Nondestruct. Eval. 2014, 33, 252–262. [Google Scholar] [CrossRef]
- Busse, G.; Wu, D.; Karpen, W. Thermal wave imaging with phase sensitive modulated thermography. J. Appl. Phys. 1992, 71, 3962–3965. [Google Scholar] [CrossRef]
- Maldague, X.P.V. Theory and Practice of Infrared Technology for Nondestructive Testing; John Wiley & Sons, Inc.: New York, NY, USA, 2001; Volume 1. [Google Scholar]
- Tenek, L.H.; Henneke, E.G.; Gunzburger, M.D. Vibration of delaminated composite plates and some applications to non-destructive testing. Compos. Struct. 1993, 23, 253–262. [Google Scholar] [CrossRef]
- Solodov, I.; Bai, J.; Bekgulyan, S.; Busse, G. A local defect resonance to enhance acoustic wave-defect interaction in ultrasonic nondestructive evaluation. Appl. Phys. Lett. 2011, 99. [Google Scholar] [CrossRef]
- Solodov, I.; Kreutzbruck, M. Noncontact NDT and Defect Imaging via resonant Sonic Activation of Damage; DGZfP-Jahrestagung: Koblenz, Germany, 2017. [Google Scholar]
- Solodov, I.; Bai, J.; Busse, G. Resonant ultrasound spectroscopy of defects: Case study of flat-bottomed holes. J. Appl. Phys. 2013, 113. [Google Scholar] [CrossRef]
- Post, W.; Kersemans, M.; Solodov, I.; Abeele, L.V.D.; García, S.J.; van der Zwaag, S. Non-destructive monitoring of delamination healing of a CFRP composite with a thermoplastic ionomer interlayer. Compos. Part A Appl. Sci. Manuf. 2017, 101, 243–253. [Google Scholar] [CrossRef]
- Segers, J.; Kersemans, M.; Hedayatrasa, S.; Tellez, J.A.C.; Van Paepegem, W. Towards in-plane local defect resonance for non-destructive testing of polymers and composites. NDT E Int. 2018, 98, 130–133. [Google Scholar] [CrossRef]
- Busse, G. Lockin-thermography: Principles, NDE-applications and trends. In Proceedings of the 2014 Quantitative InfraRed Thermography, Bordeaux, France, 7–11 July 2014; p. 8. [Google Scholar]
- Maierhofer, C.; Myrach, P.; Reischel, M.; Steinfurth, H.; Röllig, M.; Kunert, M. Characterizing damage in CFRP structures using flash thermography in reflection and transmission configurations. Compos. Part B Eng. 2014, 57, 35–46. [Google Scholar] [CrossRef]
- Tian, G.Y.; Gao, Y.; Li, K.; Wang, Y.; Gao, B.; He, Y. Eddy current pulsed thermography with different excitation configurations for metallic material and defect characterization. Sensors 2016, 16, E843. [Google Scholar] [CrossRef] [PubMed]
- Oswald-Tranta, B. Time and frequency behaviour in TSR and PPT evaluation for flash thermography. Quant. InfraRed Thermogr. J. 2017, 14, 164–184. [Google Scholar] [CrossRef]
- Active Standard ASTM_D7136; Measuring the Damage Resistance of a Fiber-reinforced Polymer Matrix Composite to a Drop-weight Impact Event. American Society for Testing and Materials: West Conshohocken, PA, USA, 2005; p. 8.
Figure 1.
(a) Principle of C-scan and (b) ultrasonic C-scan in reflection (top) and transmission (bottom) for an impacted [45/0/-45/90]3S CFRP (middle) with impact energy 18.5 J. The color scale indicates the amplitude level.
Figure 1.
(a) Principle of C-scan and (b) ultrasonic C-scan in reflection (top) and transmission (bottom) for an impacted [45/0/-45/90]3S CFRP (middle) with impact energy 18.5 J. The color scale indicates the amplitude level.

Figure 2.
(a) Principle of 3D scanning laser Doppler vibrometry and (b) FRF of a [45/0/-45/90]3S CFRP sample with a flat bottom hole (diameter of 10 mm).
Figure 2.
(a) Principle of 3D scanning laser Doppler vibrometry and (b) FRF of a [45/0/-45/90]3S CFRP sample with a flat bottom hole (diameter of 10 mm).

Figure 3.
Results for CFRPFBH: (a) photograph of inspected area. Ultrasonic C-scan at 5 MHz: (b) reflected amplitude and (c) TOF. Vibrational testing: (d) LDR at 66.4 kHz and (e) frequency band data FBD over 50–100 kHz. Lock-in thermography at 0.05 Hz: (f) amplitude and (g) phase image.
Figure 3.
Results for CFRPFBH: (a) photograph of inspected area. Ultrasonic C-scan at 5 MHz: (b) reflected amplitude and (c) TOF. Vibrational testing: (d) LDR at 66.4 kHz and (e) frequency band data FBD over 50–100 kHz. Lock-in thermography at 0.05 Hz: (f) amplitude and (g) phase image.

Figure 4.
Results for CFRPINSERT: (a) photograph of inspected area. Ultrasonic C-scan at 5 MHz: (b) reflected amplitude and (c) TOF. Vibrational testing: (d) LDR at 29.5 kHz and (e) frequency band data FBD over 5–100 kHz. Lock-in thermography at 0.3 Hz: (f) amplitude and (g) phase image.
Figure 4.
Results for CFRPINSERT: (a) photograph of inspected area. Ultrasonic C-scan at 5 MHz: (b) reflected amplitude and (c) TOF. Vibrational testing: (d) LDR at 29.5 kHz and (e) frequency band data FBD over 5–100 kHz. Lock-in thermography at 0.3 Hz: (f) amplitude and (g) phase image.

Figure 5.
(a) Photograph of CFRPBVID, (b) amplitude reflection C-scan, (c) TOF reflection C-scan and (d) amplitude transmission C-scan.
Figure 5.
(a) Photograph of CFRPBVID, (b) amplitude reflection C-scan, (c) TOF reflection C-scan and (d) amplitude transmission C-scan.

Figure 6.
Results of impact side (top row) and backside (bottom row) of CFRPBVID: (a,b) photograph of sample, (c,d) out-of-plane LDRZ and frequency band data FBDZ over 2–100 kHz and (e,f) in-plane LDRXY and frequency band data FBDXY over 2–100 kHz.
Figure 6.
Results of impact side (top row) and backside (bottom row) of CFRPBVID: (a,b) photograph of sample, (c,d) out-of-plane LDRZ and frequency band data FBDZ over 2–100 kHz and (e,f) in-plane LDRXY and frequency band data FBDXY over 2–100 kHz.

Figure 7.
IRT in reflection of impact side (top row) and backside (bottom row) of CFRPBVID: (a,b) photograph; phase images at (c,d) 1 Hz, (e,f) 0.5 Hz, (g,h) 0.25 Hz, (i,j) 0.1 Hz and (k,l) 0.05 Hz.
Figure 7.
IRT in reflection of impact side (top row) and backside (bottom row) of CFRPBVID: (a,b) photograph; phase images at (c,d) 1 Hz, (e,f) 0.5 Hz, (g,h) 0.25 Hz, (i,j) 0.1 Hz and (k,l) 0.05 Hz.


Table 1.
Overview of CFRP sample specifications.
| CFRPFBH | CFRPINSERT | CFRPBVID | |
|---|---|---|---|
| Defect type | FBH | ETFE Insert | Impact |
| Dimensions (mm) | 150 × 90 × 5.52 | 150 × 150 × 2.6 | 150 × 100 × 5.54 |
| Layup | [45/0/-45/90]3S | [(0/90)2/0]S | [45/0/-45/90]3S |
| Size of defects (mm) | Ø 10 | 20 × 20 | Depth-dependent |
| Depth of defects (mm) | 2.06 | 0.8 | Distributed over depth |
Publisher’s Note: MDPI stays neutral with regard to jurisdictional claims in published maps and institutional affiliations. |
© 2018 by the authors. Licensee MDPI, Basel, Switzerland. This article is an open access article distributed under the terms and conditions of the Creative Commons Attribution (CC BY) license (https://creativecommons.org/licenses/by/4.0/).
Share and Cite
MDPI and ACS Style
Kersemans, M.; Verboven, E.; Segers, J.; Hedayatrasa, S.; Paepegem, W.V. Non-Destructive Testing of Composites by Ultrasound, Local Defect Resonance and Thermography. Proceedings 2018, 2, 554. https://doi.org/10.3390/ICEM18-05464
AMA Style
Kersemans M, Verboven E, Segers J, Hedayatrasa S, Paepegem WV. Non-Destructive Testing of Composites by Ultrasound, Local Defect Resonance and Thermography. Proceedings. 2018; 2(8):554. https://doi.org/10.3390/ICEM18-05464
Chicago/Turabian StyleKersemans, Mathias, Erik Verboven, Joost Segers, Saeid Hedayatrasa, and Wim Van Paepegem. 2018. "Non-Destructive Testing of Composites by Ultrasound, Local Defect Resonance and Thermography" Proceedings 2, no. 8: 554. https://doi.org/10.3390/ICEM18-05464