Proceeding Paper

Matching Spectroscopy with the Ultrasonic Polar Scan for Advanced NDT of Composites †

1
Department of Materials, Textiles and Chemical Engineering, Ghent University, 9052 Zwijnaarde, Belgium
2
Wave Propagation and Signal Processing (WPSP), Department of Physics, KU Leuven Kulak, 8500 Kortrijk, Belgium
*
Author to whom correspondence should be addressed.
Presented at the 18th International Conference on Experimental Mechanics (ICEM18), Brussels, Belgium, 1–5 July 2018.
Proceedings 2018, 2(8), 536; https://doi.org/10.3390/ICEM18-05458
Published: 19 July 2018
(This article belongs to the Proceedings of The 18th International Conference on Experimental Mechanics)

Abstract

:
The Pulsed Ultrasonic Polar Scan (P-UPS) is a powerful technique for characterizing anisotropic materials like fiber reinforced plastics. A time-domain analysis of the ultrasonic signals yields amplitude and time-of-flight polar diagrams that provide a fingerprint of the local stiffness properties. Though, this simple analysis ignores a lot of information contained in the ultrasonic signals. In this study, we propose to use the P-UPS technique in combination with the spectroscopic analysis of broadband pulses, to obtain plane wave transmission spectra for all in-plane polar angles. This allows us to combine on one hand the strengths of the P-UPS technique, that does not require a priori knowledge about the sample anisotropy, and on the other hand the frequency-domain analysis that utilizes information contained in the broadband pulses.

1. Introduction

Ultrasonic techniques have a long history in nondestructive testing (NDT) and material characterization of fiber reinforced plastics [1]. Well-known methods include C-scans, resonant ultrasound spectroscopy, bulk wave analysis, Lamb wave analysis [2,3,4], etc. More recently the Pulsed Ultrasonic Polar Scan (P-UPS) method was added to this list as a viable material characterization technique [5].
Unlike a C-scan, the P-UPS investigates a single material spot by insonification of a sample, using a short broadband pulse, from a large number of oblique incidence angles Ψ(θ,φ) (see Figure 1a). From the transmitted signal amplitude and associated time-of-flight (TOF) information, polar diagrams can be constructed (see Figure 1b,c). The contours of these diagrams are related to the viscoelastic properties of the insonified medium. Therefore these diagrams can be used in an inverse characterization routine to identify the viscoelastic properties [6,7]. The technique is well suited for the study of anisotropic samples as it does not require a-priori knowledge on the mechanical symmetry. However, a lot of the information contained in the ultrasonic signals is simply disregarded by this limited analysis technique in the time domain (only pulse amplitude and TOF are stored) and only information on the bulk wave phenomena can be extracted. A quasi-harmonic signal generation method has been used before to stimulate Lamb wave generation, called the quasi-Harmonic UPS (H-UPS) [8], however, this method is limited to a single frequency being excited per experiment.
The traditional Lamb wave analysis technique, on the other hand, inspects ultrasonic broadband pulses as a function of the out-of-plane angle θ incident on the sample from a specific material symmetry orientation [9]. The recorded signals are normalized in the frequency domain to a reference field in order to yield a transmission coefficient that can be plotted as a function of the frequency thickness and angle θ (see Figure 2). The maxima in this plot can be related to the conditions for efficient Lamb waves stimulation, and therefore represent the dispersive behavior of the insonified material. The limitation of this technique is that a-priori knowledge is required for the orientation of the vertical insonification plane.
In this study we propose to combine the P-UPS technique with the Lamb wave analysis technique to develop a method (the spectroscopic UPS or S-UPS) that takes advantage of the information contained in the frequency spectrum of a broadband pulse experiment without the need for the proper selection of a material symmetry orientation. First, the implemented experimental setup is presented, and the concept of the broadband pulse spectroscopic technique is explained. Then, the results for measurements on UD and cross-ply composites are shown and discussed.

2. Materials and Methods

2.1. Carbon Fiber Reinforced Plastics

The composite materials under investigation in this work are carbon fiber reinforced plastics (CFRP) with unidirectional (UD) construction and orthotropic [02,902]S cross-ply layout. The CFRPs have been autoclave manufactured according to the guidelines of the supplier. For benchmark purposes aluminum was used as well. The plate samples had a thickness between 1 mm and 2 mm.

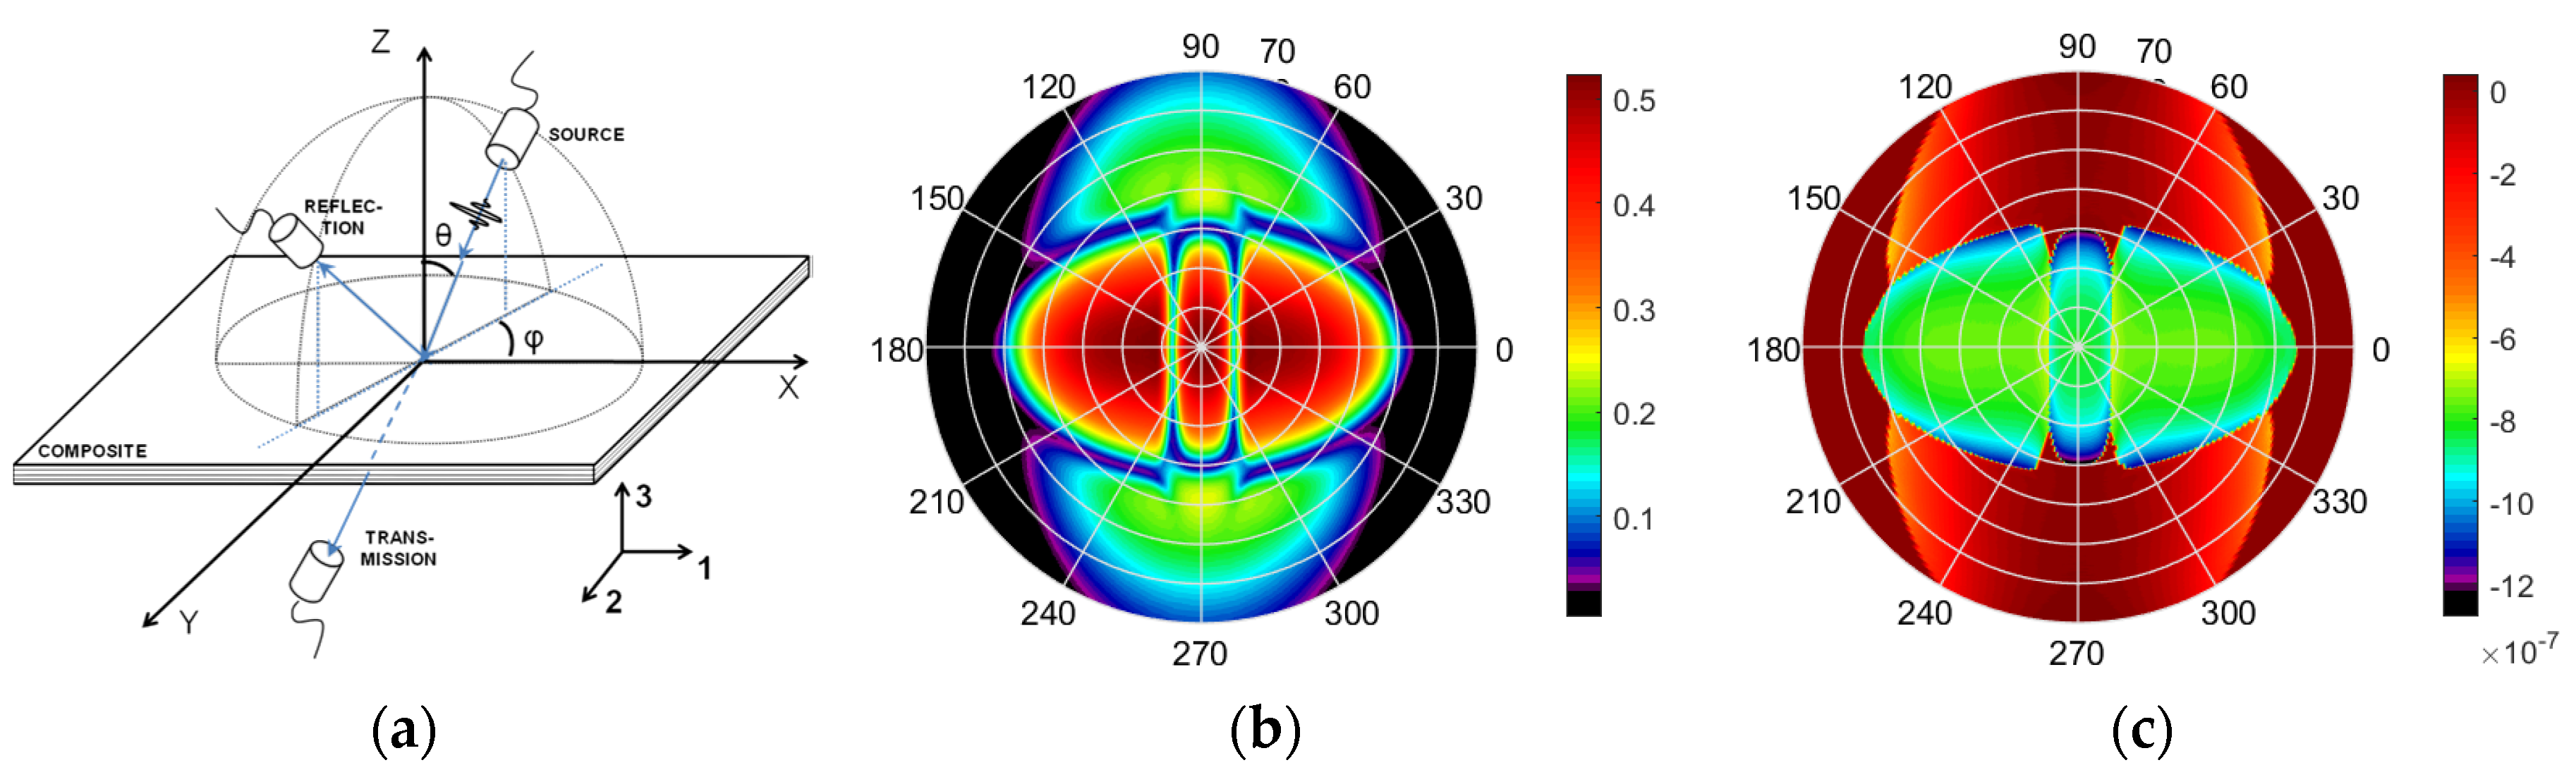
2.2. Experimental Setup

The polar scans were recorded with an automated scanner system with 5 degrees of freedom (x, y, z, R1, R2). The in-plane angle φ was varied from 0° to 180° in steps of 1°, while the out-of-plane angle θ was varied between −70° and 70° in steps of 0.1°. A through-transmission ultrasonic setup was used with two shockwave transducers with 5 MHz nominal frequency (GE Measurement & Control H5K) spaced 13 cm apart. For the waveform generation a NI PXIe-5413 card (National Instruments Corporation, Austin, TX, USA) and an AR 150A100B power amplifier (Amplifier Research) were used, while data acquisition was handled by a NI-PXIe-5172 card (National Instruments Corporation). Both instrument control and post-processing were done in LabVIEW.
For the broadband pulse experiments, a 10 MHz single-cycle square wave was given as an input signal. For the quasi-harmonic UPS, a sine burst of a single frequency between 1 MHz and 10 MHz and a duration of 12 periods with a cosine tapered window was employed. Signals were recorded with a sampling frequency of 125 MS/s. The recorded time domain signals were converted to the frequency domain and normalized by using the frequency field measurement in a water reference to account for the transducer transfer function. In this way an absolute transmission spectrum is obtained. For the quasi-harmonic signals the outer 3 periods of the recorded signal were ignored in the processing of the signal amplitude.

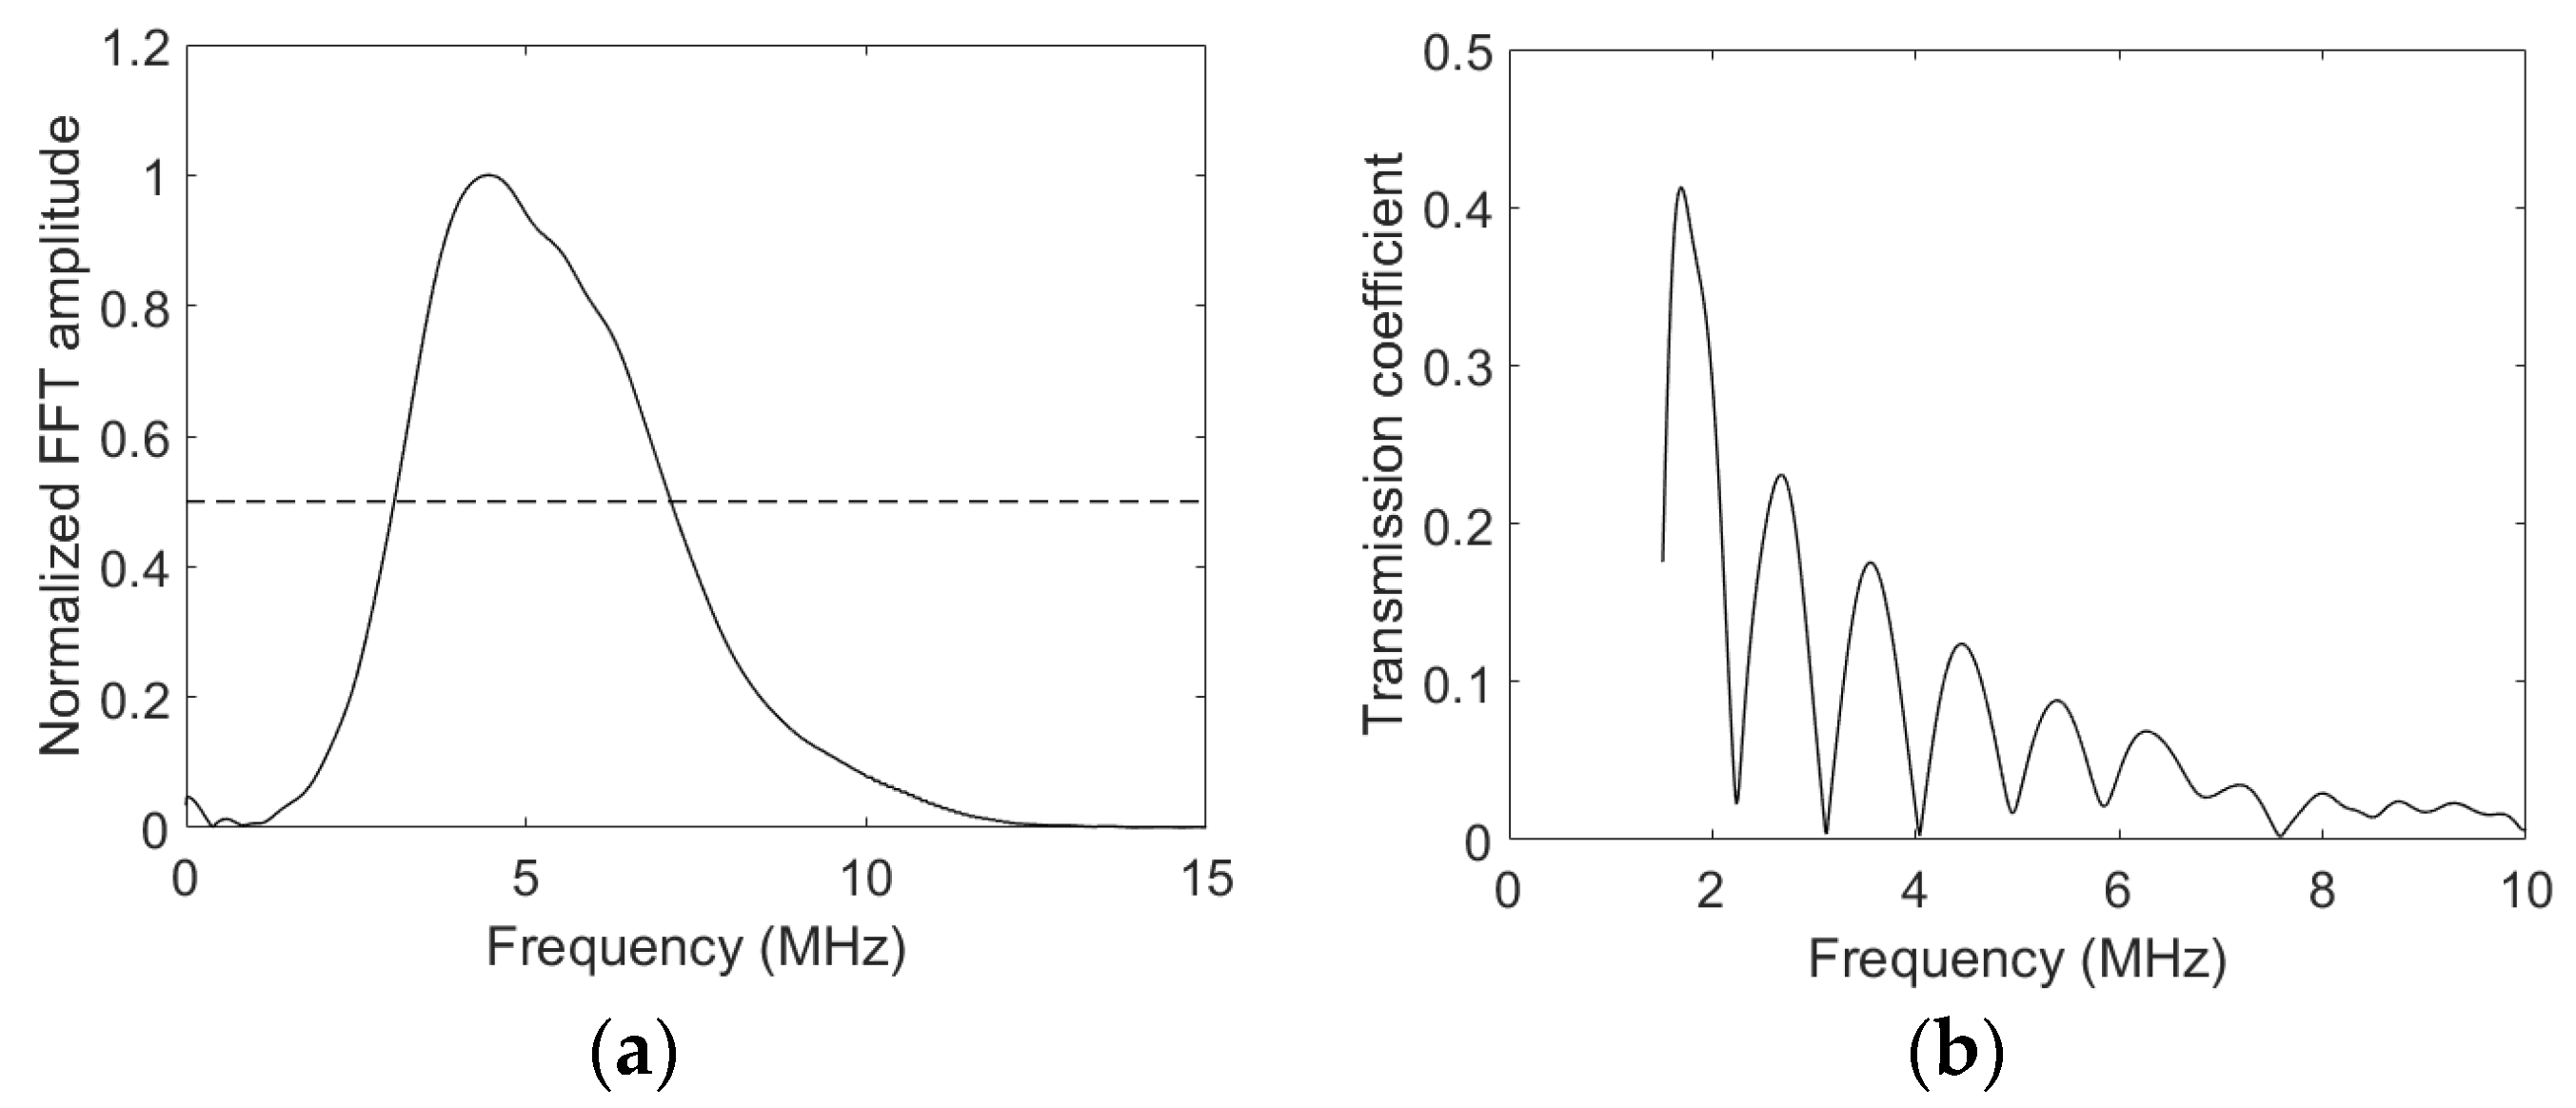
2.3. Spectroscopic Analysis Concept

Figure 3a shows the frequency amplitude spectrum of the broadband pulse in the water reference. It can be seen that the transducer bandwidth lies between 2.5 MHz and 7.5 MHz, with the useable frequency range between 2 MHz and 10 MHz. An example of the transmission coefficient spectrum for a UD composite can be found in Figure 3b. Each point in this spectrum can be used to construct a polar diagram for a single frequency much like a H-UPS diagram. The declining amplitude at higher frequencies is related to increasing attenuation.
Figure 4 illustrates the concept of the S-UPS analysis technique where the typical amplitude P-UPS diagram, which is linked to bulk wave phenomena, is supplemented by hundreds of diagrams of transmission coefficient values at different frequencies within the useable frequency range, which should relate to the conditions for efficient Lamb wave stimulation. Furthermore, the global level of the transmission coefficient provides a natural measure of the attenuation.

3. Results & Discussion

3.1. UD CFRP

Results of the S-UPS analysis technique on UD CFRP can be found in Figure 5a–c for three selected frequencies within the transducer’s useable frequency range. Figure 5d–f shows the results of several H-UPS experiments carried out on the same sample for the same respective frequencies. There is good qualitative agreement between the results of the S-UPS images and their H-UPS counterparts indicating the spectroscopic analysis contains the same information that can be extracted from a H-UPS experiments with the benefit of the broadband pulse technique supplying all images at once from one single measurement. Since a typical polar scan measurement with the current mechanical scanner setup takes around 15 min, the advantage of the spectroscopic technique in terms of speedup is clear.
It should be noted that for the image obtained at a frequency of 2 MHz the noise level is somewhat higher for the broadband pulse technique than it is for the H-UPS. This can be explained by the fact that this frequency lies on the edge of the useable range and the larger amount of periods in the quasi-harmonic signals counters the reduced amplitude.
The H-UPS technique can also be used to construct phase polar diagrams. A comparison of the phase diagrams obtained with the H-UPS and S-UPS technique at the selected frequencies is shown in Figure 6. Again it can be seen that there are clear similarities between the two techniques.

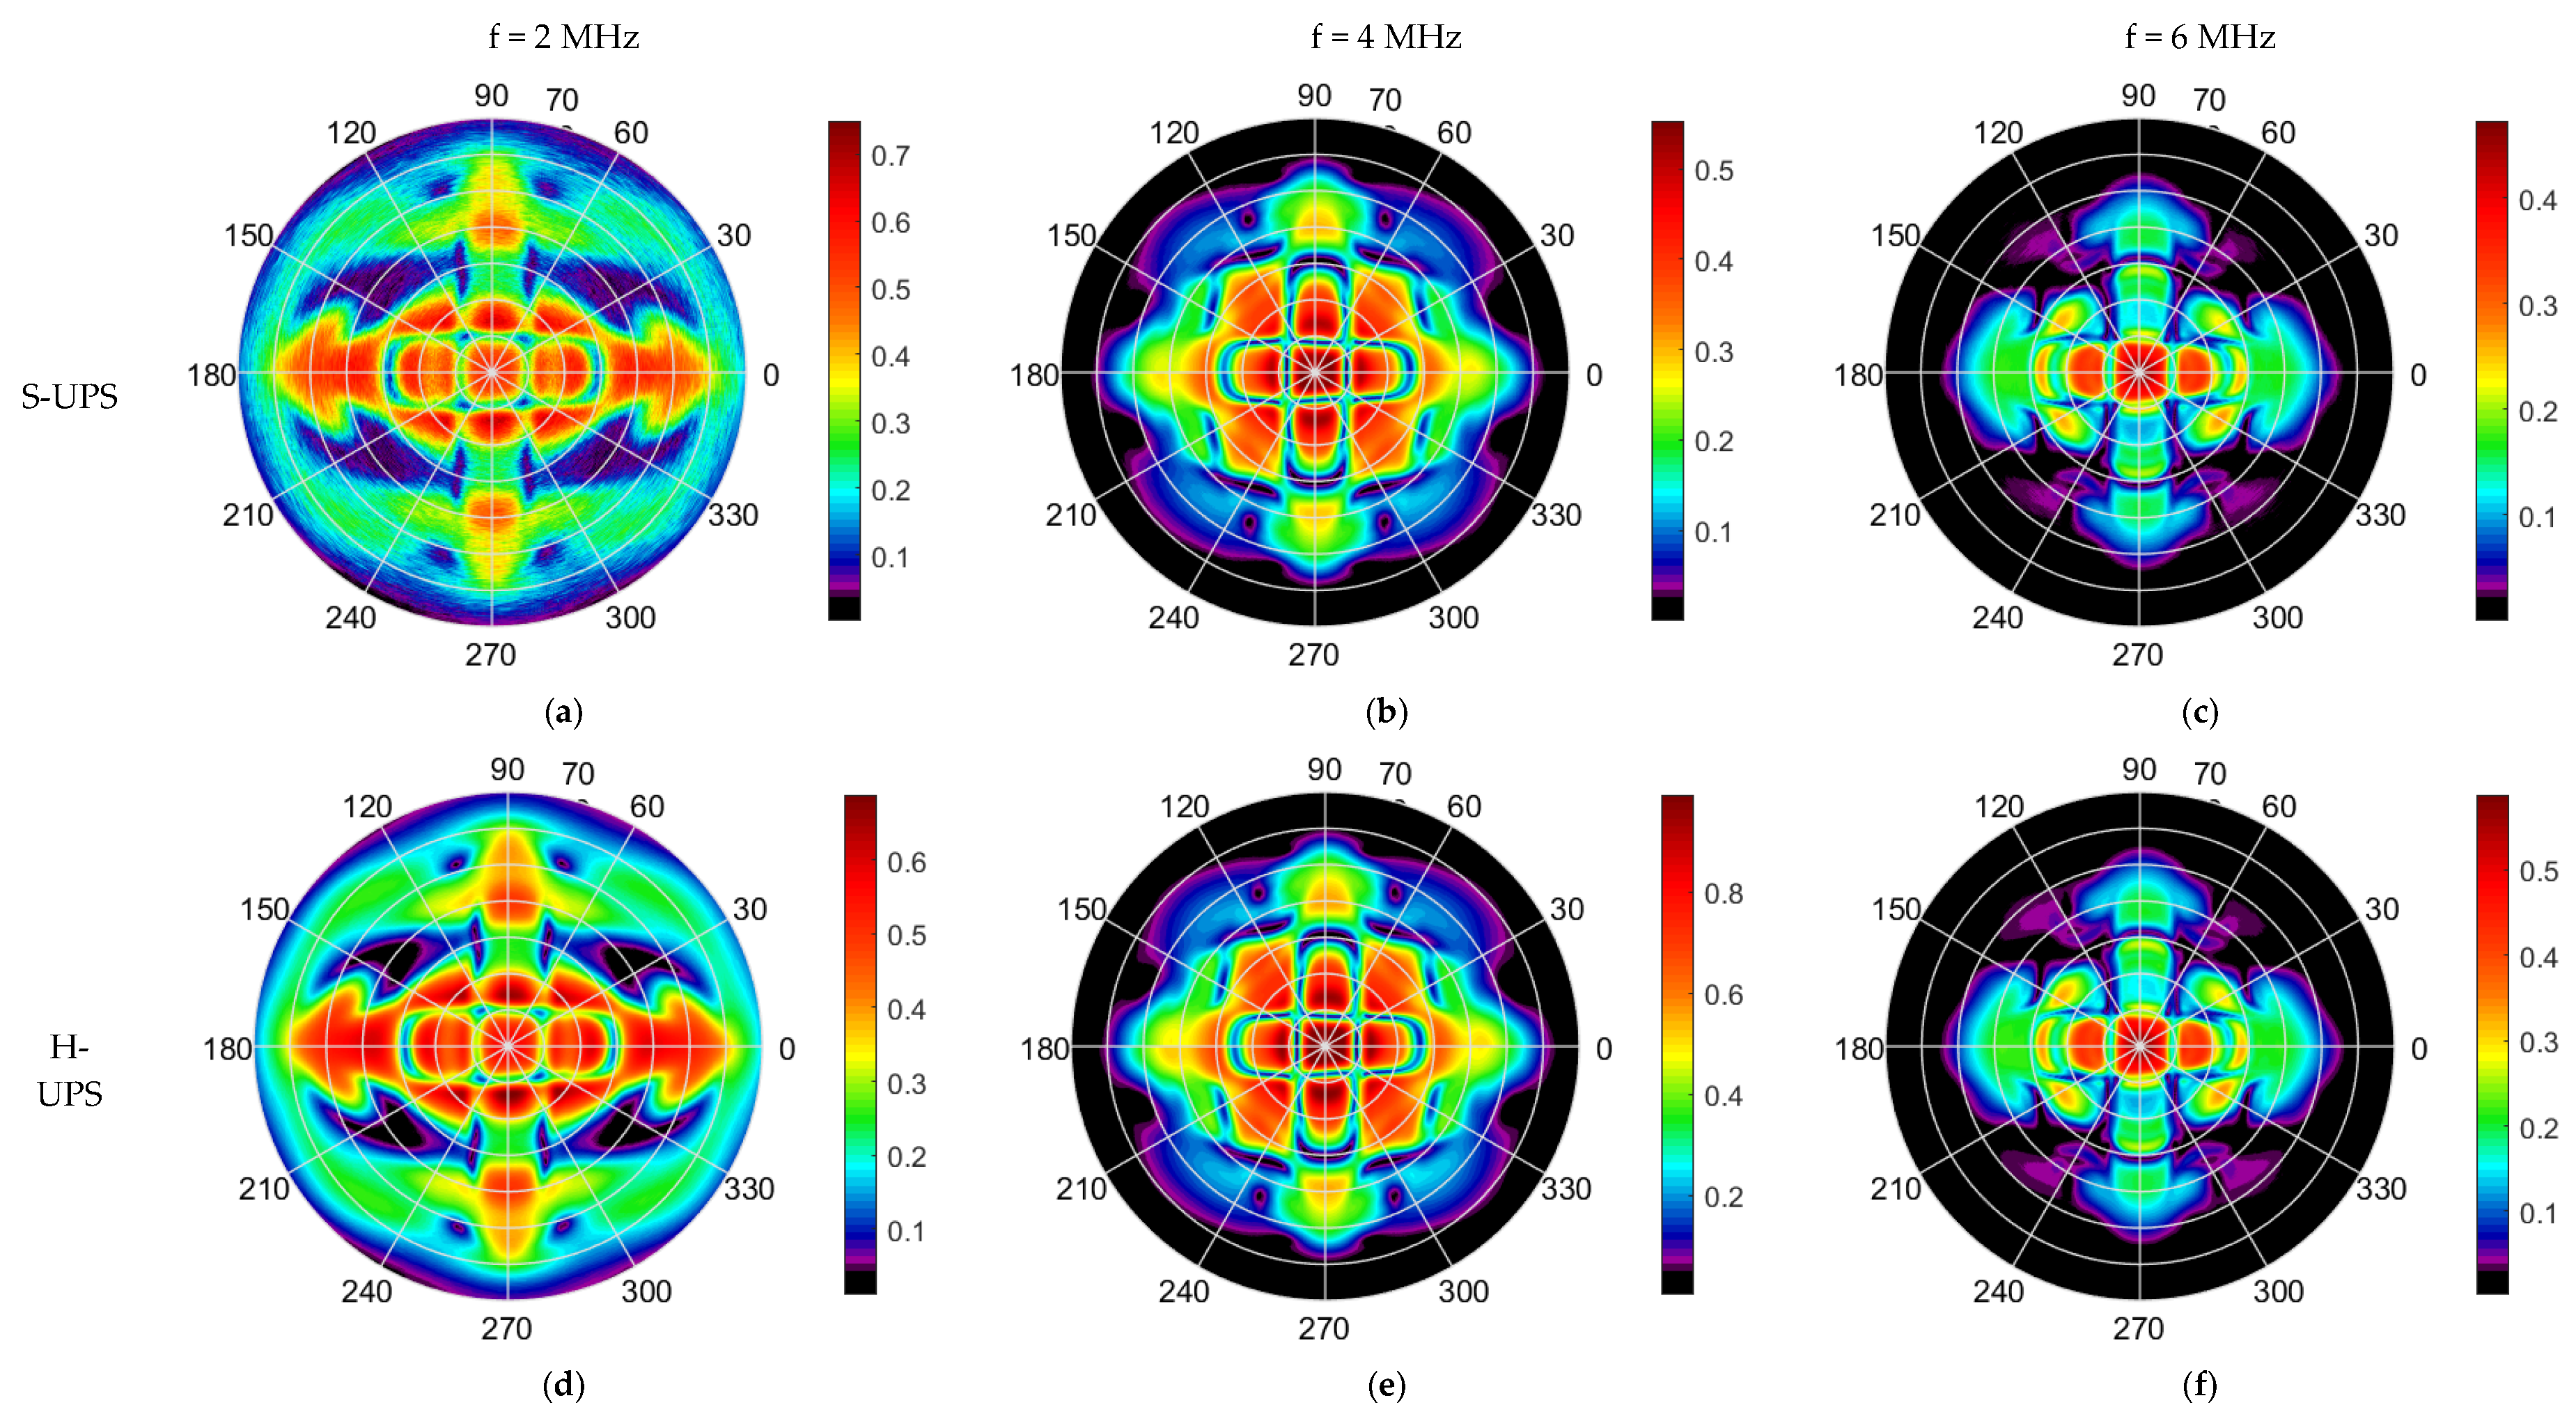
3.2. Orthotropic [02,902]S CFRP

The analysis can be repeated for a cross-ply laminate (see Figure 7). The S-UPS images again show good qualitative agreement with the H-UPS images. Also in this case the remark should be made that the 2 MHz pulse spectroscopic image is noisier than the H-UPS image due to the usable bandwidth of the employed transducer.
As was already shown in literature [8], the H-UPS method can indeed be linked to the presence of leaky Lamb waves. It was also shown in that paper that the H-UPS method showed great promise for use in an inverse method for finding the complex C-tensor, a role which could now also be filled by the spectroscopic technique.
Another important observation in the mentioned paper was the superior sensitivity of the H-UPS to the presence of a delamination. Our preliminary results indicate that this will also be the case for the spectroscopic technique.

4. Conclusions

The pulsed ultrasonic polar scan technique was combined with the spectroscopic analysis technique to expand the standard UPS amplitude and time-of-flight diagrams, that are linked to bulk wave phenomena, with spectroscopic diagrams that correspond to harmonic UPS diagrams which can be associated to the conditions for efficient Lamb wave stimulation. It was shown that there is good agreement between the broadband pulse spectroscopic diagrams or S-UPS diagrams and individual H-UPS experiments both for amplitude and phase. The time gain of a single S-UPS compared to individual H-UPS measurements can be a factor of 1000, depending on the amount of frequencies one wishes to study.

Author Contributions

M.K., S.D., K.V.D.A, W.V.P. and E.V. conceived and designed the experiments. E.V. performed the experiments and analyzed the data. M.K., A.M. and J.D. provided analysis support.

Acknowledgments

The authors would like to acknowledge support from FWO Flanders under Grant Agreements G0B9515N, 1S45216N and 12T5418N.

Conflicts of Interest

The authors declare no conflict of interest.

References

  1. Adams, R.D.; Cawley, P. A review of defect types and nondestructive testing techniques for composites and bonded joints. NDT E Int. 1991, 24, 105. [Google Scholar] [CrossRef]
  2. Zadler, B.J.; Le Rousseau, J.H.L.; Scales, J.A.; Smith, M.L. Resonant Ultrasound Spectroscopy: Theory and application. Geophys. J. Int. 2004, 156, 154–169. [Google Scholar] [CrossRef]
  3. Markham, M.F. Measurement of the elastic constants of fibre composites by ultrasonics. Composites 1969, 1, 145–149. [Google Scholar] [CrossRef]
  4. Su, Z.; Ye, L.; Lu, Y. Guided Lamb waves for identification of damage in composite structures: A review. J. Sound Vib. 2006, 295, 753–780. [Google Scholar] [CrossRef]
  5. Kersemans, M.; De Baere, I.; Degrieck, J.; Van Den Abeele, K.; Pyl, L.; Zastavnik, F.; Sol, H.; Van Paepegem, W. Nondestructive damage assessment in fiber reinforced composites with the pulsed ultrasonic polar scan. Polym. Test. 2014, 34, 85–96. [Google Scholar] [CrossRef]
  6. Kersemans, M.; Martens, A.; Degrieck, J.; Van Den Abeele, K.; Delrue, S.; Pyl, L.; Zastavnik, F.; Sol, H.; Van Paepegem, W. The Ultrasonic Polar Scan for Composite Characterization and Damage Assessment: Past, Present and Future. Appl. Sci. 2016, 6, 58. [Google Scholar] [CrossRef]
  7. Martens, A.; Kersemans, M.; Daemen, J.; Verboven, E.; Van Paepegem, W.; Degrieck, J.; Delrue, S.; Van Den Abeele, K. Numerical study of the Time-of-Flight Pulsed Ultrasonic Polar Scan for the determination of the full elasticity tensor of orthotropic plates. Compos. Struct. 2017, 180, 29–40. [Google Scholar] [CrossRef]
  8. Kersemans, M.; Martens, A.; Van Den Abeele, K.; Degrieck, J.; Pyl, L.; Zastavnik, F.; Sol, H.; Van Paepegem, W. The quasi-harmonic ultrasonic polar scan for material characterization: Experiment and numerical modeling. Ultrasonics 2015, 58, 111–122. [Google Scholar] [CrossRef] [PubMed]
  9. Castaings, M.; Hosten, B.; Kundu, T. Inversion of ultrasonic, plane-wave transmission data in composite plates to infer viscoelastic material properties. NDT E Int. 2000, 33, 377–392. [Google Scholar] [CrossRef]
Figure 1. (a) Principle of the Pulsed Ultrasonic Polar Scan technique (P-UPS). Experimental P-UPS recording for a [0°]8 carbon/epoxy composite: (b) amplitude and (c) TOF.
Proceedings 02 00536 g001
Figure 2. Transmission spectrum as a function of the out-of-plane angle θ for an aluminum plate.
Proceedings 02 00536 g002
Figure 3. (a) Frequency amplitude spectrum of the transducers used in the experiment for the water reference. (b) Example of the transmission coefficient spectrum for a UD composite at θ = 35°, φ = 60°.
Proceedings 02 00536 g003
Figure 4. The typical amplitude polar diagram of the UPS technique for a [0°]8 carbon/epoxy composite (P-UPS) can be supplemented with a spectroscopic analysis to provide a large number of S-UPS diagrams for different frequency bands.
Proceedings 02 00536 g004
Figure 5. (ac) S-UPS images of a [0°]8 carbon/epoxy composite for frequencies of 2 MHz, 4 MHz and 6 MHz respectively compared to (df) polar scan images obtained for separate H-UPS measurements of the same sample and for the same respective frequencies.
Proceedings 02 00536 g005
Figure 6. (ac) Phase diagrams of a [0°]8 carbon/epoxy composite obtained by the S-UPS for frequencies of 2 MHz, 4 MHz and 6 MHz respectively compared to (df) images obtained for H-UPS measurements for the same respective frequencies.
Proceedings 02 00536 g006
Figure 7. (ac) Polar scan images of a [02,902]S carbon/epoxy composite obtained by the S-UPS for frequencies of 2 MHz, 4 MHz and 6 MHz respectively compared to (df) polar scan images obtained for separate H-UPS measurements of the same sample and for the same respective frequencies.
Proceedings 02 00536 g007
Publisher’s Note: MDPI stays neutral with regard to jurisdictional claims in published maps and institutional affiliations.

