The complexity and the large dimension of the church suggested the implementation of a monitoring system, that is fully computer based and easily expandable but initially including a relatively limited number of sensors. The monitoring design was initially based on: (i) the prior knowledge of the Cathedral and its history (see e.g., [
2,
3]); (ii) the results emerged from the completion of a comprehensive dynamic investigations on the metallic tie-rods [
4,
5] and the preliminary observations on the dynamic characteristics of the Cathedral; (iii) the inventory of the sensors installed in the church and still regularly operating.
The critical analysis of several documents and the inspection of the available experimental information allowed to identify the sub-structures to be specifically considered in the new monitoring system: (a) selected piers of apse, tiburio, façade and transept; (b) the tie-rods subjected to high tensile stress (of the order of 100 MPa or higher) or affected by slight damage [
4,
5] and (c) the main spire [
6].
The inventory of the sensing devices installed in the Cathedral revealed that, as expected, almost all the sensors were outdated or out of order: only the system based on geometric leveling, established to measure the horizontal deflection of the piers, turned out to be fully operating. Although this system is not computer based, it has been active in measuring the piers deformation at pre-selected intervals (May and November) since more than 50 years (see e.g., [
7]) so that it is worth preserving the continuity of a such valuable historic time series, that will be added to the data archive collected by the new sensing devices.
Based on knowledge of the monument and the results of the previous experimental tests, tilting of selected piers and of the main spire, strain in a certain number of tie-rods and the dynamic characteristics (i.e., natural frequencies and associated modal deflections) of the church and main spire were identified as key parameters to monitor for assessing the structural health of the Cathedral and addressing its condition-based structural maintenance. Hence, the installation of two long-term monitoring systems is ongoing in the church, one static and the other dynamic.
3.1. Static Monitoring
The static monitoring system consists of the following sensors:
12 bi-axial tilt-meters [
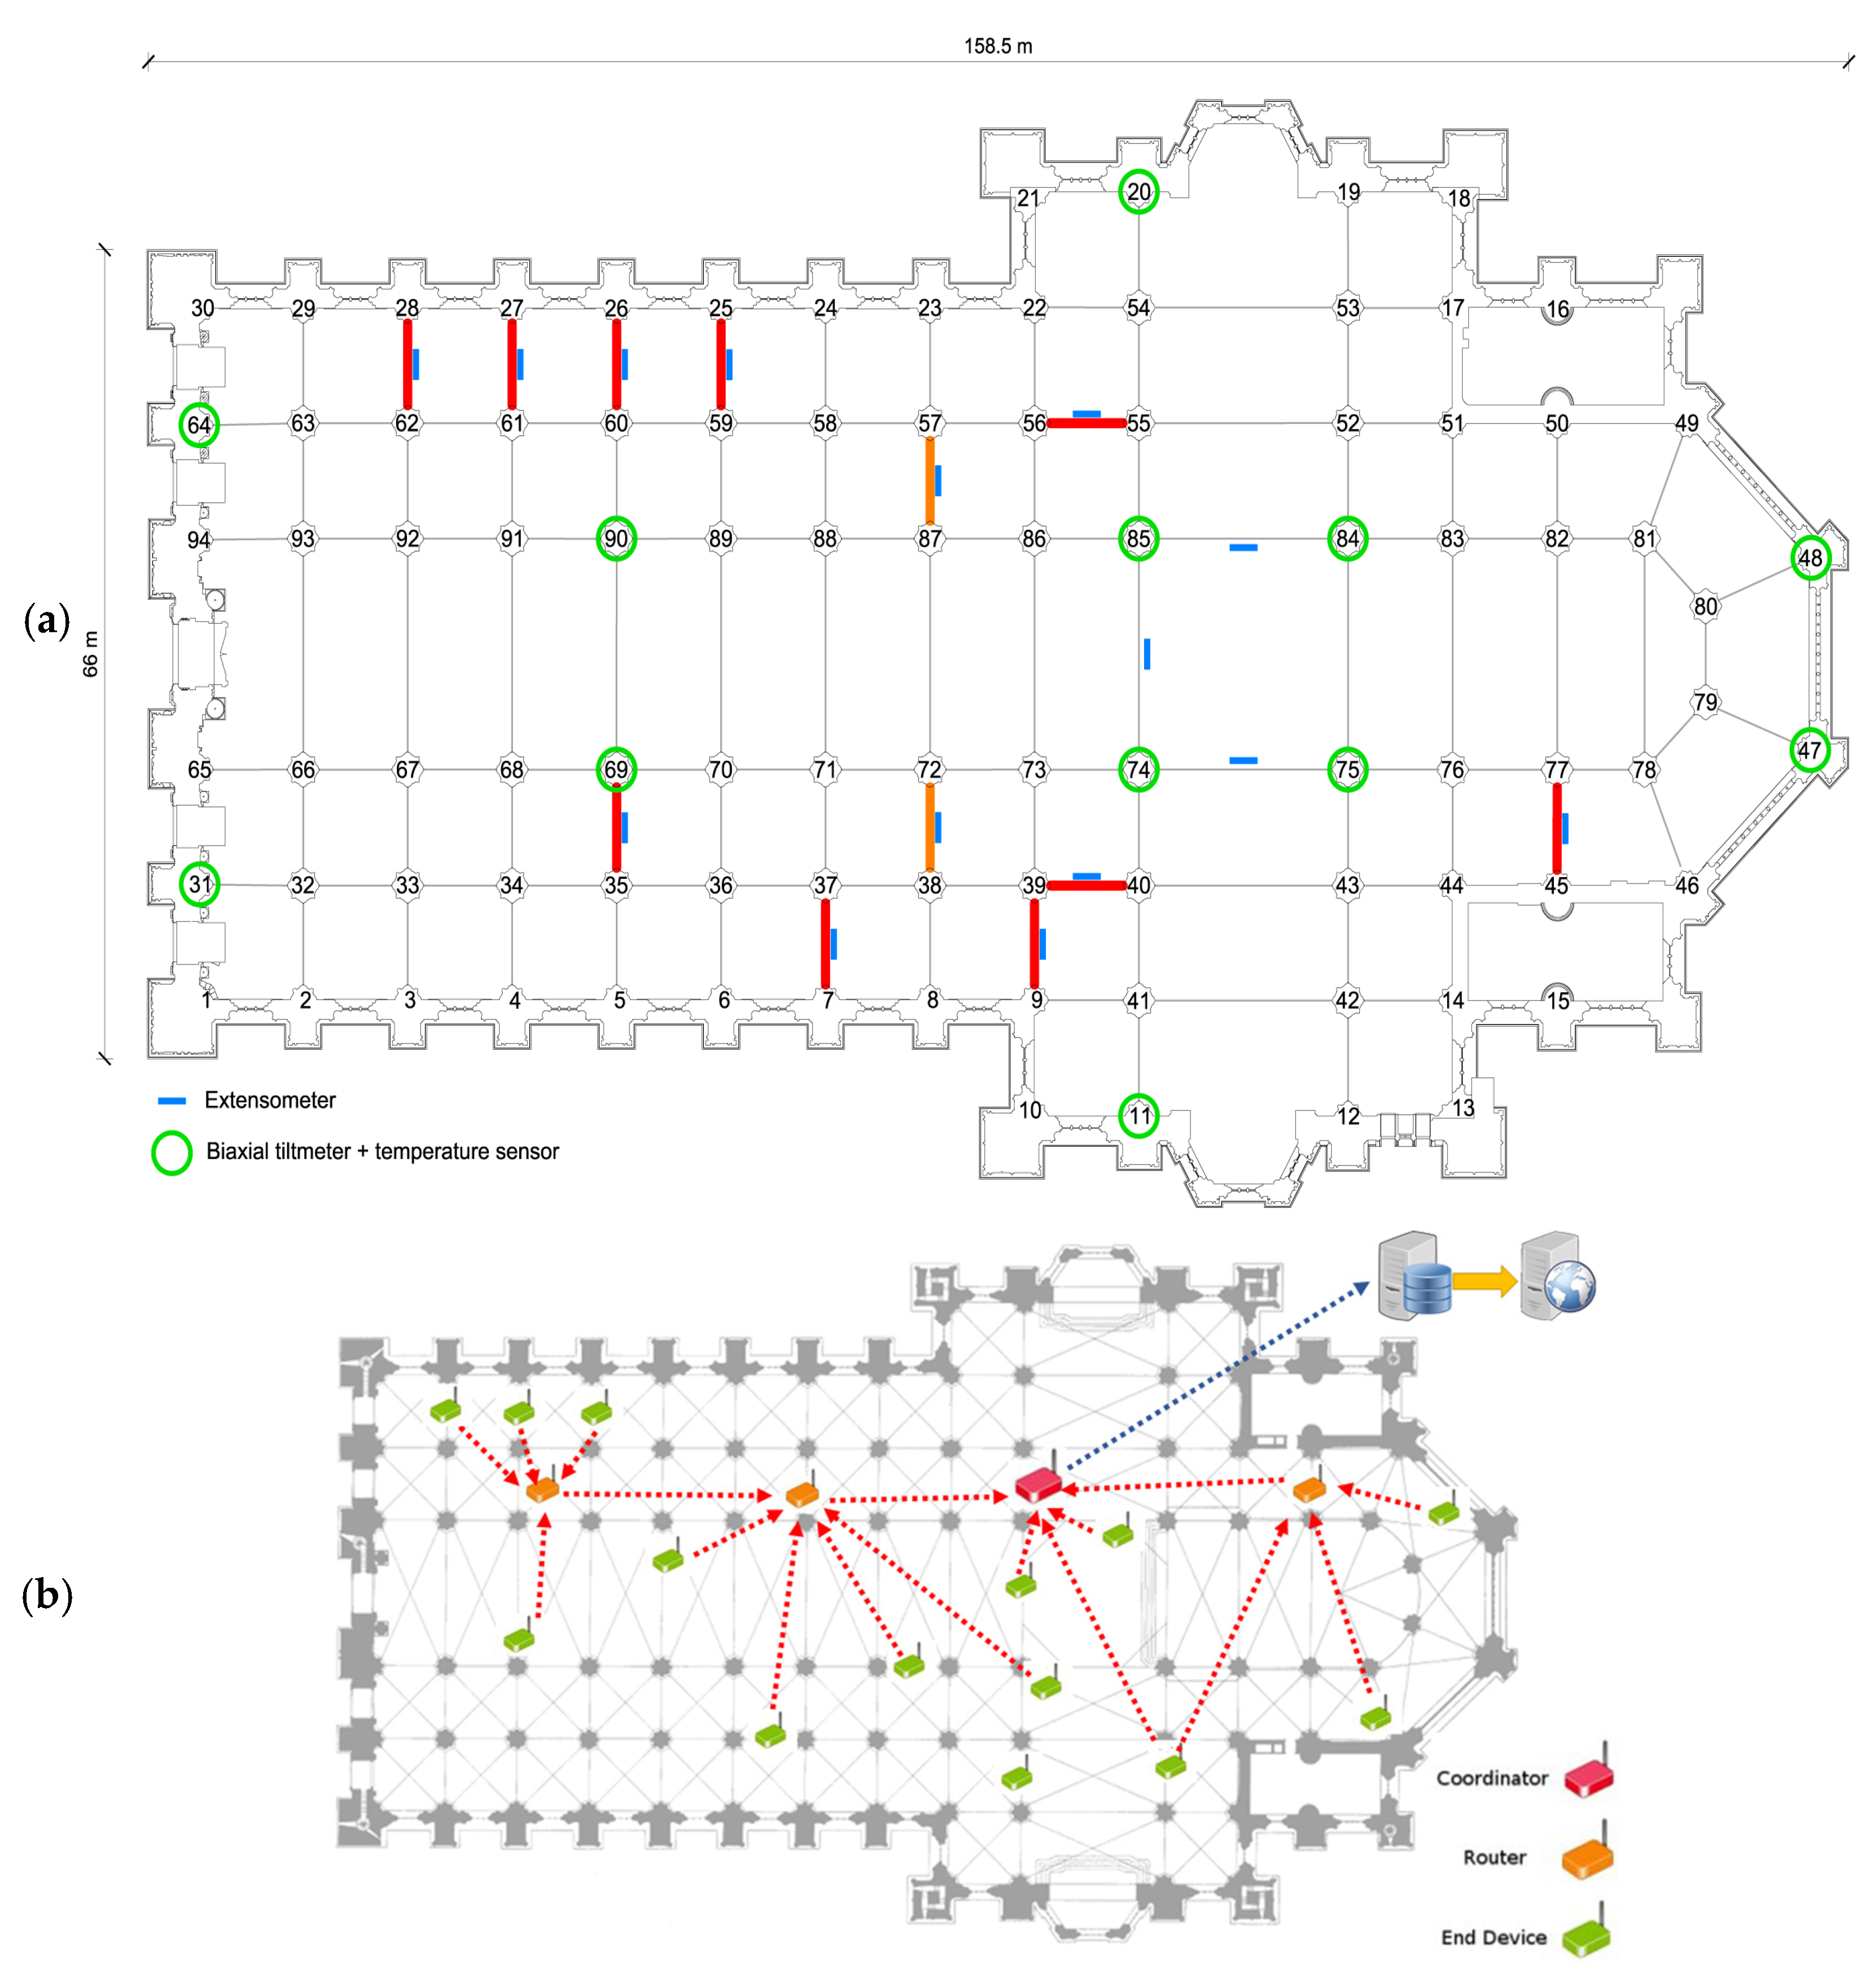
8], with a measurement range of ±0.5° and a resolution of ±0.5 mm/m, located inside the Cathedral (
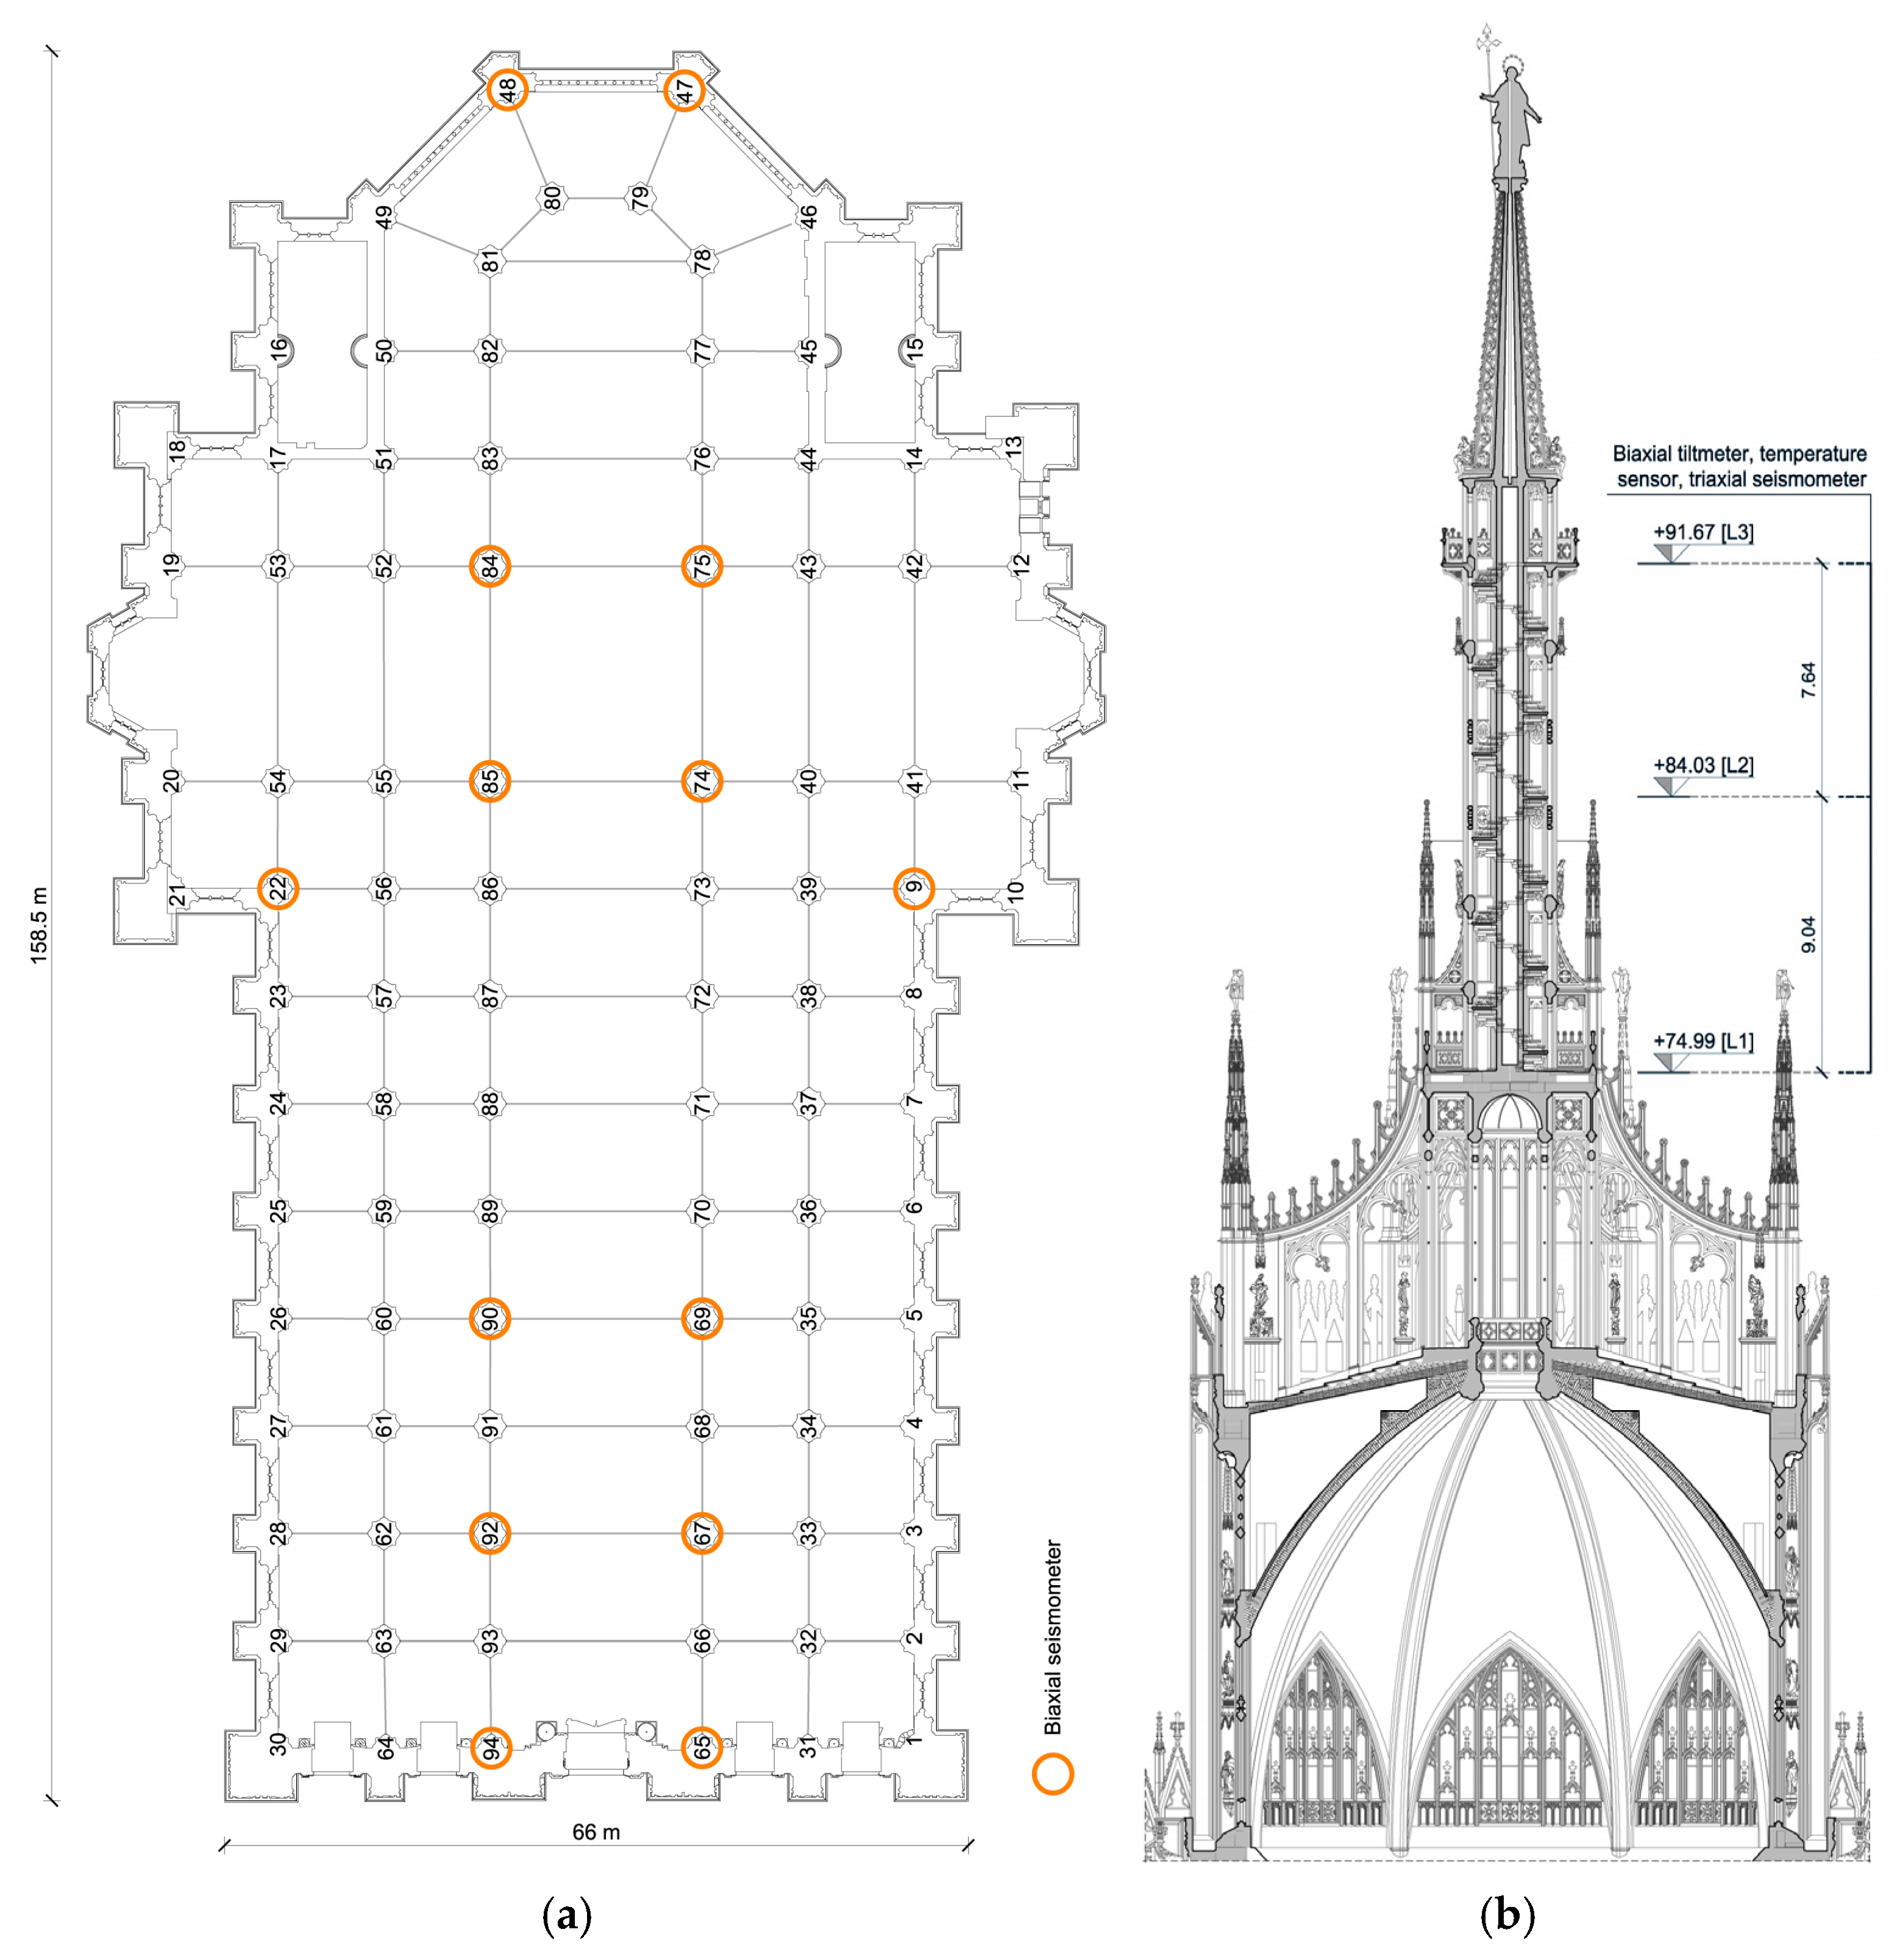
Figure 3a) on top of piers 31 and 64 (façade), 69 and 90, 11 and 20 (transept), 74–75 and 84–85 (tiburio) and 47–48 (apse);
3 bi-axial tilt-meters [
8], installed at different levels of the main spire (+74.99 m, +84.03 m and +91.67 m, see
Figure 4b);
15 sensors, integrated with each bi-axial tilt meter, to measure air temperature and relative humidity. The temperature range is between −20 °C and +60 °C (with a resolution of 0.2 °C), whereas the relative humidity range varies from 0% to 100% (with a resolution of 1%);
15 vibrating wire extensometers, with measurement range of ±3000 με and a resolution of 1 με, installed (
Figure 3a) on 10 metallic tie-rods subjected [
5] to tensile stress exceeding 100 MPa (highlighted in red in
Figure 3a), on 3 tension bars (in modern steel) connecting the
tiburio piers and on tie-rods 38–72 and 57–87 exhibiting slight damage [
5,
6].
All the sensors of the static system are wireless and powered through high capacity batteries; as all measurement records will be conceivably taken with a sampling rate of two per hour, the expected power charge should be longer than 3 years. A schematic of the data acquisition and transmission characterizing the static monitoring is shown in
Figure 3b, with several static channels being managed by local nodes or end devices; the data collected by neighboring end devices are transmitted to routers and those routers, in turn, transmit the information—through a “coordinator” node—to a local workstation managed by the VFD technical staff. The local workstation is equipped with appropriate software codes aimed at the remote management and check of the different devices; in addition, through the Internet, the data are processed by authorized users (such as Politecnico di Milano) and the compressed results come back to VFD workstation for direct check and decision making as well as for being stored in digital archives.
Basically the same system architecture and procedures are adopted for the dynamic monitoring, with the main differences that only the features (natural frequencies, mode shapes and a few time series corresponding to significant events) evaluated at pre-selected time intervals are scheduled to be stored in the VFD archives.
It is worth mentioning that immediately before the installation of the extensometers on the iron ties (scheduled on May 2018), the dynamic assessment previously carried out [
5] to estimate the tensile load of each tie-rod will be repeated with the two-fold objective of verifying that no significant change occurred (for example, associated to thermal effects) and obtaining a sound estimate of the tensile stress exactly corresponding to the beginning of monitoring activity.
3.2. Dynamic Monitoring
The dynamic monitoring system is entirely based on SARA SS45 seismometers (electro-dynamic velocity transducers) [
9]. The seismometer choice is motivated by: (a) the high sensitivity (78 V/[m/s]) and the excellent performance of electro-dynamic transducers in the low frequency range (
f ≤ 100 Hz); (b) the possibility of obtaining a good estimate of the dynamic displacement time series by integrating the velocity records; (c) the un-necessity of powering the sensors; (d) the reduced cost, when compared to more common accelerometers of comparable technical characteristics.
It should be mentioned that the displacement time series, especially of the slender main spire, will provide the VFD with data generally not available and directly related to the stiffness and structural health. The dynamic monitoring system (
Figure 4) consists of:
Preliminary dynamic tests were performed in the Milan Cathedral, by installing conventional accelerometers: (i) on the top of piers 22, 54 and 55 (6 channels of data, with 3 + 3 accelerometers oriented along N-S and S-W directions, respectively); (b) on the top of piers 9 and 39 (4 channels of data, with 2 + 2 sensors oriented along N-S and S-W directions, respectively). The results of these tests indicate that 3 global modes of the Cathedral are clearly identified. The lower vibration modes involve global motion of the Cathedral in the direction N-S (1.38 Hz) and E-W (1.71 Hz), whereas the third natural (2.67 Hz) is conceivably associate to a torsion mode. In addition, higher (global or local) modes have been detected in the frequency range 0–10 Hz.
The analysis of the signals acquired—in the same hours but not synchronized—on piers 9, 39 and on the main spire has allowed to establish a strong correlation between the dynamic characteristics observed on the Cathedral piers and on the main spire: (a) the first mode observed on the main spire involve deflections in the N-S direction and corresponds (natural frequency and direction) to the first global mode observed inside the church; (b) the second mode observed on the main spire involve deflections in the E-W direction and, again corresponds (natural frequency and direction) to the second global mode of the Cathedral.
Furthermore, the first local mode of the main spire is characterized by bending in the N-S plane and its natural frequency (1.76 Hz) is very close to the one of the Cathedral’s second mode (1.71 Hz, E-W direction). It is marginally noticed that in previous studies [
7], referring to data collected during the restoration work of the main spire, the first frequency (N-S direction and corresponding to a global mode of the monument) was not identified (conceivably as a consequence of the presence of the provisional scaffoldings) and a different structural interpretation was given to the observed closely spaced modes.
It is worth mentioning that clear velocity peaks were measured on the piers and associated to metro transits. These relative maxima, even if as frequent as the metro passages, were always much lower than 1.0 mm/s, that is the admissible threshold generally considered for historical constructions. Hence, the management of the dynamic monitoring will be also finalized to estimate the peak particle velocity associated to selected piers.
Based on the preliminary dynamic tests, the dynamic monitoring is aimed at: (i) performing the automated modal identification (i.e., the estimation of natural frequencies and mode shapes of local and global vibration modes); (b) tracking the time evolution of the identified modal frequencies and shapes; (c) providing the statistics of the peak velocity at selected points; (d) collecting the displacement time series associated to special events (i.e., maintenance operations, strong winds, far-field seismic events, etc.).


