Proceeding Paper

Optical Infrared Thermography of CFRP with Artificial Defects: Performance of Various Post-Processing Techniques †

by
Gaétan Poelman
1,*,
Saeid Hedayatrasa
1,2,
Joost Segers
1,
Javier Andres Calderon Tellez
1,
Wim Van Paepegem
1 and
Mathias Kersemans
1
1
Department of Materials, Textiles and Chemical Engineering (MaTCh), Ghent University, Technologiepark-Zwijnaarde 903, 9052 Zwijnaarde, Belgium
2
SIM Program M3 DETECT-IV, Technologiepark-Zwijnaarde 935, B-9052 Zwijnaarde, Belgium
*
Author to whom correspondence should be addressed.
Presented at the 18th International Conference on Experimental Mechanics (ICEM18), Brussels, Belgium, 1–5 July 2018.
Proceedings 2018, 2(8), 457; https://doi.org/10.3390/ICEM18-05358
Published: 15 June 2018
(This article belongs to the Proceedings of The 18th International Conference on Experimental Mechanics)

Abstract

:
This paper treats an experimental study that focusses on optical infrared thermography for non-destructive testing of composites through lock-in and flash excitation. Different fiber reinforced plastics with various artificial defects have been investigated. Three different post-processing techniques are applied, namely fast Fourier transform (FFT), principal component analysis (PCA) and thermographic signal reconstruction (TSR). A comparison between the different excitation and post-processing methods is performed, and their strengths and weaknesses in detecting artificial defects in composites are evaluated and discussed.

1. Introduction

Carbon fiber reinforced plastics (CFRPs) are composite materials that offer similar strength and stiffness as commonly used metals, but have the advantage of being light-weight [1]. This makes CFRPs very attractive for a multitude of applications, but mainly for the transportation industry (e.g., aerospace) where a lower weight results in fuel-efficient vehicles. However, composites are quite susceptible to internal damage features, which deteriorate their mechanical performance. Hence, non-destructive testing (NDT) is of crucial importance to assure the structural integrity of a composite component. Inspection through infrared thermography is a full-field and non-contact NDT method which can be used to detect different types of defects e.g., flat bottom holes (FBHs) [2], delaminations [3,4,5] and impact damage [6,7].
In this paper, the effectiveness of optical infrared thermography for detection of artificial defects, including FBHs and inter-laminar film inserts, in CFRP laminates is investigated. The results of lock-in (harmonic) and flash excitation are presented, and a critical comparison between them is made.

2. Materials and Method

2.1. Samples

In this paper, two different CFRP samples, each with their own type of defect, are investigated. The first sample has a [−45/0/45/90]3s layup, and includes five flat bottom holes with the same diameter of 10 mm and different remaining material thickness ranging from 1.15 mm to 4.85 mm. The second sample is a square CFRP plate and has a [(0/90)2/0]s stacking sequence, including five ethylene tetrafluorethylene (ETFE) inserts, each with a film thickness of 60 microns, at different depths (in between plies). Since CFRP is an anisotropic material, its thermal properties vary with direction, with the thermal diffusivity being approximately 5.4 × 10 6   m 2 / s and 6.2 × 10 7   m 2 / s along and perpendicular to the fibers, respectively [8]. An overview of the specifications of the samples is given in Table 1.

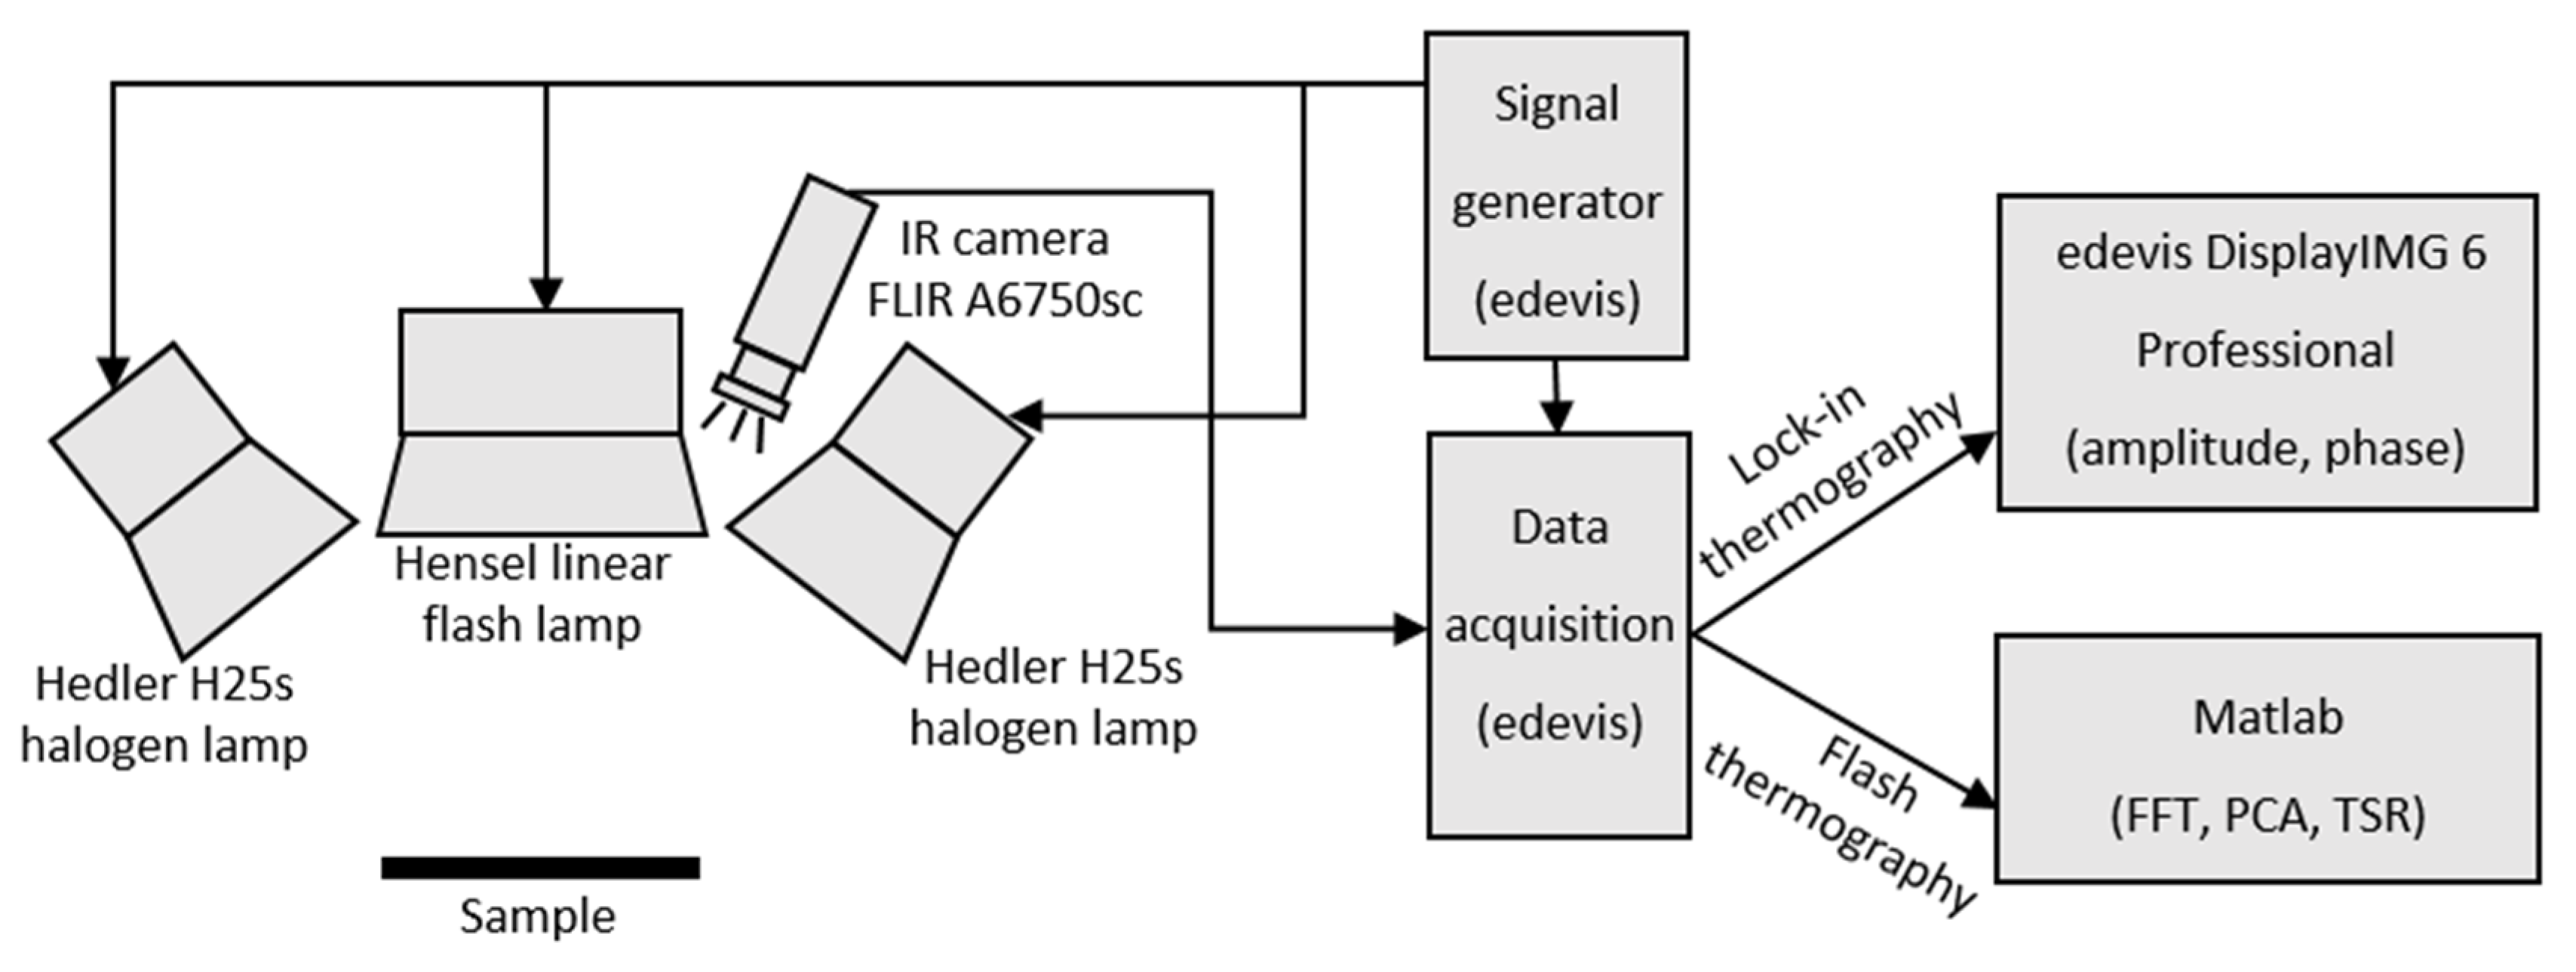
2.2. Experimental Set-Up and Procedure

All tests are performed in reflection mode, i.e., optical excitation and infrared camera at the same side, with the sample mounted at a distance of ~70 cm from the excitation (to ensure that sufficient energy is transmitted to the sample). The infrared camera is a FLIR A6750sc, which has a cryo-cooled InSb detector with a pixel density of 640 × 512 pixels, a noise equivalent temperature difference (NETD) of <20 mK and a bit depth of 14 bit. An internal infrared filter is installed, which narrows the camera’s spectral range from 1–5 µm to 3–5 µm. For the lock-in excitation, two halogen lamps of the Hedler H25s type are used, each covered with two PMMA shields to filter their infrared interference. The halogen lamps each have a nominal power of 2 kW, and are connected to an edevis signal generator, which allows the user to define the desired modulation for the excitation. The flash excitation originates from a Hensel linear flash lamp with a nominal energy of 6 kJ that delivers a flash with a duration of around 10 ms. All experiments are performed with a fully synchronized edevis hardware and software thermographic system which ensures the accuracy of triggering and data acquisition. The post-processing of the thermographic data is performed with the edevis DisplayIMG 6 Professional software and further with Matlab for more advanced analysis.
Six lock-in frequencies are investigated, ranging from 0.05 Hz to 1 Hz, and a framerate of 10 Hz is used. All experiments start with the sample being at room temperature. Furthermore, each sample is inspected by a flash excitation, for which a total recording time of 120 s (with a pulse delay of 0.1 s for cold image subtraction (CIS)) and a framerate of 25 Hz is considered. The excitation lamps have been placed in such a way to avoid their direct reflections into the camera’s lens, and to have a high degree of uniformity in the heat distribution over the sample’s surface.
An image of how the complete thermographic set-up works, is given in Figure 1.
Fast Fourier transform (FFT) of the lock-in experiments leads to amplitude and phase images of the excitation frequency, while the time history of the flash experiments is fed into a Matlab script that performs three popular post-processing techniques, namely PPT (which uses FFT to transform the signal to the frequency domain) [9], principal component analysis (PCA) [4] and thermographic signal reconstruction (TSR) [3,10,11]. Raw thermal data corresponding to the cooling time after flash excitation is considered for post-processing, and a polynomial of the 5th order is fitted for TSR.

3. Results

All samples have a piezoelectric transducer (PZT) glued to the back side (used for vibrational NDT inspections), which causes a local distortion of the thermal response. The presence of these PZTs in a thermal image indicates that the induced thermal wave reaches the back side of the sample.

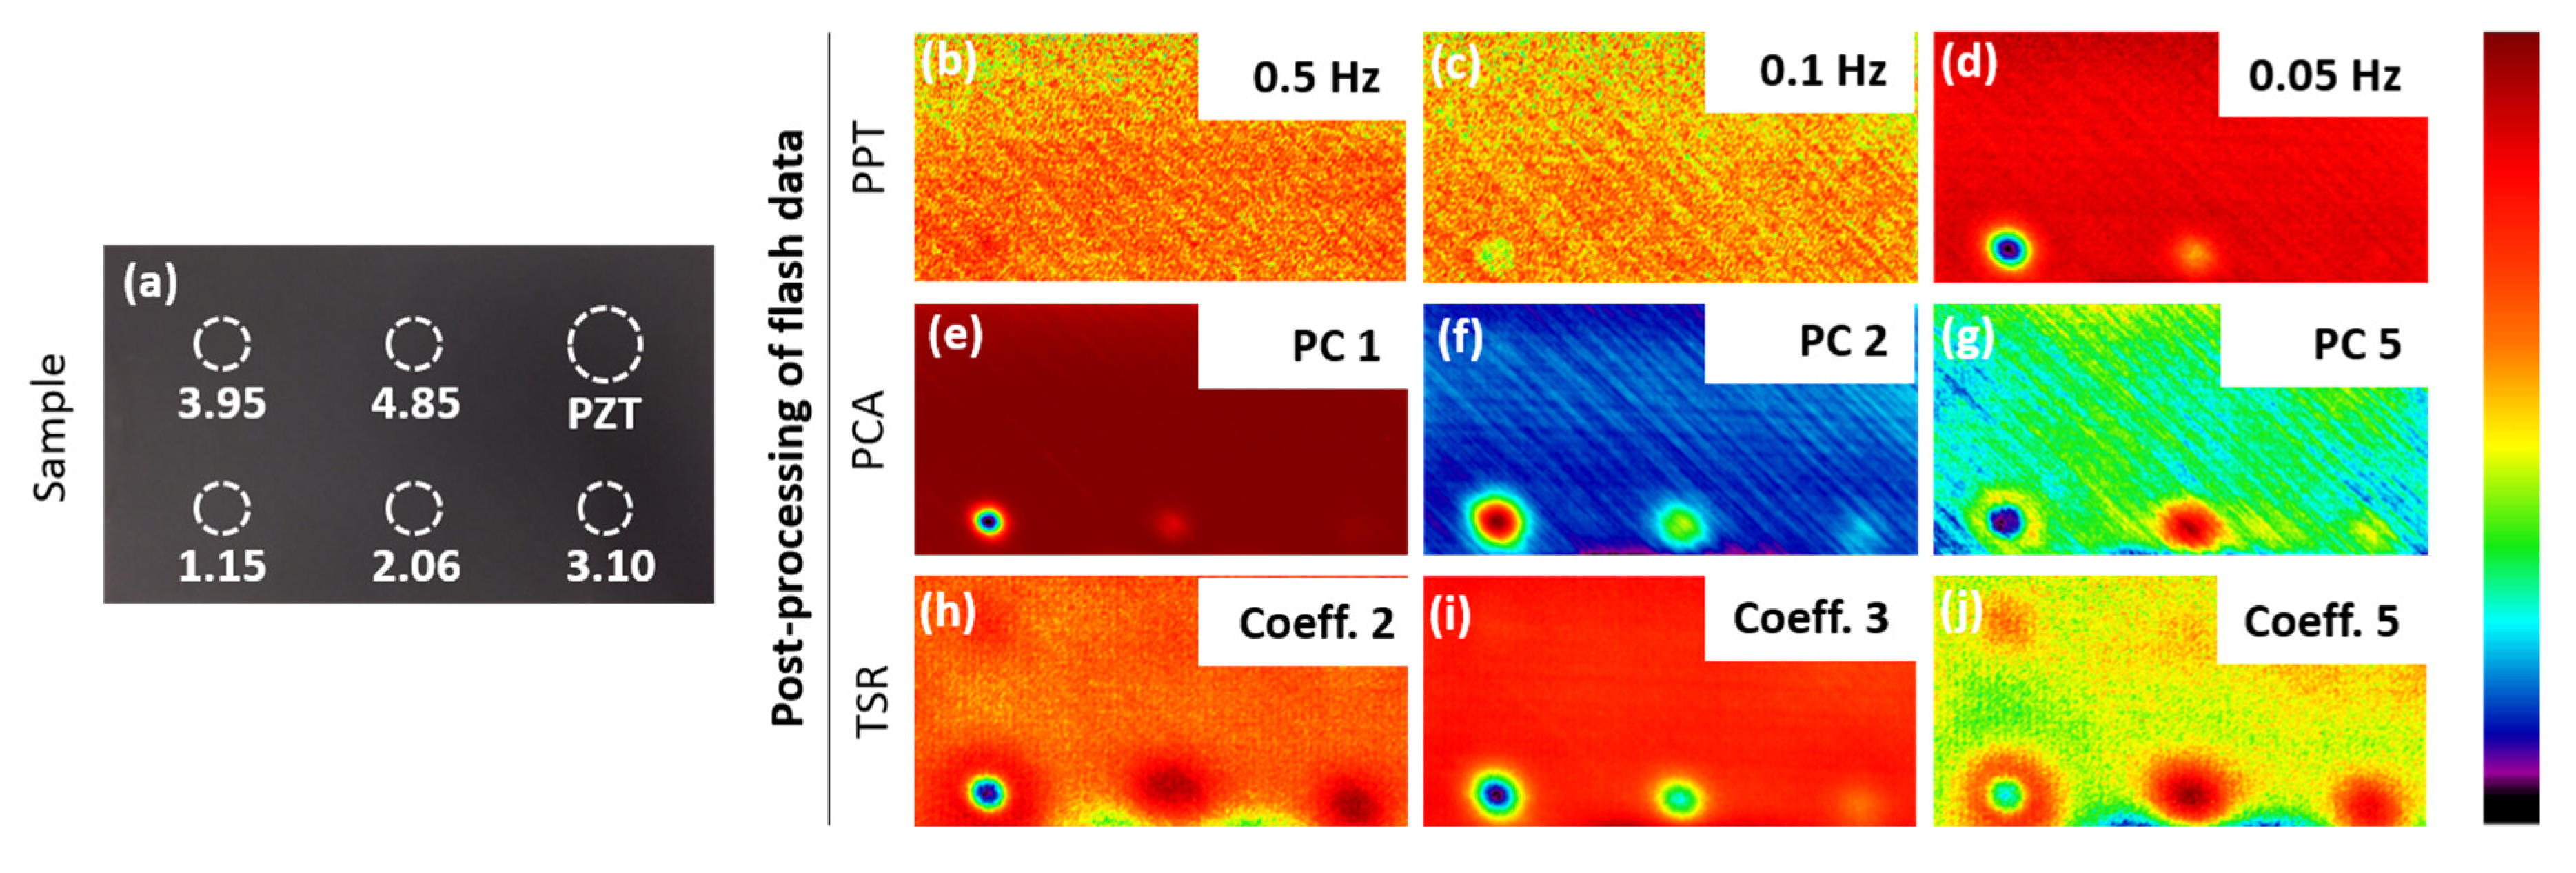
3.1. CFRP Sample with Flat Bottom Holes

Figure 2a shows the sample with its defects and their depths, and Figure 2b–g present the lock-in results obtained for the CFRP with flat bottom holes. The amplitude results at the various frequencies are shown in the first row (Figure 2b–d), while corresponding phase images are presented in the second row (Figure 2e–g).
For the frequencies that give a clear indication of the defects (0.1 Hz and 0.05 Hz), the phase images clearly outperform the amplitude images. The phase not only provides a deeper probing of the material, but it also manages to greatly reduce influences from non-uniform heating (true uniformity is unattainable). Since the phase performs better than the amplitude, only the phase images will be taken into account for the remainder of this paper.
It can be deduced from these experiments that, by lowering the excitation frequency, deeper defects can be discovered. Furthermore, the size of a defect’s thermal signature increases by lowering the frequency (compare Figure 2c,d). This can be explained by the longer excitation period of 0.05 Hz which leads to more lateral heat diffusion.
The total duration to perform all these lock-in experiments was around 30 min, with the waiting time in between experiments being the most time-consuming factor.
Figure 3 displays the post-processed images of the flash excitation. The PPT results in Figure 3b–d can be compared to the lock-in results in Figure 2e–g. In theory, they should lead to similar results. However, it is clear that the defect contrast for the lock-in experiments is much higher, which can be explained by the non-uniform spectral intensity induced by the flash thermography. In fact, the excitation amplitude of lock-in thermography is generally higher than for flash thermography at the same frequency.
Three principal components (PCs) are presented in Figure 3e–g, and reveal the same defects as the lock-in results of Figure 2e–g, with the second PC being very similar to the lock-in result at 0.05 Hz. For this case, PCA is a better post-processing method than PPT as it has an enhanced defect detection and largely reduces the dataset (a few images instead of a few thousand). Three coefficient images of the TSR method are given in Figure 3h–j, in which it is shown that for the fifth coefficient image, the fourth FBH appears. Hence, these results for the CFRP with FBH’s indicate that TSR shows the best performance in detecting deep defects.
The duration to perform the flash experiment, and running the post-processing methods, was around five minutes. This method is thus much more time-efficient compared to lock-in thermography.

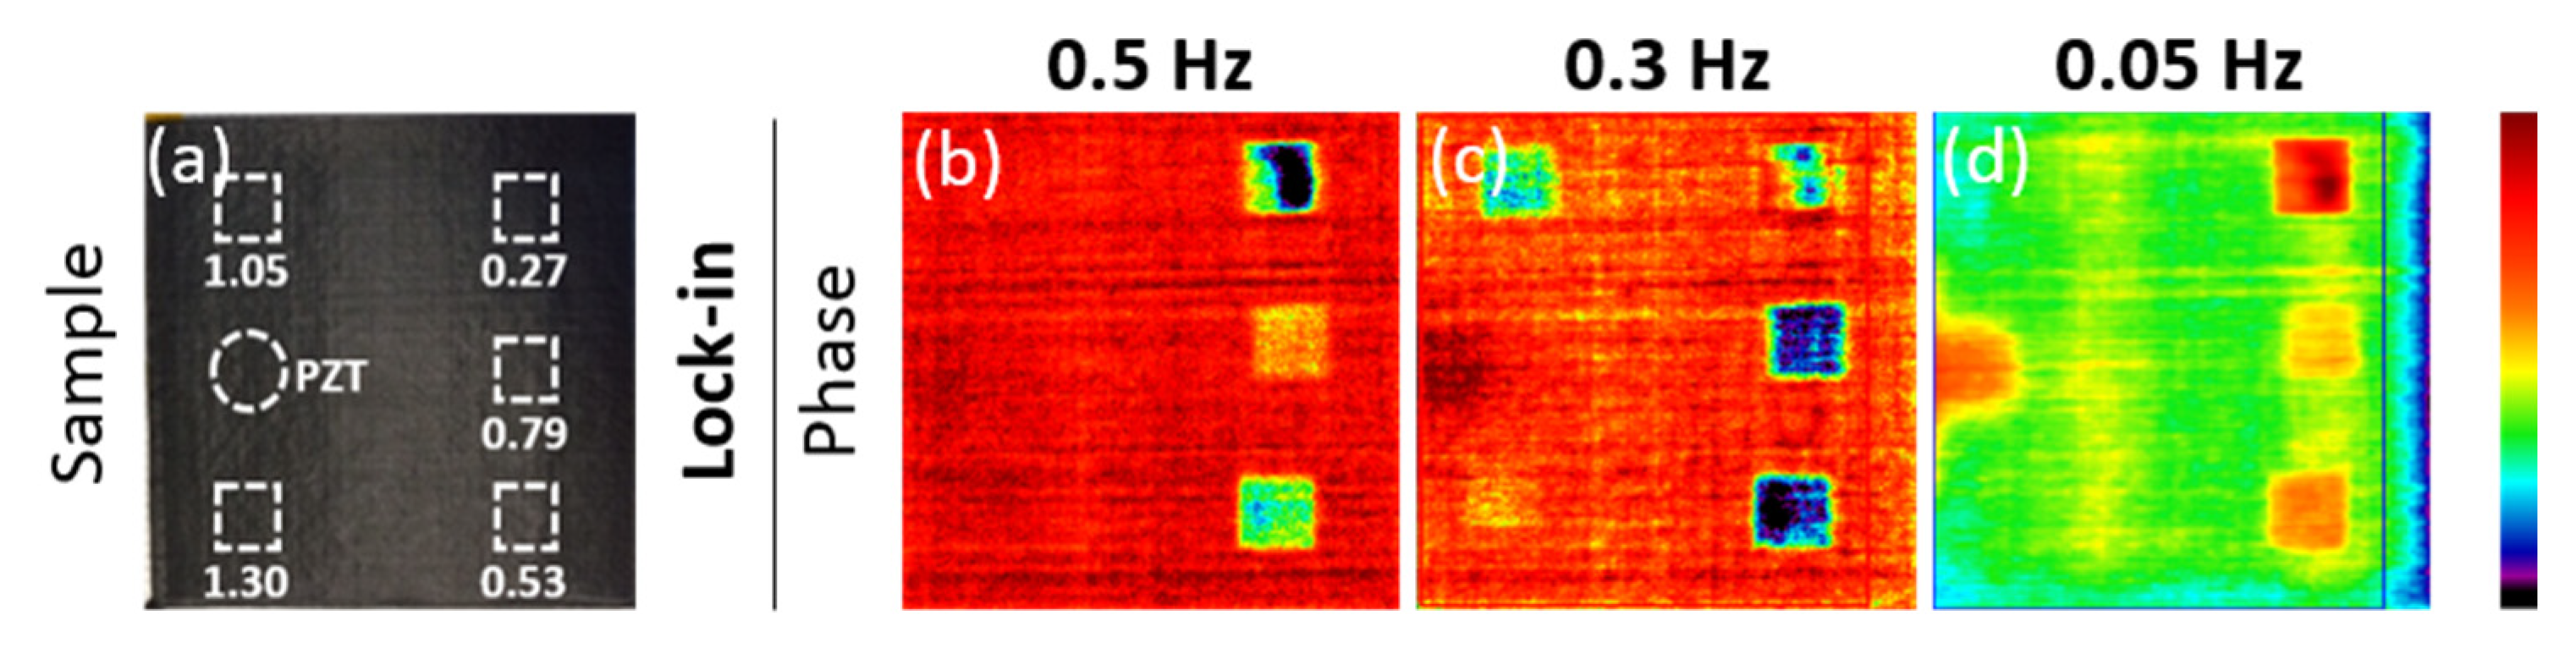
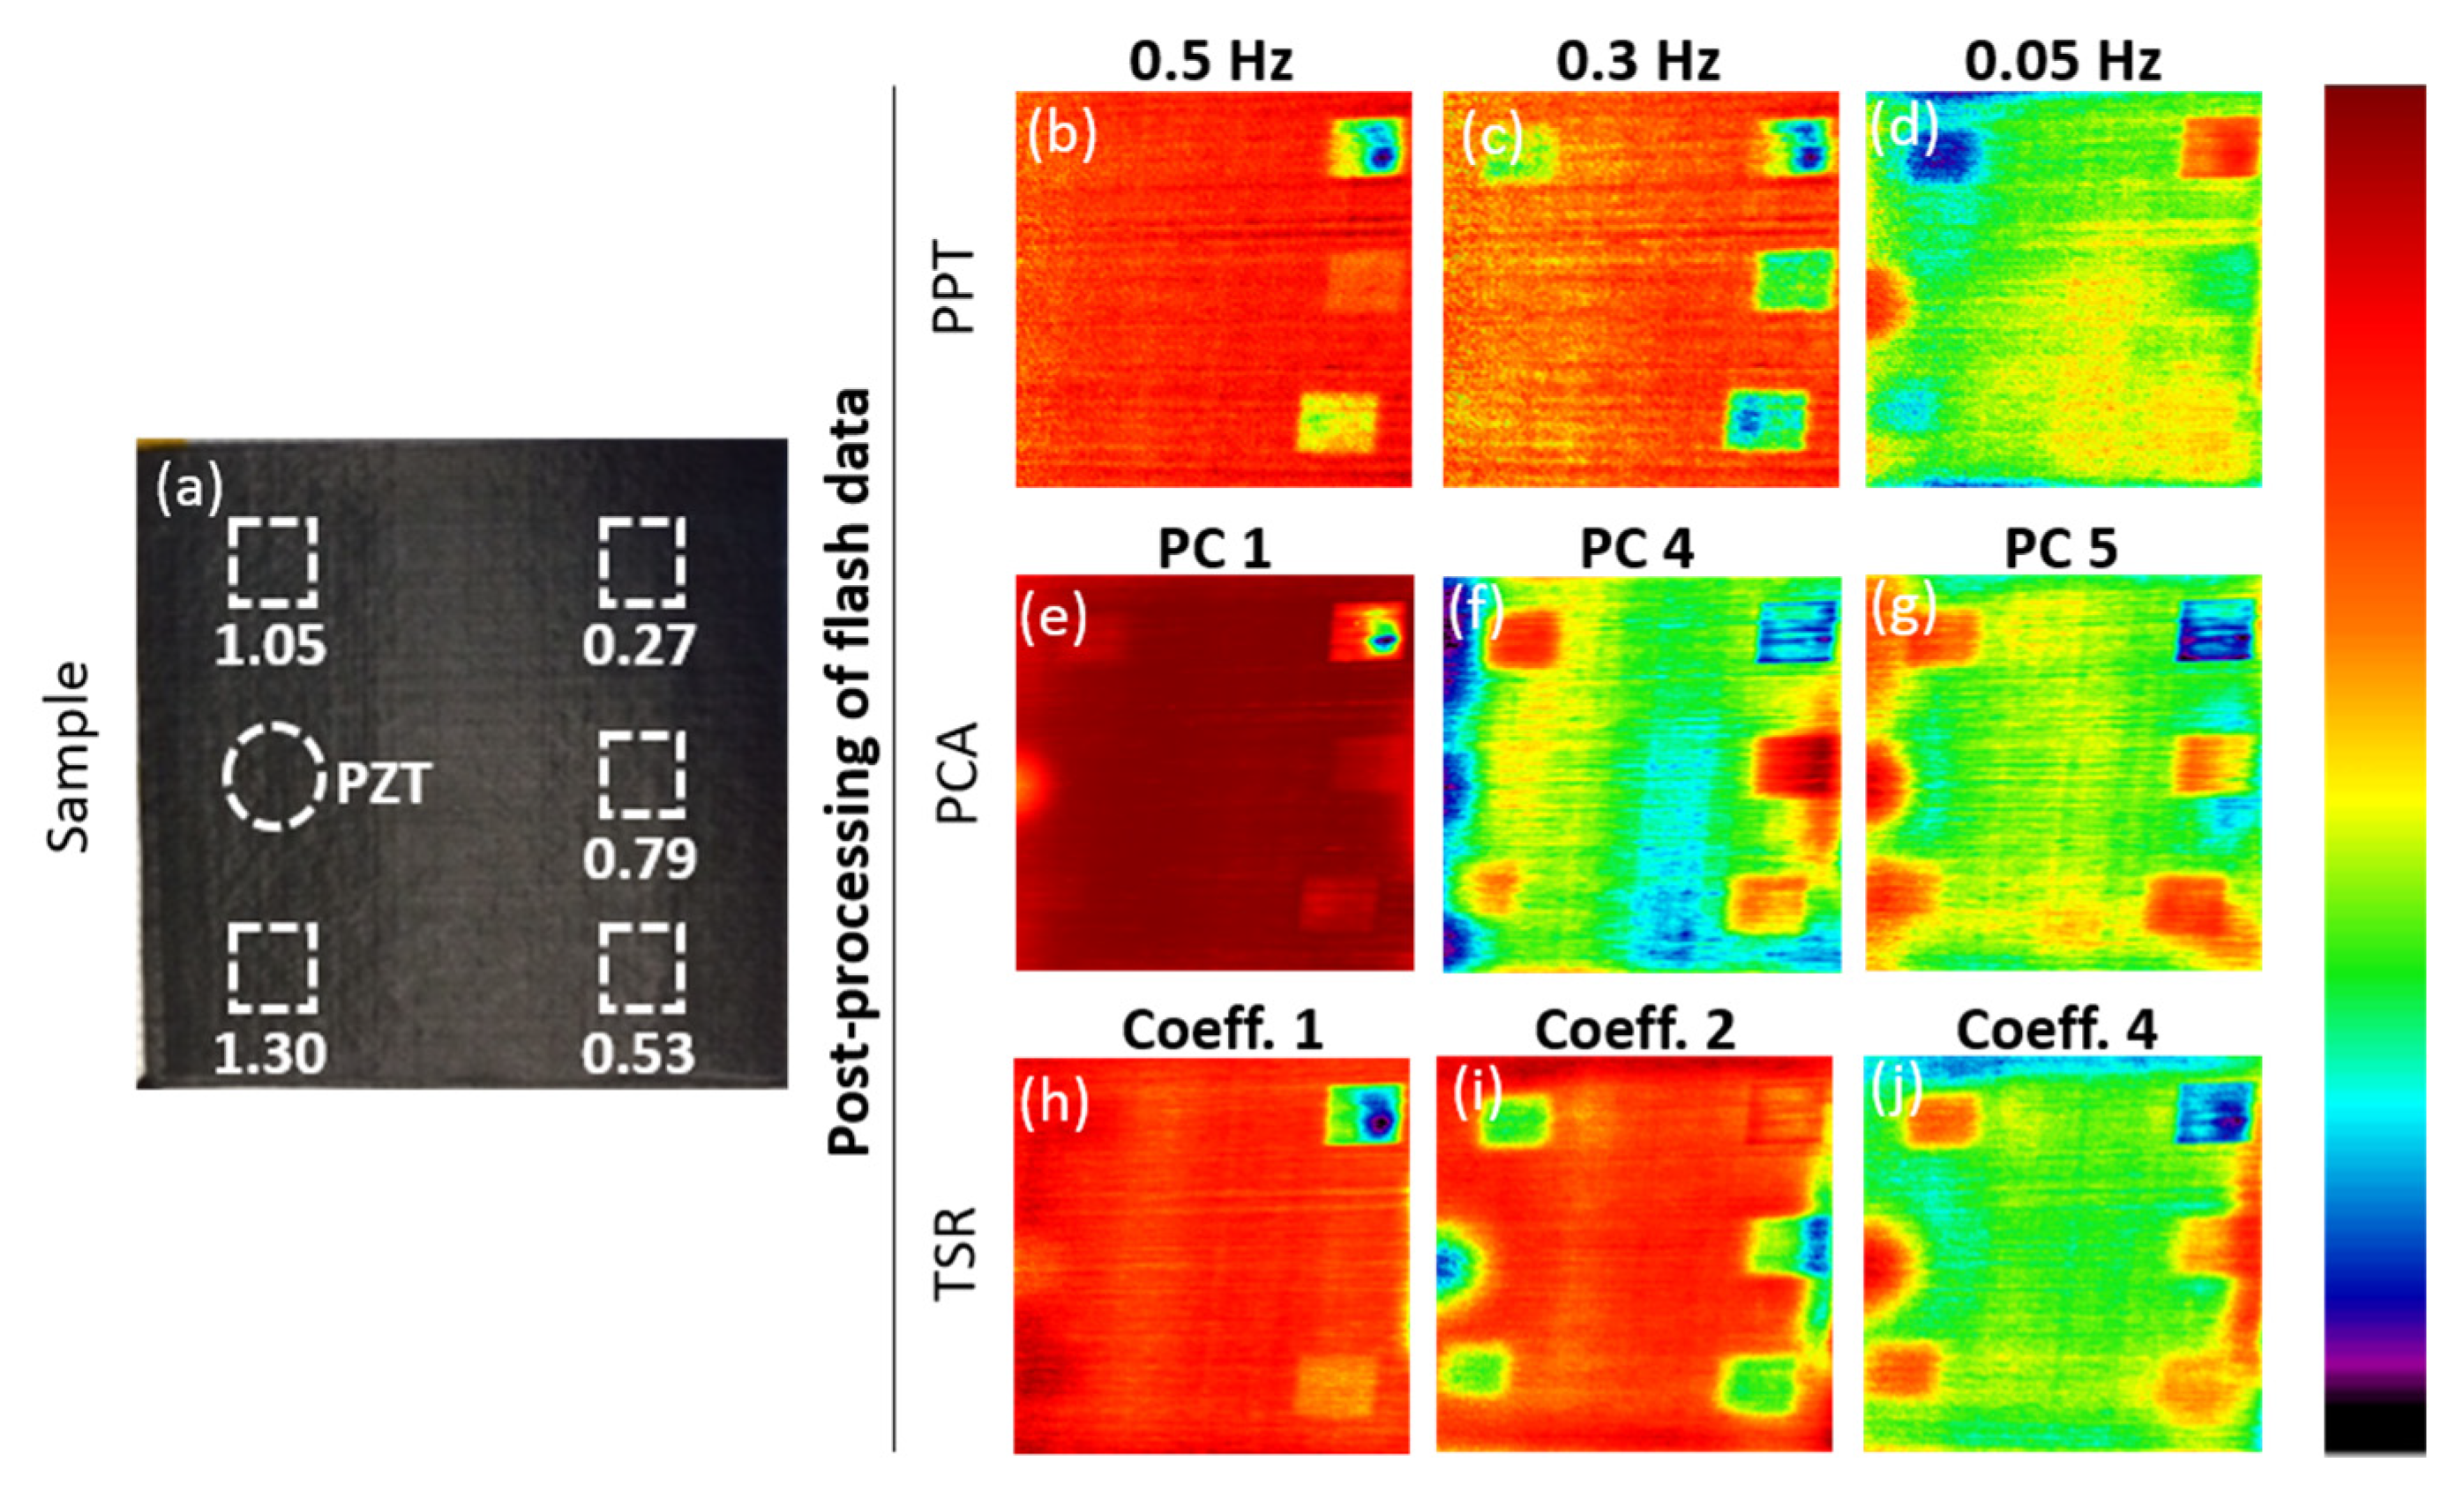
3.2. CFRP Sample with Inserts

The lock-in results (phase images) of three frequencies for the sample with inserts are presented in Figure 4b–d, while an overview of the defect locations and depths is shown in Figure 4a.
As shown in Figure 4b, a distinct phase contrast is observed inside the area corresponding to the top-right defect (i.e., a defect self-contrast), which is most likely linked to the way the inserts have been introduced. They were made by stacking multiple layers of ETFE on top of each other, so it is possible that some local porosities were introduced, leading to this high contrast inside a defected area.
Two of the defects which are visually seen in the phase image of the lock-in experiment at 0.3 Hz (Figure 4c) can no longer be distinguished for the lower excitation frequency of 0.05 Hz (Figure 4d). A possible cause for this could be that 0.05 Hz is close to a blind frequency for these defects, at which there is no phase contrast between defected and non-defected areas [12]. This means that the chosen lock-in frequencies must be adapted accurately with relation to the depths of the defects.
Results of the post-processing of the thermographic data, together with an image of the sample, are presented in Figure 5. The PCs and TSR coefficients are different to those in Figure 3 in order to present additional information. The results of PPT at the lock-in frequencies (0.5 Hz, 0.3 Hz and 0.05 Hz) are displayed in Figure 5c,d. It is remarkable that the PPT image of 0.05 Hz does not match its lock-in counterpart (Figure 4d), while the images for the other frequencies (lock-in and PPT at 0.5 Hz and 0.3 Hz) are comparable. We are currently investigating the origin of these counter-intuitive results. The fifth PC, given in Figure 5g, is the principal component that displays the defects the clearest. Though, the fourth and fifth principal component (Figure 5f–g), present some non-uniformity in the central area, which can be wrongfully interpreted as being a defected area. In the second and fourth TSR coefficients (Figure 5i–j), all five inserts can be readily detected, but there is also a large edge effect at their right side. This is the side where the sample was clamped during the experiments, and thus caused a different cooling rate at this location. This is very pronounced for these TSR images, while other post-processing methods exhibit little to no influence from this. The influence from the clamping is barely visible in the first polynomial coefficient (Figure 5h), which could indicate that localized gradients in the heat diffusion are dominantly captured by the higher order coefficients of TSR. The self-contrast of the top-right defect as evidenced in the lock-in results at 0.5 Hz (Figure 4b) is also prominent in the first PC (Figure 5e) and the first TSR coefficient (Figure 5h).

4. Conclusions

Lock-in and flash thermography experiments were performed for CFRP samples with two types of defects (flat bottom holes and inserts), and the flash results were processed using three popular post-processing techniques, namely PPT, PCA and TSR. The results for all these data processing methods were compared for each sample separately.
Even though lock-in provides better contrast than PPT (at the same frequencies), PPT is more advantageous taking into account that there is no necessity of knowing the defect depths. However, care must be taken since the obtained results from lock-in and PPT are not always similar. We are currently investigating the origin of these observed differences between lock-in and PPT.
PCA and TSR generally provide an improved defect detection capability (over lock-in and PPT), and also lead to a very large data reduction since only a few images need to be stored.
The CFRP sample with FBHs showed that TSR results in the deepest probing into the material, while the sample with inserts proved that TSR was the most successful post-processing method in imaging all inserts (in only one image).

Author Contributions

G.P. designed and performed the experiments under supervision of S.H. and M.K. Data analysis was done by all authors. All authors were furthermore involved in writing down the research results in this paper.

Acknowledgments

The authors acknowledge both the Research Foundation-Flanders (FWO fellowships 12T5418N and 1148018N) and the SBO project DETECT-IV (Grant No. 160455) which fits in the SIM research program MacroModelMat (M3) funded by SIM (Strategic Initiative Materials in Flanders) and VLAIO (Flemish government agency Flanders Innovation & Entrepreneurship).

Conflicts of Interest

The authors declare no conflict of interest. The founding sponsors had no role in the design of the study; in the collection, analyses, or interpretation of data; in the writing of the manuscript, and in the decision to publish the results.

References

  1. Fernandes, H.; Zhang, H.; Maldague, X. An active infrared thermography method for fiber orientation assessment of fiber-reinforced composite materials. Infrared Phys. Technol. 2015, 72, 286–292. [Google Scholar] [CrossRef]
  2. Beemer, M.F.; Sherpard, S.M. Aspect Ratio Considerations for Flat Bottom Hole Defects in Active Thermography. In Proceedings of the 13th Quantitative Infrared Thermography Conference (QIRT), Gdansk, Poland, 4–8 July 2016; pp. 95–100. [Google Scholar]
  3. López, F.; Ibarra-Castanedo, C.; Nicolau, V.P.; Maldague, X. Comparative Study of Thermographic Signal Reconstruction and Partial Least Squares Thermography for Detection and Evaluation of Subsurface Defects. In Proceedings of the 12th International Conference on Quantitative Infrared Thermography, Bordeaux, France, 7–11 July 2014. [Google Scholar]
  4. Rajic, N. Principal Component Thermography for Flaw Contrast Enhancement and Flaw Depth Characterisation in Composite Structures. Compos. Struct. 2002, 58, 521–528. [Google Scholar] [CrossRef]
  5. Maierhofer, C.; Myrach, P.; Reischel, M.; Steinfurth, H.; Röllig, M.; Kunert, M. Characterizing damage in CFRP structures using flash thermography in reflection and transmission configurations. Compos. Part B Eng. 2014, 57, 35–46. [Google Scholar] [CrossRef]
  6. Boccardi, S.; Carlomagno, G.M.; Meola, C.; Simeoli, G.; Acierno, D.; Iannace, S.; Sorrentino, L.; Russo, P. Lock-In Thermography for Investigation of Impact Damage in Hybrid Polypropylene/Glass Composites. IEEE A E Syst. Mag. 2016, 31, 26–30. [Google Scholar] [CrossRef]
  7. Usamentiaga, R.; Ibarra-Castanedo, C.; Klein, M.; Maldague, X.; Peeters, J.; Sanchez-Beato, A. Nondestructive Evaluation of Carbon Fiber Bicycle Frames Using Infrared Thermography. Sensors 2017, 17, 2679. [Google Scholar] [CrossRef] [PubMed]
  8. Joven, R.; Das, R.; Ahmed, A.; Roozbehjavan, P.; Minaie, B. Thermal Properties of Carbon Fiber-Epoxy Composites with Different Fabric Weaves; SAMPE: Charleston, SC, USA, 2012. [Google Scholar]
  9. Maldague, X.; Marinetti, S. Pulse Phase Infrared Thermography. J. Appl. Phys. 1996, 79, 2694–2698. [Google Scholar] [CrossRef]
  10. Shepard, S.M. Temporal Noise Reduction, Compression and Analysis of Thermographic Data Sequences; Thermal Wave Imaging, Inc.: Ferndale, MI, USA, 2003. [Google Scholar]
  11. Zheng, K.; Chang, Y.-S.; Yao, Y. Defect detection in CFRP structures using pulsed thermographic data enhanced by penalized least squares methods. Compos. Part B Eng. 2015, 79, 351–358. [Google Scholar] [CrossRef]
  12. Ibarra-Castanedo, C.; Maldague, X. Pulsed phase thermography reviewed. Quant. InfraRed Thermogr. J. 2004, 1, 47–70. [Google Scholar] [CrossRef]
Figure 1. Schematic of the thermographic set-up, and indication of the different hardware modules.
Proceedings 02 00457 g001
Figure 2. (a) CFRP sample with FBH’s (with defect depths indicated (in mm)), lock-in results: (bd) amplitude images at 0.5, 0.1 and 0.05 Hz, (eg) phase images at 0.5, 0.1 and 0.05 Hz.
Proceedings 02 00457 g002
Figure 3. (a) CFRP sample with FBH’s (with defect depths indicated (in mm)), PPT images at: (bd) 0.5, 0.1 and 0.05 Hz, PCA images: (eg) 1st, 2nd and 5th PC, TSR polynomial coefficients for an interpolation order of 5: (hj) 2nd, 3rd and 5th coefficient.
Proceedings 02 00457 g003
Figure 4. (a) CFRP sample with inserts (with defect depths indicated (in mm)), phase images from lock-in at: (bd) 0.5, 0.3 and 0.05 Hz.
Proceedings 02 00457 g004
Figure 5. (a) CFRP sample with inserts (with defect depths indicated (in mm)), PPT images at: (bd) 0.5, 0.3 Hz and 0.05 Hz, PCA images: (eg) 1st, 4th and 5th PC, TSR polynomial coefficients for an interpolation order of 5: (hj) 1st, 2nd and 4th coefficient.
Proceedings 02 00457 g005
Table 1. Overview of sample specifications.
Sample 1Sample 2
Defect typeFBHInsert
Dimensions [mm3]150 × 90 × 5.5150 × 150 × 2.6
Layup[−45/0/45/90]3s[(0/90)2/0]s
Number of defects55
Size of defectsØ 10 mm 20 × 20 × 0.06 mm3
Publisher’s Note: MDPI stays neutral with regard to jurisdictional claims in published maps and institutional affiliations.

