Proceeding Paper

Near Wake Analysis of a Two-Man Bobsleigh Scaled Model †

Department of Aerospace Engineering, Delft University of Technology, 2629 HS Delft, The Netherlands
*
Author to whom correspondence should be addressed.
Presented at the 12th conference of the International Sports Engineering Association, Brisbane, Queensland, Australia, 26–29 March 2018.
Proceedings 2018, 2(6), 319; https://doi.org/10.3390/proceedings2060319
Published: 13 February 2018

Abstract

:
The flow field in the near wake of a 1:5.5 bobsleigh model was investigated by means of stereoscopic particle image velocimetry. The time-averaged flow field revealed two counter-rotating vortices and a strong downwash between them. From the velocity field, the aerodynamic drag was retrieved invoking the conservation of momentum. This approach enabled relating the aerodynamic loads with the flow structures responsible of the loads. Measurements were repeated with different front-cowling rotations between 0° and 20°. It was found that small nose rotations allowed a drag reduction by approximately 5%, whereas for nose rotations exceeding 10° the drag coefficient remained approximately constant.

1. Introduction

Bobsleigh is one of the most popular winter Olympic sports, which has gained large attention in the field of speed sports owing to the nature of its close and exciting finishes. The sport has become so competitive that a typical race is decided by fractions of seconds. Such small time margins have led to extensive research on superior aerodynamic designs, which aim at providing a competitive advantage by minimization of the aerodynamic drag. Due to the high speeds (up to 150 km/h) and bluff body shape, bobsleighs are subject to large air resistance (roughly 25% of the total resistance [1]), which has a great impact on the sport performance. The drag force is largely due to pressure drag (about 80%), whereas skin friction drag yields a much lower contribution (about 20%, [1,2,3]).
In the past, several techniques have been widely used in order to quantify and minimize the aerodynamic drag. Extensive CFD simulations have been performed to examine the flow and the aerodynamic forces acting on the bobsleigh. CFD analysis conducted on the flow inside the bobsleigh has revealed that circulation in the nose increases with the nose rotation angle [4]. Previous investigations carried out by Winkler et al. [5] showed that the aerodynamic drag is significantly affected by the crew position and posture. Numerical simulations have been carried out by Dabnichki et al. [6,7] to optimize the crew position and posture in order to minimize drag. It has been found that the optimal inclination of the brakeman with respect to the sleigh is around 55° for minimum drag. In case of CFD simulations, the accuracy of the quantification is often questionable as the flow around the bobsleigh is fully three-dimensional and turbulent, and the aerodynamic drag is strongly dependent on the separation of the flow from the bobsleigh and crew surface. Alternatively, the drag can be measured directly using force balance systems in a wind tunnel. Force measurements have been performed with a six component balance to quantify the drag force on a scaled bobsleigh model, also at different angles of rotation of the front-cowling, which is a typical condition encountered in curved paths [8,9]. The measurements revealed that the drag initially decreases from 0° to 10° and then increases from 10° to 20°. Although balance measurements can be very accurate, they do not reveal the flow structures that are responsible for the generation of the drag. Several flow visualization techniques have been used to gather qualitative information about the flow patterns. Oil flow visualization was used to visualize the surface flow of the bobsleigh, whereas woolen tufts were introduced into the flow to detect the formation of vortices [9]. Particle Image Velocimetry (PIV) enables the quantitative flow visualization in measurement planes around the wind tunnel model [10]. Planar PIV measurements have been performed on a bobsleigh model to investigate the boundary layer characteristics for varying nose rotations [8]. The flow around the rotated nose has also been investigated along horizontal PIV planes; it has been found that a separation bubble is formed just behind the nose, after which the flow reattaches again on the rear cowling. This separation bubble grows and the reattachment point shifts further downstream with increasing angle of nose rotation. However, the effect of the nose rotation on the wake flow of the bobsleigh model was not investigated.
From the discussion above, it emerges that a thorough investigation of the near wake topology of the bobsleigh, which also considers the effect of rotation of the front cowling, is currently missing. This information is crucial to achieve a thorough understanding of the sources of aerodynamic drag in a two-man bobsleigh.

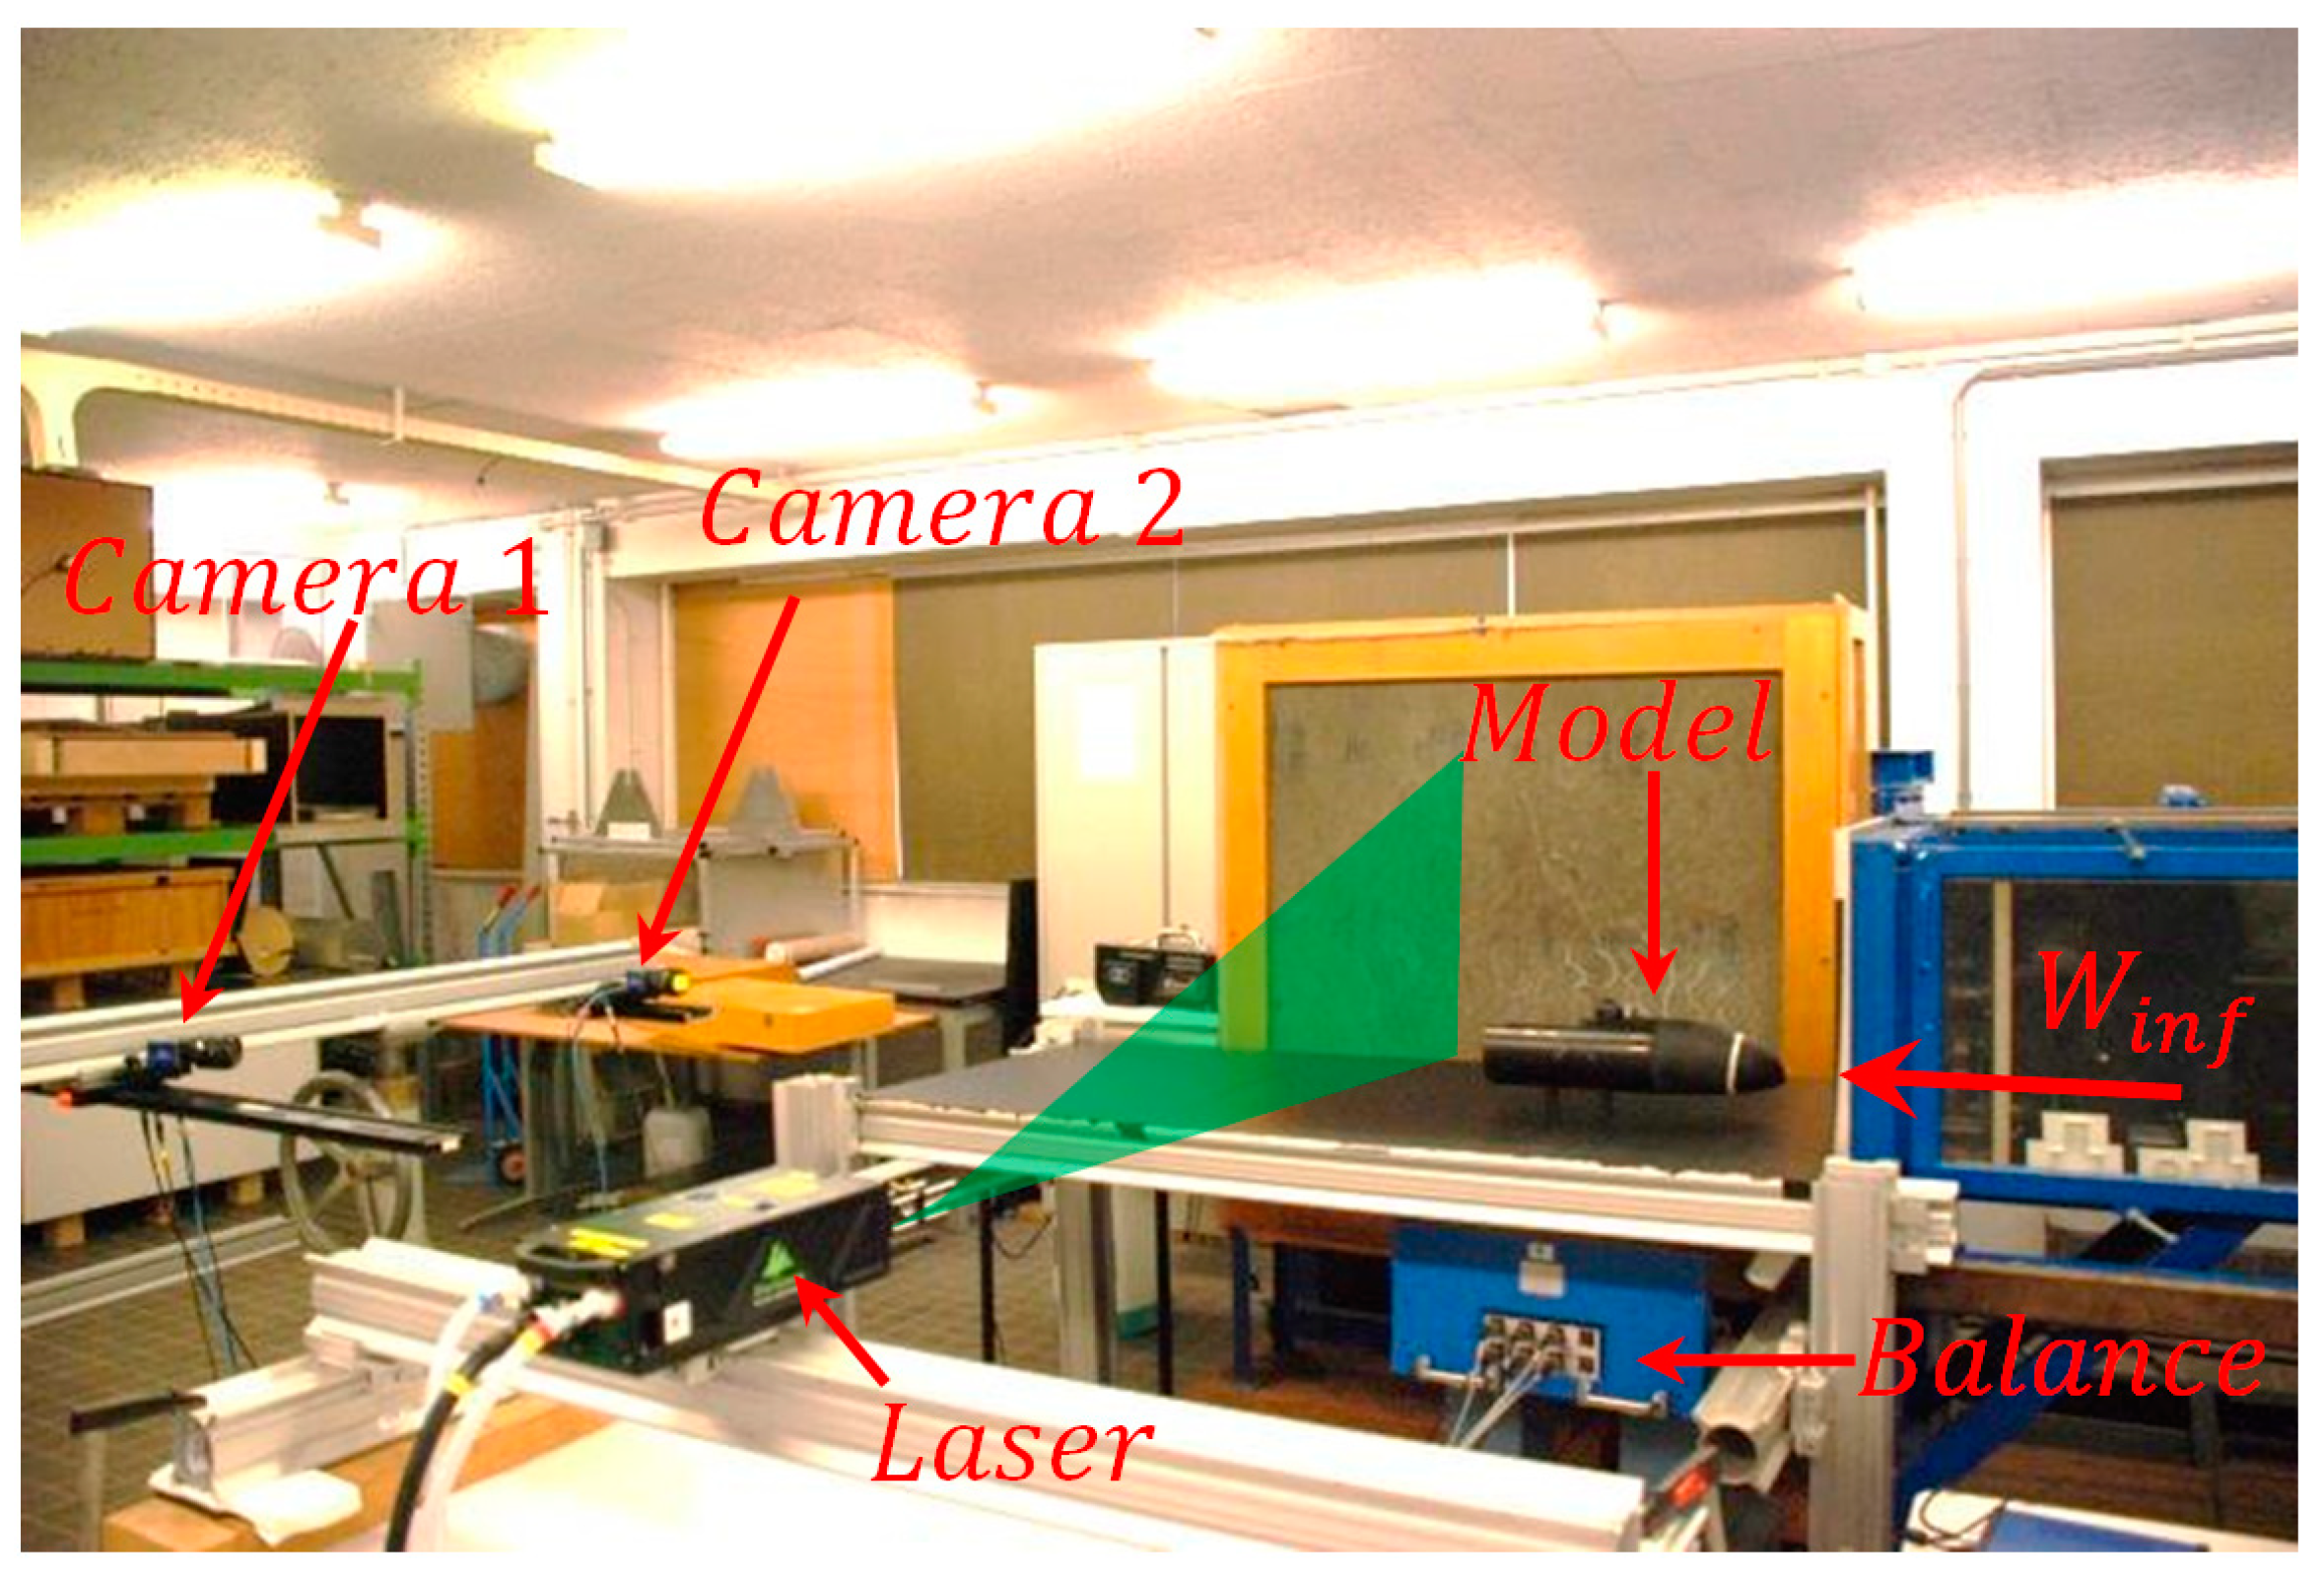
2. Experimental Setup

Wind tunnel experiments are performed in the M-tunnel of the Aerodynamic Laboratories of Delft University of Technology. This is an open-jet wind tunnel with a cross section of 0.4 × 0.4 m2 which operates in the speed range of 2 to 30 m/s. The measurements are conducted on a simplified 1:5.5 scaled model which has a 3D-printed front cowling, whereas the rear-cowling is made of PVC. The model has a length of 485 mm and a circular cross section of 125 mm diameter. Zig-zag strips of 0.5 mm height are applied onto the front cowling at 60 mm from the leading edge to ensure the turbulent regime of the boundary layer.
The bobsleigh model is placed on a ground plate at a distance of 100 mm from the test section exit. The freestream velocity is Winf = 20 m/s, yielding a Reynolds number of 1.7 × 10⁵ based on the bobsleigh diameter. The flow is seeded with micron-sized droplets from a SAFEX smoke generator. Illumination is provided by a Quantel Evergreen 200 Nd:YAG laser on a vertical plane behind the model. Images are captured by two 2Mpix Imperx Bobcat IGV-B1610 cameras (CCD, 1628 × 1236 pixels, 4.4 μm pixel pitch, 10 bit) in stereoscopic configuration. The cameras are placed in the wake of the model, one facing the flow straight and the other one at an angle of nearly 35°. The cameras mount Nikon objectives of focal length 35 mm and 50 mm, respectively; the lens apertures are set to f# = 4 and 5.6, respectively. A picture of the experimental setup is shown in Figure 1.
The field of view is 32 × 24 cm2, yielding a magnification factor of 0.022 and a digital image resolution of 0.20 mm/pixel. For all the bobsleigh configurations, 500 samples are acquired at acquisition frequency of 8.3 Hz. Measurements are performed at different planes in the wake of the model, namely z/D = 1 and 2, z being the streamwise distance from the back of bobsleigh and D the diameter of the bobsleigh. The front cowling is rotated by angles between 0° and 20° in order to investigate the effect of the front cowling misalignment on the aerodynamic drag. Image acquisition and data analysis are conducted with the LaVision DaVis 8 software. Velocity fields are evaluated using a multi-pass stereoscopic cross-correlation algorithm with final interrogation window of 64 × 64 pixels and 75% overlap factor; the vector pitch is about 3 mm. From the velocity fields, the time averaged pressure fields are reconstructed solving the Poisson equation for pressure and the aerodynamic drag is evaluated invoking the conservation of momentum in a control volume [11].
Additionally, force measurements are conducted with a 6-component balance system able to measure three force components (Fx, Fy, Fz) and three moment components (Mx, My, Mz). The balance is capable of measuring loads up to 250 N in the streamwise direction with a maximum uncertainty of 0.06% [12]. Measurements are conducted at frequency of 1612 Hz for a time interval of 9.5 seconds.

3. Results

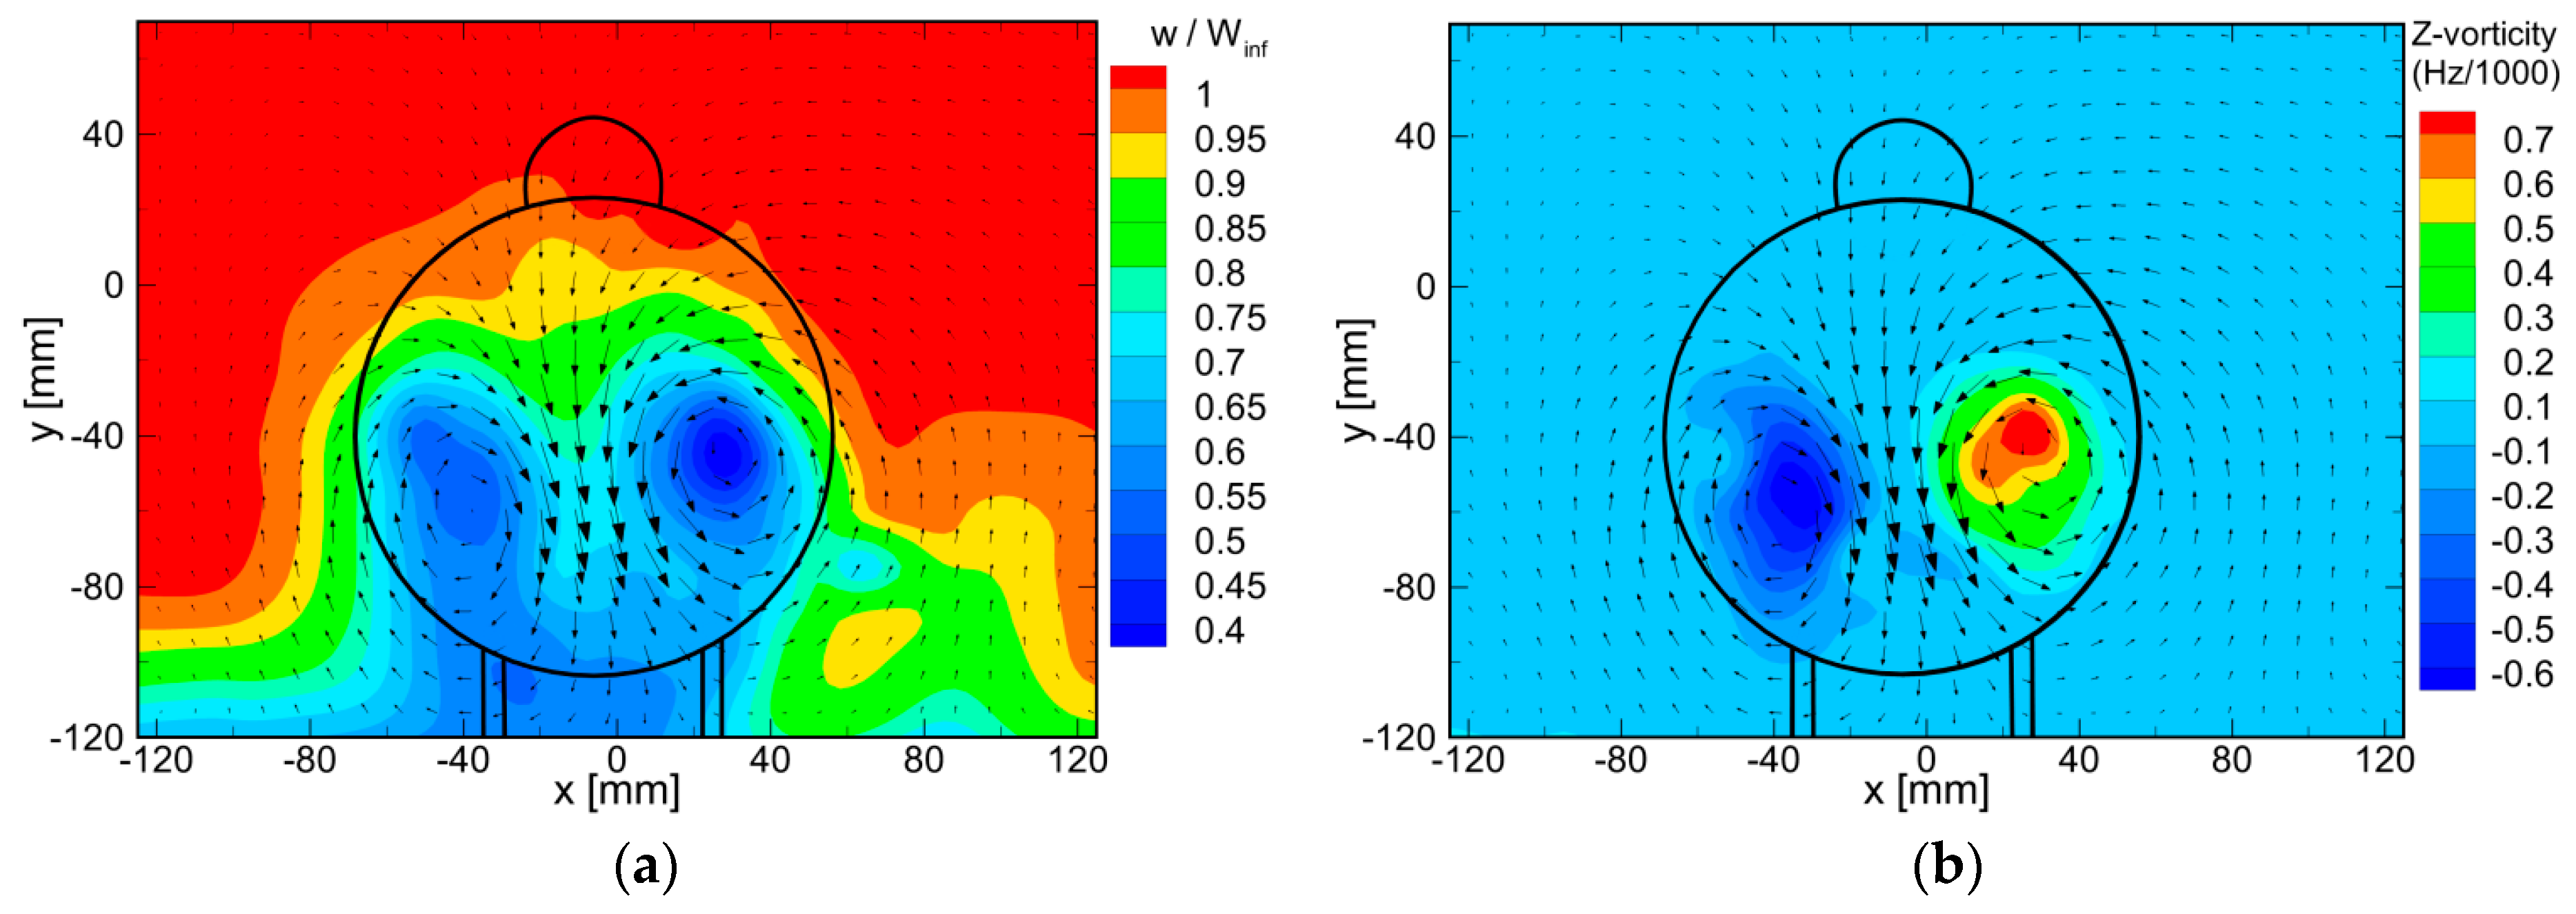
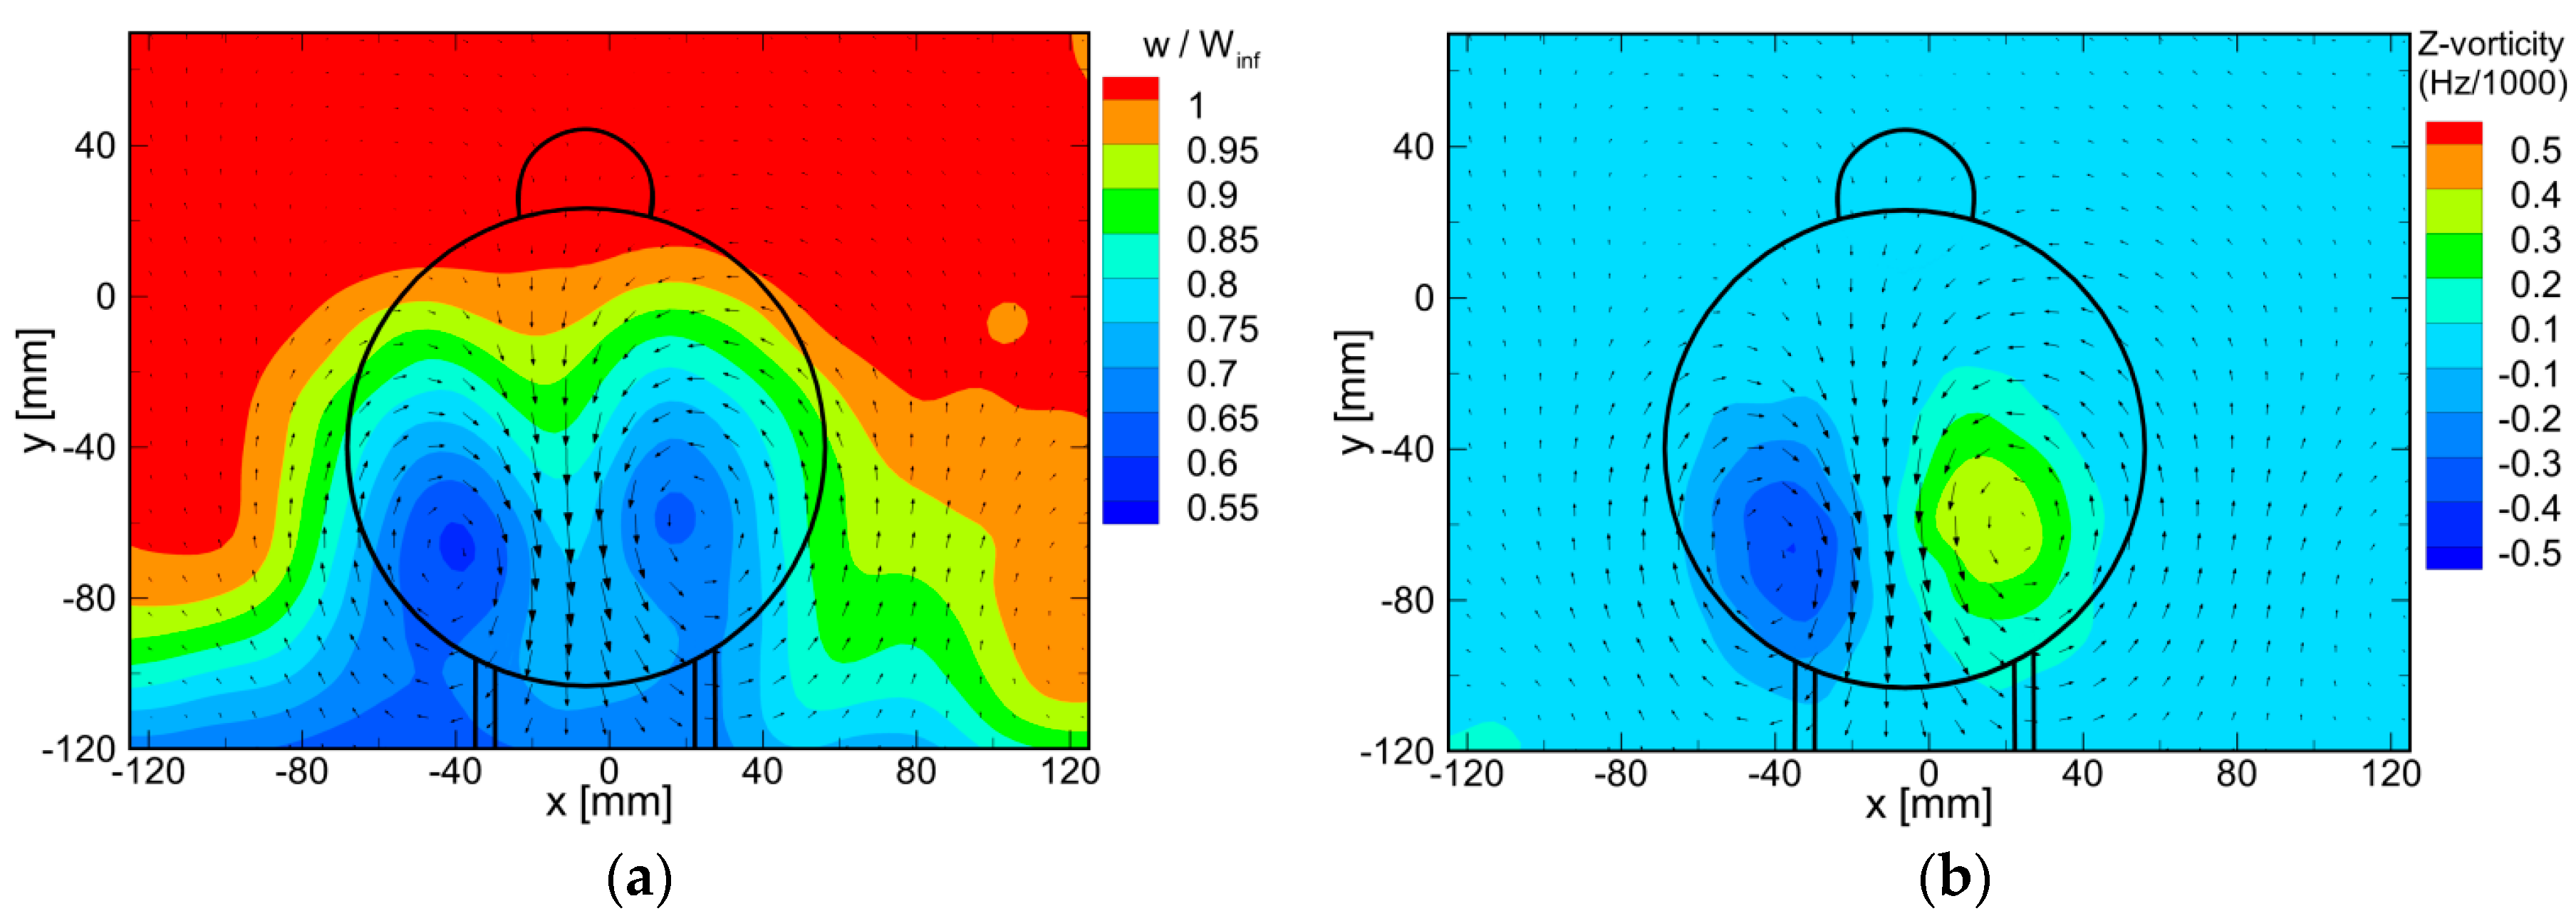
3.1. Near-Wake Flow Topology

The near wake of the bobsleigh model at z/D = 1 shows a large momentum deficit downstream of the model and the formation of two counter-rotating vortices. The latter are due to the rotation of the flow from the sides of the bobsleigh surface towards the inside of the rear cowling. Between the two vortices, a clear downwash is visible at the plane of symmetry of the model (Figure 2a). The two vortices are symmetrical with respect to the symmetry plane and have approximately the same intensity (Figure 2b).
Further downstream (z/D = 2, Figure 3), the two vortices are still visible and maintain their symmetry with respect to the symmetry plane of the model. However, the peak vorticity reduces by about 30% with respect to the z/D = 1 plane. Due to the turbulent diffusion of the flow structures, the wake becomes broader and higher streamwise velocities in the wake are encountered.

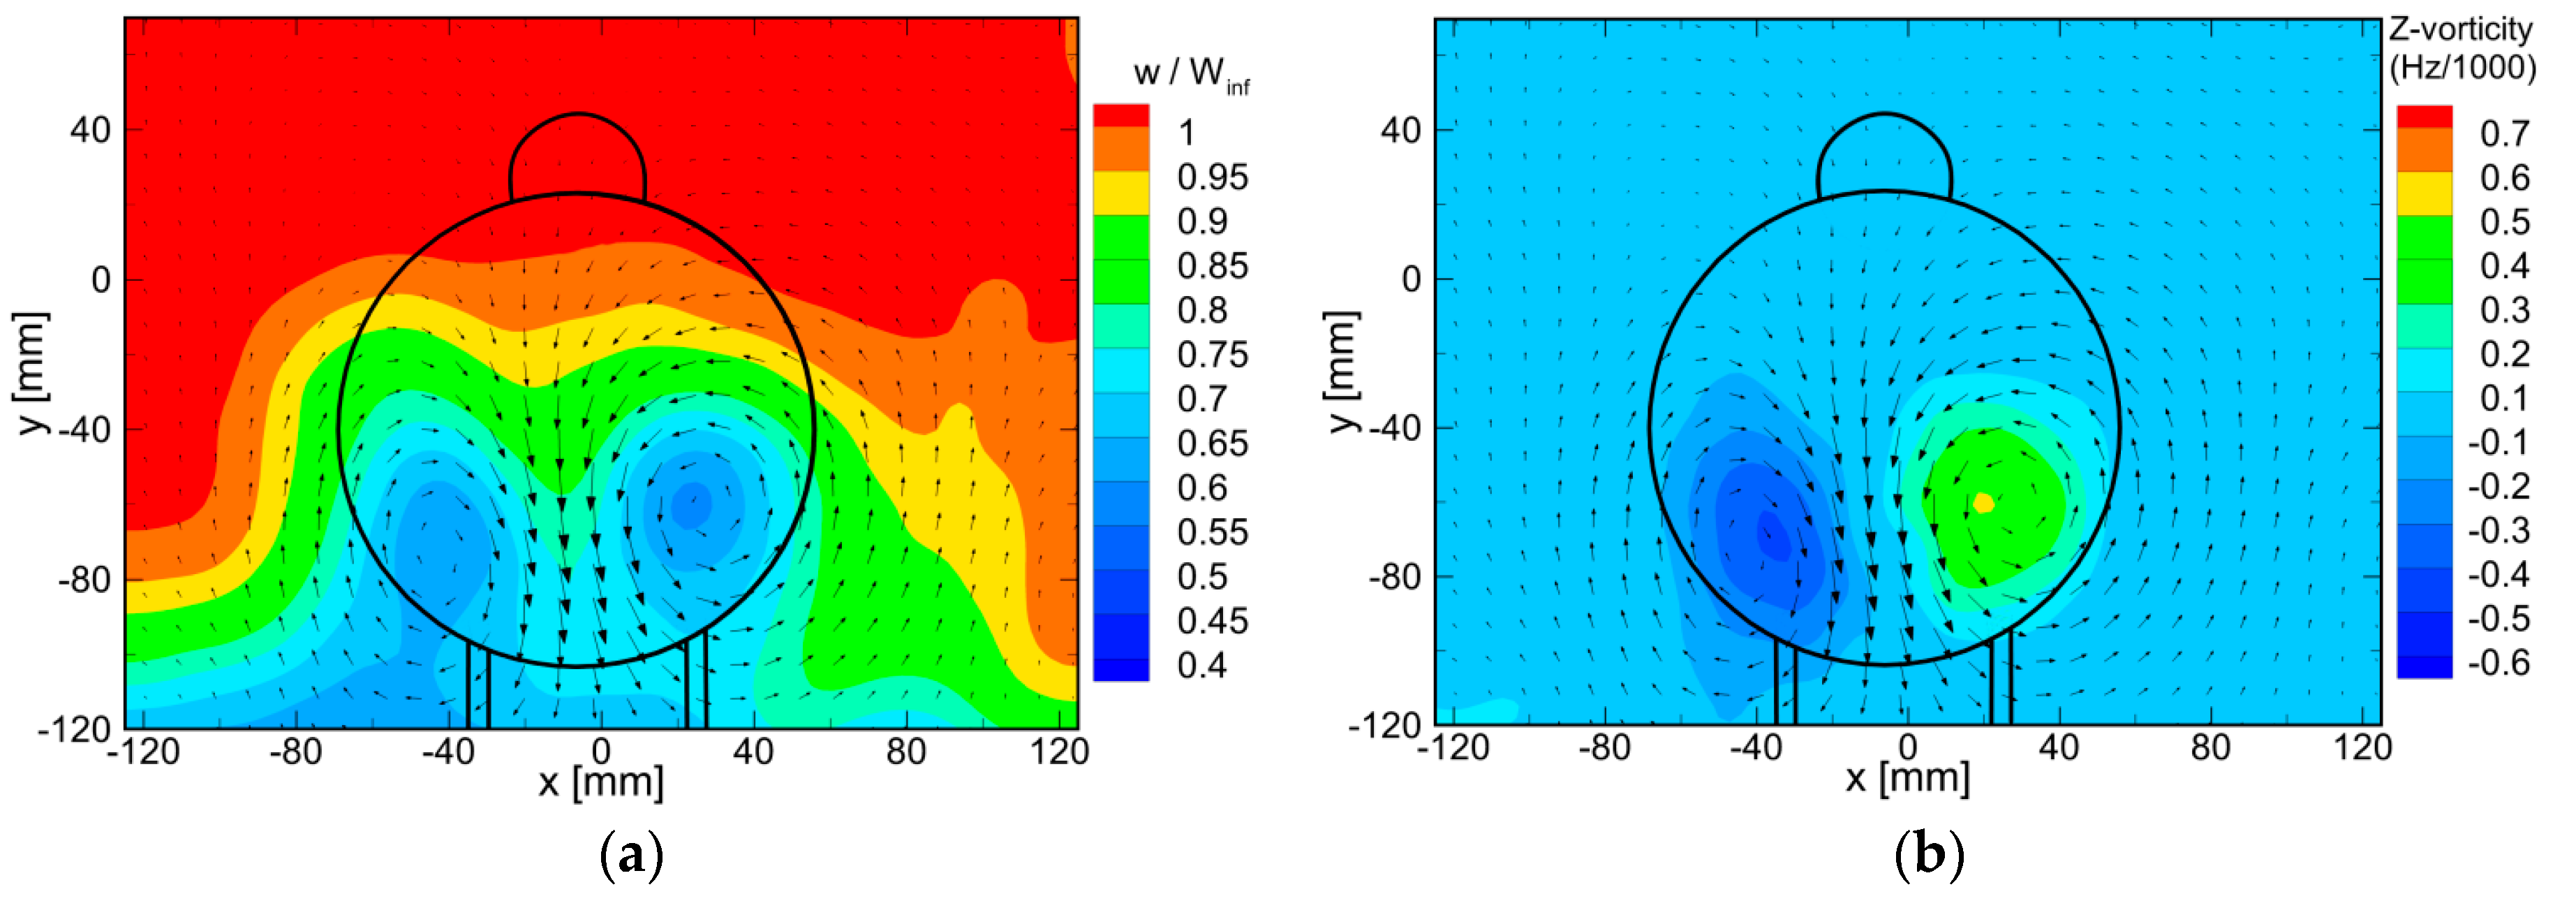
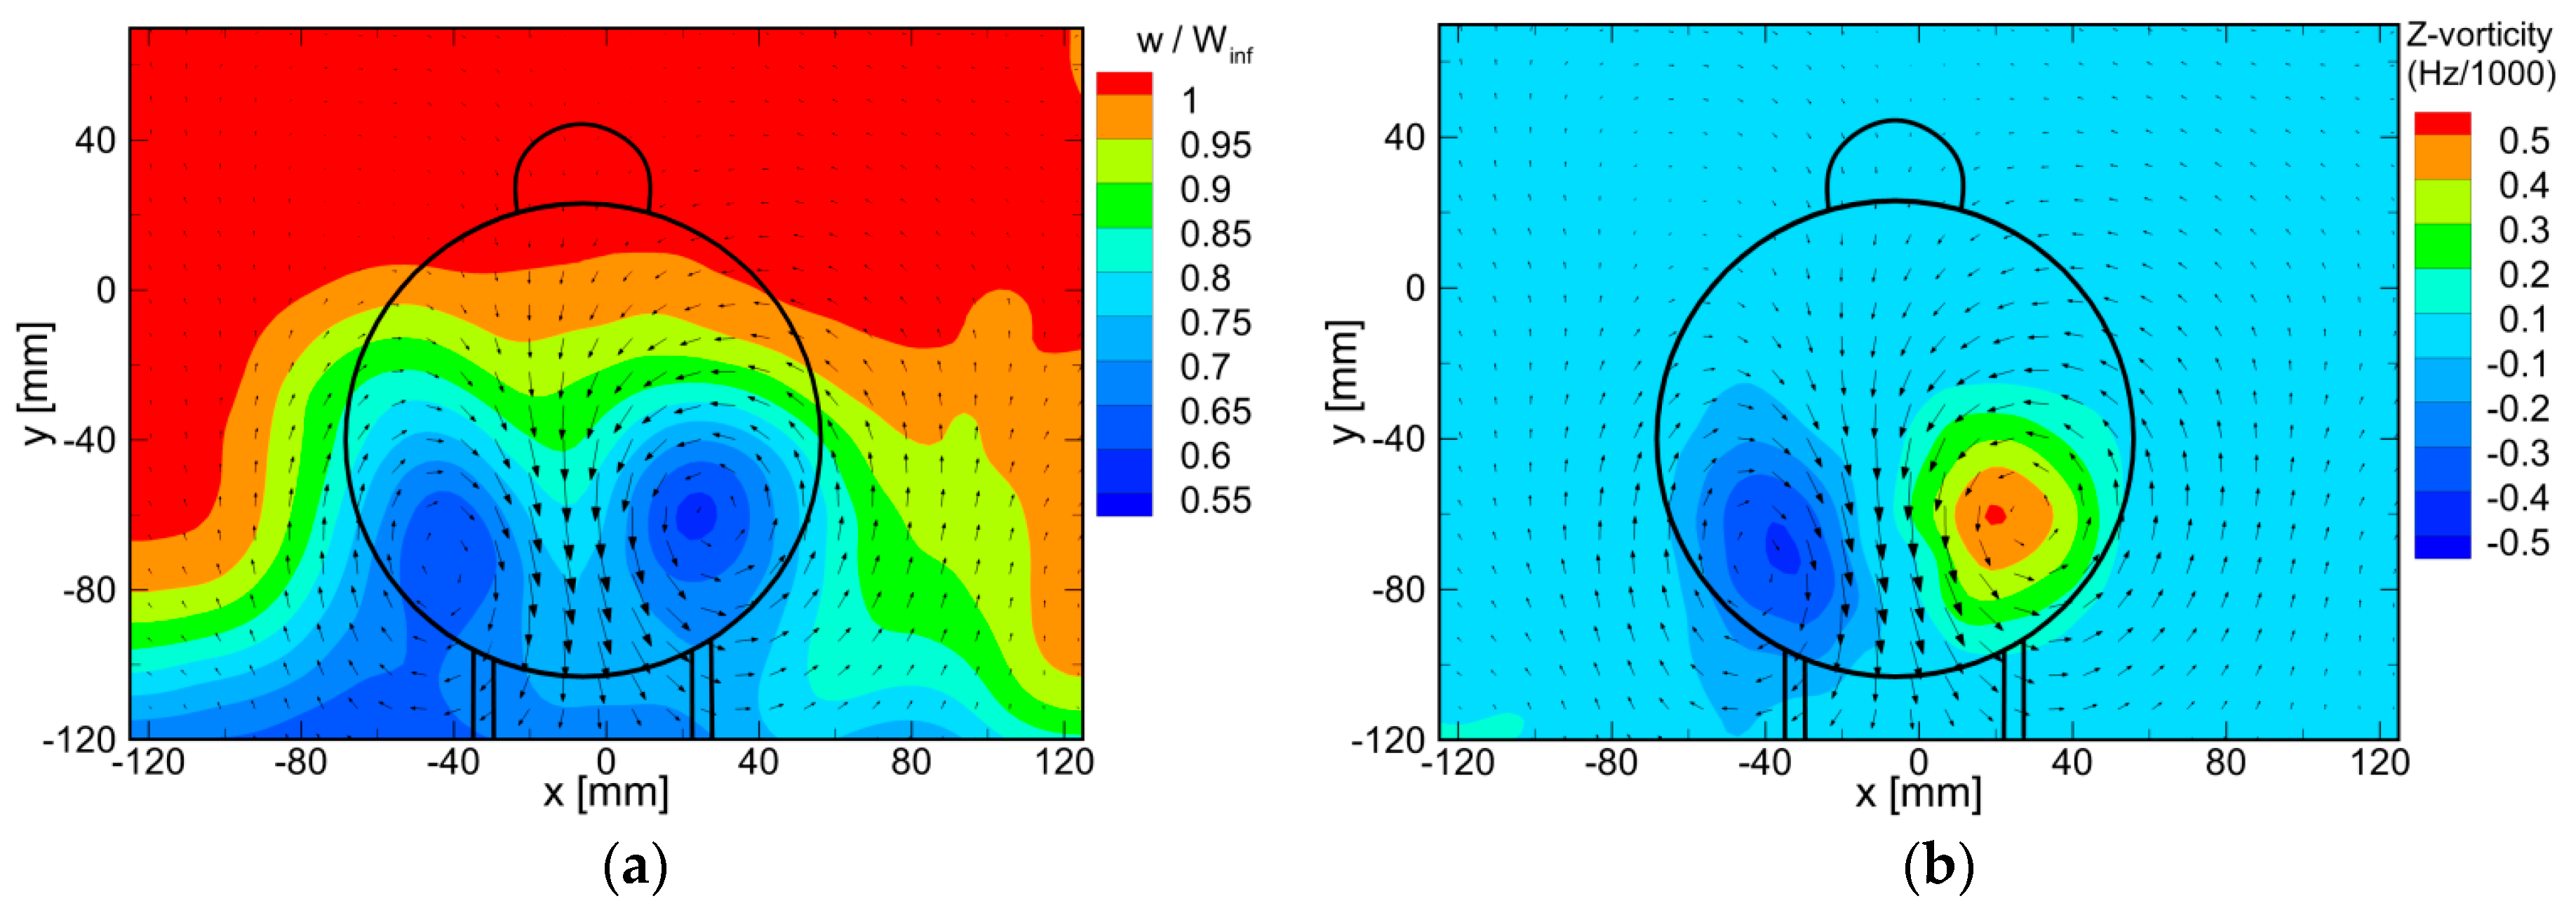
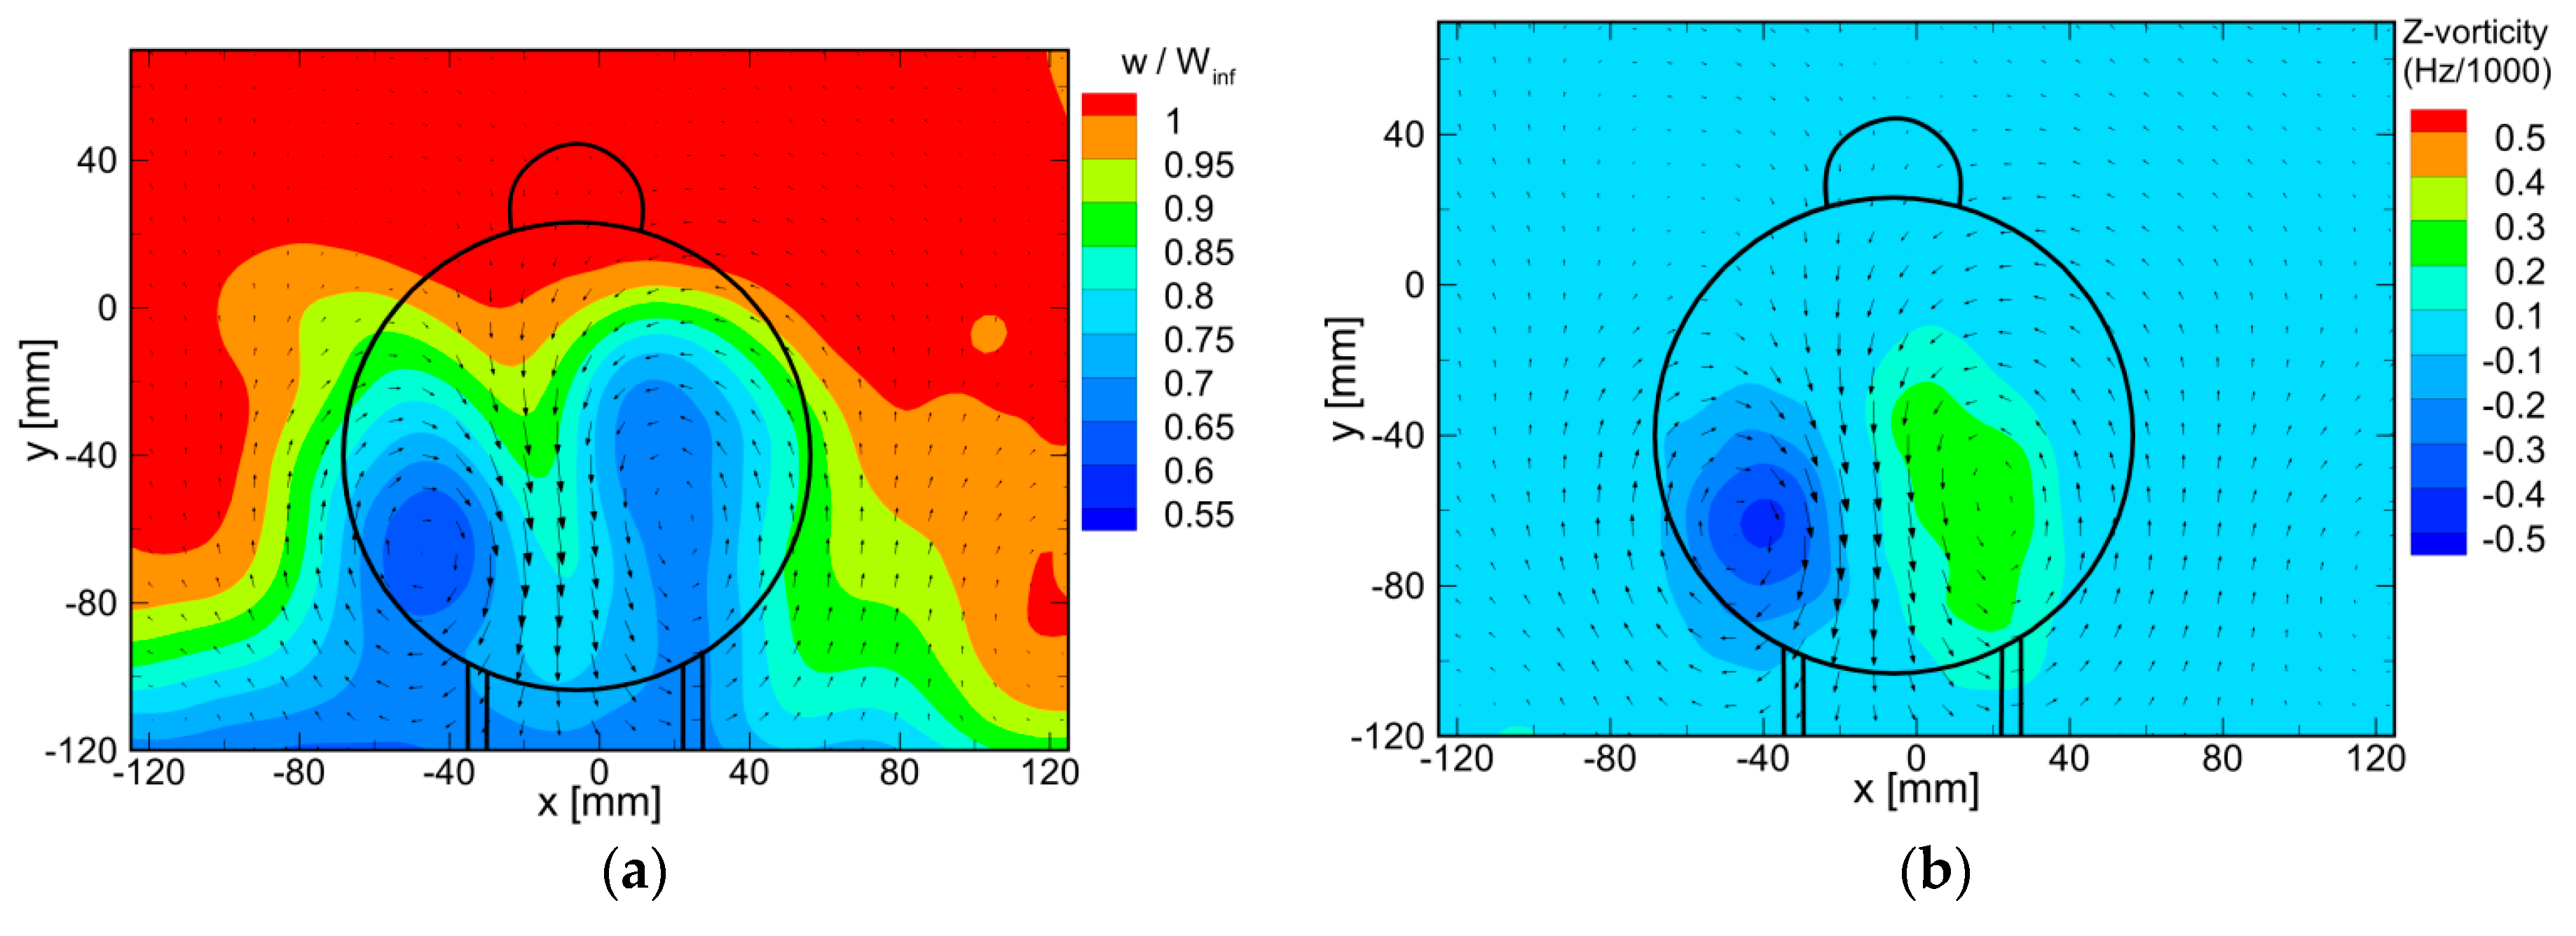
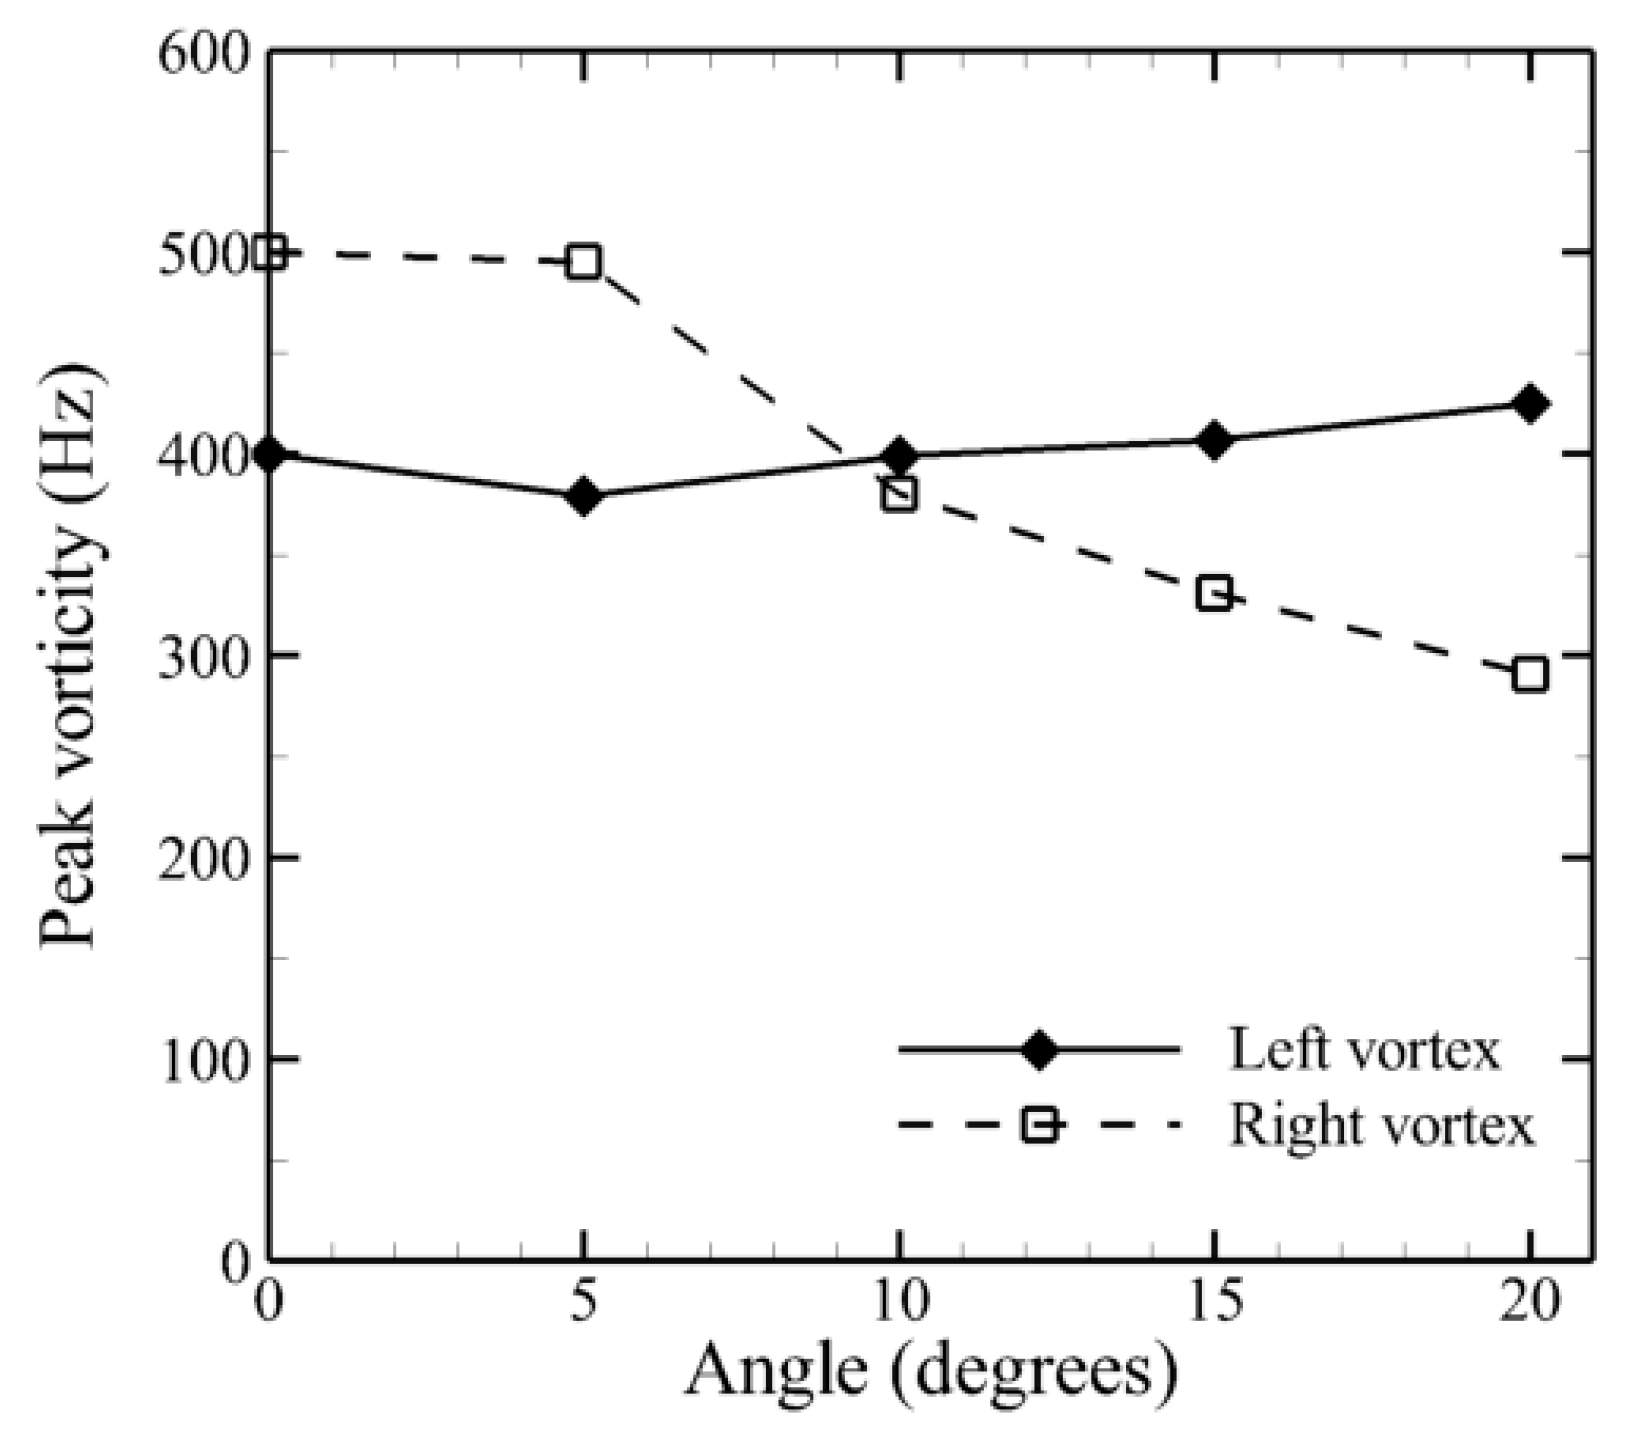
3.2. Mean Flow Topology at Different Nose Rotation Angles

The mean flow topology in the near wake of the bobsleigh is investigated for different front-cowling rotation angles. The front-cowling is rotated towards the left of the model from 0° to 20° with steps of 5°. The time-averaged velocity contours in Figure 4a, Figure 5a and Figure 6a suggest that as the angle of rotation increases, the momentum deficit initially reduces (the wake shrinks, mainly from the right side), and then slightly increases (the wake enlarges on the top-right).
At small rotation angles, when the increase in frontal area is not significant, the area uncovered by the front cowling increases and more fluid passes through to the wake without any blockage from the crew model. Hence the momentum deficit decreases. As the nose is rotated to higher angles, the increase in frontal area dominates over the increase in area uncovered by the nose rotation (also because of the additional blockage by the crew model). As a result, the momentum deficit increases marginally. From the vorticity contours in Figure 4b, Figure 5b and Figure 6b, it is observed that the strength of the left vortex does not change significantly with the increase in angle of misalignment of the front cowling. As the nose is rotated to the left, the flow at the left side of the bobsleigh separates from the front-cowling and reattaches onto the rear-cowling. However, due to the length of the rear-cowling (approximately 2.25 D), the flow after reattachment recovers to a condition similar to that in absence of flow separation. Hence, close to the model’s trailing edge, the flow on the left side of the bobsleigh is only marginally affected by the front-cowling rotation. This explains why the left vortex shows only minor differences with respect to the 0° front-cowling rotation case, as can also be observed in the peak vorticity plot of Figure 7.
Conversely, the peak vorticity of the right vortex decreases by 40% from 0° to 20° (Figure 7). As the nose angle increases, the area uncovered by the front cowling increases and more fluid passes through to the wake directly. As a consequence, the pressure difference between the side of the bobsleigh and the inside of the rear cowling decreases, thus reducing the strength of the right vortex.

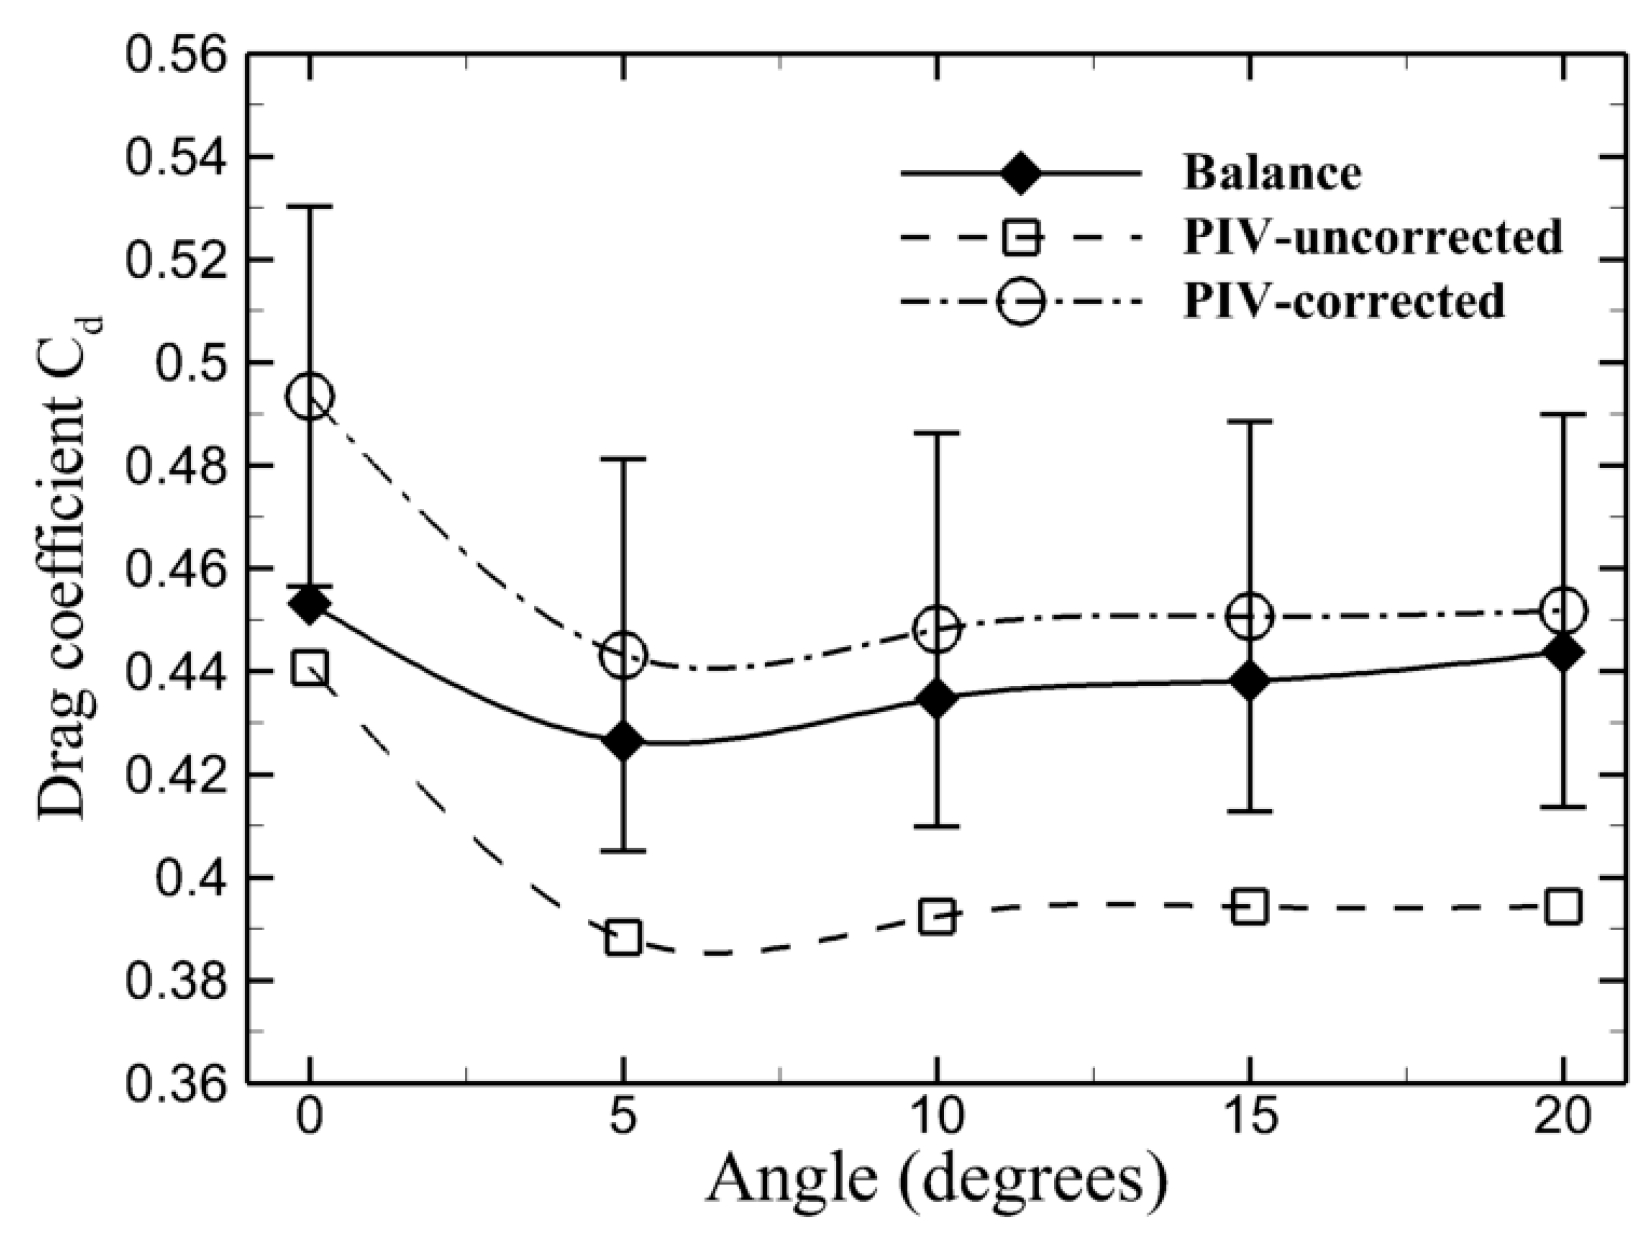
3.3. Aerodynamic Drag

Figure 8 shows the comparison of the drag coefficient obtained from balance measurements and stereoscopic PIV. The latter is obtained from time-averaged results over 500 uncorrelated samples at plane z/D = 2. The drag coefficient is evaluated with a frontal area equal to that of the reference case (0° rotation). For the computation of the momentum deficit from the PIV results, the flow velocity upstream of the model must be known. If this velocity is set equal to the free-stream velocity (20 m/s), the drag coefficient is underestimated by about 10% with respect to the balance measurements (PIV-uncorrected result of Figure 8). However, due to the expansion of the jet at the exit of the test section, the flow velocity in front of the model is lower than the free-stream velocity. Upon applying a correction based on the work of Merker and Wiedemann [13] (PIV-corrected result of Figure 8), a difference of 2% to 3% is observed from the balance. The expanded uncertainty on the PIV drag coefficient is evaluated using the error propagation formula [14] with 95% confidence level. The drag evaluated from PIV agrees with the balance measurements within the uncertainty of the former. The plot of Figure 8 shows that the aerodynamic drag first decreases for front-cowling rotations below 5° and then increases. The initial reduction in aerodynamic drag is due to the fact that from 0° to 5°, a jet flow occurs in the wake due to the fluid passing through the area uncovered by the nose rotation; such jet flow energizes the wake. However, as the angle increases further from 5° to 20°, the increase in frontal area plays a dominant role in lowering the wake velocities and increasing the momentum deficit. This counteracts the advantageous jet-effect within the wake and in turn increases the drag.

4. Conclusions

The mean flow topology of a scaled bobsleigh model was investigated using stereoscopic PIV revealing the formation of two counter rotating vortices in the wake of the model. The comparison of the mean flow topology at two different planes showed that turbulence diffusion plays an important role in broadening the wake and reducing the peak momentum deficit. When the front cowling is rotated with respect to the rear cowling, the strength of the vortex in the direction opposite to the nose rotation decreases. Conversely, the strength of the vortex on the side of the nose rotation remains nearly constant. Finally, a rotation of the front cowling by up to 5° yields a reduction of the aerodynamic drag by approximately 5%. For larger nose rotations, the aerodynamic drag remains approximately constant.

Conflicts of Interest

The authors declare no conflict of interest.

References

  1. Winkler, A.; Pernpeintner, A. Improving the Performance of a Bobsleigh by Aerodynamic Optimization. In The Engineering of Sport 7; Springer: Paris, France, 2008; Volume 2, pp. 329–338. [Google Scholar]
  2. Anderson, J.D., Jr. Fundamentals of Aerodynamics, 4th ed.; McGraw-Hill: New York, NY, USA, 2005. [Google Scholar]
  3. Flay, R.G.J. Bluff Body Aerodynamics. In Advanced Structural Wind Engineering; Tamura, Y., Kareem, A., Eds.; Springer: Tokyo, Japan, 2013; pp. 59–84. [Google Scholar]
  4. Ubbens, H.H.; Dwight, R.P.; Sciacchitano, A.; Timmer, N. Some Results on Bobsleigh Aerodynamics. Procedia Eng. 2016, 147, 92–97. [Google Scholar] [CrossRef]
  5. Winkler, A.; Pernpeintner, A. Automated Aerodynamic Optimization of the Position and Posture of a Bobsleigh. Procedia Eng. 2010, 2, 2399–2405. [Google Scholar] [CrossRef]
  6. Dabnichki, P.; Motallebi, F.; Luck, D. Advanced bobsleigh design. Part 2: Aerodynamic modifications to a two-man bobsleigh. Proc. Inst. Mech. Eng. Part L J. Mater. Des. Appl. 2004, 218, 139–144. [Google Scholar]
  7. Dabnichki, P.; Motallebi, F.; Avital, E. Advanced bobsleigh design. Part 1: Body protection, injury prevention and performance improvement. Proc. Inst. Mech. Eng. Part L J. Mater. Des. Appl. 2004, 218, 129–137. [Google Scholar] [CrossRef]
  8. Ubbens, H.H. Aerodynamic Analysis of Cowling Misalignment on a Two Man Bobsleigh. Master’s Thesis, Delft University of Technology, Faculty of Aerospace Engineering, Delft, The Netherlands, December 2016. [Google Scholar]
  9. Lewis, O. Aerodynamic Analysis of a 2-Man Bobsleigh. Master’s Thesis, Delft University of Technology, Faculty of Aerospace Engineering, Delft, The Netherlands, October 2006. [Google Scholar]
  10. Raffel, M.; Willert, C.E.; Wereley, S.T.; Kompenhans, J. Particle Image Velocimetry—A Practical Guide, 2nd ed.; Springer: Berlin/Heidelberg, Germany; New York, NY, USA, 2007. [Google Scholar]
  11. van Oudheusden, B.W. PIV-based pressure measurement. Meas. Sci. Technol. 2013, 24, 032001. [Google Scholar] [CrossRef]
  12. Alons, H.J. OJF External Balance; Nationaal Lucht en Ruimtevaartlaboritorium (National Aerospace Laboratory NLR): Amsterdam, The Netherlands, 2008. [Google Scholar]
  13. Mercker, E.; Wiedemann, J. On the Correction of Interference Effects in Open Jet Wind Tunnels; Technical Report; SAE Technical Paper; SAE International: Warrendale, PA, USA, 1996. [Google Scholar]
  14. Sciacchitano, A.; Wieneke, B. PIV uncertainty propagation. Meas. Sci. Technol. 2016, 27, 084006. [Google Scholar] [CrossRef]
Figure 1. Setup of the stereoscopic PIV and balance experiments.
Proceedings 02 00319 g001
Figure 2. Time-averaged streamwise velocity component (a) and streamwise vorticity component (b) at plane z/D = 1. One every three vectors is shown both in the x- and in the y-direction.
Proceedings 02 00319 g002
Figure 3. Time-averaged streamwise velocity component (a) and streamwise vorticity component (b) at z/D = 2.
Proceedings 02 00319 g003
Figure 4. Time-averaged streamwise velocity component (a) and streamwise vorticity component (b) at z/D = 2 for no nose rotation.
Proceedings 02 00319 g004
Figure 5. Time-averaged streamwise velocity component (a) and streamwise vorticity component (b) at z/D = 2 for nose rotation of 10°.
Proceedings 02 00319 g005
Figure 6. Time-averaged streamwise velocity component (a) and streamwise vorticity component (b) at z/D = 2 for nose rotation of 20°.
Proceedings 02 00319 g006
Figure 7. Peak vorticity at different angles of rotation of the front cowling.
Proceedings 02 00319 g007
Figure 8. Drag coefficient at different angles of rotation of the front cowling.
Proceedings 02 00319 g008
Publisher’s Note: MDPI stays neutral with regard to jurisdictional claims in published maps and institutional affiliations.

